Global Market Outlook - Excessive pessimism? - Excessive ...

Page created by Leon Harris
 
CONTINUE READING
Global Market Outlook - Excessive pessimism? - Excessive ...
Macro Strategy | 29 February 2020

Global Market Outlook

Excessive
pessimism?

Our baseline 12-month view on equities
and EM bonds remains constructive.
However, the COVID-19 spread outside
China means it is prudent to consider a
range of scenarios.

Within equities, we prefer the US, given
ever-lower bond yields and a supportive
earnings outlook, and Asia ex-Japan given
China’s COVID-19 infection rate appears
to have peaked.

Within bonds, we maintain our preference
for USD-denominated EM bonds given
still-reasonable valuations and room to
benefit if Treasury yields fall further.

Gold remains a preferred route to hedge
against the risk of lower equity prices and
lower bond yields.

This commentary reflects the views of
the Wealth Management Group of
Standard Chartered Bank
Global Market Outlook - Excessive pessimism? - Excessive ...
2   Contents

                            Highlights
                  01        01   Excessive pessimism?

                            Strategy
                  02        03   Investment strategy

                            Perspectives
                  03        08
                            12
                                 Perspectives on key client questions
                                 Macro overview

                            Asset Classes
                  04        13
                            14
                                 Bonds
                                 Equity
                                                                  16
                                                                  17
                                                                        Technical perspective
                                                                        Tracking market diversity
                            15   Foreign exchange

                            Asset Allocation
                  05        18
                            19
                                 Our recommended allocations
                                 Asset allocation summary

                            Performance Review
                  06        20
                            21
                                 Market performance summary
                                 Events calendar
                            22   Wealth management
                            24   Disclosures

    Global Market Outlook                                                                           2
Global Market Outlook - Excessive pessimism? - Excessive ...
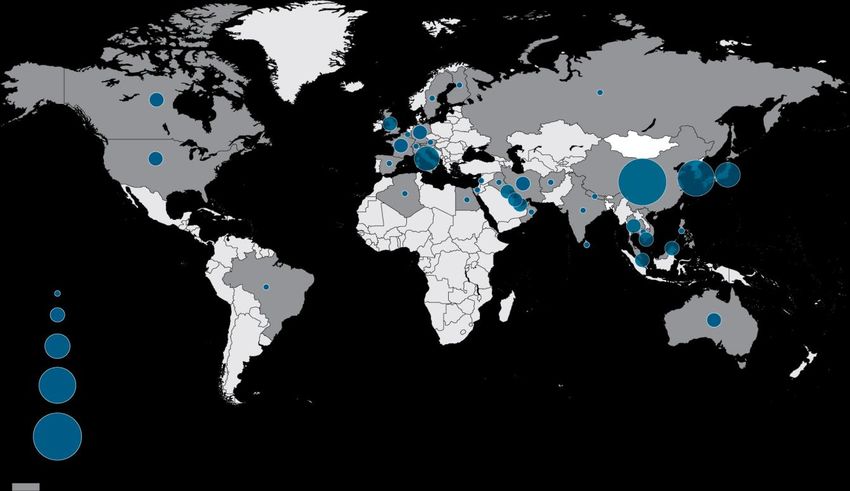
2      Investment strategy

                                   Excessive pessimism?
                                   • Our baseline 12-month view on equities and EM bonds remains constructive. However,
    IMPLICATIONS                       the COVID-19 spread outside China means it is prudent to consider a range of scenarios.
    FOR INVESTORS
                                   • Within equities, we prefer the US, given ever-lower bond yields and a supportive
    • Global equities and multi-
                                       earnings outlook, and Asia ex-Japan given China’s COVID-19 infection rate appears to
      asset income strategies
                                       have peaked.
      likely to outperform bonds
      and cash                     • Within bonds, we maintain our preference for USD-denominated EM bonds given still-
                                       reasonable valuations and room to benefit if Treasury yields fall further. Gold remains a
    • However, stay on watch
                                       preferred route to hedge against the risk of lower equity prices and lower bond yields.
      for risks to this baseline
      scenario from COVID-19
                                   Volatility illustrates value of diversified allocations
      and US politics
                                   As of 27 February, global equities were down -7.5% since the start of 2020 while Corporate
    • Within bonds, we believe     and EM bonds returned 1.1% and 1.7% respectively, as lower US Treasury yields led prices
      USD-denominated              higher. Our global moderate balanced and multi-asset income allocations fell a more
      Emerging Market bonds        modest -3.7% and -4.0% respectively, illustrating the value of balanced allocations.
      remain attractive

    • Within equities, we have a
                                   Virus-related restrictions raise questions over growth recovery
      preference for US and        Until the recent surge in COVID-19 cases outside China, the market consensus was
      Asia ex-Japan                arguably turning more optimistic. January business confidence data showed signs of
                                   rebounding in most major economies and markets were looking for a repeat of a SARS-style
    • Gold remains a good way
                                   V-shaped economic recovery in China after COVID-19. The rise in COVID-19 cases outside
      to hedge risks
                                   China, though, suggests a wider range of scenarios need to be considered:

                                   •    A quick rebound in economic activity after a temporary hit to growth remains one
                                        reasonable scenario. This would be consistent with a buy-the-dip approach to equities
                                        once the current correction shows signs of bottoming.

                                   •    However, a more pessimistic scenario would be one where significant economic and
                                        trade shutdowns are enforced more widely, resulting in more prolonged weakness in
                                        both economic activity and risky asset returns. See page 8 for a more detailed
                                        discussion of the COVID-19 outbreak and its likely investment implications.

    Global Market Outlook                                                                                                          3
Global Market Outlook - Excessive pessimism? - Excessive ...
2
    Fig. 1      COVID-19 cases outside China are accelerating                           Fig. 2    A bottoming of key factors could improve risk appetite

    Number of daily COVID-19 cases reported                                             Factors we are watching to judge how risky assets may evolve
      16,000                                                                    100 0    Factor                                          Current status
      14,000                                                                    900

      12,000
                                                                                800      Pace of new COVID-19 infections in China             
                                                                                                                                              →
                                                                                700
      10,000                                                                    600      Pace of new COVID-19 infections outside China         
        8,000                                                                   500
        6,000                                                                   400      Magnitude of monetary/fiscal policy stimulus          
                                                                                300
        4,000
                                                                                200      Pace of position unwinding                            
        2,000                                                                   100
              0                                                                 0        US Democrat Nomination                                
             23-Jan -20   31-Jan -20   8-Feb-2 0      16-Feb -20   24-Feb -20
                          China                    Outside China (RHS)                   Technicals                                            
    Source: Worldometer, Standard Chartered                                             Source: Bloomberg, Standard Chartered

    Baseline scenario supports equities long-term                                       watching (i) how quickly Chinese economic activity resumes
    From an investor’s perspective, a scenario of a relatively                          and (ii) whether any significant economic shutdowns are
    short-lived impact of the virus to economic growth, followed                        imposed outside China are two key factors to watch closely
    by a rapid recovery boosted by looser monetary and fiscal                           in the coming weeks to validate which of the two scenarios
    policies, would likely support equity market outperformance                         are likely to prevail.
    relative to bonds and cash, short-lived pullbacks
    notwithstanding.                                                                    Gold one way to help balance risks
                                                                                        While equities may benefit from relatively more optimistic
    For now, this remains our baseline scenario, which implies
                                                                                        scenarios, we also prefer gold. Falling bond yields has been
    that the current equity market correction should prove
                                                                                        one key driver of gold since the start of the current rally, an
    temporary and may soon offer an attractive buying
                                                                                        environment which is unlikely to reverse materially. However,
    opportunity. This view is supported by reports that a key
                                                                                        this also means it remains a preferred hedge should one of
    contributor of the current selloff has been position unwinding
                                                                                        our more pessimistic COVID-19 scenarios pan out. This
    by systematic investors (rule-based algorithmic traders, often
                                                                                        leads us to maintain a combined preference for both equities
    cited as a possible cause of amplifying market gains and
                                                                                        and gold simultaneously.
    losses). The rise in progressive candidate Bernie Sanders’
    prospects in the US Democratic nomination process is also                           While our propriety market diversity indicator and positioning
    likely a contributor to a repricing of risks. The significant                       data both show gold may be stretched short term, we would
    number of fiscal stimulus packages announced, or in the                             be comfortable adding on pullbacks. See page 19 for
    pipeline, across Asia, the US and the UK are likely to help                         suggested allocations across various risk buckets.
    lean against growth weakness.
                                                                                        Emerging Market USD bonds in a sweet spot
    Within equities, we maintain our preference for the US. We
                                                                                        Our two preferred USD-denominated EM bond asset classes
    raise our preference for Asia ex-Japan given they have
                                                                                        – EM USD government bonds and Asia USD bonds – have
    already weakened significantly, policymakers are introducing
                                                                                        continued to register positive gains despite the recent sell-off
    significant stimulus measures and the pace of new COVID-
                                                                                        in risky assets.
    19 infections in China is showing early signs of slowing.
                                                                                        To understand why this is the case, it may help to think in
    Within Asia, we remain positive on Chinese equities, raising
                                                                                        terms of the two major drivers of returns. Yield premiums
    our preference to span the onshore market as well given it is
                                                                                        over US government bonds (credit spreads) have
    generally more sensitive to fiscal stimulus. We scale back
                                                                                        undoubtedly risen amid the current risky asset sell-off. On its
    our view on Indian equities to a core holding. While there are
                                                                                        own, this would have lowered bond prices.
    tentative signs of bottoming growth, the case for significant
    equity outperformance remains challenging, in our view.                             However, both EM USD government bonds and Asia USD
                                                                                        bonds have benefited from lower US government bond
    Prolonged virus impact scenario more negative                                       yields (ie. higher bond prices). This has outweighed the
    A scenario that involves a more prolonged, and widespread,                          impact of higher yield premiums. When combined with the
    economic shutdown would be a significant risk to our                                still relatively attractive yield on offer, this has meant the
    baseline scenario. Such an outcome could imply a much                               asset class remains reasonably attractive.
    deeper and longer lasting sell-off in risk assets. In our view,

    Global Market Outlook                                                                                                                                 4
Global Market Outlook - Excessive pessimism? - Excessive ...
2
    Fig. 3                Possible asset class winners under best or worst case COVID-19 scenarios

    Our assessment of asset class winners/losers under various scenarios and our net assessment of which appears more likely

                                                  Quick Recovery                                         Global Pandemic

                                             Global               HY                                  Gold    G3 Govt     USD
                                            equities             Bond                                          Bond

                                 Best case scenario             SCB’s net assessment                                 Worst case scenario

    Source: Standard Chartered Bank

    Our baseline view is for 10-year US government bond yield                            This near-term risk of volatility, though, means we have
    to rebound modestly higher within a 1.25%-1.75% range.                               moved Emerging Market Local Currency Bonds back to a
    However, both the USD-denominated bond asset classes                                 core holding given FX returns and volatility are a key
    stand to benefit even if US bond yields end up moving lower.                         contributor to the asset class’ returns.

    Fig. 4 USD-denominated EM bonds have outperformed YTD,                               Equity sectors – technology, financials
    despite risk aversion, even as DM HY bonds have lagged                               We retain our preference for the technology sector in the US,
    Major bonds asset class – total returns (31-Dec-19=100)                              while also raising the sector to preferred in the Euro area. At
                         103                                                             its heart, we believe the rebound in semiconductor demand
                                                                                         and growth in cloud computing demand are key drivers for
     (31-Dec-19 = 100)

                         102                                                             both. In the US, we recognise the sector appears
        Total return

                                                                                         increasingly fully valued and short-term technicals are
                         101                                                             somewhat stretched. However, we believe a recovery in
                                                                                         earnings and return-on-equity support a preferred view,
                         100
                                                                                         despite any short-term setbacks.

                         99                                                              We also maintain our preference for the financial sector
                          Dec-19         Jan-20        Jan-20        Feb-20              across the US and Euro area. Buybacks and exemptions
                               EM USD       EM LCY          DM HY             Asia USD
                                                                                         from some negative rates in Europe and post-trade deal
    Source: Bloomberg, Standard Chartered                                                investments recovery in the US remain key drivers. In
                                                                                         Europe, increasingly positive signals from regulators on
    Still bearish on the US Dollar long-term                                             potential merger activity could be a new positive.
    One area where our views have not panned out as expected                             In the Euro area, we also maintain our preference for the
    is on the USD. After nearly breaking lower out of its recent                         healthcare sector, noting the importance of global drivers
    range, the bout of risk aversion meant the USD rebounded.                            such as supportive US policies and what appears to be a
    The two long-term drivers – expectations of narrowing bond                           still-significant probability of a second Trump presidency.
    yields relative to other major currencies and a renewed rise                         Finally, in China, we maintain our preference for both
    in Fed liquidity – still argue the case for a weaker USD in the                      consumer staples and consumer discretionary, especially if
    long term. However, in the near term, the dollar is likely to                        further stimulus efforts are forthcoming from the government
    see more volatile range-trading as US political risk comes                           to support demand.
    more sharply into focus and expectations and timing for
    global monetary and fiscal stimulus foster uncertainty.

    Global Market Outlook                                                                                                                             5
Global Market Outlook - Excessive pessimism? - Excessive ...
2
    Fig. 5    Our Tactical Asset Allocation views (12m) USD

        Asset class         Sub-asset class       Relative outlook Rationale (+ Positive factors II – Negative factors)

                            Multi-asset income           ▲          + Contained bond yields, weak USD, diversification || - Equity volatility
                                                                    4-5% yield remains achievable, in our view

        Multi-asset
                            Multi-asset
                            balanced                     ◆          + Equities tilt, diversification benefits || - Equity volatility
                                                                    Equities tilt to help in a late-cycle rally once COVID-19 concerns ebb

        Strategies
                            Alternatives                 ◆          + Diversifier characteristics || - Equity, corporate bond volatility
                                                                    Diversifier characteristics help as risk of volatility rises late cycle

                            US                           ▲          + Share buybacks and corporate margins || - Elevated valuations
                                                                    Elevated valuations supported by margin outlook

                            Asia ex-Japan                ▲          + China stimulus, fair valuations || - COVID-19 risks
                                                                    Recently announced fiscal stimulus and weak USD are positives

                            Euro area                    ◆          + ECB policy support, fair valuations || - Weak domestic demand
                                                                    Easier regulatory environment for banks, COVID-19 is an earnings growth risk

          Equities          UK                           ◆          + Attractive valuations || - UK-EU trade negotiations brinkmanship
                                                                    Political uncertainty has been reduced, but global growth slowdown is a risk

                            Other EM                     ◆          + Modest earnings growth, fair valuations || - Political uncertainty
                                                                    Weak USD would be supportive, but trade, commodity prices are risks

                            Japan                        ▼          + Attractive valuations || - COVID-19 risks
                                                                    Inexpensive valuations, but COVID-19 is an earnings growth risk

                            EM government
                            (USD)                        ▲          + Attractive yields, attractive value || - High interest rate sensitivity
                                                                    Geographical diversification, positive correlation to any further yield fall

                            Asian USD                    ▲          + Attractive yields, reasonable value || - China concentration
                                                                    Low volatility and credit quality positives, but shutdowns pose a risk

                            EM government
                            (local currency)             ◆          + Attractive yields, EM central bank policy || - FX volatility
                                                                    Attractive yields, easing policy are positives, but FX volatility a risk

             Bonds          DM HY corporate              ◆          + Attractive yields, moderate valuation || - credit quality
                                                                    Risk of rising downgrades and defaults, particularly in US energy sector

                            DM IG corporate              ◆          + Moderate value, high credit quality || - Low yields
                                                                    High credit quality and moderate valuations but ratings downgrade is a risk

                            DM IG government             ◆          + High credit quality, hedge for growth slowdown || - Low yields
                                                                    Can be a good hedge against escalation of COVID-19 impact

                            GBP                          ▲          + Long-term valuations supportive || - EU-UK trade talks will be tough
                                                                    PM Johnson’s parliamentary mandate supports positive trade talk outcome

                            EUR                          ◆          + Carry trade reversal; fiscal stimulus || - global trade; political stress
                                                                    Reliance of global growth limits upside near term

                            CNY                          ◆          + Currency management; fiscal stimulus || - COVID-19 recovery timing
                                                                    COVID-19 peaking could trigger large stimulus; financial stability key aim

                            AUD                          ◆          + China stimulus; domestic housing || - Weak AUD trend; RBA may cut
                                                                    RBA on hold but ready to cut; Size of China and local stimulus could support
        Currencies
                            JPY                          ◆          + Safe-haven inflows and currency hedging || - Need for yield offshore
                                                                    Bouts of risk-on and -off impact; BoJ policy easing room appears limited

                                                                    + Carry trade and safe-haven || - Rate cut(s), election risk and outflows
                            USD                          ▼          Risk-off may support foreign demand for safe US assets, but these are richly
                                                                    priced and could soon be considered “less-safe” on US political uncertainty

    Source: Standard Chartered Global Investment Committee
    Legend:   ▲ Preferred ◆ Core holding ▼ Less preferred

    Global Market Outlook                                                                                                                          6
Global Market Outlook - Excessive pessimism? - Excessive ...
4       Investment Views Map
    As part of our Investment Philosophy, we strive to achieve diversity of insights by constantly monitoring a wide array of
    investment views and analysis. This part of our process is what we call the “Inside View”, where we gather lots of research and
    analysis, consider the specifics of the situation, and combine them to our analysis of historical probabilities - the “Outside
    View” - to create scenarios for the future. The charts below bucket these views according to their stance (UW/N/OW) and are,
    in our opinion, a good representation of the markets. The red circles indicate our own stance. For more details on how we
    integrate these insights into our analysis, we invite our readers to read the rest of the document.

    Fig. 6    Cash                                                                         Fig. 7     Equities

      80%                                                                                     80%

      60%                                                                                     60%

      40%                                                                                     40%

      20%                                                                                     20%

        0%                                                                                     0%

                         OW                     N                    UW                                         OW                N                 UW

    Source: Standard Chartered Global Investment Committee                                 Source: Standard Chartered Global Investment Committee

    Fig. 8    Rates/duration                                                               Fig. 9     Alternatives*

      80%                                                                                    80%

      60%                                                                                    60%

      40%                                                                                    40%

      20%                                                                                    20%

       0%                                                                                      0%

                         OW                     N                    UW                                         OW                N                 UW

    Source: Standard Chartered Global Investment Committee                                 Source: Standard Chartered Global Investment Committee

    Fig. 10 Credit                                                                         Fig. 11 Commodities (Gold)

      80%                                                                                    90%
                                                                                             75%
      60%
                                                                                             60%

      40%                                                                                    45%
                                                                                             30%
      20%
                                                                                             15%

       0%                                                                                      0%

                         OW                     N                    UW                                         OW                N                 UW

    Source: Standard Chartered Global Investment Committee                                 Source: Standard Chartered Global Investment Committee

    The latest dots represent 3rd parties’ investment views going into the month of February
    Red circle: Standard Chartered Global Investment Committee (GIC) investment view
    *Alternatives represent a combination of views on liquid and private alternative strategies, as well as real estate
    **Commodities represent views on gold

    Global Market Outlook                                                                                                                                7
Global Market Outlook - Excessive pessimism? - Excessive ...
3       Perspectives on key client questions
         What are the implications from the spread of Covid-19 onto
    the world economy and asset classes over the next 12 months?
    The spread of Covid-19 has gathered pace outside of China in recent weeks,
    particularly after a jump in cases in South Korea and Italy. Meanwhile data shows
    that newly reported daily cases in China have slowed down. Fears of global
    contagion have sent risky assets lower and safe-havens (i.e. gold and US
    Treasuries) higher.

    Downside risks clearly point to potentially extended disruptions to global supply
    chains, while on the upside, fiscal and monetary responses may cushion the shock
    to global growth. Upcoming economic data releases will shed more light on the
    impact of the virus. In the near term, however, uncertainty remains high.

    While we take the potential short-term downside risks seriously, our Global
    Investment Committee’s 12-month outlook remains constructive. We continue to
    prefer equities over bonds, albeit our view on sovereign bonds has improved
    marginally as yields may take longer before rebounding. Gold remains our
    preferred hedge against the more pessimistic global pandemic scenario.

    Fig. 12 Markets tend to disregard epidemic outbreaks in the long-run

    MSCI All Country Wolrd Index and respective 12-month forward P/E ratio

      700                                                                                            30
                           Avian Flu        Cholera     MERS              Yellow
             SARS           (H5N1)           (Haiti)     CoV      Zika     fever       COVID-19
      600
                                                                                                     25

      500                         Swine Flu
                                   (H1N1)
                                                                                                     20
      400
                                                                                                     15
      300

                                                                                                     10
      200                     Pandemic                       Ebola                     Cholera
                                                          (West Africa)                (Yemen)
                              Epidemic
      100                                                                                             5
        Feb-02                Aug-06                   Feb-11             Aug-15                 Feb-20
                                12m Fwd PE                       MSCI AC World price

    Source: Refinitiv, Standard Chartered

    How does the novel coronavirus compare to the regular flu and other similar viruses?
    Covid-19 has killed more than 2,700 people so far. In comparison, the common flu kills an estimated 300,000-650,000 people
    worldwide annually (source: US Center for Disease Control and Prevention). In Europe, evidence from the past eight
    outbreaks shows that it takes approximately 4-13 weeks to reach peak infection rate, while the epidemic generally last 19-25
    weeks.

    The recent Covid-19 outbreak has necessitated a strong response from the Chinese government due to its faster infection rate
    vis-à-vis the common flu and previous epidemics. This has led to widespread containment efforts and longer quarantine
    periods. Covid-19 appears to have a lower fatality rate (2%) than SARS (10%), but a much higher than the H1N1 Swine Flu
    and the common flu virus. Additionally, only around 20% of infected people become severely ill, with the rest only exhibiting
    milder symptoms.

    Global Market Outlook                                                                                                      8
Global Market Outlook - Excessive pessimism? - Excessive ...
2
    What are potential scenarios for the coming months?              Risk scenario A: Prolonged disruption followed by a V-
    It is difficult to precisely estimate the impact of the virus;   shaped recovery. A more prolonged (and widespread)
    therefore, we look at some potential scenarios, for an answer    economic shutdown would imply a deeper sell-off in risk
    to these key questions: 1) How long will the economic impact     assets. This scenario is good for gold, US Treasuries and
    last? 2) How quick will the recovery be? 3) What would be        the USD.
    the impact to financial markets?                                 The response of countries outside China is important. The
    Base scenario: V-shaped recovery starting in Q2. In the          World Health Organisation (WHO) has recently demanded
    more benign scenario, we would see the viral outbreak being      even more urgency in the fight against this virus. In China, it
    largely contained within Q1 2020 followed by a V-shaped          took roughly 2-3 weeks for quarantining efforts to result in a
    recovery.                                                        peak in daily new cases. While other countries have had
                                                                     more time to prepare for a potential outbreak than China,
    Policymakers have already started to support growth via          they may struggle to quarantine their citizens on a similar
    targeted monetary easing and fiscal stimulus, particularly in    scale, which means there is a chance that a global outbreak
    regions most affected by trade and supply-chain links with       may take longer to contain. This could ultimately impact
    China. Corporate earnings calls in the US suggest that while     global supply chains and hurt the demand side of goods and
    some individual companies reported supply-chain problems,        services as well.
    rising bottlenecks is not an industry-wide phenomena (for
    now). Additionally, surveys of Small-Medium Enterprises
                                                                     Fig. 14 China’s credit impulse can benefit the global economy
    (SMEs) in China indicate that these firms have enough
    surplus cash to keep operations going for another 3-4            Chart of China credit impulse and OECD Leading Indicator Index
                                                                     lagged by 3 quarters
    months on average. Lastly, high-frequency data (e.g. traffic
                                                                                               104                                                                 45
    congestion, electricity consumption) in major Chinese cities

                                                                                                                                                                        China Credit Impulse Index
                                                                      OECD Leading Indicator

                                                                                                                                                                   40
    has started showing signs of a recovery – albeit gradually.
                                                                                               102                                                                 35
    Such a scenario would suggest that the current equity                                                                                                          30
                                                                                               100
    market sell-off could be short-lived with both Developed and                                                                                                   25
    Emerging Markets stabilising before resuming their recovery.                                                                                                   20
                                                                                               98
    In this case, equities would outperform bonds, while the USD                                                                                                   15
    may peak and finally head lower; yield curves would begin                                  96                                                              10
    steepening again and commodity-linked assets would likely                                   Aug-07      Feb-10      Aug-12     Feb-15    Aug-17       Feb-20
                                                                                                         OECD LEI Index (3q lag)            China Credit Impulse
    recover.
                                                                     Source: Bloomberg, Standard Chartered
    Fig. 13 Asian countries are more dependent on China

    Select MSCI country indexes percent of revenues from China       A stronger stimulus by China could mitigate this outcome,
                                25%                                  although its willingness to stimulate the economy may be
      % of revenue from China

                                                                     reduced given already high debt levels in the country.
                                20%
                                                                     China’s stimulus has historically led economic activity
                                15%
                                                                     worldwide; in this scenario, a global co-ordinated monetary
                                10%                                  and fiscal boost may ultimately result in a rapid recovery,
                                                                     despite the prolonged impact to economic activity.
                                5%

                                0%                                   Risk scenario B: Prolonged disruption with subsequent
                                                                     U-shaped (slow) recovery. The most pessimistic global
                                                                     pandemic scenario would see global growth more severely
                                                                     impacted, followed by an extended and weak recovery
    Source: Factset, Standard Chartered
                                                                     period (U-shape) due to inadequate or ineffective counter
                                                                     measures.

    Global Market Outlook                                                                                                                                                                            9
Global Market Outlook - Excessive pessimism? - Excessive ...
2
    This is a scenario in which safe-havens such as gold and US                    Lastly, under this more pessimistic scenario, the construction
    Treasuries (at first) would outperform while equities and                      and the manufacturing sectors in China would be disrupted
    corporate bonds would sell off sharply.                                        due to their high reliance on migrant workers. Retailers
                                                                                   would also be impacted by weak demand as consumers stay
    The weakness in industrial activity in countries such as
                                                                                   home and cut spending.
    Germany and Italy, even before reports of the viral outbreak,
    adds to these risks. In Italy, northern regions are being                      However, after careful consideration of these scenarios, our
    placed under quarantine to contain the largest virus cluster                   base case would see global efforts result in containment of
    outside of Asia. These regions account for nearly 50% of                       the virus by end of Q1. We expect a rapid recovery to ensue
    Italy’s GDP, increasing the likelihood of another recession.                   as stimulus measures start filtering through the global
                                                                                   economy. High-frequency data indicates that China is
    For the US, dependence on China and Asia for intermediary
                                                                                   already showing signs of increased activity; while at least 16
    goods, suggests that supply chain disruptions may weigh
                                                                                   provinces lowered their threat level. Policymakers efforts
    significantly on its activity.
                                                                                   would cushion the disruption to supply chains, and thus allow
    As disruption continues into the second half of the year,                      the recent nascent recovery in Europe and Emerging
    global growth would likely take longer to rebound (U-shaped                    Markets to resume its path.
    recovery). The extended disruption would increase the risk of
    damage to corporate profitability and a rise in corporate
    credit risks pushing markets mood into a negative feedback
    loop.

    Fig. 15 Taking clues from Chinese indexes performance – the country hardest hit by the virus – we may be approaching key
    trough levels. As previous epidemics have shown reaching peak daily new cases usually results in a turning point in performance

    Select countries data as of 27-Feb-2020 with related economic and market performance data
                                               Total                                              Drawdown
                         % of world        reported       Daily new          2020 equity          (from 2020         Recovery from         MSCI Index
     Country             GDP (PPP)1           cases      cases peak3        market peak2        market peak)4               trough         (in USD)
     Asia ex. Japan          30.0+%                                              17-01-20                 -8.4%                  0.0%      Asia ex. Japan

                                                                                 13-01-20                 -9.6%                  3.1%      China offshore
     China                    19.30%          78,818       04-02-20
                                                                                 20-01-20                -13.4%                 12.1%      China onshore

     South Korea               1.60%           1,766            ?                20-01-20                -13.5%                 0.0%       South Korea

     Japan                     4.10%             214            ?                03-01-20                 -9.4%                  0.0%      Japan

     Eurozone*                16.05%             765                             19-02-20                 -9.4%                  0.0%      EMU
     Germany*                  3.10%               48           ?                19-02-20                -10.3%                  0.0%      Germany
     France*                   2.20%               38           ?                19-02-20                 -9.7%                  0.0%      France
     Italy*                    1.70%             655            ?                19-02-20                 -9.9%                  0.0%      Italy

     UK                        2.20%               16           ?                02-01-20                -12.9%                  0.0%      UK

     US                       15.10%               60           ?                19-02-20                -12.1%                  0.0%      US
                      Source: IMF, WHO, MSCI, Bloomberg, Standard Chartered
                      1 Proportion of real GDP to the rest of the world adjusted for inflation
                      2 Date of Year-To-Date (YTD) market high
                      3 Date of peak for daily new reported cases (12-Feb China’s cases saw a spike due to a change in the classification of the virus) but new cases had started
                      slowing before then
                      4 Percent decrease from date of market high to the most recent market low
                      * Eurozone Indices performance in Euro

    Global Market Outlook                                                                                                                                      10
2
    Fig. 16 Geographic distribution of COVID-19 cases in Asia

                                                               Russia

                                                           China
                                                                                         Republic of Korea
                                                                                                    Japan

                         Afghanistan                                                                         COVID-19 cases
                                          Nepal                                                                     0–9

                                                                                                                    10 – 99
                                       India
                                                                                                                    100 – 999

                                                              Thailand                                              1,000 – 9,999
                                                                                    Philippines
                                                                   Cambodia
                                                                                                                    ≥ 1,000
                                               Sri Lanka                  Vietnam
                                                                                                                    Areas with cases
                                                                         Malaysia
                                                                                                                    Countries reporting cases
                                                                   Singapore

    Source: European Centre for Disease Prevention and Control (ECDC), Standard Chartered

    Fig. 17 Geographic distribution of COVID-19 cases worldwide, as of 26 February 2020

             COVID-19 cases
             Total

              Countries reporting cases
    Source: European Centre for Disease Prevention and Control (ECDC), Standard Chartered

    Global Market Outlook                                                                                                                       11
4      Macro Overview – at a glance
                  Key themes

    Our Global Investment Committee will closely monitor developments around the coronavirus, but we expect the epidemic to
    moderately impact global growth in 2020, with most of the slowdown expected in H1. Under our core scenario, China is likely
    to recover most of the lost output when activity returns to normal in H2, helped by further monetary and fiscal stimulus and
    easing trade tensions. US and Euro area growth is likely to keep slowing to somewhat below their long-term trend, with
    increasingly accommodative fiscal and monetary policies providing significant support. The main risk to this outlook is political
    uncertainty ahead of the US presidential election and/or an acceleration in spread of the virus.

                                               Fig. 18 Easy fiscal and monetary policies are likely to help offset the impact of coronavirus
                  Key chart                    US fiscal deficit; China’s consensus budget deficit estimates for 2020 and PBoC’s Loan Prime Rate
                                                                                 4.0                                                                       -4.0                                                               4.30
                                                                                                                                                           -4.1
                                                 % of GDP - US fiscal deficit

    Continued fiscal stimulus and                                                2.0                                                                                                                                          4.25
                                                                                                                                                           -4.2
                                                                                 0.0                                                                                                                                          4.20
    accommodative monetary policy in                                                                                                                       -4.3
                                                                                 -2.0                                                                      -4.4                                                               4.15
    the US and further monetary and
                                                                                                                                                       %

                                                                                                                                                                                                                                     %
                                                                                 -4.0                                                                      -4.5                                                               4.10
    fiscal policy easing in China                                                                                                                          -4.6
                                                                                 -6.0                                                                                                                                         4.05
    support our constructive outlook for                                                                                                                   -4.7
                                                                                 -8.0                                                                                                                                         4.00
                                                                                                                                                           -4.8
    global economies in H2 2020                                                 -10.0                                                                      -4.9                                                               3.95
                                                                                -12.0                                                                         Aug-19            Oct-19             Dec-19            Feb-20
                                                                                    Feb-00   Jun-03   Oct-06   Feb-10       Jun-13   Oct-16   Feb-20               2020 budget deficit estimates            Loan prime rate (RHS)

                                               Source: Bloomberg, Standard Chartered

                  US              Easier financial conditions following Fed’s rate cuts last year and ongoing fiscal spending should stabilise growth
                                  just below long-term trend; strong job market will sustain consumption; We expect 1-2 Fed rate cuts in 2020
                                      ○ Growth                                                           ◐ Inflation                               ○ Benchmark rates                               ◐ Fiscal deficit
                                                                                                                        

                                                                                                                        

           Euro area              Increasingly accommodative monetary policy, backed by below-target inflation, should support growth just below
                                  long-term trend; German fiscal easing is a potential game-changer for growth; spread of coronavirus is a risk
                                      ○ Growth                                                           ◐ Inflation                               ○ Benchmark rates                               ● Fiscal deficit
                                                                                                                                                                                                                

                                                                                                                                                                                                                

              China               We expect growth to recover from the impact of coronavirus by H2, aided by significant fiscal and monetary
                                  easing; partial US trade deal is a tailwind; PBoC likely to overlook temporary food price inflation in easing policy
                                      ○ Growth                                                           ● Inflation                               ○ Benchmark rates                               ● Fiscal deficit

              Japan               Growth outlook under increasing pressure from the impact of coronavirus on exports and tourism; Summer
                                  Olympics has potential to revive activity in H2; BoJ under increasing pressure to ease further as growth falters
                                      ○ Growth                                                           ◐ Inflation                               ○ Benchmark rates                               ● Fiscal deficit

                  UK              Growth outlook clouded by uncertainty around a trade deal with the EU; Proposed fiscal stimulus could potentially
                                  revive business confidence; BoE on hold for now, but likely biased towards easing amid trade, global growth risks
                                      ○ Growth                                                           ◐ Inflation                               ◐ Benchmark rates                               ● Fiscal deficit

       Emerging Markets           Slowing global trade, weak commodity prices and impact of coronavirus likely to cloud Emerging Market growth
          ex-China                outlook; lower oil prices likely to keep inflation in check, enabling easier monetary policies
                                      ○ Growth                                                           ◐ Inflation                               ○ Benchmark rates                               ● Fiscal deficit

    Source: Standard Chartered Global Investment Committee
    Legend:   ○   Deceleration in 2020 |   ◐   Neutral |                                 ●   Acceleration in 2020

    Global Market Outlook                                                                                                                                                                                                            12
Bonds | Equity | FX

5                      Bonds – at a glance
                            Key themes

    Bonds are a core holding as we view them as a hedge against greater downside risks. Our expectation of further Fed rate cuts
    and slower global growth means that yields could sustain around current levels.

    We continue to prefer EM USD government and Asian USD bonds, owing to reasonable valuations and relative
    imperviousness to virus concerns. Risk of higher near-term currency volatility leads us to downgrade EM local currency bonds
    to a core holding. We hedge our exposure to risky assets and EM bonds by upgrading DM IG government and corporate
    bonds to a core holding, as they could buffer the overall investment allocation, should virus-related growth concerns intensify.

                                                         Fig. 19 EM USD government and Asian USD bonds offer the best balance of attractive yields,
                            Key chart                    reasonable valuations, stable credit quality and risk (volatility), in our opinion

                                                                        8.0
                                                                                                                                             DM HY corporates
     EM USD government and Asian
                                                                        6.0
    USD bonds still offer best risk-                                                                                                 EM USD sov ereigns
                                                           Yields (%)

    reward in our assessment. Risk of                                                            Asia
                                                                                                                                                                          EM LC sov ereigns
                                                                        4.0                      credit
    rising defaults temper our
                                                                                                                                     DM IG corporates*
    enthusiasm for DM HY bonds.                                         2.0
                                                                                                                                                                 DM IG sov ereigns*

                                                                        0.0
                                                                              0.0            1.0                 2.0                 3.0               4.0                 5.0                6.0
                                                                                                                             30d volatility (%)
                                                         *Yields as of 31 January 2020. Source: Bloomberg, Standard Chartered. As of 28 February 2020.

                              EM USD                 Emerging Market (EM) USD government bonds are preferred owing to geographical diversification, the
                             government              attractive yield and reasonable valuations. A sharp rebound in Treasury yields is a risk for EM bonds.
                        ▽         ◇       ▲          ▲● Macro factors                                         ◐ Valuation vs govt bonds                      ● Rates policy
                                                                                                                                 

                                                                                                                                 

                                 Asia                We view Asia USD bonds as a preferred holding given their relatively high credit quality, defensive nature
                                 USD                 and low sensitivity to virus impact. A sharper than expected growth slowdown in China is a risk.
                        ▽         ◇       ▲             ● Macro factors                                       ◐ Valuation vs govt bonds                      ● Rates policy
                                                                                                                                                                              

                                                                                                                                                                              

                               DM HY                 DM High Yield bonds are a core holding as their attractive yield, reasonable valuations and low interest
    Preference order

                              corporate              rate sensitivity are balanced by the risk of rising defaults, especially in the Energy sector.
                        ▽         ◆       △             ● Attractive yield                                    ◐ Valuation vs govt bonds                      ○ Credit fundamentals

                               EM local              Expectation of higher FX volatility leads us to reduce EM local currency bonds to a core holding, despite
                               currency              attractive yield and supportive central bank policies. Higher volatility due to currency fluctuations is a risk.
                        ▽         ◆       △             ◐ FX Outlook                                          ● Macro factors                                ◐ Rates policy
                                                                                                                                 

                                                                                                                                 

                               DM IG                 We view the asset class as a core holding. The high credit quality, moderate valuations and defensive
                              corporate              characteristics are balanced by low yield, high interest rate sensitivity and increasing corporate leverage.
                        ▽         ◆       △          △◐ Valuation vs govt bonds                               ○ Credit fundamentals                          ◐ Macro factors
                                                                                                                                                                              

                                                                                                                                                                              

                               DM IG                 DM Investment Grade government bonds are a core holding. Despite the low yield (
Bonds | Equity | FX

6                      Equity – at a glance
                            Key themes

    The outlook for global equities is less certain compared to the start of 2020 due to the spread of COVID-19 beyond China.
    Nevertheless, swift responses from policymakers should underpin mid-single-digit earnings growth this year. Equities remain a
    preferred asset class, driven by falling bond yields, which are increasing the attractiveness of equities on a relative basis.

    US equities are preferred. Companies in the travel, leisure and payment processing industries have trimmed Q1 earnings
    guidance, but remain upbeat that there will be a recovery over the remainder of the year as consumer spending rebounds.
    Asia ex-Japan is upgraded to preferred. Significant policy easing across the region increases the probability of a rebound in
    growth and earnings after a sharp Q1 slowdown related to COVID-19. A weaker USD is also supportive of a pick-up in fund
    inflows to the region. Euro area equities are reduced to a core holding on concern over the impact of the spread of COVID-19.

                                                     Fig. 20 Global equities remain attractive relative to bonds following drop in US Treasury yields
                            Key chart                MSCI All Country World index dividend yield less the 10-year US government bond yield

            The yield gap compares the                        2.5                Equities cheap
            markets dividend yield to the                     2.0

            bond yield.                                       1.5
                                                              1.0
                                                          %

            Global dividend yields have                       0.5
                                                              0.0
            increased and global bond                                                                                           Equities expensive
                                                              -0.5
            yields have fallen, making                        -1.0
            equities more attractive /                        -1.5
                                                                 Jan-09            Dec-10               Oct-12              Aug-14            Jun-16           Apr-18       Feb-20
            cheaper relative to bonds.                                                                           Global Yield Gap          Mean

                                                     Source: MSCI, Bloomberg, Standard Chartered. As of 28 February 2020.

                                 US                  US equities are preferred. Low bond yields keep the cost of debt low, providing cheap funding for share
                               equities              buybacks and investment. Earnings are expected to recover after the CODIV-19 related 1Q dip.
                        ▽         ◇       ▲          ▲● Bond yields                                     ● Earnings                                     ● Economic data
                                                                                                                            

                                                                                                                            

                            Asia ex-Japan            Asia ex-Japan is upgraded to preferred holding. Easier fiscal policy across the region should limit the
                               equities
                        ▽         ◇       ▲
                                                     downside risk from COVID-19. A weaker USD increases the probability of a pick-up in fund flows into the
                                                     region. China, onshore and offshore is our most preferred market.

                              Euro area              Euro area equities are reduced to core holding. An improved regulatory environment for banks and fiscal
                               equities
    Preference order

                                                     stimulus remain catalysts, but uncertainty relating to COVID-19 risks diluting their impact.
                        ▽         ◆       △          △● Bond yields                                     ● Valuations                                   ● Fund flows
                                                                                                                                                                        

                                 UK                  UK is a core holding. Dividends and valuations are attractive relative to peers. Low bond yields and prior
                               equities              underperformance signal the potential for a recovery in fund flows as political uncertainty is reduced.
                        ▽         ◆       △              ● Valuations                                   ◐ Bond yields                                  ◐ Fund flows
                                                                                                                            

                                                                                                                            

                             EM ex-Asia              EM ex-Asia is a core holding. Valuations are attractive relative to history and peers. Earnings growth in
                              equities               2020 is forecast to be 15%. Lower bond yields will lower the cost of debt funding for corporates.
                        ▽         ◆       △              ● Valuations                                   ◐ Bond yields                                  ◐ Earnings
                                                                                                                                                                        

                                                                                                                                                                        

                                Japan                Japan is less preferred. While valuations are attractive relative to history, the risks to global growth are
                               equities              likely to be felt swiftly in Japan and policy makers have limited fiscal room to manoeuvre.
                        ▼         ◇       △              ● Valuations                                   ◐ Bond yields                                  ○ Economic data

    Source: Standard Chartered
    Legend:             ▲   Most preferred |   ▼   Less preferred |       ◆ Core holding    |   ○ Not supportive    |   ◐   Neutral |   ● Supportive   |   ▭   Key driver

    Global Market Outlook                                                                                                                                                            14
Bonds | Equity | FX

9      FX – at a glance
                  Key themes

    Fear of a deeper global economic impact from the Covid-19 outbreak has triggered heightened risk aversion. Our expectation
    of global growth supporting a broad-based USD downtrend may be delayed if virus containment fails. EUR/USD is expected to
    push higher to 1.12 in H2 2020. The undervalued GBP should strengthen towards 1.38 with expected fiscal stimulus and hard-
    fought UK-EU trade progress.

    Near-term, we expect more range-trading FX markets with rising volatility. Safe-haven and yield seeking investors could yet
    see the USD at new trend highs. However, rising US political uncertainty and heightened expectations of Fed rate cuts could
    weigh on the dollar, as could the unwinding of significant “long USD carry trades” against the EUR and JPY.

                                                  Fig. 21 Rising USD and Gold suggest risk                           Fig. 22 The USD rose despite rising dollar
                  Key chart                       aversion                                                           liquidity
                                                  Gold, USD index (DXY) (RHS)                                        USD index (DXY), USD monetary base (RHS)
                                                   1,700                                             106                          105                                              -20
    The USD and gold have rallied                  1,600                                             103                          100                                              -10
    simultaneously in January. This is                                                               100                          95                                               0
                                                                                                                      DXY index
                                                   1,500

                                                                                                                                                                                          %. inv
                                                  USD/oz

                                                                                                             Index

    unusual and demonstrates rising                                                                  97                           90                                               10
                                                   1,400
    risk aversion. Despite rising global                                                             94                           85                                               20
                                                   1,300
    USD liquidity, the USD has not yet                                                               91                           80                                               30
    declined as expected.                          1,200                                             88                           75                                              40
                                                   1,100                                          85                               Jan-14         Feb-16       Mar-18        Apr-20
                                                       Jan-17             Aug-18             Mar-20                                     DXY                USD monetary base, y/y (RHS)
                                                                 Gold                  DXY (RHS)

                                                 Source: Bloomberg, Standard Chartered                               Source: Bloomberg, Standard Chartered

          USD (DXY)
                                     Safe-haven and yield-seeking flows have supported the USD carry trade; US political uncertainty may limit gains

      ▼       ◇         △            ▲◐ Flows and Sentiment                         ◐ Relative growth rates                                   ○ Relative interest rates
                                                                                                         

                                                                                                         

           EUR/USD
                                     Political uncertainty in Germany, Ireland and Italy may delay fiscal stimulus; global growth rebound would support
      ▽       ◆          △              ● Relative interest rates                   ◐ Relative growth rates                                   ◐ Flows & sentiment
                                                                                                                                                                    

                                                                                                                                                                    

           GBP/USD
                                     Optimistic UK-EU trade deal strategy could support outperformance of undervalued UK assets and the GBP
      ▽       ◇          ▲              ● Flows and sentiment                       ● Relative interest rates                                 ◐ Relative growth rates

           USD/CNY
                                     Expected broad monetary and fiscal stimulus, firm currency management to stabilise growth and asset markets
      ▽       ◆          △              ◐ Relative interest rates                   ◐ Flows and sentiment                                     ◐ Relative growth rates
                                                                                                         

                                                                                                         

           USD/JPY
                                     The JPY will likely be caught between bouts of safe-haven inflows and Japanese investors’ return-seeking outflows
      ▽       ◆          △              ○ Relative interest rates                   ◐ Relative growth rates                                   ◐ Flows & sentiment
                                                                                                                                                                    

                                                                                                                                                                    

           AUD/USD
                                     Signs of domestic recovery and stable monetary policy, but AUD is dependent upon a Chinese economic recovery
      ▽       ◆          △              ◐ Relative interest rates                   ◐ Relative growth rates                                   ◐ Flows & sentiment

    Source: Standard Chartered
    Legend:   ▲   Bullish view   |    ▼   Bearish view |   ◆ Range view   |   ○ Not supportive   |   ◐   Neutral |       ● Supportive         |    ▭   Key driver

    Global Market Outlook                                                                                                                                                                   15
10 Technical perspectives
   EUR/USD: Deeply oversold                                          Fig. 23 EUR/USD: Deeply oversold

   Developments on the daily and weekly charts indicate that         EUR/USD, weekly chart with the 14-week Relative Strength Index
   EUR/USD is deeply oversold and could stage a minor                            1.26
   rebound in the near term. On the weekly charts, there is a                    1.23
   positive momentum divergence of the 14-week Relative                          1.20

                                                                       EUR/USD
   Strength Index (RSI) and the price. This comes as EUR/USD                     1.17
   tests fairly strong support (on daily charts, not shown) on the
                                                                                 1.14
   lower edge of a declining channel. Furthermore, the 14-day
                                                                                 1.11
   RSI fell to 21 - on the previous three occasions when the 14-
                                                                                 1.08
   day RSI was 21 or below (in 2018, 2016 and 2015),
                                                                                 1.05
   EUR/USD was higher in subsequent weeks. On the upside,                           Jan-18     Jun-18     Nov-18     Apr-19      Sep-19     Feb-20
   EUR/USD faces strong resistance on the 200-day moving                          90
   average (DMA; now at 1.1100), slightly below the upper              RSI        60
   edge of the channel. The single currency would need to rise                    30
   above this long-term average for the medium-term                                0
   downward pressure to fade.                                                      Jan-18      Jun-18     Nov-18     Apr-19      Sep-19     Feb-20

                                                                     Source: Bloomberg, Standard Chartered
   S&P 500: A short-term pause
   The S&P 500 index’s break below the lower edge of a rising        Fig. 24 S&P 500 index: A short-term pause
   channel from October, coinciding with a fall below the end-
                                                                     S&P 500 index, daily chart with the 200-day moving average
   January low of 3215 and the 200-day moving average
                                                                                  3,400
   confirms that the short-term upward pressure has eased.
                                                                                  3,250
   This follows a negative divergence of the 14-day and the 14-
                                                                                  3,100
   week RSI (not shown) indicating fatigue following the strong                   2,950
                                                                       Index

   rally in recent months. The index has immediate support at                     2,800
   2870 (the 50% retracement of the December 2018- February                       2,650
   2020 rise; 2.8% from Friday’s close), followed by the mid-                     2,500
   2019 low of 2729 (7.6%). We view this week’s retreat as a                      2,350
                                                                                  2,200
   short-term pause. Indeed, the medium-, to long-term trend
                                                                                      Sep-18    Jan-19    Apr-19     Jul-19    Nov-19     Feb-20
   remains up while the index holds above the 200-week                                           S&P500 index                    200DMA

   moving average (at about 2632; 10.9% from Friday’s close)         Source: Refinitiv Eikon, Standard Chartered
   – the last time the index was below this support was in 2011.

                                                                     Fig. 25 Gold: Capped for now
   Gold: Capped for now
                                                                     XAU/USD, daily chart with the 200-day moving average
   Gold is attempting to break below the lower edge of the
                                                                                 1,750
   channel. Such a break would indicate an extended pause in
   the short term given the yellow metal has been overbought                     1,650
   on the daily and weekly charts. Immediate support is at the
                                                                       USD/Oz

                                                                                 1,550
   early-February low of 1547 (2.4% below Friday’s close)
   followed by the 200-DMA (now at 1482; 6.5% below Friday’s                     1,450
   close). Strong support is at the November low of 1445
                                                                                 1,350
   (8.8%). Gold’s medium-term trend remains up while it holds
   above 1445.                                                                   1,250
                                                                                     Jun-19      Aug-19         Oct-19        Dec-19       Feb-20
                                                                                                   Gold                        200DMA

                                                                     Source: Refinitiv Eikon, Standard Chartered

   Global Market Outlook                                                                                                                             16
13 Tracking market diversity
   Where has diversity been falling or rising?                         Fig. 26 Asset with low and high market diversity

   Investors preference has clearly shifted towards defensive                                                                           Direction
   assets this month as concerns mount on wider-than-                                                                                     since
   expected economic impact of COVID-19. Following recent              Level 1                                          Diversity       Oct 2019

                                                                                                                           ◐
   rise in market volatility, our market diversity indicator signals   FTSE World Broad IG Bond
                                                                       ex-MBS Index
                                                                                                                                           →
   an improving liquidity conditions across major equity markets
   except UK, and a narrowing liquidity conditions in defensive        MSCI All Country World Index                        ●               
   assets such as Gold and dollar-denominated bonds.                   Gold Spot                                           ○               
   For dollar-denominated bonds such as Developed Market               HFRX Global Hedge Fund Index                        ◐               →
   credits, Emerging Market bonds and Asian dollar credit, our         Equity
   market diversity indicator has yet to reach a low level that        MSCI USA Index                                      ●               
   signals a significant increase in reversal risks. However, our
   indicator suggests it may not be wise to chase the rally in
                                                                       MSCI Europe Index                                   ●               
   Gold as liquidity conditions are looking very stretched.            MSCI UK Index                                       ◐               
                                                                       MSCI Japan Index                                    ●               

    Fractal dimension as a measure of the market’s                     MSCI AC Asia ex-Japan Index                         ●               
    structural diversity                                               MSCI EM ex-Asia Index                               ●               
    Diversity plays a crucial role in our investment process,          Fixed Income
    particularly the idea of structural diversity in a market at       FTSE DM IG Sovereign Bond Index                     ◐               
    any point in time. This idea is closely related to the
                                                                       FTSE DM IG Corporate Bond Index                     ◐               →
    Fractal Market Hypothesis (FMH). Under the FMH, there
                                                                                                                           ◐
                                                                       Bloomberg Barclays Global
    are two distinct market regimes;                                   High Yield Index
                                                                                                                                           →
    1.   A stable market where investors with different                JPM EM Global Diversified Bond Index                ○               
         investment horizons come together and balance each
                                                                                                                           ◐
                                                                       JPM EM Government Local Currency
                                                                       Bond Index
                                                                                                                                           
         other out, thus creating ample liquidity and structural
         diversity.                                                    JPM Asia Credit Index                               ◐               
    2.   An unstable market where different investors                  Currencies
         converge to a short-term investment view, leading to a        USD/CNY                                             ●               
         market trend that is too linear, as liquidity and
                                                                       USD/EUR                                             ◐               
         structural diversity dry up.
    One implication of the FMH is that diversity can be used
                                                                       USD/JPY                                             ●               
    to identify which one of these two states any market is in.        USD/GBP                                             ●               
    This would enable us to identify market trends that are            USD/AUD                                             ◐               →
    more likely to persist, and those where the risk of a short-
                                                                       USD/SGD                                             ◐               
    term reversal is more likely.
    Fractal dimension is a way to estimate a market’s
                                                                       USD/MYR                                             ●               
    structural diversity and takes on a minimum value of 1 –           USD/IDR                                             ●               
    a diversity value of a straight line. Asset prices rarely          USD/INR                                             ●               
    move in straight lines, but they become more linear when           US Treasury Yields
    structural diversity drops due to rising supply and
    demand imbalances. Much like a rubber band that
                                                                       US 10-year Treasury Yield                           ◐               
                                                                       Source: Bloomberg, Standard Chartered; data as on 24 December 2019.
    stretches too far and breaks, the critical point of 1.25 is
                                                                       Legend:     ○   Very low   |   ◐   Low   |   ●   Moderate/high
    an estimated value of the fractal dimension when the
    reversal risk of an asset class rises significantly.

   Global Market Outlook                                                                                                                        17
13 Our recommended allocations
                                                                                                               UK Japan
                                 EM Govt HC                                                                    4% 1%
                                                                                        Europe ex-UK
                                    22%                          EM Govt LC                 16%
                                                                    17%                                                      Asia ex-Japan
                                                                                                                                  32%

                                               BOND                                                    EQUITY
                         DM HY
                          12%              (Asia-focused)                                            (Asia-focused)
                                                                          Asia USD
                                                                            22%         North
                                                                                       America
                            DM IG Corp*                                                 39%                                 Other EM
                               16%                                                                                             8%
                                                        DM IG Govt*
                                                           11%
                   EM Govt HC
                      23%                                                                           Sub                                      Event Driven
                                                                                                              Relative
                                                 EM Govt LC                                      financials                                     24%
                                                                                                               Value
                                                    10%                                             48%
                                                                                                               24%

     DM HY &           Higher Income                                         NON-CORE                                    ALTERNATIVES
    Leveraged
                           BOND                                               INCOME                                      STRATEGIES
      Loans
       24%
                                                     Asia USD
                                                       23%
                                                                                                    Others
                                                                Covered                              18%                                       Global Macro
                                                                                                                  Equity
            DM IG Corp*                                          Calls                                            Hedge                            17%
               10%                  DM IG Govt*                  34%                                               35%
                                       10%
   Allocation figures may not add up to 100 due to rounding. *FX-hedged

    Tailoring a multi-asset allocation to suit an individual's return expectations and appetite for risk

    • We have come up with several asset class “sleeves” across major asset classes driven by our investment views
    • Our modular allocations can be used as building blocks to put together a complete multi-asset allocation
    • These multi-asset allocations can be tailored to fit an individual’s unique return expectations and risk appetite
    • We illustrate allocation examples for both Global and Asia-focused investors, across risk profiles

    BOND                                   Higher Income                     EQUITY                  NON-CORE                    ALTERNATIVES
    Allocation                             BOND                              Allocation              INCOME                      STRATEGIES
    (Asia-focused)                         Allocation                        (Asia-focused)          Allocation                  Allocation

    For investors who want a               For investors who prefer a        For investors who       For investors who           For investors who want
    diversified allocation across          higher income component           want a diversified      want to diversify           to increase
    major fixed income sectors and         to capital returns from           allocation across       exposure from               diversification within
    regions                                their fixed income                major equity            traditional fixed           their allocation
    Asia-focused allocation                exposure                          markets and regions     income and equity           Include both “substitute”
                                           Includes exposures to             Asia-focused            into “hybrid” assets        and “diversifying”
                                           Senior Floating Rate              allocation              Hybrid assets have          strategies
                                           bonds                                                     characteristics of both
                                                                                                     fixed income and
                                                                                                     equity
                                                                                                     Examples include
                                                                                                     Covered Calls, REITs,
                                                                                                     and sub-financials
                                                                                                     (Preferred Shares and
                                                                                                     CoCo bonds)
   Note: Allocation figures may not add up to 100% due to rounding. *FX-hedged

   Global Market Outlook                                                                                                                                    18
14 Asset allocation summary
                                                                ASIA FOCUSED                                               GLOBAL FOCUSED
                                                                Moderately                                  Moderately
    Summary                     View      Conservative Moderate Aggressive Aggressive Conservative Moderate Aggressive Aggressive

    Cash                            ▼           10                3            1               0                10              3              1              0

    Fixed Income                    ◆           65               39           29               8                65             39             29              8

    Equity                          ▲           25               43           55              81                25             43             55              81

    Gold                            ▲            0                7            7               7                0               7              7              7

    Alternative Strategies          ◆            0                8            8               4                0               8              8              4

    Asset class

    USD Cash                        ▼           10                3            1               0                10              3              1              0

    DM Government
    Bonds*
                                    ◆            6                4            3               1                10              6              4              1

    DM IG
    Corporate Bonds*
                                    ◆            7                6            5               1                15              9              7              2

    DM HY
    Corporate Bonds
                                    ◆            8                5            4               1                11              7              5              1

    EM USD
    Government Bonds
                                    ▲           16                9            6               2                11              7              5              1

    EM Local Ccy
    Government Bonds
                                    ◆           11                7            5               1                8               5              4              1

    Asia USD Bonds                  ▲           16                9            6               2                11              7              5              1

    North America
    equities
                                    ▲           12               17           21              32                15             26             33              49

    Europe ex-UK equities           ◆            4                7            9              13                2               3              4              6

    UK equities                     ◆            1                2            2               3                1               2              2              3

    Japan equities                  ▼            1                1            1               1                0               1              1              1

    Asia ex-Japan
    equities
                                    ▲            7               14           17              26                5               8             11              16

    Non-Asia EM equities            ◆            0                3            4               6                2               3              4              6

    Gold                            ▲            0                7            7               7                0               7              7              7

    Alternatives                    ◆            0                8            8               4                0               8              8              4

   All figures in %. Source: Standard Chartered.
   Note: (i) For small allocations we recommend investors to allocate through broader global equity/global bond solutions; (ii) Allocation figures may not sum to 100%
   due to rounding effects.
   *FX-hedged
   Legend:   ▲ Most preferred   |   ▼ Least preferred   |   ◆ Core holding

   Global Market Outlook                                                                                                                                            19
15 Market performance summary*

                                                Year to Date                                                                                   1 month
                                                                                               Equity | Country & Region
                                               -9.1%                                                  Global Equities                          -9.5%
                                         -11.2%                                                Global High Div i Y ield Equities            -10.1%
                                               -9.0%                                             Dev eloped Markets (DM)                       -9.6%
                                             -9.7%                                                Emerging Markets (EM)                          -8.7%
                                                 -8.1%                                                       US                                -9.6%
                                              -9.5%                                               Western Europe (Local)                      -9.8%
                                        -11.6%                                                    Western Europe (USD)                      -10.2%
                                         -11.0%                                                        Japan (Local)                          -9.9%
                                           -10.4%                                                      Japan (USD)                               -8.8%
                                          -10.9%                                                         Australia                       -11.5%
                                                   -7.2%                                               Asia ex-Japan                                 -6.8%
                           -18.8%                                                                          Af rica                   -13.6%
                             -17.6%                                                                   Eastern Europe           -17.0%
                              -17.0%                                                                       Latam                   -14.7%
                                                -8.0%                                                   Middle East                                    -6.1%
                                                        -3.9%                                              China                                           -3.6%
                                                -8.0%                                                       India                                -8.7%
                                       -12.3%                                                           South Korea                       -11.1%
                                                  -6.5%                                                   Taiwan                                    -7.4%

                                                                                                      Equity | Sector
                                               -8.3%                                              Consumer Discretionary                          -7.6%
                                              -9.0%                                                  Consumer Staples                          -9.3%
                     -21.5%                                                                                Energy             -16.8%
                                       -12.2%                                                             Financial                        -10.4%
                                               -8.0%                                                     Healthcare                             -8.6%
                                          -10.3%                                                          Industrial                       -10.4%
                                                        -4.4%                                                 IT                               -8.9%
                                -14.9%                                                                    Materials                      -11.1%
                                                    -5.8%                                                  Telecom                                -7.8%
                                                        -3.5%                                              Utilities                              -7.8%
                                                -7.8%                                           Global Property Equity /REITs                   -8.5%
                                                                                                    Bonds | Sovereign

                                                                               1.7%                  DM IG Sov ereign                                                         1.0%
                                                                                      5.2%             US Sov ereign                                                              3.4%
                                                                              1.4%                     EU Sov ereign                                                           1.9%
                                                                             0.5%               EM Sov ereign Hard Currency                                     -0.4%
                                                           -3.4%                                EM Sov ereign Local Currency                               -3.0%
                                                                -0.5%                             Asia EM Local Currency                                       -0.8%

                                                                                                      Bonds | Credit
                                                                               1.8%                 DM IG Corporates                                                          0.9%
                                                              -0.9%                              DM High Y ield Corporates                                      -0.8%
                                                             -1.4%                                    US High Y ield                                          -1.5%
                                                         -3.8%                                      Europe High Y ield                                       -2.1%
                                                                                2.4%               Asia Hard Currency                                                         1.0%

                                                                                                        Commodity
                                       -12.0%                                                      Div ersif ied Commodity                         -6.9%
                                                 -7.1%                                                   Agriculture                                    -3.9%
                -24.9%                                                                                      Energy                -14.7%
                                            -9.9%                                                      Industrial Metal                                   -4.0%
                                                                             0.0%                      Precious Metal                                         -1.7%
                  -23.2%                                                                                  Crude Oil               -14.7%
                                                                                     4.5%                     Gold                                                            1.2%

                                                                                                     FX (against USD)
                                                             -1.6%                                     Asia ex-Japan                                          -1.5%
                                                 -7.2%                                                      AUD                                           -3.7%
                                                              -1.7%                                         EUR                                                              0.0%
                                                           -3.3%                                            GBP                                               -1.6%
                                                                             0.5%                           JPY                                                               1.0%
                                                           -3.4%                                            SGD                                             -2.5%

                                                                                                      Alternatives
                                                                -0.4%                            Composite (All strategies)                                    -1.0%
                                                                             0.8%                    Relativ e Value                                                         0.0%
                                                                             0.7%                     Ev ent Driv en                                                         0.1%
                                                           -3.1%                                    Equity Long/Short                                      -3.3%
                                                                             0.5%                     Macro CTAs                                                -0.7%
              -30%   -25%     -20%      -15%      -10%        -5%       0%      5%       10%                                   -20%     -15%      -10%       -5%        0%          5%

   Source: MSCI, JPMorgan, Barclays, Citigroup, Dow Jones, HFRX, FTSE, Bloomberg, Standard Chartered
   *All performance shown in USD terms, unless otherwise stated
   *YTD performance: 31 December 2019 to 28 February 2020; 1-month performance: 28 January 2020 to 28 February 2020 [27 February 2020 for some FI markets]

   Global Market Outlook                                                                                                                                                                 20
16 Events calendar

   JANUARY                                           FEBRUARY                                          MARCH
    11         Taiwan general election                N.A                                                03        US Super Tuesday
                                                                                                                   (Democratic presidential
    23         ECB policy decision                                                                                 primaries)
    30         FOMC policy decision                                                                      10        More US Democratic
    30         BoE policy decision                                                                                 presidential primaries

    31         Brexit deadline                                                                           12        ECB policy decision
                                                                                                         19        FOMC policy decision
                                                                                                         26        BoE policy decision

   APRIL                                             MAY                                               JUNE
    30         FOMC policy decision                   07         BoE policy decision                     04        ECB policy decision

    30         ECB policy decision                                                                       10-12     G7 summit in the US
                                                                                                         11        FOMC policy decision
                                                                                                         18        BoE policy decision

   JULY                                              AUGUST                                            SEPTEMBER
    30         FOMC policy decision                   07         BoE policy decision                     x         China’s President Xi visits
                                                                                                                   Germany for summit with
    30         ECB policy decision                                                                                 EU state leaders
                                                                                                         04        ECB policy decision
                                                                                                         11        FOMC policy decision
                                                                                                         18        BoE policy decision
                                                                                                         29        1st US presidential debate

   OCTOBER                                           NOVEMBER                                          DECEMBER
    15         2nd US presidential debate             03         US presidential election                10        ECB policy decision
    22         3rd   US presidential debate           05         BoE policy decision                     17        FOMC policy decision
    29         ECB policy decision                    06         FOMC policy decision                    17        BoE policy decision
    29         BoJ policy decision                    21-22      G20 Summit in Saudi Arabia              18        BoE policy decision
                                                                                                         31        Deadline for Brexit transition
                                                                                                                   period

   ▬ Central bank policy | ▬ Geopolitics | ▬ EU politics
   X – Date not confirmed | ECB – European Central Bank | FOMC – Federal Open Market Committee (US) | BoJ – Bank of Japan | BoE – Bank of England |
   RBA – Reserve Bank of Australia

   Global Market Outlook                                                                                                                              21
17 Wealth management

                                        ANNUAL
                                       OUTLOOK
                                             annually

                                                                                          GLOBAL
                                                                                          MARKET
                                                                                          OUTLOOK
                                                                                          monthly

   The Annual Outlook highlights our key investment themes for the       Our monthly publication which presents the key investment
   year, the asset classes we expect to outperform and the likely        themes and asset allocation views of the Global Investment
   scenarios as we move through the year.                                Committee for the next 6-12 months.

                                         WEEKLY
                                         MARKET
                                           VIEW
                                              weekly

                                                                                          GLOBAL
                                                                                          WEALTH
                                                                                          DAILY
                                                                                          daily

   Our weekly publication which provides an update on recent             Global Wealth Daily is an early morning update of major economic
   developments in global financial markets and their implications for   and political events and their day-to-day impact on various assets
   our investment views.                                                 classes the previous day.

                                         MARKET
                                          WATCH
                                              ad hoc

                                                                                          360
                                                                                          PERSPECTIVES
                                                                                          ad hoc

   Market Watch focuses on major events or market developments           360 Perspectives provides a balanced assessment of the outlook
   and their likely impact on our investment views.                      for an asset class. It presents both the positives and negatives of
                                                                         the asset class, as well as the major drivers, instead of offering a
                                                                         specific view.

                                   INVESTMENT
                                         BRIEF
                                              ad hoc

   Investment Brief explains the rationale behind our views on an
   asset class, incorporating the fundamental and technical drivers.

  Global Market Outlook                                                                                                                     22
The team

Our experience and expertise help you navigate markets and provide actionable insights to reach your investment goals.

Alexis Calla                     Manish Jaradi                   Francis Lim                    Ajay Saratchandran
Chief Investment Officer         Senior Investment Strategist    Senior Investment Strategist   Senior Portfolio Manager
Chair of the Global Investment
Committee

Steve Brice                      Belle Chan                      Fook Hien Yap                  Samuel Seah, CFA
Chief Investment Strategist      Senior Investment Strategist    Senior Investment Strategist   Senior Portfolio Manager

Christian Abuide                 Daniel Lam, CFA                 Abhilash Narayan               Thursten Cheok, CFA
Head                             Senior Cross-asset Strategist   Investment Strategist          Senior Portfolio Strategist
Discretionary Portfolio
Management

Clive McDonnell                  Rajat Bhattacharya              DJ Cheong, CFA                 Trang Nguyen
Head                             Senior Investment Strategist    Investment Strategist          Portfolio Strategist
Equity Investment Strategy

Manpreet Gill                    Audrey Goh, CFA                 Cedric Lam                     Marco Iachini, CFA
Head                             Senior Cross-asset Strategist   Investment Strategist          Cross-asset Strategist
FICC Investment Strategy

                                                                 Sean Pang
                                                                 Investment Strategist

Global Market Outlook                                                                                                         23
18 Disclosures
   This document is confidential and may also be privileged. If you are not the intended recipient, please destroy all copies and
   notify the sender immediately. This document is being distributed for general information only and is subject to the relevant
   disclaimers available at https://www.sc.com/en/regulatory-disclosures/#market-commentary-disclaimer. It is not and does not
   constitute research material, independent research, an offer, recommendation or solicitation to enter into any transaction or
   adopt any hedging, trading or investment strategy, in relation to any securities or other financial instruments. This document is
   for general evaluation only. It does not take into account the specific investment objectives, financial situation or particular
   needs of any particular person or class of persons and it has not been prepared for any particular person or class of persons.
   You should not rely on any contents of this document in making any investment decisions. Before making any investment, you
   should carefully read the relevant offering documents and seek independent legal, tax and regulatory advice. In particular, we
   recommend you to seek advice regarding the suitability of the investment product, taking into account your specific investment
   objectives, financial situation or particular needs, before you make a commitment to purchase the investment product.
   Opinions, projections and estimates are solely those of SCB at the date of this document and subject to change without
   notice. Past performance is not indicative of future results and no representation or warranty is made regarding future
   performance. Any forecast contained herein as to likely future movements in rates or prices or likely future events or
   occurrences constitutes an opinion only and is not indicative of actual future movements in rates or prices or actual future
   events or occurrences (as the case may be). This document must not be forwarded or otherwise made available to any other
   person without the express written consent of the Standard Chartered Group (as defined below). Standard Chartered Bank is
   incorporated in England with limited liability by Royal Charter 1853 Reference Number ZC18. The Principal Office of the
   Company is situated in England at 1 Basinghall Avenue, London, EC2V 5DD. Standard Chartered Bank is authorised by the
   Prudential Regulation Authority and regulated by the Financial Conduct Authority and Prudential Regulation Authority.
   Standard Chartered PLC, the ultimate parent company of Standard Chartered Bank, together with its subsidiaries and affiliates
   (including each branch or representative office), form the Standard Chartered Group. Standard Chartered Private Bank is the
   private banking division of Standard Chartered. Private banking activities may be carried out internationally by different legal
   entities and affiliates within the Standard Chartered Group (each an “SC Group Entity”) according to local regulatory
   requirements. Not all products and services are provided by all branches, subsidiaries and affiliates within the Standard
   Chartered Group. Some of the SC Group Entities only act as representatives of Standard Chartered Private Bank, and may not
   be able to offer products and services, or offer advice to clients. They serve as points of contact only. ESG data has been
   provided by Refinitiv. Refer to https://www.refinitiv.com/en/financial-data/company-data/esg-research-data.
   Market Abuse Regulation (MAR) Disclaimer
   Banking activities may be carried out internationally by different branches, subsidiaries and affiliates within the Standard
   Chartered Group according to local regulatory requirements. Opinions may contain outright “buy”, “sell”, “hold” or other
   opinions. The time horizon of this opinion is dependent on prevailing market conditions and there is no planned frequency for
   updates to the opinion. This opinion is not independent of Standard Chartered Group’s trading strategies or positions. Standard
   Chartered Group and/or its affiliates or its respective officers, directors, employee benefit programmes or employees, including
   persons involved in the preparation or issuance of this document may at any time, to the extent permitted by applicable law
   and/or regulation, be long or short any securities or financial instruments referred to in this document or have material interest
   in any such securities or related investments. Therefore, it is possible, and you should assume, that Standard Chartered Group
   has a material interest in one or more of the financial instruments mentioned herein. Please refer to
   https://www.sc.com/en/banking-services/market-disclaimer.html           for   more    detailed    disclosures,  including     past
   opinions/recommendations in the last 12 months and conflict of interests, as well as disclaimers. A covering strategist may
   have a financial interest in the debt or equity securities of this company/issuer. This document must not be forwarded or
   otherwise made available to any other person without the express written consent of Standard Chartered Group.
   Country/Market Specific Disclosures
   Botswana: This document is being distributed in Botswana by, and is attributable to, Standard Chartered Bank Botswana
   Limited which is a financial institution licensed under the Section 6 of the Banking Act CAP 46.04 and is listed in the Botswana
   Stock Exchange. Brunei Darussalam: This document is being distributed in Brunei Darussalam by, and is attributable to,
   Standard Chartered Bank (Brunei Branch) | Registration Number RFC/61. Standard Chartered Bank is incorporated in England
   with limited liability by Royal Charter 1853 Reference Number ZC18 and Standard Chartered Securities (B) Sdn Bhd, which is
   a limited liability company registered with the Registry of Companies with Registration Number RC20001003 and licensed by
   Autoriti Monetari Brunei Darussalam as a Capital Markets Service License Holder with License Number AMBD/R/CMU/S3-CL.
   China Mainland: This document is being distributed in China by, and is attributable to, Standard Chartered Bank (China)
   Limited which is mainly regulated by China Banking and Insurance Regulatory Commission (CBIRC), State Administration of

                                                                                                                                  24
You can also read