EUROPEAN COVERED BOND CONFERENCE 2020 - AUSTRALIA AND NEW Z EALAND BANKING GROUP LIMITED - ANZ

Page created by Terrence Adkins
 
CONTINUE READING
EUROPEAN COVERED BOND CONFERENCE 2020 - AUSTRALIA AND NEW Z EALAND BANKING GROUP LIMITED - ANZ
EUROPEAN COVERED BOND
       CONFERENCE 2020

      AUSTRALIA AND NEW Z EALAND
           BANKING GROUP LIMITED
                    ABN 11 005 357 522

                     Not for distribution into the United States
EUROPEAN COVERED BOND CONFERENCE 2020 - AUSTRALIA AND NEW Z EALAND BANKING GROUP LIMITED - ANZ
CONTENTS

Q3 Trading Update                        3

1H20 Results                           18

ESG Update                             27

Group Treasury                         33

Risk Management                        41

Housing Portfolio                      49

Covered Bond Trust Update              59

Economics                              63

Key Contacts                           74

                                                                     2
                            Not for distribution into the United States
EUROPEAN COVERED BOND CONFERENCE 2020 - AUSTRALIA AND NEW Z EALAND BANKING GROUP LIMITED - ANZ
EUROPEAN COVERED BOND
       CONFERENCE 2020

              Q3 TRADING UPDATE

      AUSTRALIA AND NEW Z EALAND
           BANKING GROUP LIMITED

                     Not for distribution into the United States
EUROPEAN COVERED BOND CONFERENCE 2020 - AUSTRALIA AND NEW Z EALAND BANKING GROUP LIMITED - ANZ
OVERVIEW
FINANCIAL INFORMATION AS AT 30 JUNE 2020
(ALL COMPARISONS TO 1H20 QUARTERLY AVG UNLESS OTHERWISE STATED)

3Q20 Profit
• Unaudited Statutory Profit $1.3b. For Continuing Operations, unaudited Cash Profit excluding Large / Notable Items $1.6b (including Large /
  Notable items $1.5b)
• Operating expenses down 1% reflecting disciplined cost management for the environment, while also investing record levels this quarter
• Revenue increased, benefiting from a stronger markets performance (~60% higher in 3Q20), partly offset by lower margins and transaction
  volumes
• Net interest margin of 1.59% for 3Q20 (1.69% for 1H20). Key drivers included low interest rates (-6 bps impact net of repricing), higher
  liquids, competition and mix (e.g. higher fixed rate mortgages), partially offset by lower funding costs and deposit mix
Capital, Dividend and RWA
• Group CET1 ratio (APRA Level 2) 11.1%. Pro Forma Group CET1 ratio (APRA Level 2) 11.3%1
• Following strong growth in March, Institutional Credit RWA (ex FX & risk migration) was down $8b in 3Q20, largely driven by lower lending
  volumes and risk intensity (see page 3)
• Dividend of 25 cents per share fully franked declared for 1H20, no DRP discount
• Too early to update the 110bp base case capital impact from risk migration
Provision Charge and Credit Quality
• 3Q20 total provision charge $500m. Individual provision charge $264m, collective provision charge $236m. Annualised 3Q20 loss rate 31 bps
• Group provision balance $4.65b, collective provision coverage ratio 1.25%2 (see page 4)
• Regrading wholesale exposures is well progressed, prioritising the segments and customers deemed more susceptible under the current crisis
  (regrading increased RWA by $4b in 3Q20)
COVID-19 Assistance (at 31 July 2020)
• ~84,000 Australian Home Loan accounts (~$31b of home loan balances) on COVID-19 loan repayment deferral (~9% of accounts, ~12% of
  home loan balances) (see page 8)
• ~22,000 Australian Commercial lending accounts (~$10b EAD) on COVID-19 loan repayment deferral (see page 9)

1.   Including conversion of NZD500m Capital Note & announced sale of UDC
2.   Collective Provision balance as a % of Credit Risk Weighted Assets                                                                                          4
                                                                                                                        Not for distribution into the United States
EUROPEAN COVERED BOND CONFERENCE 2020 - AUSTRALIA AND NEW Z EALAND BANKING GROUP LIMITED - ANZ
CAPITAL & DIVIDEND
APRA LEVEL 2 COMMON EQUITY TIER 1 RATIO (CET1)                                                                    1H20 DIVIDEND DECLARED
                                                                                                                  Dividend per share (fully franked) (no discount on DRP)                                   25c
                                                                                                                  % of 1H20 statutory profit                                                                46%
                                                                                                                  % of 1H20 statutory profit (adj. for Panin & AmBank impairments)                          30%
                                                                                                                  4Q20 CET1 impact of 1H20 dividend                                                        15bps

                      Earnings 43bp                                                      Credit impacts
%
                    (ex. credit impacts)                                                    -21bps

                                                                                                                                                                    Pro Forma
                                                                                                                                                                      11.33
                                                     0.12                                                                                                                                  ~$50b CET1
                               0.43                                                                                                                                                          capital
     Pro Forma                                                                                                                                  0.03                   11.1
                                                                           -0.08                  -0.03
       10.93                                                                                                                                                                                                Pro Forma3
                                                                                                                         -0.10
                                                                                                                                                                                               Buffers      ~$1b
        10.8                                                                                                                                                                                    $14b

                                                                                                                                                                                                 CCB4
                                                                                                                                                                                                 $15b

                                                                                                                                                                                                CET1
                                                                                                                                                                                                min.
                                                             +37bps (+47bps on a Pro Forma basis)
                                                                                                                                                                                                $20b

      Mar-20                  PBP             Underlying RWA               CIC              Net DTA on CIC         Risk Migration              Other2                Jun-20                    Jun-20
                          (net of tax)1         movement                (net of tax)

1.    Excludes large / notable items & one-off items
2.    Includes Capital Deductions (mainly comprises the movement in retained earnings in deconsolidated entities and capitalised software) & other impacts including net RWA imposts/efficiencies
      movements in non-cash earnings, net foreign currency translation and other
3.    Including conversion of NZD500m Capital Note (Mar-20 & Jun-20) & announced sale of UDC (Jun-20)                                                                                                                       5
4.    Capital Conservation Buffer                                                                                                                                                  Not for distribution into the United States
EUROPEAN COVERED BOND CONFERENCE 2020 - AUSTRALIA AND NEW Z EALAND BANKING GROUP LIMITED - ANZ
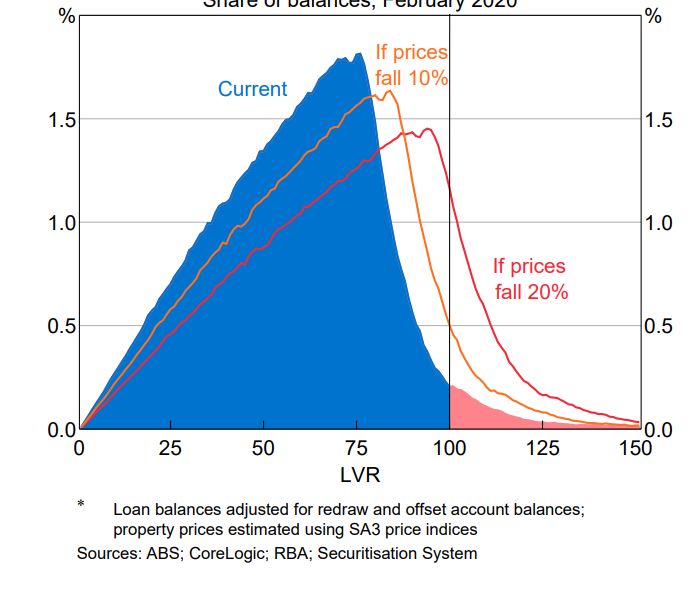
CREDIT RISK WEIGHTED ASSETS MOVEMENT
Key credit RWA trends 3Q20

FX
• Reversal of 2Q20 FX impact, primarily driven by USD and NZD rate movements (no material capital impact)

UNDERLYING CRWA MOVEMENT
• Following strong growth in March, Institutional’s CRWA declined in the June quarter, driven by lower risk intensity and lending volumes as customers adjusted
  their requirements to reflect the changing environment
• Australia Retail & Commercial up $1.8b, including Mortgages up $1.5b driven by new customer lending

RISK MIGRATION
• Regrading wholesale exposures is well progressed, prioritising the segments and customers deemed more susceptible under the current crisis (regrading
  increased RWA by $4b in 3Q20)

CRWA MOVEMENT – TOTAL GROUP
 $b                                      2.6         1.9          1.0        386.0
                           13.3
                                                                                                                    4.2          0.8                          372.2
               9.1                                                                         -9.5
                                                                                                       -7.4                                  -1.9
  358.1

 Sep-19     FX impact   Underlying      Risk    Methodology      CVA         Mar-20     FX impact   Underlying     Risk    Methodology       CVA             Jun-20
                          CRWA        migration                 mvmt.                                 CRWA       migration                  mvmt.
                          mvmt.                                                                       mvmt.

                                                                                                                                                                                        6
                                                                                                                                               Not for distribution into the United States
EUROPEAN COVERED BOND CONFERENCE 2020 - AUSTRALIA AND NEW Z EALAND BANKING GROUP LIMITED - ANZ
PROVISION CHARGE & COVERAGE

                                                          PROVISION CHARGE                                     CP COVERAGE1
                                                          $m                                                     %
•    3Q20 Provision charge $500m included:
                                                                              1,558                                                                 1.25
      o $264m Individual provision charge
                                                                                                                               1.17
      o $236m Collective provision charge increasing                                                                                                CP
        total CP balance to $4.65b as at 30 June 2020                                                                           CP                balance
                                                                               461                                                                $4.65b
                                                                                                                              balance
•    CP charge outcome for 3Q20 reflected:                                                                                    $4.50b
      o the less adverse economic outlook as at 30 June
                                                                                            3Q20
        2020 relative to 31 March 2020, offset by;                                       annualised                  0.75
                                                                                          loss rate
      o additional downside risk reflecting ongoing                                                                CP
                                                                                            31bps
        COVID-19 uncertainties, including                                                                        balance
        considerations around deferral packages and                                                              $2.52b
        higher risk segments in the Commercial
        portfolios in Australia and New Zealand                               1,097         500
      o the regrading of wholesale exposures,
        prioritising the segments and customers                                             264
        deemed more susceptible under the current
        crisis                                                  116
                                                                                            236
                                                                165
                                                                -49                                               Sep-18      Mar-20              Jun-20
                                                               1Q20           2Q20         3Q20                (Pre AASB 9)
                                                           Individual Provision charge   Collective Provision charge

         Long run provision charge, loss rates and coverage ratios are included in the 3Q20 Basel III Pillar 3 chart pack
1.   Collective Provision Balance as a % of Credit RWA
                                                                                                                                                                                 7
                                                                                                                                        Not for distribution into the United States
EUROPEAN COVERED BOND CONFERENCE 2020 - AUSTRALIA AND NEW Z EALAND BANKING GROUP LIMITED - ANZ
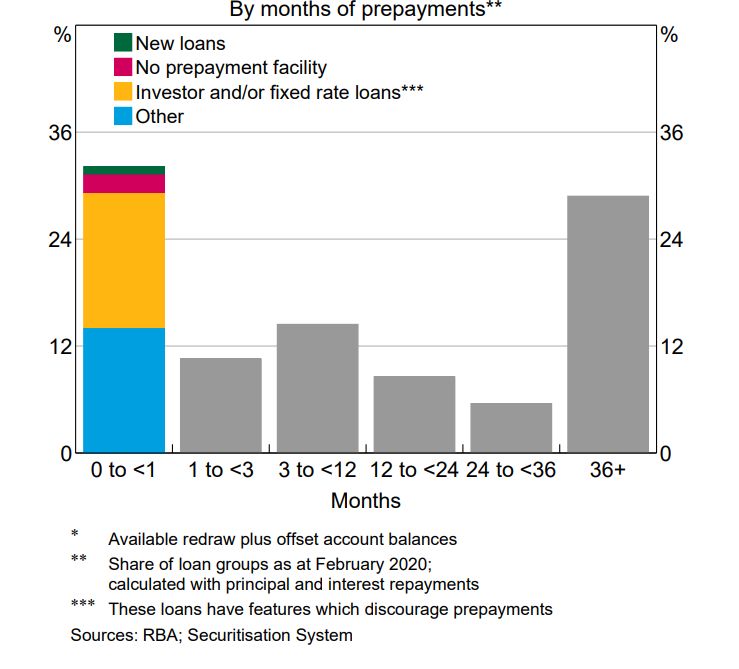
AUSTRALIA HOME LOAN CREDIT QUALITY

                                                                                                                              AUS. HOME LOANS DELINQUENCIES2,3,4
     •    For eligible home loans1 receiving COVID-19 assistance, arrears are frozen
                                                                                                                                %
          for the period of the loan deferral
                                                                                                                               2.4
     •    Customers who requested assistance but were ineligible for repayment                                                 2.2
          deferral based on these criteria were considered under ANZ Hardship                                                  2.0
          arrangements, including payment moratoriums, where delinquency continues                                             1.8
                                                                                                                               1.6
          to increase when scheduled repayments are not made
                                                                                                                               1.4
     •    The increase in 90+ delinquency to 1.28% at June 2020 (up 18bps from                                                 1.2
          March 2020) was driven by these customers impacted by COVID-19 but                                                   1.0
                                                                                                                               0.8
          ineligible for deferral
                                                                                                                               0.6
     •    As a result of the assistance measures, a reduced number of accounts have                                            0.4
                                                                                                                                              30+ DPD        90+ DPD
          missed scheduled payments in the quarter and 30+ delinquency has reduced                                             0.2
          23bps QoQ to Jun-20                                                                                                  0.0
                                                                                                                                 Mar-                                       Mar-                                       Mar-        Jun-
                                                                                                                                   18                                        19                                         20          20

DYNAMIC LOAN TO VALUE RATIO5                                                                                                  AUS. HOME LOANS 90+ DAYS PAST DUE6 (BY VINTAGE)
 % of total Portfolio Accounts                                                                                                  %
60                                                                                                                             2.5
50                                                                                                                             2.0
40
                                                                                                                               1.5
30
                                                                                                                               1.0
20
10                                                                                                                             0.5
 0                                                                                                                             0.0
           0-60%         61-75%         76-80%         81-90%         91-95%         96-100%         100%+                           6    8     10      12   14     16    18    20   22    24       26     28     30     32      34     36
                                                                                                                                                                                Month on book
            Mar-18        Mar-19         Mar-20        Jun-20                                                                            FY15        FY16         FY17      FY18     FY19

1.       COVID-19 loan deferrals are available to customers if either their Home Loan repayments are less than 30 days past due, or if their repayments are less than 90 days past due and were up to date at 1 March 2020
2.       Includes Non Performing Loans
3.       ANZ delinquencies are calculated on a missed payment basis for amortising and Interest Only loans
4.       30+ and 90+ excludes eligible Home Loans accounts that had requested COVID-19 assistance but due to delays in processing had not had the loan repayment deferral applied to the account
5.       Includes capitalised LMI premiums. Valuations updated to May-20 where available. Includes Non Performing Loans and excludes accounts with a security guarantee and unknown DLVR. DLVR does not incorporate offset balances
                                                                                                                                                                                                                                                       8
6.       Home loans 90+ DPD vintages represent % ratio of over 90+ delinquent (measured by # accounts), contains at least 6 application months of that fiscal year contributing to each data point
                                                                                                                                                                                                              Not for distribution into the United States
EUROPEAN COVERED BOND CONFERENCE 2020 - AUSTRALIA AND NEW Z EALAND BANKING GROUP LIMITED - ANZ
CUSTOMER BEHAVIOUR

     •    Increased deposit balances YTD in Retail, Commercial and Institutional                                                                                                                                                                                                                                                                                                                                                                                                                                                              ANZ DEPOSIT ACTIVITY
     •    Within the Institutional and Corporate customer base, a number of                                                                                                                                                                                                                                                                                                                                                                                                                                                                    Australia Retail &                New Zealand                     Institutional
          customers have been proactive in managing costs and taking a                                                                                                                                                                                                                                                                                                                                                                                                                                                                         Commercial                        Division                        (includes the impact of FX)
          conservative approach to capital and distribution                                                                                                                                                                                                                                                                                                                                                                                                                                                                                                                                                       $b
                                                                                                                                                                                                                                                                                                                                                                                                                                                                                                                                               $b                                NZ$b
                                                                                                                                                                                                                                                                                                                                                                                                                                                                                                                                                                 221                                                             259
     •    Within the Retail portfolio:                                                                                                                                                                                                                                                                                                                                                                                                                                                                                                                   213                                                                                243
                                                                                                                                                                                                                                                                                                                                                                                                                                                                                                                                               208                                                                    217
             o credit card debt has reduced and offset balances increased
                                                                                                                                                                                                                                                                                                                                                                                                                                                                                                                                                                                   90    94      95
             o ~ two thirds of Australia home loan customers with loan repayment
               deferrals have increased their “buffer” (offset, redraw and credit in
               transaction and savings account) over the period February to July 2020

                                                                                                                                                                                                                                                                                                                                                                                                                                                                                                                                              Sep-19 Mar-20 Jun-20              Sep-19 Mar-20 Jun-20             Sep-19 Mar-20 Jun-20

$37B IN LARGE CORPORATE EQUITY RAISINGS FOR ASX                                                                                                                                                                                                                                                                                                                                                                                                                                                                                               ANZ AUSTRALIA RETAIL ACCOUNT ACTIVITY
AND NZX YTD1
         $b System data                                                                                                                                                                                                                                                                                                                                                                                                                                                                                                                       $b                                                       $b                                     31
                                                                                                                                                                                                                                                                                                                                                                                                                                                                                                                                                                                                                 29         30         29
         8                                                                                                                                                                                                                                                                                                                                                                                                                                                                                                                                                                                                  28

         6
                                                                                                                                                                                                                                                                                                                                                                                                                                                                                                                                               6.3
                                                                                                                                                                                                                                                                                                                                                                                                                                                                                                                                                        5.7    5.4      5.5     5.3
         4

         2

         0
                                                                                                                                                                                                                                                                                                                              w/e 15-May-20
                                                                                                                                                                                                                                                                                              w/e 01-May-20
                                                                                                                                                                                                                                                                                                              w/e 08-May-20

                                                                                                                                                                                                                                                                                                                                              w/e 22-May-20
                                                                                                                                                                                                                                                                                                                                                              w/e 29-May-20
              w/e 03-Jan-20
                              w/e 10-Jan-20
                                              w/e 17-Jan-20
                                                              w/e 24-Jan-20
                                                                              w/e 31-Jan-20

                                                                                                                              w/e 21-Feb-20

                                                                                                                                                                                                                              w/e 03-Apr-20
                                                                                                                                                                                                                                              w/e 10-Apr-20
                                                                                                                                                                                                                                                              w/e 17-Apr-20
                                                                                                                                                                                                                                                                              w/e 24-Apr-20

                                                                                                                                                                                                                                                                                                                                                                              w/e 05-Jun-20
                                                                                                                                                                                                                                                                                                                                                                                              w/e 12-Jun-20

                                                                                                                                                                                                                                                                                                                                                                                                              w/e 19-Jun-20
                                                                                                                                                                                                                                                                                                                                                                                                                              w/e 26-Jun-20
                                                                                              w/e 07-Feb-20
                                                                                                              w/e 14-Feb-20

                                                                                                                                              w/e 28-Feb-20

                                                                                                                                                                                                                                                                                                                                                                                                                                                                                                                              w/e 07-Aug-20
                                                                                                                                                              w/e 06-Mar-20
                                                                                                                                                                              w/e 13-Mar-20
                                                                                                                                                                                              w/e 20-Mar-20
                                                                                                                                                                                                              w/e 27-Mar-20

                                                                                                                                                                                                                                                                                                                                                                                                                                              w/e 03-Jul-20
                                                                                                                                                                                                                                                                                                                                                                                                                                                              w/e 10-Jul-20
                                                                                                                                                                                                                                                                                                                                                                                                                                                                              w/e 17-Jul-20
                                                                                                                                                                                                                                                                                                                                                                                                                                                                                              w/e 24-Jul-20
                                                                                                                                                                                                                                                                                                                                                                                                                                                                                                              w/e 31-Jul-20
                                                                                                                                                                                                                                                                                                                                                                                                                                                                                                                                                   Consumer credit card balances                                 Offset balances

                                                                                                                                                                                                                                                                                                                                                                                                                                                                                                                                                   Mar-20      Apr-20         May-20    Jun-20        Jul-20

1.       Source Dealogic, week ending 7 August 2020
                                                                                                                                                                                                                                                                                                                                                                                                                                                                                                                                                                                                                                                                 9
                                                                                                                                                                                                                                                                                                                                                                                                                                                                                                                                                                                                                        Not for distribution into the United States
EUROPEAN COVERED BOND CONFERENCE 2020 - AUSTRALIA AND NEW Z EALAND BANKING GROUP LIMITED - ANZ
CUSTOMER SUPPORT – AUSTRALIA (HOME LOANS)
COVID-19 RELIEF - HOME LOAN PAYMENT DEFERRALS AT 31 JULY 2020

 Home Loan relief at 31 July 2020:                                                                                                                                                        Loan repayment           Total AUS. Home
                                                                                                                                                                                              deferrals             Loan Portfolio2
 •   ~130k COVID-19 enquiries have been received to date, with 90k of these going                                                                                                       Total Active deferrals
     onto COVID-19 relief measures offering payment deferral1:                                                                                                                            at 31 July 2020

       o ~6,000 accounts have completed or unwound deferral arrangements over
         the period of March to end July 2020                                                                                    Total number of home loans                                      84k                     986k

       o ~84,000 accounts as at 31 July 2020 representing ~$31b of home loan
         balances (~81,000 accounts at 30 June 2020) on deferral, ~9% of all
         home loan accounts, ~12% of home loan balances                                                                          Total $ value of home loan balance                              $31b                    $268b

 Deferral cohort observation:
                                                                                                                                 Offset balances                                                $1.2b                    $29.4b
 •   ~ two thirds have stable or improved income5
 •   ~ one quarter have made at least one payment while on deferral
 •   ~ 95% have a ‘savings buffer’ (offset, redraw and credit in savings account)                                                Avg. Dynamic LVR (Ex. offset)3,4                                68%                      56%
 •   ~ half have at least a 3 month or greater payment ‘buffer’6

 3 month check in process:                                                                                                       Average Loan Size                                              $371k                    $272k
 •   Formal processes have been developed to pro-actively identify customers at
     risk of being unable to return to full repayments, and put in place appropriate
     treatment strategies to minimise any adverse impacts                                                                        % Principal & Interest                                          92%                      86%
 •   Contact program is well progressed, prioritised to focus on home loan account
     cohorts where internal data suggests a potentially higher risk of difficulty
                                                                                                                                 % Owner Occupied                                                73%                      68%

1.   COVID-19 loan deferrals are available to customers if either their Home Loan repayments are less than 30 days past due, or if their repayments are less than 90 days past due and were up to date at 1 March 2020
2.   Total portfolio statistics as at 30 June 2020
3.   Unweighted based on # accounts
4.   Includes capitalised LMI premiums, valuations for DLVR updated to May-20 where available, includes Non Performing Loans, excludes accounts with a security guarantee, and unknown DLVR
5.   Based on deferral customers where ANZ can identify salary income, this excludes other income types and segments such as self-employed
6.   Buffers are calculated at customer level, incorporating all Retail debts within the customer cluster at ANZ, and all funds available in ANZ redraw, offset and transaction and savings accounts                                               10
                                                                                                                                                                                                            Not for distribution into the United States
CUSTOMER SUPPORT – AUSTRALIA (HOME LOANS)
COVID-19 RELIEF - HOME LOAN PAYMENT DEFERRALS AT 31 JULY 2020

~130,000 COVID-19 ENQUIRIES RECEIVED                                            DYNAMIC LOAN TO VALUE RATIO                                         PORTFOLIO BY STATE
% of total requests (Mar-20 to Jul-20)                                          (% of accounts)1,2                                                  (% of accounts)

                                                                                   986k accounts             ~84k accounts                             986k accounts              ~84k accounts

                2%                                                                       9%                                                                    13%                         9%
                                                                                                                  16%
                     3%                                                                 11%                                                                                               14%
                                                                                                                                                               13%
                                                                                                                  17%
                                                                                                                                                               18%                        18%
                                                                                        29%
          26%
                                           69%                                                                    33%
                                                                                                                                                               26%                        27%

                                                                                        51%
                                                                                                                  34%                                          30%                        32%

                                                                                   Total Portfolio        Portfolio with loan                            Total Portfolio        Portfolio with loan
                                                                                     (June 20)            deferrals (July 20)3                             (June 20)            deferrals (July 20)3
             Went onto repayment deferral
             Chose not to take up deferral
             Went onto other assistance                                                      0-60%               81% - 90%                                            VIC         QLD           Other
             Being processed at 31 July                                                      61% - 80%           >90%                                                 NSW         WA

1.   Includes capitalised LMI premiums, valuations for DLVR updated to May-20 where available, includes Non Performing Loans, excludes accounts with a security guarantee, and unknown DLVR
2.   DLVR does not incorporate offset balances
3.   Active (outstanding) deferrals as at 31 July 2020
                                                                                                                                                                                                                      11
                                                                                                                                                                               Not for distribution into the United States
CUSTOMER SUPPORT – AUSTRALIA (COMMERCIAL)
COVID-19 RELIEF – COMMERCIAL BANKING1 AT 31 JULY 2020

 ANZ Commercial Banking:                                                                                                                                                    EAD
                                                                                                            Assistance Provided at 31 July 2020   Accounts
                                                                                                                                                                      at 30 June 2020
 •   ~485k customers in Commercial Banking of which ~165k have lending across
     ~240k accounts
 •   Small Business Banking segment, ~91% of total Commercial lending customers,                            Total Commercial lending              ~240k                      $69b
     is weighted to deposits (currently ~3x deposit to lending)
 Commercial customer relief at 31 July 2020:
 •   Deferrals are on an opt-in basis for the Commercial Banking portfolio
                                                                                                            Business loan deferrals                ~22k                     $9.5b
 •   All Commercial customers were spoken to prior to being processed for assistance
     to ensure they understood the terms of the assistance being offered
 •   As at 31 July ~22k accounts representing $9.5b EAD (~21.5k accounts at 30
     June) are receiving business loan deferrals
                                                                                                            Asset Finance loan deferrals           ~13k                     $0.9b
 •   ~3% of business loan deferrals have been partially or fully unwound at the
     customer’s request
 Deferred cohort observations2:
 •   ~45% have recorded stable or higher cash inflow vs same time last year                                 Temporary overdraft increases          ~11k                     $1.2b

 •   ~30% have reduced cash outflows by >30%
 •   ~60% have higher cash balances vs March 2020
 •   ~50% are receiving JobKeeper payments                                                                  JobKeeper and SME Guarantee Scheme      ~3k                    $151m

1.   Commercial is made up Small Business Banking (lending
CUSTOMER SUPPORT – AUSTRALIA (COMMERCIAL)
COVID-19 RELIEF – COMMERCIAL BANKING1 AT 31 JULY 2020

BUSINESS LOAN DEFERRALS PROVIDED2
BY SECURITY PROFILE (% OF EAD)3                              BY STATE (% OF EAD)4                                  BY INDUSTRY (% OF EAD)

           $69b              $9.5b                              $69b              $9.5b                                 $69b               $9.5b
                    5%        6%      0%                         9%                  6%
            7%
                                                                                   12%                                  27%                26%
                              20%                                13%
           15%
                                                                                   16%
                                                                 17%                                                      5%                   9%
                                                                                                                       6%
                                                                                                                                                      Other Industries
                                                                                                                        9%                 18%
                                                                                   30%                                                                Health & Community Services
                                                                 30%                                                     9%
                                                                                                                                           10%        Accom. Cafes & Restaurants
           73%                74%                                                                                       19%                           Other Property & Business Services
                                                                                                                                           14%
                                                                                                                                                      Retail Trade
                                                                                                                                               4%
                                                                 31%               36%
                                                                                                                        25%                           Agriculture, Forestry & Fishing
                                                                                                                                           19%
                                                                                                                                                      Commercial Property & Construction
         Total           Business loan                        Total           Business loan                           Total           Business loan
       Commercial          deferrals                        Commercial          deferrals                           Commercial          deferrals

     Fully Secured            Unsecured                       VIC/TAS           QLD        SA/NT
     Partially Secured        Others                          NSW/ACT           WA

1.   Commercial is made up Small Business Banking (lending
CUSTOMER SUPPORT – NEW ZEALAND
COVID-19 RELIEF AT 31 JULY 2020

                                                                                                                         LOAN REPAYMENT     Total NZ Home Loan
                                                                                                                           DEFERRALS              Portfolio1
 •    Financial support provided to ~39,000 personal, home and business loan                                               (31-Jul 20)1
      customers through repayment deferrals or adjustments covering lending of
      ~NZ$23b                                                                     Total number of home loans                     24k               414k

 •    Deferred ~24,000 home loan repayments and moved ~20,000 home loans to
                                                                                  Total $ value of home loan balance           NZ$6b             NZ$85b
      interest only
 •    Granted 2,730 temporary overdraft facilities to businesses needing more
                                                                                  Median Indexed LVR                           56.2%              46.8%
      working capital, worth ~NZ$46m
                                                                                  Average Loan Size                         NZ$252k             NZ$204k

ANZ NZ HOME LOAN REPAYMENTS DEFERRED

NUMBER OF HOME LOANS REPAYMENTS DEFERRED (CUMULATIVE)                            VALUE OF HOME LOAN BALANCES ON LOAN REPAYMENT DEFERRAL (CUMULATIVE)

                                                                                 NZ$ b
                                                               23,918
                                                      21,066                                                                              5.6
                                           18,871                                                                        5.0
                        16,464                                                                                  4.6                                     6% of NZ
                                                                                                  4.0
                                                                                                                                                        home loan
                                                                                                                                                         portfolio

       276                                                                          0.1
      Mar-20            Apr-20             May-20     Jun-20   Jul-20              Mar-20        Apr-20        May-20   Jun-20         Jul-20

 1.   Total portfolio statistics as at 30 June 2020
                                                                                                                                                                              14
                                                                                                                                       Not for distribution into the United States
MARGIN CONSIDERATIONS

KEY MARGIN CONSIDERATIONS                                                                                      CAPITAL & REPLICATING DEPOSITS PORTFOLIO (AUSTRALIA)
                                                                                                               %
 • Low rate environment in all geographies                                                                     3.0
 • Strong growth in at-call deposits                                                                           2.5
                                                                                                               2.0
 • Increase in liquid assets
                                                                                                               1.5
 • Shifting customer preferences                                                                               1.0
   (e.g. home loan switching to fixed rates)                                                                   0.5
                                                                                                               0.0
 • Competition and retention pricing                                                                                  Oct-       Jan-         Apr-           Jul-          Oct-         Jan-            Mar-            Jun-
                                                                                                                       18         19           19             19            19           20              20              20
 • Reduction in unsecured retail lending
                                                                                                                     3mth BBSW (Monthly Average)           Portfolio Earnings Rate

LOW RATE ENVIRONMENT                                                                                           BILLS / OIS SPREAD                              Sensitivity of 10bp change in Bills/OIS          NIM impact

                                                                                                                                                               As at 30 Sep-19                                        1 bp
           Net impact of previously announced AUD, NZD & USD rate cuts cuts                                                                                    As at 31 Mar-20                                    0.5 bp

 2H20 impact (net of repricing)                                                ~6bps                                                                           As at 30 Jun-20
PROVISIONS

TOTAL PROVISION CHARGE                                                                                  COLLECTIVE PROVISION BALANCE & COVERAGE
$m                                                                                                       $b                                                                          4.50
                                                                                                                                                                                                    4.65
                                                                                         1,558

                                                                                         461                                                               3.38         3.38

                                                                                                              2.79          2.66        2.58      2.52
                                                                                                                                                                                                   1.25%
                                                                                                                                                                                    1.17%
                                                                                         1,097   500                                                      0.98%        0.94%
                                                       237                193                                0.81%         0.79%       0.75%     0.75%
 202                                                      43      209                            264
           206       121      159       156                                  53   116
 220       210                183       186            194        258     140                    236
                     160                                                          165
                                                                  -49
 -18        -4       -39         -24        -30                                   -49                        Mar-17        Sep-17      Mar-18    Sep-18   Mar-19       Sep-19      Mar-20          Jun-20
1Q18       2Q18     3Q18     4Q18       1Q19       2Q19           3Q19    4Q19    1Q20   2Q20    3Q20

      Individual Provision charge             Collective Provision charge
                                                                                                              CP Balance          CP/CRWA

TOTAL LOSS RATES                                                                                        CP BALANCE BY DIVISION                            CP BALANCE BY PORTFOLIO
Bps      1Q18 2Q18 3Q18 4Q18 1Q19 2Q19 3Q19 4Q19 1Q20 2Q20 3Q20                                         $b             Sep-19         Mar-20    Jun-20      $b                    Sep-19 Mar-20 Jun-20

                                                                                                                                                             Corporate              1.62        2.22        2.22
                                                                                                         Aus               1.80        2.32      2.49
 IP        15       14      11         12         12         13      17      9      11     29     17                                                         Specialised            0.19        0.29        0.30
                                                                                                         Instit            1.17        1.59      1.52
                                                                                                                                                             Housing                0.52        0.81        0.81
                                                                                                         NZ                0.37        0.54      0.57
                                                                                                                                                             Retail1                0.97        1.10        1.25
 Total     14       14       8         11         10         15      14     13      7      98     31
                                                                                                         Pacific           0.04        0.05      0.07        Sovereign/Banks        0.08        0.08        0.07

1.     Includes Qualifying Revolving Retail and Other Retail
                                                                                                                                                                                                                       16
                                                                                                                                                                                Not for distribution into the United States
CREDIT QUALITY
IMPAIRED ASSETS AND LOANS PAST DUE

GROSS IMPAIRED ASSETS BY DIVISION1,3                                                                                             IMPAIRED LOANS / FACILITIES BY PORTFOLIO3
$b                                                                                                                                 $b
                                                                                                                                  4
                                                                                                                                             3.1            3.1
      0.51%            0.51%                                                                                                      3                                                                                              2.7           2.7
                                                                                            0.40%                                                                           2.2              2.3             2.1
                                        0.34%            0.35%             0.39%
                                                                                                                                  2

                                                                                                                                  1

                                                                                                                                  0
                                                                                                                                          Mar-16          Mar-17          Mar-18           Mar-19          Sep-19           Mar-20            Jun-20
       2.9               2.9
        0.2              0.2                                                                                                                 Corporate                     Qualified Revolving Retail          Specialised Lending
                                                                             2.6              2.5
                                                                             0.1              0.0                                            Residential Mortgage          Other Retail2                       Banks & Sovereign

                                                           2.1                                0.5
                         1.1                                                 0.7                                                                                                                             Increase primarily from reduction in
        1.3
                                          2.0
                                          0.1
                                                           0.1                                                                   90+ DAYS PAST DUE LOANS4                                                         denominator (FUM reduction in
                                                           0.4                                                                                                                                                     Personal lending, Cards, SME)
                                                                                              0.3
                                                                             0.3                                                   %
                                          0.6              0.2
                         0.4                                                                                                                                                                                                                  0.99
                                                                                                                                                                                                                                       0.89
        0.3                               0.2                                                                                                                                                                             0.84
                                                                                                                                                                                                                   0.74
                                                                                                                                                                                              0.68 0.67
                                                                                              1.7                                                                          0.62
                                                           1.5               1.5                                                                         0.55                     0.56
                                                                                                                                      0.53
                         1.2              1.1
        1.1                                                                                                                                  0.42               0.44

     Mar-16            Mar-17           Mar-18           Mar-19           Mar-20            Jun-20                                     Mar-16             Mar-17             Mar-18             Mar-19              Mar-20              Jun-20

           Australia        New Zealand           Institutional        Other         % of GLA                                           Total Group Residential Mortgage               Retail (Pillar 3 QRR & Other Retail categories)

1. Excluding unsecured 90+ days past due; 2. Other includes Retail Asia & Pacific and Australia Wealth; 3. Impaired loans / facilities include restructured items in which the original contractual terms have been modified
for reasons related to the financial difficulties of the customer. Restructuring may consist of reduction of interest, principal or other payments legally due, or an extension in maturity materially beyond those typically                                17
offered to new facilities with similar risk; 4. As a % of Exposure at Default                                                                                                                                         Not for distribution into the United States
EUROPEAN COVERED BOND
       CONFERENCE 2020

                    1H20 RESULTS

      AUSTRALIA AND NEW Z EALAND
           BANKING GROUP LIMITED

                     Not for distribution into the United States
FINANCIAL PERFORMANCE

                                                                                      1H20     1H20 v 2H19

Statutory Profit ($m)                                                                1,545       -44%

Cash Profit (Continuing operations)1 ($m)                                            1,413       -51%

Return on Equity                                                                     4.7%       -506bps

Earnings Per Share (cents)                                                            49.9       -50%

Cash Profit (Continuing operations) ex. large / notable items ($m)                   2,451       -26%

Dividend Per Share (cents)                                                          Deferred      N/A

CET1 Ratio (APRA Level 2) (%)                                                         10.8       -60bps

Net Tangible Assets Per Share ($)                                                    19.89        +2%

Provision coverage ratio2 (%)                                                         1.17      +23bps

1. Includes the impact of large / notable items, excludes discontinued operations
2. Collectively assessed provisions as a % of credit risk weighted assets                                                               19
                                                                                                 Not for distribution into the United States
SIMPLIFIED AND STRENGTHENED THE BANK

                                                                                                  AUSTRALIA HOME LOAN PORTFOLIO
                                                                                                  Gross Loans & Advances (GLA) $b
                           • Asia Retail & Wealth (IEL 151bps)1
     Sold                  • Esanda Dealer Finance (IEL 100bps)2                                                                     264
                           • NZ Life, Aus. Life, Aus. P&I                                                    242

                                                                                                                                      85
                           • Emerging Corporate Asia (IEL 41bps)1
     Exited                                                                                                                         (32%)
                           • ANZ Financial Planning                                                           97
                                                                                                            (40%)
                           • Unsecured retail lending
     Restricted            • No retail home loan offering to SMSFs
                           • Commercial property

                           • Unsecured SME lending                                                                                   179
     Reduced                                                                                                                        (68%)
                           • Investor home loans                                                             145
                                                                                                            (60%)
                           • Capital towards Retail & Commercial
     Rebalanced            • Institutional portfolio (87% investment grade)
                           • Housing portfolio to P&I (86% Aus; 81% NZ)
                                                                                                           Mar-16                   Mar-20

                                                                                                             Owner occupied     Investor & Equity Manager

1.   Internal expected loss as at Sep-16. This compared with total group IEL at Sep-16 of 35bps
2.   Internal expected loss as at Sep-15. This compared with total group IEL at Sep-15 of 35bps                                                                                   20
                                                                                                                                           Not for distribution into the United States
ADAPTING TO THE NEW ENVIRONMENT

                                                           DRAMATIC FALLS IN ATM & POS TRANSACTIONS
      ADAPT
     PROTECT                                                Avg. daily transaction # Oct-19 index = 100        ATM transactions
                                                           120                                                 POS transactions

                                                           100
                                                            80
     Record volumes of home loan
                                                            60
     re-finance applications
                                                            40

     Collapse in ATM/Branch volume                          20
                                                              0
                                                                  Oct-19            Dec-19            Feb-20              Apr-202
     95% of people working                     remotely1
                                                           EXISTING PLANS HAVE BEEN RUN THROUGH A FILTER PROCESS
     ‘Agile’ enabling us to quickly adapt

                                                                       Accelerate      Stay         Slow        Stop

1.   Excluding Australian branch staff
2.   Average daily transactions to 26-Apr-20                                                                                                          21
                                                                                                               Not for distribution into the United States
FINANCIAL PERFORMANCE
CONTINUING OPERATIONS

DIVISIONAL PERFORMANCE
                                                                                                                                  LARGE / NOTABLE ITEMS
EX. LARGE / NOTABLE ITEMS                     Income         Expenses           PBP         Provisions      Cash Profit                                   2H19      1H20          Change
                                                                                                                                  (AFTER TAX $m)
(1H20 V 2H19)

                                                                                                                                  Customer remediation    -405       -91           +314
Aus. Retail & Commercial                        -2%             0%             -3%          +167%              -24%

                                                                                                                                  Restructuring           -18        -74             -56

Institutional                                 +10%              -1%           +20%         +1,968%             -27%               Lease-related items      Nil       -58             -58

                                                                                                                                  Asian associate
                                                                                                                                                           Nil     -815             -815
                                                                                                                                  impairments
New Zealand (NZD)                               -1%            +2%             -3%          +208%              -16%
                                                                                                                                  Other2                  +24        Nil             -24

TOTAL1                                         +1%             +1%            +1%           +319%             -26%                TOTAL                   -399   -1,038            -639

1.   Total includes Australia Retail & Commercial, New Zealand (AUD), Institutional, Pacific, TSO & Group Centre
2.   Other 2H19 includes Gain / (Loss) on sale from divestments (+18); Divested business results (+7); Royal Commission legal costs (-1)                                                                22
                                                                                                                                                                 Not for distribution into the United States
NET INTEREST MARGIN
CONTINUING OPERATIONS

GROUP NET INTEREST MARGIN (NIM)
bps
                                                  1
      172                    0

                                                                                                                                                     1                  169
                                                                      -4                                   4         168             0

                                                                                           -5

                                                                   Includes 3bps headwind from rate cuts in
                                                                       mid to late 2019, net of repricing

                                                                        -4bps

                                                                                                       -3bps

      2H19              Asset &             Wholesale             Treasury             Deposits          Assets     1H20           Markets         Large /             1H20
                      Funding Mix          Funding Cost                                                           underlying1   Balance Sheet   Notable Items
                                                                                                                                  Activities2

1.   Excluding large / notable items and Markets Balance Sheet Activities
2.   Includes the impact of growth in discretionary liquid assets and other Balance Sheet Activities                                                                                              23
                                                                                                                                                           Not for distribution into the United States
CREDIT QUALITY
BALANCE SHEET COLLECTIVE CREDIT PROVISION

BASE CASE ECONOMIC FORECAST (AS AT 31 MARCH 2020 POST COMMENCEMENT OF COVID-19)

     BASE CASE ECONOMIC FORECAST1                                                                Australia                                             New Zealand

                                                                           Jun-20 Qtr.              CY2020               CY2021          Jun-20 Qtr.      CY2020              CY2021
     GDP change2                                                              -13.0%                  -4.7%                4.1%              -17.0%        -6.7%                 4.2%
     Unemployment rate3                                                       13.0%                   9.0%                 7.3%              8.6%          7.4%                  7.7%
     Residential Property price change2                                        -1.1%                  -4.1%                -6.3%             -2.0%         -1.9%                 6.0%

 COLLECTIVE PROVISION BALANCE SCENARIOS4 (31 MARCH 2020)
 Weightings are applied to provisioning scenarios to determine collective provision balance                          Scenario                            Base     Downside         Severe
 ($m)
                                                                                              6,472                  Intensity of downturn               High      Medium             High
                                                                   5,293
                                       4,319                                                                         Duration of downturn                Short     Medium            Long

                                                                                                                     Level of govt. & central bank
                                                                                                                                                         High      Medium             High
            1,969                                                                                                    support for the economy

                                                                                                                     Time to full recovery              Medium     Medium            Long

        100% upside              100% base case             100% downside                100% severe
                                economic forecast

1.    Subset of a range of economic indicators shown. Economic forecasts also undertaken for international markets
2.    Jun-20 Qtr: Quarter on Quarter change; CY2020 & CY2021: December Year on Year change
3.    Annual average                                                                                                                                                                                      24
4.    Illustration of the impact on ANZ’s Expected Credit Loss (ECL) allowance under scenarios where a 100% weighting is applied                                   Not for distribution into the United States
INSTITUTIONAL & COMMERCIAL PORTFOLIO1

              TOTAL WHOLESALE EAD                                                 EXPOSURE TO SOME INDUSTRIES MORE IMMEDIATELY IMPACTED BY COVID-192

               $703b
                                                                                     $11b in Retail Trade                                                   $11b in Accommodation, Cafes & Restaurants
                                 74% investment Grade
 Each
CONSUMER PORTFOLIO
PORTFOLIO COMPOSITION

CONSUMER PORTFOLIO1 (AUS & NZ)                                                                                   PRODUCT 90+ DAY DELINQUENCIES2
$b                                                                                                                 %
                                                                                                                 1.5
       322             336                359                362                360                                            Australia Home Loans            NZ Home Loans
                                                                                                                 1.2
       5%                4%                 4%                 4%                  3%
                      4%                 4%                 3%                 3%                                0.9
       5%
                                                                                 9%                              0.6
                                                              11%
                                           14%
                         18%                                                      5%                             0.3
       19%                                                     7%
                                                                                                                 0.0
                                           10%                                   19%                               Mar-               Mar-              Mar-        Mar-            Mar-                 Mar-
                         14%                                  17%                                                    15                16                17          18              19                   20
       13%
                                           15%

       12%               13%
                                                                                                                   Home Loan portfolio dynamics3 (Mar-20)                  Australia              NZ
                                                                                                                   Average LVR at Origination                                68%                57%
                                                                                                                   Average Dynamic LVR (excl. offsets)                       56%                40%

                                                              58%                61%                               % Owner Occupied                                          68%                75%
                                           53%
       46%               48%                                                                                       % Principal & Interest                                    86%                81%
                                                                                                                   % Low Doc                                                 3%                 0.3%
                                                                                                                   Loss Rate                                                 3bps               1bps
                                                                                                                   % Ahead of Repayments                                     76%                N/A4
      Mar-16           Mar-17             Mar-18             Mar-19            Mar-20

      Housing OO P&I             Housing OO I/O             Equity Mgr
      Housing Inv P&I            Housing Inv I/O            Unsecured personal

 1.    Net Loans & Advances
 2.    Includes Non-Performing Loans
 3.    Refer Australia & New Zealand Housing Portfolio section within the discussion pack for full list of portfolio dynamics, definitions and explanations                                                                26
 4.    Majority of NZ home loans (86% of the portfolio at Mar-20) are on fixed rate with set repayments                                                                             Not for distribution into the United States
EUROPEAN COVERED BOND
       CONFERENCE 2020

                     ESG UPDATE

      AUSTRALIA AND NEW Z EALAND
           BANKING GROUP LIMITED

                     Not for distribution into the United States
ANZ HAS AN INTEGRATED APPROACH TO SUSTAINABILITY
                       PURPOSE                                             ESG TARGETS                                                        TEAM
ANZ’s purpose is to shape a world where people and      We exceeded our 2015 commitment to fund and facilitate at   ANZ Group Treasury has implemented Green and
communities thrive                                      least AUD15b in environmentally sustainable solutions by    Sustainability Bond programs with ~AUD2.8b on issue
                                                        October 2020                                                currently, and intends to target annual issuance with their
ANZ’s Board has the highest level of oversight for                                                                  programs.
sustainability                                          We recently announced a new commitment to fund and
                                                        facilitate AUD50b by 2025 towards sustainable solutions     ANZ has a dedicated Sustainable Finance team that
We were the first bank globally to report using the                                                                 actively works with institutional customers to fund
recommendations of the TCFD                             In 2018 we renewed our support for Paris and issued         requirements for a transition towards a low carbon, more
                                                        a revised Climate Change Statement committing us to         sustainable economy
Chaired by ANZ’s CEO, the Ethics and Responsible        encourage and support 100 of our largest emitting
Business Committee is accountable for advancing ANZ’s   customers transition to a low carbon economy                ANZ awarded the Australian Sustainability Debt House of
purpose                                                                                                             the Year for 2019 by KangaNews, as well as the Best
                                                        ANZ has introduced a new target to procure 100%             Sustainable Finance House for 2019 and 2018
                                                        renewable electricity for our global operations by 2025
          ANZ’s Sustainability Framework                                                                            Contributed to market development across Asia Pacific
                                                        ANZ’s business operations have been carbon neutral          through the following industry group memberships:
                                                        since 2010
                                                                                                                    • ICMA Green Bond Principles
                                                        ANZ has committed to enable social and economic
                                                        participation of 1 million people by 2020 through our       • Climate Bonds Initiative (CBI) partner
                                                        initiatives to support financial wellbeing
                                                                                                                    • LMA/APLMA Green Loans Committees

                                                        Through the Healthy Homes initiative, we have               • SteerCo & Technical Working Group Members/Leads –
                                                        committed to provide NZD100m of interest free loans to        Australian Sustainable Finance Initiative and NZ Sustainable
                                                        insulate homes for ANZ mortgage holders in New Zealand        Finance Forum

                                                                                                                    • UN Global Compact’s Action Platform for Financial Innovation
                                                                                                                      of the SDGs

                                                          “Each year, ANZ sets public targets which                       “ESG used to be something you did as an
                                                          reflect our strategic priorities and respond to                 add-on. Now it’s an integral part of how
                                                          our most material environmental, social and                     we run the bank – it’s part of everything
                                                          governance issues (ESG).”                                       we do.”
                                                          - news.anz.com 4 November 2019                                  - Shayne Elliott, CEO

                                                                                                                                                                                         28
                                                                                                                                                         Not for distribution into the United States
ESG – GOVERNANCE OVERVIEW

                                                       BOARD OF DIRECTORS
                                                     Chaired by David Gonski, Chairman

 Audit Committee             Risk Committee    Ethics, Environment,       Digital Business   Human Resources             Nomination and
                                                       Social             and Technology       Committee                Board Operations
                                                 and Governance             Committee                                      Committee
                                                    Committee

        Chair:                    Chair:              Chair:                    Chair:             Chair:                     Chair:
     Paula Dwyer              Graeme Liebelt       David Gonski              Jane Halton        Ilana Atlas                David Gonski

  Ethics and Responsible                              Royal Commission & Self-                                  Customer Advocate,
   Business Committee                                  Assessment Oversight                                          Australia
          (ERBC)                                               Group

 Chaired by Shayne Elliott, CEO                       Chaired by Alexis George, DCEO,                         Reports to Mark Hand, Group
                                                          and Kevin Corbally, CRO                             Executive, Australia Retail and
                                                                                                                  Commercial Banking

                                                                                                                                                                     29
                                                                                                                              Not for distribution into the United States
BOARD AND EXECUTIVE COMMITTEES WORK TOGETHER
INDICATIVE RESPONSIBILITIES DEMONSTRATE HOW COMMITTEES MANAGE ESG

  Ethics, Environment, Social and Governance                      Ethics and Responsible Business
                Board committee                                       Management committee

 Purpose: Establish ethical and ESG guidelines and           Purpose: Operationalise Board objectives and
                     principles                                  make decisions on issues and policies

  Oversight of measures to        Review and monitor                                    Consider and decide on
  advance Purpose and the       ethical, environmental,     Purpose, reputation and     ethical, environmental,
   Ethics and Responsible     social and governance risks        values review        social and governance risks
    Business Committee             and opportunities                                       and opportunities

                                                                                            Set Social and
                                 Review of complaints         Examine complaints
                                                                                      Environmental Risk policy
   Code of Conduct review        themes and potential        themes and potential
                                                                                             and monitor
                                    systemic issues             systemic issues
                                                                                           implementation

                              Oversight and approval of
                               corporate governance                                     Monitor and determine
  Oversight and approval of                                  Set ESG targets and
                                 policies, principles,                                   sensitive customer
  ESG reporting and targets                                   monitor progress
                                regulatory and policy                                        transactions
                                      responses

                                                                                                                                           30
                                                                                                    Not for distribution into the United States
ESG TARGET PERFORMANCE
                                                                               1

SCORECARD SNAPSHOT
We are committed to the United Nations Sustainable Development Goals (SDGs). Our ESG targets support 10 of                                                                                                Not achieved
                                                                                                                                                                Achieved            In progress
the 17 SDGs.

ESG target                                                                                                                                  Progress                  Outcome           Relevant SDGs

FAIR AND RESPONSIBLE BANKING
                                                                                                                                     Ranked 1st relative to
RepTrak® community sentiment indicator – lead and improve relative to peers.
                                                                                                                                            peers.
ENVIRONMENTAL SUSTAINABILITY
Fund and facilitate at least AUD50 billion by 2025 towards sustainable solutions for our customers,
                                                                                                                                    AUD4.08 billion since 1
including initiatives that help improve environmental sustainability, increase access to affordable
                                                                                                                                       October 2019
housing and promote financial wellbeing.
Reduce the direct impact of our business activities on the environment by reducing scope 1 & 2
                                                                                                                                               -29%
emissions by 24% by 2025 and 35% by 2030 (against a 2015 baseline)
FINANCIAL WELLBEING
Help enable social and economic participation of 1 million people by 2020 2                                                                    >998k

Increasing women in leadership to 34.1% by 20203                                                                                              33.1%

Recruiting >1,000 people from under-represented groups by 2020                                                                                  829

HOUSING
Provide NZD100 million of interest free loans to insulate homes for ANZ mortgage holders (New
                                                                                                                                        NZD7.45 million
Zealand)

Offer all ANZ first home buyers access to financial coaching support                                                               >5k coaches trained

For detailed performance information refer to the 2019 ESG Supplement available in December 2019 and our 2020 Half Year ESG Target Update on anz.com/cs

 1. NB. Figures provided as at 31 March 2020 2. Through our initiatives to support financial wellbeing including financial inclusion, employment and community programs, and targeted banking
 products and services for small businesses and retail customers. NB. This is the figure at 30 Sep 2019. Updated figures available in our 2020 full year disclosures 3. FY18-FY20 target is                                  31
 defined as Women in Leadership which measures representation at the Senior Manager, Executive and Senior Executive levels.                                                           Not for distribution into the United States
HOW WE MEASURE AND COMMUNICATE
TRACKING OF EXTERNAL ESG rating performance

            •    Context:
            Reputation indicators are increasingly being used by investors and analysts to understand our approach to ESG issues and to measure our ESG performance
            against our peers. We are rated based on our ESG disclosures, analysis of media coverage and, in the case of DJSI, a detailed survey. Indicators are firmly
            weighted towards governance and how we manage staff and customers.

                                                         Bank industry median, 46                                                                   86, Highest bank
                                                                                                                                       82
                DJSI1        0                                                                                                                                              100            ANZ
                                                                                                                                                      A
            MSCI2        CCC                                                                                                                                                AAA
                                                                                                                   Medium risk, top 11th percentile
 Sustainalytics3 Severe                                                                                                                                                    Negligible
                                                                                                  C+, Best banking peer
                                                                                     C
    ISS-oekom4             D-                                                                                                                                              A+

            •    Outcome:
            •    Reputation indicators for ANZ and other major Australian banks show long-term, mid-range rank among major corporates. Our key weakness, scrutinised in
                 the Royal Commission as our failure to always responsibly deliver products and services, continues to impact our performance although to a lesser extent than
                 12 months ago. All indicators are consistent.
            •    Relevant ESG target:
            •    Group scorecard, maintain strong performance on Dow Jones Sustainability Index.

1. 2019, Dow Jones Sustainability Index. 2. ESG Rating, July 2020, MSCI ESG Research. 3. ESG Risk Rating Report, June 2020, Sustainalytics. 4. Corporate Rating, February 2020,
Institutional Shareholder Services – oekom.                                                                                                                                                                              32
                                                                                                                                                                                  Not for distribution into the United States
EUROPEAN COVERED BOND
       CONFERENCE 2020

                 GROUP TREASURY

      AUSTRALIA AND NEW Z EALAND
           BANKING GROUP LIMITED

                     Not for distribution into the United States
REGULATORY CAPITAL

CAPITAL UPDATE                                                                                              APRA LEVEL 2 COMMON EQUITY TIER 1 RATIO (CET1)
 APRA Level 2 CET1 ratio of 10.8% (15.5% on an Internationally Comparable                                     %
  basis1), which is in excess of APRA’s ‘Unquestionably Strong’ benchmark2
 APRA Level 1 CET1 ratio of 10.6%. Level 1 consolidation primarily comprises
  ANZ BGL (the Parent including offshore branches) but excludes offshore
  banking subsidiaries 3
 APRA Leverage ratio of 5.0% (or 5.6% on an Internationally Comparable
  basis)
                                                                                                                                                                                            Pro-Forma CET1 of
REGULATORS RESPONSES ON COVID-19 DISRUPTION                                                                                       0.87
                                                                                                                                                                                               ~10.9% with
 APRA                                                                                                                                                                                         conversion of
                                                                                                                                           -0.28                                             NZ$500m Capital
   •   Advised ADIs of the ability to use existing capital buffers (i.e. below the                                                                   -0.08
                                                                                                                                                              -0.07                                Note
       Unquestionably Strong CET1 benchmark of 10.5%)                                                         11.49
                                                                                                                       11.36
   •   Deferral of implementation of capital framework reforms by one year
                                                                                                                                                                       -0.44    -0.05
   •   Exemption from having to treat affected customers who have taken up the
       option of repayment deferral or repayment holidays as arrears or                                                                   Total impact of -43bps
                                                                                                                                                                                                             10.76
       restructured
                                                                                                                                                                                          -0.53    -0.02
 RBNZ
   •   Delay the start date of increased NZ capital requirements by 12 months to
       July 2021 and consultation on other regulatory initiatives by 6 months
   •   Extension to revised outsourcing policy (BS11) by 12 months to Oct 2023
   •   Agreement with NZ banks on suspension of ordinary share dividend
       payments and capital security redemptions. AT1 coupon payments can still                              Mar-19    Sep-19     Cash      CIC     Net DTA   Risk Underlying Capital Final 19 Other6       Mar-20
       be made                                                                                                                    Profit  (net of    on CIC Migration RWA     Deduc- Dividends
                                                                                                                                (ex CIC)4  tax)                      Business tions5    (DRP
                                                                                                                                                                      growth         neutralised)

 1. Internationally Comparable methodology aligns with APRA’s information paper entitled International Capital Comparison Study (13 July 2015). Basel III Internationally Comparable ratios do not
 include an estimate of the Basel I capital floor. 2. Based on APRA information paper “Strengthening banking system resilience – establishing unquestionably strong capital ratios” released in July
 2017. 3. Refer to ANZ Basel III APS330 Pillar 3 disclosures. 4. Excludes large / notable items & one-off items. 5. Mainly comprises the movement in retained earnings in deconsolidated entities
 and capitalised software. 6. Other impacts include divestment benefits from Pensions and Investments business, net imposts (incl. AASB16 impacts), movements in non-cash earnings, net foreign                             34
 currency translation and other                                                                                                                                                      Not for distribution into the United States
INTERNATIONALLY COMPARABLE1 REGULATORY CAPITAL POSITION

APRA Level 2 CET1 Ratio– 31 March 2020                                                                 10.8%
                                                                                                                             Level 2 CET1 Ratio
Corporate
undrawn EAD     Australian ADI unsecured corporate lending LGDs and undrawn
and unsecured   CCFs exceed those applied in many jurisdictions
                                                                                                         1.6%                %
LGD adjustments
Equity
                      APRA requires 100% deduction from CET1 vs. Basel framework
Investments &                                                                                            0.9%                              16.9
                      which allows concessional threshold prior to deduction                                                                                         16.4
DTA
                                                                                                                                                                                                  15.5
                      APRA requires use of 20% mortgage LGD floor vs. 10% under
Mortgages             Basel framework. Additionally, APRA also requires a higher                         1.1%
                      correlation factor vs 15% under Basel framework
                                                                                                                                 11.5                      11.4
                                                                                                                                                                                     10.8
Specialised           APRA requires supervisory slotting approach which results in
                                                                                                         0.7%
Lending               more conservative risk weights than under Basel framework

                      APRA includes in Pillar 1 RWA. This is not required under the
IRRBB RWA                                                                                                0.2%
                      Basel framework

                      Includes impact of deductions from CET1 for capitalised
Other                 expenses and deferred fee income required by APRA, currency                        0.2%
                      conversion threshold and other retail standardised exposures

Basel III Internationally Comparable CET1 Ratio                                                        15.5%
                                                                                                                                    Mar-19                    Sep-19                     Mar-20
Basel III Internationally Comparable Tier 1 Ratio                                                      17.8%

Basel III Internationally Comparable Total Capital Ratio                                               21.5%                      APRA Level 2              Internationally Comparable1

1.   Internationally Comparable methodology aligns with APRA’s information paper entitled International Capital Comparison Study (13 July 2015). Basel III Internationally Comparable ratios
     do not include an estimate of the Basel I capital floor
                                                                                                                                                                                                                          35
                                                                                                                                                                                   Not for distribution into the United States
BALANCE SHEET STRUCTURE1
•   Assuming no term wholesale debt issuance (domestic or offshore) for the next 18 months ANZ’s Net Stable Funding Ratio is projected to remain well above regulatory minimums
    at greater than 110%

BALANCE SHEET COMPOSITION                                                                            NSFR COMPOSITION
Mar-20                                                                                                 Mar-20
                                                                                                       $b                       552
                                                                                                                             Wholesale                                                469
                                                                                                                          Funding & Other3                                          Liquids
                                                                                                                           Non Financial                                        and Other Assets4
                                                                                                                             Corporates
                                            Short Term Wholesale Debt &                                                                                                               Other
                                                   Other Funding2                                                                                                                     Loans5
      Liquid and Other Assets
                                                       28%                                                                   Retail/SME
               34%
                                                                                                                                                                                  Residential
                                                                                                                                                                                  Mortgages6,7
                                                                                                                               Capital                                              35% Risk weight. 6. Includes NSFR impact of self-securitised assets backing the Committed Liquidity Facility (CLF). 7.
LIQUIDITY COVERAGE RATIO (LCR) SUMMARY1
•   ANZ’s USCP outstanding’s as at 31 March 2020 was USD13.5b                                               •    $12b Term Funding Facility included in LCR from 31 March 2020 (no impact on
                                                                                                                 reported 1H20 average). 1H20 LCR impacted by system wide reduction in RBA
•   Assuming all USCP is not replaced, LCR would remain at ~130%
                                                                                                                 Committed Liquidity Facility from 1st Jan 2020.
LCR COMPOSITION (AVERAGE)                                                                                 MOVEMENT IN AVERAGE LCR SURPLUS ($b)
1H20
$b
              209

        Internal RMBS

          Other ALA2
                                                                                                                     2H19                                                                1H20
            HQLA2
                                                                                                                Avg. LCR 143%                                                       Avg. LCR 139%

                                                                                                                                        28

                                                                                                                                                    -1
                                                    151
                                              Wholesale funding                                                                                                             0
                                                                                                                                                               -10
            HQLA1
                                                                                                                                                                                                      59
                                                                                                                   56
                                                                                                                                                                                        -8
                                             Customer deposits
                                                  & other3
                                                                                                                               -6

         Liquid Assets                        Net Cash Outflow                                                    2H19        CLF4    Liquid    Retail/SME   Corp/FI/   Wholesale    Other5         1H20
                                                                                                                LCR Surplus           Assets                   PSE       Funding                LCR Surplus

1. All figures shown on a Level 2 basis as per APRA Prudential Standard APS210. 2. Comprised of assets qualifying as collateral for the Committed Liquidity Facility (CLF), excluding internal RMBS,
up to approved facility limit; and any assets contained in the RBNZ’s liquidity Policy – Annex: Liquidity Assets – Prudential Supervision Department Document BS13A. 3. ‘Other’ includes off-
balance sheet and cash inflows. 4. RBA CLF decreased by $12.3b from 1 January 2020 to $35.7b (2019: $48.0b). 5. ‘Other’ includes off-balance sheet and cash inflows.
                                                                                                                                                                                                                            37
                                                                                                                                                                                     Not for distribution into the United States
TERM WHOLESALE FUNDING PORTFOLIO1

•    ANZ’s term funding requirements depend on market conditions, balance sheet needs and exchange rates, amongst other factors
•    RBA Term Funding Facility (TFF) Initial Allocation of ~$12b
•    ANZ estimates minimal senior debt term funding requirement for 2H20
ISSUANCE                                                                                                         MATURITIES
$b
                                  32
                                                                                                                           27
     24                                                                        24
                                                 22             22                                                                        21
                    19                                                                                                                                  18             18
                                                                                             12             13                                                                                          13
                                                                                                                                                                                       8

     FY14         FY15           FY16           FY17          FY18           FY19           1H20          2H20           FY21           FY22           FY23           FY24          FY25             FY26+
     Senior Unsecured            Covered Bonds             Tier 2       RMBS

PORTFOLIO                                                                                                        PORTFOLIO BY CURRENCY

                                                                                                                                 4%
             10%
                    2%
                                                                                                                      22%                                         Domestic (AUD, NZD)
       14%                                                                                                                                     38%
                                                   Senior Unsecured             Tier 2                                                                            North America (USD, CAD)

                                                   Covered Bonds                RMBS                                                                              UK & Europe (£, €, CHF, NOK)
                                                                                                                                                                  Asia (JPY, HKD, SGD, CNY)

                             74%
                                                                                                                            37%

1.    All figures based on historical FX and exclude AT1. Includes transactions with an original call or maturity date greater than 12 months as at the respective reporting date. Tier 2 maturity
      profile is based on the next callable date.                                                                                                                                                                                 38
                                                                                                                                                                                           Not for distribution into the United States
ANZ’S TIER 2 FY20 REQUIREMENT IS COMPLETE, PREFUNDING FY211

ANZ’S TIER 2 CAPITAL REQUIREMENT TO PROGRESSIVELY                                                                      TIER 2 CAPITAL
INCREASE TO MEET TLAC REQUIREMENT
                                                                                                                        Notional amount
•    Issued AUD $5.7b since July 2019 across AUD, EUR, and USD
                                                                                                                        By Format                                           By Currency
•    Current portfolio includes 29% in AUD (23% domestic AUD) – strong capacity
     remaining in AUD                                                                                                                                                                   4%
•    Issued AUD $3.6b in 1H20 completing FY20 issuance requirements                                                                                                             6% 5%                         USD
•    FY21 T2 issuance expected to be ~$5b                                                                                                     35%                                                             AUD Domestic
                                                                                                                                                           Bullet           15%
•    Required portfolio increase from $10.8b to ~$22b by January 2024 (based on 5%                                                                                                                47%         EUR
                                                                                                                                                           Callable
     of current RWAs2)                                                                                                                                                                                        AUD Offshore
                                                                                                                          65%
•    Planned issuance in multiple currencies in both callable and bullet format                                                                                                                               JPY
                                                                                                                                                                                  23%                         SGD
•    Increased T2 issuance expected to be offset by reduction in other senior
     unsecured funding
•    Well managed amortisation profile provides flexibility regarding issuance tenor

FUNDING PROFILE                                                                                                        CAPITAL AMORTISATION PROFILE3
    Notional amount, $m                                                                                                  $m
                                                              3,437                                                                                                               3,893
                                                   2,937
                                                                          2,282                                                                                       2,444

                                                                                                                                                1,368
                 831                                                                                                                1,068
                             674                                                                                                                            824
                                                                                      225         265                                                                                         456                    265
                                        131                                                                                                                                                               225
         0                                                                                                                 0
    2H20         FY21       FY22        FY23       FY24        FY25       FY26        FY27      FY28+                    2H20        FY21       FY22        FY23       FY24       FY25        FY26       FY27       FY28+

         Scheduled Bullet and Call Date Profile                                                                             Bullet Amortisation          Callable
    1.   Profile is AUD equivalent based on historical FX, excluding Perpetual Floating rate notes issued 30 October 1986 (which loses Basel III transitional relief in 2021). Any call is subject to APRA’s
         prior written approval and note holders should not expect approval to be given.
    2.   Current RWAs $437b as at 30 June 2020                                                                                                                                                                                       39
    3.   Amortisation profile is modelled based on scheduled first call date for callable structures and in line with APRA’s amortisation requirements for bullet structures.        NOT FOR  NotRELEASE      IN UNITED
                                                                                                                                                                                                  for distribution            STATES
                                                                                                                                                                                                                   into the United States
CAPITAL FRAMEWORK
CURRENT REGULATORY PROPOSALS AND RECENT REVISED IMPLEMENTATION DATES1

                                                                                                                                                 Original                      Revised
                                                            2019                          1H20                         2H20                   Implementation                Implementation
                                                                                                                                                   Date                          Date

RBNZ capital framework                                     Finalise                                                                                   2027                         20282

Leverage ratio                                                                                          Finalise                                      2022                          2023

Standardised approach to credit
                                                                       Consultation                                    Finalise                       2022                          2023
risk

Internal Ratings-based Approach to
                                                                                      Consultation                     Finalise                       2022                          2023
Credit Risk

Operational risk                                                                                        Finalise                                      2021                          2023

Fundamental Review of the Trading
                                                                                                     Consultation                                     2023                          2024
Book

Interest rate risk in the banking
                                                                       Consultation                                    Finalise                       2022                          2023
book

Loss absorbing capacity (LAC)3                                                         Transition                                                     2024                            -

Capital Treatment for Investments
                                                                                      Consultation                     Finalise                       2022                            -
in Subsidiaries (Level 1)

Associations with Related Entities                         Finalise                                                                                   2021                          2022

1.   Timeline is based on APRA’s 2020 Policy and Supervision Priorities (published January 2020) and revised following APRA’s deferral of capital reform implementation in response to COVID-19
     circumstances.
2.   7 year transition period from 1 July 2021. 3. Only in relation to the 3% of RWA increase in Total Capital requirements announced in July 2019.                                                                         40
                                                                                                                                                                                     Not for distribution into the United States
EUROPEAN COVERED BOND
       CONFERENCE 2020

               RISK MANAGEMENT

      AUSTRALIA AND NEW Z EALAND
           BANKING GROUP LIMITED

                     Not for distribution into the United States
RISK MANAGEMENT
LONG RUN PROVISIONS & LOSS RATES

TOTAL CREDIT IMPAIRMENT CHARGE
$m               Consumer IP             Institutional IP
                 Commercial IP           CP Charge / (Release)
1,800                                                                                                                                                                                                       1,674
1,500
1,200
 900
 600
 300
      0
 -300
          1H08    2H08       1H09     2H09    1H10     2H10   1H11   2H11    1H12       2H12     1H13   2H13    1H14   2H14   1H15    2H15   1H16    2H16   1H17   2H17   1H18   2H18    1H19      2H19     1H20

ANZ HISTORICAL LOSS RATES1
bps

              IP Loss Rate          Median Annual IP Loss Rate (excl. current period)
 250

 200

 150

 100

     50

      0
       Sep-                  Sep-                 Sep-               Sep-                 Sep-                 Sep-            Sep-                 Sep-           Sep-             Sep-                     Mar-
        90                    93                   96                 99                   02                   05              08                   11             14               17                       20

1.    IP as a % of average GLA
                                                                                                                                                                                                                               42
                                                                                                                                                                                        Not for distribution into the United States
RISK MANAGEMENT
INDIVIDUAL PROVISIONS & LOSS RATES

INDIVIDUAL PROVISION CHARGE                                                                 LONG RUN LOSS RATE (INTERNAL EXPECTED LOSS)
$m
          1,047                                                                             %
 892                   787
                                   554                                               626
           826                                                        380   398
                                              430         343
 922                                                             93                         Division        Mar-16 Sep-16 Mar-17 Sep-17 Mar-18 Sep-18 Mar-19 Sep-19 Mar-20
                       969
                                   812                                               807
                                              612         594               592
                                                                      532
           495
  229                  153         136         116         122              157       93    Australia        0.35   0.33   0.33   0.33   0.31   0.29    0.29       0.29       0.28
 -259     -274         -335        -394       -298        -373      -245    -351     -274

 1H16     2H16         1H17       2H17       1H18         2H18      1H19    2H19     1H20   New Zealand      0.25   0.26   0.26   0.22   0.21   0.19    0.19       0.18       0.19

  New      Increased          Writebacks & Recoveries
                                                                                            Institutional    0.37   0.36   0.35   0.30   0.32   0.27    0.27       0.25       0.25

INDIVIDUAL PROVISION CHARGE BY DIVISION                                                     Other            1.47   1.79   1.60   1.69   1.95   1.78    1.60       1.40       1.30
 $m       1,047
 892       82
                                                                                            Subtotal        0.34    0.33   0.33   0.30   0.30   0.27    0.27       0.26       0.26
 81                    787
           435         86                                                            626
 339                               554                                                1
                       210                                                                  Asia Retail      1.50   1.51   1.51   2.75    0      0        0          0           0
                                     79      430      343                    398
           61          61         55                                 380             272
  43                                              31 15 5
                                            34 28                   35 7    40 0 3    35
 429       469         430         453                                                      Total           0.37    0.35   0.35   0.32   0.30   0.27    0.27       0.26       0.26
                                              337         375         350   355      318
                                   -33                    -52         -12
 1H16     2H16         1H17       2H17       1H18         2H18      1H19    2H19     1H20

  Australia R&C    New Zealand            Institutional     Other

                                                                                                                                                                                              43
                                                                                                                                                       Not for distribution into the United States
RISK MANAGEMENT
COLLECTIVE PROVISION

COLLECTIVE PROVISION CHARGE                                                                                PROVISION BALANCE/COVERAGE RATIO
                                                                                                            BY STAGES ($m) AASB9
                                        AASB9
$m                                         1H19               2H19           1H20                           30 Sep-19                             31 Mar-20
CP charge                                     13               4             1,048
                                                                                                                  Coverage ratio by stage1          Coverage ratio by stage1
Volume/Mix                                    -28             -51              0
Change in Risk                                -40              19              17                                  1           2          3          1          2                  3

Economic outlook sensitivity                  73               17            1,031                              0.17%      2.40%       18.03%      0.20%      3.04%           20.77%
Other                                          8               19               0

COLLECTIVE PROVISION BALANCE
CP balance & coverage ($m)

                                                                                4,501

                                                      3,378         3,376
                                                                                                                                                                                  473
2,785         2,662        2,579         2,523                                                                                                                2,213
                                                                                                                                                   1,815
                                                                                                                                         434
                                                                                                                1,412      1,530
                                                                                                                                                                                 1,093
                                                                                1.17%
                                                     0.98%          0.94%
0.81%         0.79%        0.75%        0.75%                                                                                            814

Mar-17       Sep-17        Mar-18       Sep-18       Mar-19         Sep-19     Mar-20                           Stage 1   Stage 2       Stage 3   Stage 1     Stage 2          Stage 3

     CP Balance        CP/CRWA           CP Balance (AASB9)                                                       Stage 3 CP       Stage 3 IP
1.    Coverage ratio calculated as Provision Balance to Gross Loans & Advances for on-balance sheet exposures

                                                                                                                                                                                                           44
                                                                                                                                                                    Not for distribution into the United States
RISK MANAGEMENT
TOTAL PORTFOLIO COMPOSITION

                                                                                                                                                                  % of Portfolio in Non          Portfolio Balance
EXPOSURE AT DEFAULT (EAD) DISTRIBUTION                                                                  Category                    % of Group EAD
                                                                                                                                                                      Performing                in Non Performing
                                                                                                                              Mar-19    Sep-19     Mar-20       Mar-19    Sep-19     Mar-20             Mar-20
                 TOTAL GROUP EAD (Mar-20)
                                                                                         Consumer Lending                      38.8%     37.6%      34.6%         0.2%      0.1%      0.2%              $603m
                        = $1,075b1
                                                                                         Finance, Investment & Insurance       20.2%     20.3%      24.1%         0.1%      0.0%      0.0%               $78m

                            5.7%                                                         Property Services                      7.0%      7.0%      6.9%          0.3%      0.2%      0.3%              $208m

                                                                                         Manufacturing                          4.7%      5.1%      5.3%          0.3%      0.3%      0.2%              $137m

                                                                                         Agriculture, Forestry, Fishing         3.7%      3.6%      3.4%          1.1%      1.1%      1.1%              $397m

                                                                                         Government & Official Institutions     6.8%      7.3%      7.0%          0.0%      0.0%      0.0%               $0m
         2.9%                                           34.6%
                                                                                         Wholesale trade                        3.0%      3.0%      2.9%          0.3%      0.3%      1.2%              $380m

      7.0%                                                                               Retail Trade                           2.2%      2.2%      2.0%          0.7%      0.7%      0.9%              $191m

                                                                                         Transport & Storage                    2.1%      2.2%      2.2%          0.2%      0.3%      0.5%              $129m

      3.4%                                                                               Business Services                      1.6%      1.6%      1.6%          1.0%      1.0%      1.0%              $169m

                                                                                         Resources (Mining)                     1.6%      1.8%      1.8%          0.3%      0.2%      0.2%               $40m
        5.3%
                                                                                         Electricity, Gas & Water Supply        1.2%      1.3%      1.4%          0.1%      0.1%      0.1%               $16m

                                                                                         Construction                           1.3%      1.3%      1.2%          1.8%      1.7%      1.3%              $168m
               6.9%
                                                                                         Other                                  5.7%      5.8%      5.7%          0.4%      0.4%      0.4%              $229m

                                      24.1%                                              Total                                 100%      100%       100%                                                $2,745m

                                                                                         Total Group EAD1                      $968b     $977b     $1,075b

 1.   EAD excludes amounts for ‘Securitisation’ and ‘Other Assets’ Basel classes. Data provided is on a Post CRM basis, net of credit risk mitigation such as guarantees, credit derivatives, netting
      and financial collateral
                                                                                                                                                                                                                                 45
                                                                                                                                                                                         Not for distribution into the United States
RISK MANAGEMENT
INSTITUTIONAL & COMMERCIAL PORTFOLIO

                                                                                                                                                                                         Credit Related
EXPOSURE AT DEFAULT (EAD) DISTRIBUTION                                                                            Category                                      GLA                    Commitments and
                                                                                                                                                                                         Contingencies

                           EAD (Mar-20)                                                                                                                         ($b)                            ($b)
                             = $703b1                                                      Finance, Investment & Insurance                                       73                              48
                                                                                           Property Services                                                     12                               7
                       9.1%                                                                Manufacturing                                                         31                              46
                                                                                           Agriculture, Forestry, Fishing                                        31                               4
              2.1%
            2.7% 1.8%                                                                      Gvt & Official Institutions                                           4                                3
          2.4%
                                                  36.4%                                    Wholesale trade                                                       19                              22
        3.4%
                                                                                           Retail Trade                                                          15                               8
       3.0%                                                                                Transport & Storage                                                   16                               9

       4.5%                                                                                Business Services                                                     53                              20
                                                                                           Resources (Mining)                                                    9                               14
                                                                                           Electricity, Gas & Water Supply                                       7                                8
           10.7%
                                                                                           Construction                                                          9                                7
                                                                                           Other                                                                 50                              20
                   5.2%                  10.6%
                                                                                                TOTAL                                                           329                             216
                             8.0%

                                                                                                                                    Sep-16          Sep-17             Sep-18        Sep-19             Mar-20
                                                                                    Investment grade % of EAD                        65%              66%               69%            71%               74%
                                                                                    CRWA / EAD                                       46%              42%               40%            41%               39%
                                                                                    IEL as a % of GLA                               0.45%            0.40%             0.37%          0.35%             0.34%

 1.   EAD excludes amounts for ‘Securitisation’ and ‘Other Assets’ Basel classes. Data provided is on a Post CRM basis, net of credit risk mitigation such as guarantees, credit derivatives, netting
      and financial collateral
                                                                                                                                                                                                                                 46
                                                                                                                                                                                         Not for distribution into the United States
RISK MANAGEMENT
ANZ INSTITUTIONAL PORTFOLIO

INSTITUTIONAL PORTFOLIO SIZE & TENOR BY COUNTRY                                                                     ANZ INSTITUTIONAL INDUSTRY COMPOSITION
OF INCORPORATION1 (EAD2)
                                                                                                                     EAD (Mar-20): A$529b2
 $b                                                                                                                                                             Finance (Banks and Central Banks)

                                                                                                                          24%                                   Government Admin.
500                                                                                                                                                             Services to Fin. & Ins.
                                                                                                                                               34%
450                                                                                                                                                             Property Services3
                                                                                                                             2%                                 Basic Material Wholesaling
400            45%                                                                                                      3%                                      Machinery & Equip Mnfg
                                                                                                                       3%
                                                                                                                        3%                                      Electricity & Gas Supply
350
                                                                                                                            8%                                  Petroleum Coal Chem & Assoc Prod Mnfg
                                                                                                                                           14%
300                                                                                                                               9%                            Other⁴

250                                   33%
                                                                                                                    ANZ INSTITUTIONAL PRODUCT COMPOSITION
200
                                                                                                                     EAD (Mar-20): A$529b2
150            55%
                                                              22%                                                               15%                               Loans & Advances
100                                   67%                                                                                                      25%
                                                                                                                          1%                                      Traded Securities (e.g. Bonds)

50                                                            78%                                                                                                 Contingent Liabilities & Commitments
                                                                                          15%                           15%                                       Trade & Supply Chain
                                                                                  85%
 0                                                                                                                                                                Derivatives & Money Market Loans
      Total Institutional            APEA5                    Asia                   China
                                                                                                                                                                  Gold Bullion
                                                                                                                           9%                   20%
                                                                                                                                                                  Other
      Tenor < 1 Yr          Tenor 1 Yr+
                                                                                                                                   15%
 1.   Country is defined by the counterparty’s Country of Incorporation
 2.   EAD excludes amounts for ‘Securitisation’ & ‘Other Assets’ Basel classes. Data provided is on a Post CRM basis, net of credit risk mitigation such as guarantees, credit derivatives, netting & financial collateral
 3.   ~90% of the ANZ Institutional “Property Services” portfolio is to entities incorporated in either Australia or New Zealand
 4.   Other is comprised of 47 different industries with none comprising more than 2.1% of the Institutional portfolio                                                                                                           47
 5.   APEA: Asia, Pacific, Europe & America                                                                                                                                               Not for distribution into the United States
RISK MANAGEMENT
SEGMENTS OF INTEREST

                                    Commercial Property                                                                                          Resources

                                     GLAs by Region ($b)                                                                           Exposure at Default (EAD) ($b)
                                                                                                                                                                                    17.3
                                                                                                                              16.1                                15.3            0.8
                                                                                 46.5                       20.0            1.2                14.0
                                                               42.9                            14                                                               0.7               0.7                 18.9
                                              42.4                                2.4                     1.7               0.4              0.8
                            40.2                                                                                0.6                                             0.7               1.0               0.8          0.6
          37.6                                 2.8              2.8                            12                           1.1              0.3
                             2.9                                                  11.4                    1.3                                                   0.9                                      1.0
           3.0                                                  10.5                                         2.9                             1.0                                                    1.6
                                               10.7                                            10                                                                                   1.5
                             9.8
           9.7                                                                                                                   1.7                              1.2
                                                                                               8               4.9                               1.4                                                  6.4
                                                                                                                                                                                    5.2
                                                                                                                                 4.0                              4.4
                                                                                               6                                                 3.5
                                                                29.6              32.7
                            27.5               28.9                                            4
           24.9
                                                                                                               8.6               7.8                              7.4               8.2               8.5
                                                                                               2                                                 7.0

                                                                                               0
          Mar-18           Sep-18             Mar-19          Sep-19             Mar-20                       Sep-15            Sep-16          Sep-17           Sep-18            Sep-19            Mar-20
          APEA1       New Zealand        Australia        % of Group GLA (RHS)                                Oil & Gas Extraction        Services to mining        Metallurgical Coal Mining
                                                                                                              Metal Ore Mining            Other Mining              Thermal Coal Mining

                                     GLAs by Sector (%)                                                                           Thermal Coal Exposure EAD ($b)

 100                                                                                                2.0
                                                                                 Offices
     80                                                                          Retail             1.5

     60                                                                          Industrial         1.0
                                                                                 Residential
     40                                                                                             0.5
                                                                                 Tourism
     20                                                                                             0.0
                                                                                 Other
                                                                                                     Sep-15            Sep-16          Sep-17          Sep-18            Mar-19            Sep-19           Mar-20
           Mar-18      Sep-18       Mar-19       Sep-19      Mar-20

1.    APEA: Asia, Pacific, Europe & America
                                                                                                                                                                                                                            48
                                                                                                                                                                                     Not for distribution into the United States
EUROPEAN COVERED BOND
       CONFERENCE 2020

              HOUSING PORTFOLIO

      AUSTRALIA AND NEW Z EALAND
           BANKING GROUP LIMITED

                     Not for distribution into the United States
AUSTRALIA HOME LOANS
PORTFOLIO OVERVIEW

                                                         Portfolio1                             Flow2                                                                                                  Portfolio1

                                               1H18          1H19           1H20          1H19           1H20                                                                                1H18           1H19          1H20
Number of Home Loan                                                                                                   Average LVR at Origination7,8,9                                          68%           67%            68%
                                              1,018k        1,000k           971k           64k3          64k3
accounts1
                                                                                                                      Average Dynamic LVR (excl. offset)8,9,10                                 55%           56%            56%
Total FUM1                                     $271b         $269b         $264b           $21b           $23b
                                                                                                                      Average Dynamic LVR (incl. offset)8,9,10                                 50%           51%            51%
Average Loan Size4                             $266k         $269k         $272k          $375k         $382k
                                                                                                                      Market Share (MBS publication)11                                      15.8%         15.1%              n/a
% Owner      Occupied5                           65%           66%            68%           73%           69%
                                                                                                                      Market share (MADIS publication)                                           n/a           n/a       14.1%

% Investor5                                      32%           31%            30%           26%           30%         % Ahead of Repayments12                                                  71%           71%            76%

% Equity Line of Credit                            3%            3%            2%             1%            1%        Offset Balances13                                                       $27b           $27b          $28b

                                                                                                                      % First Home Buyer                                                         7%            7%             8%
% Paying Variable Rate Loan6                     83%           82%            85%           73%           87%
                                                                                                                      % Low Doc14                                                                4%            4%             3%
% Paying Fixed Rate Loan6                        17%           18%            15%           27%           13%
                                                                                                                      Loss Rate15                                                           0.02%         0.04%          0.03%
% Paying Interest Only                           26%           18%            12%           12%           13%
                                                                                                                      % of Australia Geography Lending16,17                                    64%           63%            59%

% Broker originated                              51%           52%            52%           57%           49%         % of Group Lending16                                                     46%           44%            40%

1. Home Loans portfolio (includes Non Performing Loans, excludes Offset balances) 2. YTD unless noted 3. New accounts includes increases to existing accounts and split loans (fixed and variable components of the same loan)
4. Average loan size for Flow excludes increases to existing accounts (note the average loan size previously reported in 1H18 and prior included increases to existing accounts) 5. The current classification of Investor vs Owner
Occupier is based on ANZ’s product category, determined at origination as advised by the customer and the ongoing precision relies primarily on the customer’s obligation to advise ANZ of any change in circumstances. 6.
Excludes Equity Manager Accounts 7. Originated in the respective year 8. Unweighted based on # accounts 9. Includes capitalised LMI premiums 10. Valuations updated to Feb-20 where available. Includes Non Performing
Loans and excludes accounts with a security guarantee and unknown DLVR 11. APRA Monthly ADI Statistics to Feb-20 – Note APRA changed the underlying market share definition in Jul-19 and historical periods (1H18 & 1H19)
are not comparable to 1H20 12. % of Owner Occupied and Investment Loans that have any amount ahead of repayments. Based on excess repayments based on available Redraw and Offset. Excludes Equity Manager Accounts.
Includes Non Performing Loans 13. Balances of Offset accounts connected to existing Instalment Loans 14. Low Doc is comprised of less than or equal to 60% LVR mortgages primarily for self-employed without scheduled PAYG
income. However, it also has ~0.1% of less than or equal to 80% LVR mortgages, primarily booked pre-2008 15. Annualised write-off net of recoveries 16. Based on Gross Loans and Advances 17. Australia Geography includes                              50
Australia Division, Wealth Australia and Institutional Australia                                                                                                                                                 Not for distribution into the United States
AUSTRALIA HOME LOANS
PORTFOLIO GROWTH

HOME LOAN FUM COMPOSITION1,2                                                                                     LOAN BALANCE & LENDING FLOWS1
$b                                                                                                                $b
             271                              269                                                                                                                         15
                                                                               264                                                      27
              9                                8                                7                                      269                                0                                               264

              43                               31                              22                                                                                                         -47
                                                                                10
                                               17
              29
                                                                                57
                                               52
              44                                                                                                    Mar-19         New Sales Net OFI Refi            Redraw &           Repay            Mar-20
                                                                                                                                  excl. Refi-In                       Interest         / Other

                                                                                                                 MARKET SHARE3
                                                                                                                  %

                                              161                              168                                              14.7%                                                            14.3%
             146                                                                                                       15.1%                                    13.4%
                                                                                                                                     14.5%             13.8%                           14.6%          14.1%
                                                                                                                                                                     13.3%

           Mar-18                           Mar-19                           Mar-20                                              OO                              INV                             Total
     OO P&I          Inv P&I         OO I/O          Inv I/O         Equity Manager                                    Mar-19         Sep-19          Feb-20
1.   Based on Gross Loans and Advances. Includes Non Performing Loans
2.   The current classification of Investor vs Owner Occupied is based on ANZ’s product category, determined at origination as advised by the customer and the ongoing precision relies primarily on
     the customer’s obligation to advise ANZ of any change in circumstances
3.   Source: APRA Monthly Authorised Deposit-Taking Institutions Statistics (MADIS) to Feb-20                                                                                                                               51
                                                                                                                                                                                     Not for distribution into the United States
You can also read