EAGLE RIVER VALLEY HOUSING NEEDS AND SOLUTIONS 2018
←
→
Page content transcription
If your browser does not render page correctly, please read the page content below
EAGLE RIVER VALLEY
                         HOUSING NEEDS AND SOLUTIONS 2018

http://www.eaglecounty.us/housing/
PREPARED BY

            Willa Williford
            303-818-0096
      willa@willifordhousing.com

IN TEAM WITH

 II                                Rees Consulting, Inc. / Willliford, LLC
INTRODUCTION

                                      Purpose                                              1
                                      The Eagle River Valley Defined                       2
                                      What is Affordable?                                  3
                                      What is the Difference Between Housing Need          4
                                      and Market Size?
                                      Key Findings & Policy Considerations                 5

                                  PART I - CURRENT CONDITIONS, TRENDS, AND HOUSING
                                  NEEDS UPDATE

                                      Current Conditions                                  10
                                      Who We Are and Where We Live                        13
                                      Trends in Housing and Job Markets                   17
                                      Housing Demand Update                               25
                                      What is Behind the Numbers?                         28

                                  PART II - HOUSING SOLUTIONS

                                      Ownership Housing - Design & Development            33
                                      Rental Housing Development & Design                 46
                                      Housing Tools                                       54

                                  APPENDICES

                                      Appendix A - Acknowledgements & Contributions       62
                                      Appendix B - Area Median Family Income & Purchase   63
                                      Prices
                                      Appendix C - Home Sales by Zip Code                 64
                                      Appendix D - Methodology & Sources                  66
                                      Appendix E - Survey Definitions of Tools            72

Rees Consulting, Inc. / Willliford, LLC                                                        III
INTRODUCTION

Purpose
The goal of this report is three-fold:

   1) Provide current context on people, jobs, and housing markets in the Eagle River Valley;
   2) Update the housing demand calculations and projections that have been used consistently over the
      past 11 years; and
   3) Inform housing policy and implementation by providing up to date information on what local house-
      holds and employers need: their housing goals and intentions, the tradeoffs they are willing to make,
      and solutions that are likely to be the most well received.

This report is organized in two parts:

           PART I                                               PART II

   PART ONE is the Housing Needs Update,                  PART TWO provides guidance on moving
   which begins with current data on the valley’s         forward with housing solutions: key
   population, jobs, and the housing market. It           considerations policy makers need to know,
   measures the problem of workforce housing              where to build housing, how to design it,
   in terms of perceptions and impacts on                 appropriate price ranges, and what tools
   households and provides the metrics that               should be prioritized.
   are the foundation for the need update.
   Part I concludes with the demand update
   calculations.

 Rees Consulting, Inc. / Willliford, LLC                                       INTRODUCTION          1
INTRODUCTION
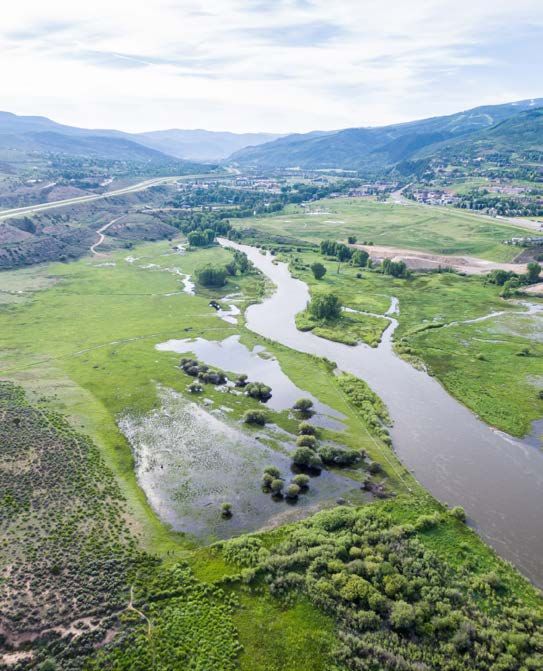
Eagle River Valley Defined
The study area is the Eagle River Valley, from Vail to Dotsero. While the entire valley is socially, economically,
and geographically connected, there are three distinct market areas, which are defined as:
• Up Valley, which includes the towns of Vail, Minturn, and Red Cliff.
• Mid Valley, which includes Eagle Vail, Avon, and Edwards.
• Down Valley, which includes Wolcott, Eagle, Gypsum, and Dotsero.
Burns, Bond, and McCoy are not included. Basalt and El Jebel are covered by a separate study for the
Roaring Fork Valley.
2 INTRODUCTION Rees Consulting, Inc. / Willliford, LLC
WHAT IS AFFORDABLE HOUSING IN THE
       EAGLE RIVER VALLEY?
       This report centers on an understanding of “what is affordable?” Housing affordability is a
       function both of the cost of housing and household income. Housing is generally considered to
       be affordable when the monthly payment (rent or mortgage) is equal to no more than 30% of a
       household’s gross income. Although there is some variation, this standard is commonly applied
       by federal and state housing programs, local housing initiatives, mortgage lenders and rental
       leasing agents.

Incomes are typically expressed as a percentage of the median, which is abbreviated in this report
as AMI (Area Median Income). The following table provides the incomes for each AMI category with the
corresponding affordable price for housing, each representing the maximums for each range.
Interest rates have a profound impact on housing affordability. These price points assume an interest
rate of 5%. Interest rates are likely to rise going forward and a one point increase in the rate lowers the
affordable purchase price for a 100% AMI household by $30,000 to $35,000.

                   MAXIMUM AFFORDABLE RENTS AND PURCHASE PRICES BY AMI
                                  EAGLE VALLEY - 2017

                                 AMI %                                    60%           100%       140%       200%
              Household Income – 3 persons                            $48,360          $80,600    $112,840   $161,200
              Max Affordable Purchase price                           $190,000         $316,000   $443,000   $632,000
                  Max Affordable Rent                                  $1,210           $2,420     $2,820     $4,030
        Source: CHFA, consultant team. Full calculations are provided in Appendix C.

 Rees Consulting, Inc. / Willliford, LLC                                                            INTRODUCTION        3
WHAT IS THE DIFFERENCE BETWEEN
HOUSING NEED AND MARKET SIZE?
Housing Need
Part I of this report calculates the need for additional housing based on a method pioneered by Rees
Consulting, Inc and RRC Associates in the 1990’s to address the question:

        “How many additional housing units are needed to address housing problems
        and provide a sufficient labor force to sustain the economy?”

This measurement is a key component of Housing Needs Assessments. It quantifies needs in two categories:

                       “CATCH-UP”                                         “KEEP-UP”
                   Additional housing units                        Additional units needed in
                   needed now to address                             the future to fill jobs
                     existing problems

Need is used for many purposes including setting of goals and objectives for housing, strategic and land use
planning, allocation of resources, establishing funding sources and developing tools to comprehensively
address needs.

Market Size
Part II provides a traditional method for analyzing housing markets used primarily by developers (private,
non-profit and public), lenders and investors for specific ownership and rental housing developments. This
measurement is a standard part of project-specific market studies. It represents the market from which a
proposed housing development will draw its owners or renters. It is used to determine if projects are feasible
and to gauge risk. Market size addresses the question:

            “Is there a sufficient market for the proposed units to be sold or rented?”

After quantifying the total number of households that comprise the market, Part II of this report segment
that market by income, household type and size, and housing and location preferences to inform decisions
about location, unit type, bedroom mix, pricing and amenities.
While some lenders may allow market analysts to consider in migration and population growth in estimates,
a more straightforward and conservative method, like used by CHFA, considers only existing households. It
is assumed that, with growth, demographics and preferences will remain much the same. In market analysis
it is not necessary to consider households that might move in unless major events, like a large tech company
moving into a resort community, are planned.

    4       INTRODUCTION                                               Rees Consulting, Inc. / Willliford, LLC
KEY FINDINGS AND POLICY CONSIDERATIONS
Since the end of the recession, around 2011, jobs and population have been growing much more rapidly than
housing inventory, and with that has created many challenges:
   •   frustration for employees seeking housing,
   •   employers facing unfilled positions, high turnover, higher training costs, and
       lost productivity,
   •   precipitously increase in home prices, well beyond the means of most local
       residents, and
   •   extremely low vacancy rates, resulting in limited choices and rising costs for
       renters.
If forecasts prove accurate, these tensions are poised to increase, with about 7,150
new jobs coming to the Eagle River Valley by 2025. Mid valley is anticipated to have the
most new jobs, but up valley is not far behind. If the economy remains strong and and
no new housing is created, these growth pressures will translate into higher numbers
of unfilled jobs and continued rapid escalation of housing prices. Another approach is
to create new housing for the additional employees and their families who fill these
jobs.
According to Office of State Demography projections, these new households are
anticipated to live more often in mid valley and down valley markets, adding to the
eastbound morning commute pattern. These assumptions align with recent growth patterns and future
opportunities, and policymakers are poised to make decisions that can influence the course of future housing
growth.

Housing Need
Responding to the demand demonstrated in this re-         sive to community values and vision. Making any
port is a matter of local public policy, which should     progress, or just staying even, in producing housing
be driven by local goals and objectives. Creating new     affordable for the local workforce in a market with
housing happens through a complex set of drivers          gaps as large as those found in the Eagle River Valley
and constraints including available land, land use        requires a consistent, incremental, multi-pronged
policy, developer interest and capacity, financial fea-   approach. The communities of the Eagle River Valley
sibility, and local subsidies and requirements. The       have many significant accomplishments in the realm
high cost of taking no action on workforce housing
                                                          of workforce housing, and renewed commitment
has consequences for individuals and families, the
                                                          and continued work are essential moving forward.
economy, civic engagement, and overall community
character and sense of genuine place.                     The communities that make up the Eagle River Val-
When setting policy goals and direction for housing       ley are well-positioned to work on housing goals and
locals, communities rarely target achieving 100% of       strategies that are tailored specifically to individual
the catch-up and keep-up demand estimates, nor are        communities, as well as to collaborate on region-
resources likely available to achieve 100% of the gap.    al solutions. Both local and regional approaches
Rather, it is incumbent upon policymakers to use the      are warranted and necessary to create diverse and
data in this report to set goals that are an appropri-    long-lasting housing solutions for the local work-
ate blend of aspirational, attainable, and respon-        force.

  Rees Consulting, Inc. / Willliford, LLC                                          INTRODUCTION            5
KEY FINDINGS AND POLICY CONSIDERATIONS
Ownership Housing
Based on the conclusions drawn from the resident                a necessity for most unit types and price points.
survey, policy makers should keep the following pri-            Fortunately, deed restrictions are widely accept-
orities and considerations in mind when shaping pol-            ed by consumers.
icy strategies around home ownership housing:          •        One third of current homeowners would like to
• Ownership housing in proximity to work has                    move within the valley in the next five years. If
    many tangible and intangible benefits associat-             an owner buys a new/different residence and
    ed with creating a sense of place and community,            their current free market home is purchased by
    stability for school children and employers, year-          second home owner or inventor for short term
    round contributions to the economy, decreased               rentals, there is no net improvement in the rela-
     commute times and increased volunteerism.                  tionship between supply and demand for local
•   Local households, both owners and renters, have             residents.
    an overwhelming desire to remain or become              •    Moving owners into new homes could be a
    homeowners, regardless of income.                            component of a housing strategy that would
•   A diversity of attached and detached housing                 support mixed income developments and fo-
    product is needed, with a range of price points,             cus on building neighborhoods.
    upgrade options and amenities.                          •    Preserving the homes that will be sold as pri-
•   Affordability is the key obstacle for locals seeking         mary residences when providing new home op-
    to buy in the Eagle River Valley. Numerous tools             portunities could be considered, including buy
    will be needed to overcome the affordability gap             downs or other incentives to place deed restric-
    for most locations and product types.                        tions on homes being sold.

• Affordability and location are the highest priori-  • Also, owners of deed restricted units could be
  ties for buyers. If homes are located in desirable     given priority for new ownership opportunities,
  communities and priced affordably, buyers will         which  would create movement in the deed-re-
  make tradeoffs on unit type and size. Regardless       stricted inventory.
  of where in the valley buyers are seeking to live, • Availability of funds for down payment is key to
  community character is the most important lo-        making sure that renters with the desire to pur-
  cation attribute local households consider – un-     chase a home and stay in the Eagle River Valley
   derscoring the need to integrate housing efforts    are able to do so when a home affordable to
   in comprehensive community planning and that        them becomes available. For this reason, local
   preserves and enhances sense of place, locals       communities should continue to support the Ea-
   or family-orientation, social opportunities, and    gle County down payment assistance program,
   proximity to services and entertainment.            which has a strong track record in assisting local
• Given the significant gap between the market         households.
  and what locals can afford, deed restrictions are

                          “A key to addressing the housing challenge is political will.”
                                                                                           -2018 Survey Respondent

    6        INTRODUCTION                                                  Rees Consulting, Inc. / Willliford, LLC
KEY FINDINGS AND POLICY CONSIDERATIONS
Rental Housing
While most renters in the Eagle Valley would prefer to   •   Up valley and mid valley should be the priori-
own, rental housing is an important component of a           tized for new rental development, as 82% of cur-
healthy housing ecosystem. Most renters will not be          rent renters prefer those locations.
able to afford ownership in the near term, and rental    •   Renters, especially those with low wages are
housing is needed for new employees recruited into           price sensitive, and proximity to work is their
the community. Building additional rental housing            most important locational attribute. Jobs within
should continue to be part of local housing policy           the market area and what rental price points are
goals, especially in consideration of the current ex-        appropriate for households making those wag-
treme low vacancy, escalating rental rates, and high         es should be considered when siting new rental
levels of cost burden among renters.                         housing.

Housing Tools
Both local and regional approaches are warranted and necessary to create
diverse and long-lasting housing solutions for the local workforce. The
communities that make up the Eagle River Valley are well positioned to work             “We need the County
on housing goals and strategies that are tailored specifically to individual                  - Commissioners
communities, as well as to collaborate on regional solutions.                               and Staff - to take
                                                                                              a leadership role
Part I reported on the nearly unanimous agreement among employers and
                                                                                            in addressing this
residents that workforce housing is a problem in the Eagle Valley, and those
                                                                                                'perfect storm',
sentiments carry forward in employers and resident’s overall enthusiasm for
                                                                                                with innovative
tools that contribute to workforce housing solutions in Part II. When considering
                                                                                              approaches, and
local and regional tools and how they could be formulated into housing
                                                                                         with commitment to
strategies, policymakers would be well-advised to begin with the tools that
                                                                                        seeking partnerships
received the most support from employers and residents:
                                                                                                  and solutions
   1. Providing town/county land for workforce and local residents’                          that will, year-by-
      housing.                                                                                 year, bridge the
                                                                                            gap in attainable,
   2. Providing public financing through the towns, County, or housing                   sustainable housing.
      authority.                                                                          This 'housing' must
   3. Fast track processing of land use proposals that include workforce                   meet the needs of
      housing.                                                                         year-round employees
   4. Towns or County taking the lead in building housing, which could be               and entrepreneurs in
      as developer or as lead on public/private partnerships.                             our valley - not just
                                                                                           seasonal workers.”
   5. Inclusionary housing, which requires new residential development
      to contribute to the workforce housing inventory.                                          -2018 Survey
   6. Commercial linkage, which requires new commercial development to                            Respondent
      contribute towards workforce housing based on the need for housing
      for the employees of the new jobs generated.

 Rees Consulting, Inc. / Willliford, LLC                                            INTRODUCTION           7
KEY FINDINGS AND POLICY CONSIDERATIONS
These tools represent a balanced mix of funding, The tools chapter also provides data on where
partnerships, incentives, and regulations. They are among the three market areas the tools received
some of the more aggressive tools in the affordable more and less support, which should be helpful as
housing toolkit, which reflects the urgency of the is- communities consider local and valley wide housing
sue and a good level of knowledge and acceptance of strategies. Several themes point toward the relevan-
these tools by residents and employers. Of particu- cy of a valley-wide housing strategy:
lar note is the desire for local municipalities and the • Several tools including providing town/Coun-
County to lead housing efforts. Local government is a ty land and inclusionary zoning received strong
key player in all six of the most frequently supported support valley-wide.
strategies.
• Support for housing tools was strong across
Perhaps because they experience the day to day households of all incomes ranges.
challenges of hiring and retaining employees in the
• Learning best practices from each other, devel-
current jobs/housing environment, employers rated
oping regional approaches, and strengthening
more strategies highly, including:
cooperation were consistently expressed in the
• Fee waivers for water, sewer, and other impact open-ended questions.
fees.
• Partnerships with employers offer promising op-
• Excise tax on short term rentals. portunities. Both small and large employers ex-
• Density bonuses for inclusion of workforce hous- press interest in investing in workforce housing
ing. and expanding the housing opportunities they
currently offer.
While considered slightly lower priority by residents,
Communities within the valley have a long history of
these tools may be appropriate components of the
successful workforce housing initiatives and many
housing strategies for some communities.
have used different housing tools at different times,
It is clear that local communities would be wise to including public private partnerships, land trades,
create some momentum and build upon success- annexation agreements, inclusionary housing, com-
es before seeking any dedicated funding streams mercial linkage fees, and leverage of local funds to
through a new tax (with the possible exception of match outside investments in housing. There is op-
short term rental excise tax). Property tax exemp- portunity to build upon these successes (as well as
tion, sales tax, and property tax make up three of the incorporate lessons learned) to create a more consis-
five least supported strategies. tent, unified approach going forward.
8 INTRODUCTION Rees Consulting, Inc. / Willliford, LLCPART I Current Conditions, Trends, and Housing Needs Update Rees Consulting, Inc. / Willliford, LLC PART I 9
CURRENT CONDITIONS

What Housing Problem?
We asked survey respondents about their perceptions of housing as a problem, by asking:

          “Do you feel that the availability of housing that is affordable for the workforce in
          the Eagle River Valley is…”

Their response was emphatic: it’s a big problem.
     •    A remarkable 91% of household survey respondents felt that the lack of availability of housing that is
          affordable to the workforce in the Eagle River Valley is one of the most serious problems or the most
          critical problem in the region.
     •    And, 85% of employers felt that the lack of availability of housing that is affordable to the workforce in
          the Eagle River Valley is one of the most serious problems or the most critical problem in the region.
     •    No employers responded that it is “not a problem” or “a lesser problem.”

Source: 2018 employer survey, 2018 household survey.

There is strong consensus valley-wide that housing affordability is a serious or critical problem.
A full 99% of renters feel that this is one of the more serious or the most critical problem in the region, and
84% of owners feel the same way.

     10           PART I                                                    Rees Consulting, Inc. / Willliford, LLC
CURRENT CONDITIONS
"The most common
concern you hear
from regular
blue collar hard
working adults like
myself is, how bad
the housing is here.
It’s time to make a
change."
-2018 Survey
Respondent
Source: 2018 household survey
Mid valley respondents where slightly more likely to perceive the problem as “more serious” or “most critical”
than their up valley and down valley neighbors; 94% compared to 89% for up valley and 88% for down valley.
Source: 2018 household survey.
Rees Consulting, Inc. / Willliford, LLC PART I 11CURRENT CONDITIONS
Perceptions of severity have some variation by income: combined responses for “serious” and “most critical”
range from between 82% and 97%, with lower income households tending to have higher severity ratings.
Interestingly, 92% of households over 200% AMI also felt it was “serious” and “most critical.”
Source: 2018 household survey
"Frustration with housing continues to grow and moved in a negative direction from
2015-16. Negative opinions about housing are higher than ever found in the history
of conducting the survey. Almost three out of four businesses feel that the housing
situation negatively impacts their ability to hire and retain employees and this issue
was mentioned frequently when asked about additional resources that are needed."
-Vail Valley Partnership: 2017 Workforce Survey Report
12 PART I Rees Consulting, Inc. / Willliford, LLCWHO WE ARE AND WHERE WE LIVE
Household Characteristics
MID VALLEY
DOWN VALLEY UP VALLEY
of the Valley's
of the Valley's Year-Round of the Valley's
Year-Round 45% Year-Round
34% Households are 21%
Households are Located Here Households are
Located Here Located Here
Homes Occupied
Homes Occupied 61% Homes Occupied
90% Year-Round 41%
Year-Round Year-Round
Source: 2018 household survey Source: 2018 household survey
Rees Consulting, Inc. / Willliford, LLC PART I 13WHO WE ARE AND WHERE WE LIVE
Looking at the demographics of the Eagle River Valley, some of the distinctions and similarities
between the three market areas begin to emerge, as well as the reasons the workforce housing
shortage is being felt so acutely at this time.
Across the valley, the average household size is 2.9 people. Each household has an average of
1.8 employed persons, and each employed person has an average of 1.24 jobs. These metrics are
used throughout the demand calculations.
Mid valley is home to the most year-round residents, however, down valley has been adding year-
round households more rapidly since 2010. The demand for second homes and the percentage
of homes occupied by full time residents is one of the defining distinctions between the three
markets.
The three market areas have a number of distinctions with regard to household composition and
age of residents.
• Mid and down valley are home to a higher percentage of households with children and
adults in the prime working years of 30-64.
• Looking at the presence of children in the household provides a striking contrast: only 17% of
households up valley have children present, while almost half (48%) of down valley households include
children.
• Down valley has larger households, especially those with four or more individuals.
• Up valley is home to proportionally more adults living alone, roommates, millennials, individuals over 65 and
extended/multigenerational households.
• All three market areas have similar 22-26% of couples without children.
Source: 2018 household survey
I dislike the terms
"employee housing"
and "workforce
housing;" we are the
people who choose
to live here year-
round and make the
valley have viable
communities. We are
more than employees
-- we are parents,
teachers, business
owners, service
providers; we are
“And it doesn't matter if you are up or down valley anymore -- we would raising families.
be paying the same mortgage in Eagle or Gypsum that we are currently
paying in Eagle-Vail but would also be commuting our children and -2018 Survey
ourselves daily, adding to I-70 traffic and our monthly expenses.” Respondent
-2018 Survey
14 PART I Rees Consulting, Inc. / Willliford, LLCWHO WE ARE AND WHERE WE LIVE
Incomes and Tenure
Mid and down valley have similar distribution of incomes, while up valley is home to a higher proportion of
households with incomes below 60% AMI and above 200% AMI.
Source: 2018 household survey.
The majority of renters (58%) have incomes below the median income. As incomes increase, households
become more likely to own. About 23% of renters have incomes at or above 140% AMI. These households
may have formerly been considered “renters by choice,” but may be priced out of homeownership in the
current market.
Source: 2018 household survey.
Rees Consulting, Inc. / Willliford, LLC PART I 15WHO WE ARE AND WHERE WE LIVE
Down Valley Mid Valley Up Valley
34% Rent 46% Rent 62% Rent
66% Own Own
54% 38% Own
OVERALL
45% Rent
55% Own
Source: 2018 household survey.
Ethnicity
Hispanic households make up about a third of year-round residents in mid and down valley, while the
percentage of Hispanic households in up valley is much smaller at only 13%.
Down Valley Mid Valley Up Valley
30% Hispanic 34% Hispanic 13% Hispanic
70% Non- 66% Non- 87% Non-
Hispanic Hispanic Hispanic
Source: 2018 household survey.
16 PART I Rees Consulting, Inc. / Willliford, LLCTRENDS IN HOUSING AND JOBS MARKETS
Housing Shortage and the Economy “Those of us keeping this
The housing shortage negatively impacts employers in terms of employee valley operating working
retention, business development and growth. In 2017, unemployment in in retail, hospitality, and
Eagle County was 2.2%, the lowest level since 2000. This situation leaves ski resort operations do
very few employees living in the valley to fill positions. High housing costs not make a huge income.
and a predominance of low wage, tourism industry jobs exacerbate the Yet, without us, the valley
challenge because employers have difficulty attracting and retaining wouldn’t survive. Keep us
employees from beyond the Valley. here.”
• An estimated 1,600 jobs remained unfilled, heading into the peak -2018 Survey Respondent
winter season of 2017/2018.
• Jobs are remaining unfilled for longer periods of time. Last year 43%
of jobs remained open for more than a month, compared to 18% of “I came here for adven-
jobs five years ago, according to the Vail Valley Partnership - 2017 ture, opportunity, and
Workforce Survey Report. in hopes of making Vail
Valley my home. In four
• As is common in resort areas, the largest employment sectors are years, I’ve been hit with
accommodations, food, and retail. the harsh reality that a
• Eagle River Valley employees have a weekly wage $220 lower than single adult has no chance
employees in Colorado overall. to truly make a home
here. I have no children
• The fastest growing occupations will continue to be in the and work tireless hours to
accommodations, food service, and retail sectors, including simply pay rent.”
waiters and waitresses, retail sales clerks, food preparation, and
housekeeping. These jobs typically pay wages below $31,000/year, -2018 Survey Respondent
or about 50% AMI for a single person.
Source: QCEW 2016
Rees Consulting, Inc. / Willliford, LLC PART I 17TRENDS IN HOUSING AND JOBS MARKETS
An estimated 1,200 employees in the Eagle River Valley intend to retire in the next five years, and most of
these retirees will stay in the valley. New employees needed to fill those jobs will struggle to find housing
they can afford. Additional homes will be needed to house new employees recruited to fill these jobs as they
become available.
For Sale Housing Market
The last full Housing Needs Assessment was completed in 2007. Since that time, median household income
has increased 6%, while home prices increased 20%.
Source: 2007 Housing Needs Assessment, MLS
Second homeowners and short-term rental investment buyers currently compete with year-round residents
for homes at all price points affordable to locals. With continued scarcity of housing throughout the valley,
all three markets are likely to see continued price increases and decline in homes occupied year-round.
It is very difficult to buy a home in Eagle County with an income derived in the Eagle River Valley. Based on
survey data, about 5,000 local households with income below 140% AMI ($113,000 or less for a three-person
household) would like to purchase a home within the Eagle River Valley. But only 64 homes were listed for
sale at prices they can afford in January of this year. The majority of these listings were condos, likely to
be purchased by second home or investor buyers. There is an inventory surplus in of homes for sale over
$600,000, which serves households over 200% AMI. Buyers of these homes will predominately be from out of
the area.
18 PART I Rees Consulting, Inc. / Willliford, LLCTRENDS IN HOUSING AND JOBS MARKETS
CURRENT MLS LISTINGS AND LOCAL HOUSEHOLDS WHO WANT TO PURCHASE
# of Current MLS Listings
AMI Range Max Up Mid Down Total House-
Affordable Valley Valley Valley Listings holds
Purchase Want to
Price Buy
60% or less $190,000 0 0 1 1 1,440
60-100% AMI $316,000 1 4 7 12 2,110
100-140% AMI $443,000 7 13 31 51 2,120
140-200% AMI $632,000 12 22 43 77 1,550
Greater than 200% - 199 218 68 485 1,070
AMI
Total 219 257 150 626 8,290
Source: MLS, household survey, consultant team
A local household would need an income of about $152,000 (or 236% of Area Median Income) to afford the
median priced home that sold in 2017.
Source: MLS, CHFA, consultant team
Last year, median sales prices exceeded what is affordable to a household with median income for all
areas and home types except condos in the down valley.
Rees Consulting, Inc. / Willliford, LLC PART I 19TRENDS IN HOUSING AND JOBS MARKETS
Source: MLS, consultant team
Scarcity is a significant factor in the high cost of housing. Of the 1,300 homes sold last year, only 10% sold at
prices that would be affordable to a household with income of $80,600 or lower (100% AMI). Up valley, only
nine condos in Vail and four single family homes in Red Cliff were affordable for incomes of 100% AMI. Mid
valley, all homes sold that would be affordable to 100% AMI or lower were condos, and single-family homes
were distinctly unaffordable with a median price approaching $2 million. Down valley there was a more
balanced mix of condos, duplexes, townhomes, and single-family-homes, however, only 21% of all homes
sold down valley were affordable to 100% AMI households.
Number of Homes Sold - 2017
Source: MLS
20 PART I Rees Consulting, Inc. / Willliford, LLCTRENDS IN HOUSING AND JOBS MARKETS
For Rent Housing Market
It is similarly difficult to rent a home. Over the past five years, vacancy
rates have been dropping, and rent levels rising. With vacancy levels
now approaching zero, the rental market is no longer functioning
effectively. Employees who are new to the area, or people needing to
move based on changes in their housing needs have great difficulty
finding a home to rent. Landlords experience low turnover and have
little incentive to make repairs and improvements. Such scarcity has
driven prices more rapidly than wage increases.
In 2007, average rent for all unit types was $1,150. Currently, average
rent is $1,700, an increase of 48%. (Both figures exclude utilities, which also impact affordability.) Incomes
have only increased 6% over that time period. This dynamic is driving up cost burden, especially among the
lowest income renters.
Most the rental housing reported on this trend graph has deed restrictions that place a cap on rents. As the
economy has improved, vacancy rates have plunged, but rents have only increased modestly, due to the
deed restrictions. In free market rentals, low vacancy rates are pushing rapid price increases.
Source: Polar Star Market Reports 2010 to 2017
With rental inventory limited, renters of all incomes are competing for the same units, and the lowest
income renters are only paying about 19% less than the highest income renters. Employees in a household
need to work about 120 hours a week, or three full time jobs, at minimum wage for the average rent and
utility payment to be considered “affordable.”
Mid valley has the highest average free market rent, likely due to a higher number of households renting
larger single-family homes. Overall, the gap between free market and deed restricted in the region is about
20% or approximately $330/month.
Rees Consulting, Inc. / Willliford, LLC PART I 21TRENDS IN HOUSING AND JOBS MARKETS
Source: 2018 household survey, December 2017 Polar Star Market Report
The gap between market and deed restricted is about $350/month for two- and three-bedroom homes.
“The cost of
rent is absurd.
People are
paying $1000+
a month in
some units
to rent an air
mattress on
a floor in a
closet with
no windows,
no parking,
utilities not
included,
you get the
picture.”
Source: 2018 household survey, December 2017 Polar Star Market Report -2018 Survey
Respondent
22 PART I Rees Consulting, Inc. / Willliford, LLCTRENDS IN HOUSING AND JOBS MARKETS
Commuting
The mismatch between where local workers live and where jobs are located requires much of the workforce
to commute.
• About 9% of the workforce commutes from outside of the valley;
• Vail has a jobs/housing balance of approximately 6,000 jobs, requiring at least that number of employ-
ees to commute into Vail from other parts of the valley;
• Mid valley has a more balanced housing/jobs mix, with only about 600 more employees than jobs;
• Down valley plays a significant “bedroom community” role, housing more workers than there are jobs.
Rees Consulting, Inc. / Willliford, LLC PART I 23TRENDS IN HOUSING AND JOBS MARKETS
Housing Shortage and Cost Burden
The tension between high housing costs and low wages is hurting individuals and families in the community.
As households stretch to find and retain housing in a tight market, the proportion of their income spent on
housing increases, leaving less for food, healthcare, childcare, transportation, and retirement savings.
When a household spends more than 30% of income on housing, they are considered “cost burdened.” The
term “severely cost burdened” is used when more than 50% of household income is devoted to housing costs.
• Approximately 3,800 households (22% of all households) in the Eagle Valley currently live under the
duress of cost burden.
• The percentage of households experiencing cost burden has decreased since 2007.
• When asked about their housing plans, 13% of survey respondents reported that they intend to leave
the Eagle River Valley in the next five years, which may be an indicator of the trend observed by realtors
and property managers that residents who are ready to own a home, start a family, or “step up” in
their career may choose to leave the community.
Not surprisingly, cost burden
disproportionately impacts renters
and lower income households. About
64% of all households under 60%
AMI are cost burdened; a third are
severely cost burdened. As incomes
increase, the likelihood of cost burden
decreases.
Of renters, 38% are cost burdened,
compared to 10% of owners. Renters
are also more frequently severely cost
burdened; 10% compared to 3% of
owner households.
Source: 2007 Housing Needs Assessment, 2018 Household Survey
The problem of cost burden exists
valley wide. It is most prevalent in mid
valley where about 2,000 households
(about a quarter) are cost burdened.
About 21% of down valley households
are cost burdened and 19% of up
valley households.
Source: 2018 Household Survey
24 PART I Rees Consulting, Inc. / Willliford, LLCHOUSING DEMAND UPDATE
Eagle County has been consistently using the “catch up/keep up” method of calculating housing demand
over the past decade. In this report, the approach is refined to provide demand calculations and market gaps
for the three market areas within the Eagle River Valley, as well as the valley in total.
Estimates are provided for the number of housing units that are needed to support job growth, sustain
employers and employees, and stabilize housing prices.
“CATCH-UP” NEEDS “KEEP-UP” NEEDS
the number of housing the number of units needed to keep up with
units needed to address future demand for housing based on projected
current deficiencies in employment and population growth and the
housing calculated by requirement to replace retiring employees. Keep
considering overcrowding, up demands are projected for 2020, 2025, and
unfilled jobs and in- 2030. The further out these projections look, the
commuting employees more prone they are to change due to unforeseen
who want to live in Eagle conditions.
County
This demand update provides data by region, AMI, tenure, and for the valley as a whole. This summary table
below includes homes that the free market will provide, and homes for which subsidies, incentives, and/or
regulations will be required.
ESTIMATED HOUSING DEMAND - EAGLE RIVER VALLEY - 2018 THROUGH 2030
2018 2020 2025 2030
Catch-up (Existing Needs)
Unfilled Jobs 1,100
Rental Market 310
In-Commuters 560
Overcrowding 800
Total Catch-up 2,780 2,780 2,780 2,780
Keep Up (Existing Needs)
New jobs 1,030 2,350 3,870
Retiring employees 200 770 1,320
Total Keep-up 1,250 3,120 5.190
Total Housing Units Needed 2,780 4,030 5,900 7,970
Rees Consulting, Inc. / Willliford, LLC PART I 25HOUSING DEMAND UPDATE
Own/Rent Mix
Both ownership and rental housing that is affordable for the local workforce and other residents is needed.
The gap estimates below use a mix of 55% ownership and 45% rental, generally reflecting the current own/rent
composition in the community. For homes that will be built to address local needs, the ownership/rental mix is
not exact, but in practice largely a function of the community’s desired direction, housing goals, opportunities
and private market performance. While the rental market rebounded more quickly post-recession than the
ownership market, both have now sufficiently recovered to warrant additional development.
Location
The total number of housing units needed are allocated by area based on owners and renters first choice for
where they want to live in the Valley. This approach:
• Is most responsive to market demand and the preferences of residents;
• Recognizes the extensive cross commuting that exists – although jobs location is closely aligned with
where residents most want to live (see the Housing Solutions section); and
• Improves the housing/jobs balance among new jobs and workers coming into the Valley.
While the location of jobs is one factor that influences where employees want to live, others like schools,
shopping, and community and neighborhood character are key determinants of location preferences.
One weakness to this approach is that it doesn’t incorporate land constraints, development opportunities, or
the level of subsidies required in different market areas. Policy makers working regionally could decide to re-
allocate workforce housing production goals with these considerations in mind.
Gap
The market will address a portion of both ownership and rental housing. The income levels that the market
now serves vary within the Eagle River Valley as shown on the following table. By 2020, the total housing
projected is 4,030 homes. We anticipate a portion of those homes will be supplied by the free market. The gap
not served by the market will total around 2,450 units– about 1,220 for sale and 1,230 rental units, very close
to a 50/50 split of for sale and for rent. Monitoring market conditions and making changes, if needed, to the
forecasting model in the income levels served by the market would generate changes in the owner/renter mix
and overall workforce housing gap moving forward.
"Housing for year round working families is so expensive, that when we retire within the next 5
years, we cannot afford to stay in the area where we have lived for the past 28 years and raised our
family, who have grown and moved away due to cost of living."
--2018 Survey Respondent
26 PART I Rees Consulting, Inc. / Willliford, LLCHOUSING DEMAND UPDATE
For Sale Housing Gap by Region and Income – 2020
Max Affordable Down
Owner Units by AMI Up Valley Mid Valley Total
Price Valley
Where Owners Want to Live 26% 39% 35% 100%
$632,000 90 134 122 346
Gap - # for sale units 480 510 230 1,220
Rental Gap by Region and Income - 2020
Max Affordable Down
Rental Units by AMI Up Valley Mid Valley Total
Rent Valley
Where Renters want to live 42% 40% 18% 100%
$4030 73 69 31 174
Gap - # of rental units 580 560 90 1,230
Total Gap 1,060 1,070 320 2,450
*Totals are rounded to the nearest 10.
Key
Gap - Market does not provide 100
Blend - Market partially provides 100
Market provides 100
Rees Consulting, Inc. / Willliford, LLC PART I 27WHAT IS BEHIND THE NUMBERS?
The estimates for housing demand are composed of a variety of assumptions, some quite conservative,
others more aggressive. When considered in aggregate, they represent a balanced picture. However,
the reality of these projections can change rapidly, as market conditions fluctuate. For that reason, the
consultant team has provided Eagle County Housing and Development Authority with a spreadsheet to do
annual updates that reflect actual job growth.
Variations in the economy will most certainly occur between now and 2030, and the projections for that
timeframe should be refreshed frequently. The full census in 2020 will also provide a good opportunity to
update these assumptions and projections. This section provides a brief explanation of each assumption
used in the demand update. The full description of sources and methods can be found in Attachment D.
Unfilled Jobs
About 1,050 homes are needed to fill the estimated 2,470 jobs that remained unfilled during the peak winter hiring
season this year.
Unfilled Jobs Assumptions &
Units Needed
Unfilled jobs (Dec/Jan 2018) 2,470
Jobs per worker 1.24
Employees per household 1.8
Housing Units Needed 1,100
Functional Rental Market
Availability of rental housing is so low that the market does not function properly:
• renters have difficulty moving from one unit to another as their circumstances change,
• rents have been increasing at rates much faster than incomes, and
• vacancy rates are less than 1%.
The lack of a functional rental market makes it very difficult for new employees to find housing when hired to support
an expanding economy.
A vacancy rate of 5% is generally considered a balanced market in mountain communities. At this vacancy level, it
tends to be financially feasible to own and operate rental units, and unit availability is typically adequate to provide
choice for renters and stabilize rental rates. To increase the vacancy rate to 5%, approximately 310 additional rental
units are needed.
Assumptions &
Rental Market
Units Needed
Number of existing rental units - 2017 7,660
Number with 5% vacancy rate 7,970
Housing Units Needed 310
28 PART I Rees Consulting, Inc. / Willliford, LLCWHAT IS BEHIND THE NUMBERS?
In-Commuters
About 9% (2,600) of all employees are now commuting into the Eagle Valley for work. Based on employer estimates,
about 39% (1,010) of employees would move to the valley if affordable housing options were available. This generates
demand for an additional 560 units to accommodate employees who already work in the region.
Assumptions &
In-commuters
Units Needed
Number of in-commuters 2,600
Employees who would move 1,010
Employees/household 1.8
Housing Units Needed 560
Overcrowding
An estimated 2,670 households in the Eagle River Valley are living in overcrowded conditions. Typically, an increase
in the supply of workforce housing equal to about 30 percent of the number of overcrowded units will largely address
overcrowding to the extent practical, given consumer choices and cultural preferences.
Assumptions &
Overcrowded
Units Needed
Overcrowded units 2,670
% need to reduce overcrowding 30%
Housing Units Needed 800
New Jobs
The single largest driver of local workforce housing demand is new homes to keep up with estimated job growth. The
following table includes numerous assumptions and estimates to identify the number of housing units needed over
the next two, seven, and twelve years. As stated above, these can be kept up to date by the Eagle County Housing and
Development Authority using the consultant team spreadsheet.
New Jobs Assumptions & Units Needed
2020 2025 2030
Increase in Jobs over 2017 2,304 5,250 8,643
Jobs per Employee 1.24 1.24 1.24
New Employees 1,858 4,234 6,970
Employees/household 1.8 1.8 1.8
Housing Units Needed 1,030 2,350 3,870
Rees Consulting, Inc. / Willliford, LLC PART I 29WHAT IS BEHIND THE NUMBERS?
Retiring Employees
About 110 homes are needed each year to provide housing for employees who will fill the jobs vacated by approxi-
mately 240 employees anticipated to retire each year in the Eagle River Valley. Most retiring employees intend to stay
in the community post retirement. For those who intend to move, it is unlikely their homes will be affordable to the
employees needed to replace them.
Retiring Employees Assumptions & Units
Needed
# of employees to retiring annually 240
Jobs/employee 1.24
Employees/household 1.8
Housing Units Needed Annually 110
30 PART I Rees Consulting, Inc. / Willliford, LLCPART II Housing Solutions Rees Consulting, Inc. / Willliford, LLC PART II 31
Part II provides information for use in the planning, design and development of housing in the Eagle Valley. It exam-
ines the type, size and price of home residents prefer as well as location preferences and neighborhood considerations
to support the selection and planning of sites for housing development. It consists of three sections:
   •     Ownership Housing Design and Development
   •     Rental Housing Design and Development
   •     Housing Tools
These sections answer the questions:
   1. Where should housing for locals be built?
   2. How should it be designed?
   3. What pricing is appropriate?

   4. What tools are most likely to be successful?

    32        PART II                                                        Rees Consulting, Inc. / Willliford, LLC
OWNERSHIP HOUSING – DESIGN AND
DEVELOPMENT
Market Size
The current potential market for homeownership in the Eagle Valley consists of approximately 8,290 households.
These estimates are based on residents who indicated they want to move within the Eagle River Valley within the next
five years. They represent the market from which ownership projects must draw buyers, and are distinct from the esti-
mates of housing need presented in Part I.
• About two-thirds are renters who want to move into ownership; and
• Roughly one-third are owners who want to buy a different home. "My partner and I are
both year-round public
service employees. […]
Potential Homeownership Market by Own/Rent Eagle County is not a
place that facilitates
Own Rent Overall young couples looking
Total # of Households, 2017 9,350 7,650 17,000 to build a future with its
% want to move into a different home current housing issues.
34% 75% 53% Unless this changes,
within the Eagle River Valley in 5 years
# want to move into a different home we might have to
3,180 5,810 9,010 search for employment
within the Eagle River Valley in 5 years
% want to own 99% 89% 92% elsewhere."
# want to own 3,150 5,170 8,290
-2018 Survey
Source: 2018 household survey Respondent
Three-fourths of renters want to move within the valley in the next five years and, of these, nearly 90% want to own.
The percentage who want to move into ownership is high compared to the 65% of households that owned homes in
2007, and much higher than is realistic given affordability and down payment availability, which are examined later in
this section. The extremely limited availability of rental housing and escalating rents in recent years likely contributed
to the increased desire for ownership.
Most owners (66%) want to stay in their current residence although about one-third want to buy a different home. If
more homeownership opportunities are provided, more choices and movement within the ownership market would
be an overall positive. However, there is a challenge for the year-round resident housing supply, because homes cur-
rently occupied by local residents are likely to be sold to second homeowners, see Policy Considerations.
Decisions about the provision of homeownership opportunities – number of units, location, unit type, amenities and
pricing, will depend on policy and developer decisions as to which segments of the potential market for homeowner-
ship should be the focus.
Rees Consulting, Inc. / Willliford, LLC PART II 33OWNERSHIP HOUSING – DESIGN AND
DEVELOPMENT
Tradeoffs in Location/Price/Size/Type
Potential homebuyers were asked to rank the importance of four considerations when purchasing a home – price, lo-
cation, type and size, in light of the need for trade-offs due to expensive land, limited sites and high construction costs.
• Location - a home in the community where you most want to live
• Price - a home that is the most affordable option for the minimum size you need; the best value
• Size - space is key; you would choose a larger home that might require you to share walls, like a town
home, rather than a smaller single-family home.
• Type - Type is an important consideration if you would choose to live other than where you prefer to
buy a single-family house rather than a condominium or townhome
A key finding is that type of home and size of home is relatively unimportant for potential buyers compared to location
and price. This suggests that there is flexibility in terms of the type of units to be developed in response to demand.
If priced appropriately and located where desired, condominiums and townhomes may be acceptable to many who
prefer to buy a single-family house. If housing cannot be developed where potential buyers want to live or prices are
not considered to be a good value, it will be more important to provide the type of units that buyers most want.
Importance by Own/Rent
1=most important; 4=least important
Own Rent
Location 1.84 1.94
Price 2.04 1.63
Size 2.95 3.08
Type 3.17 3.35
Source: 2018 household survey
34 PART II Rees Consulting, Inc. / Willliford, LLCOWNERSHIP HOUSING – DESIGN AND
DEVELOPMENT
Location – Where Owners Now Live and Want to Live
DOWN VALLEY MID VALLEY UP VALLEY
of the Valley's of the Valley's of the Valley's
41% 45% Owners Live 14% Owners Live
Owners Live
Here Here Here
of the Valley's of the Valley's of the Valley's
35% 39% Owners Want to 26% Owners Want to
Owners Want to
Live Here Live Here Live Here
Source: 2018 Household Survey
Most owners live in the area of the valley that is their first choice. This is especially true up valley where over
90% of owners are living where they most want to live. Nearly 10%, however, would prefer mid valley. Of
mid valley residents who would rather live elsewhere, most prefer up valley. In contrast, more down valley
owners would like to live in mid valley than up valley.
Where Owners Want to Live by Where They Now Live
Shading denote residents who live where they most want to live.
Live Now
Want to live (first choice) Up Valley Mid Valley Down Valley
Up Valley 91% 24% 7%
Mid Valley 9% 70% 16%
Down Valley 0.0 6% 77%
Total 100% 100% 100%
Source: 2018 household survey
Individual communities show:
• Proportionately more owners want to live in Vail and Minturn;
• Slightly fewer want to live in Edwards;
• In Eagle, preferences are in line with the current condition with about one-fourth of owners wanting
to and now living there.
Rees Consulting, Inc. / Willliford, LLC PART II 35OWNERSHIP HOUSING – DESIGN AND
DEVELOPMENT
Location – Where Owners Now Live and Want to Live (cont’d)
• In neighboring Gypsum, however, proportionately more owners reside there than desire.
These findings suggest location preferences are based largely on community rather than area, at least with
regards to down valley.
Where Live and Want to Live by Town
Where do you now live in or near Now Live 1st Choice Difference
Vail 9% 19%
Minturn 3% 6%
Eagle Vail 8% 8%
Avon 9% 7%
Edwards 27% 23%
Eagle 23% 24%
Gypsum 13% 8%
Source: 2018 household survey. Note: Redcliff, Wolcott, and Dotsero excluded due to
small sample size.
Location Characteristics
Up valley appeals most to households without children – about 60% are singles living alone, couples
without kids and roommate households.
Mid valley appeals to a broad mix of households.
Down valley is home to relatively more families – over 60% of owner households living there include at least
one child.
36 PART II Rees Consulting, Inc. / Willliford, LLCOWNERSHIP HOUSING – DESIGN AND
DEVELOPMENT
Location Attributes
Homeowners in the Eagle Valley rate community character, defined as “locals or family-oriented, social
opportunities, entertainment, restaurants, etc.” as their top consideration when choosing where to live,
higher than proximity to work, which is at the top of the list among renters.
• Proximity to work is the second highest consideration for homeowners;
• Community amenities - schools, parks, libraries, etc., amenities rate high in importance among
homeowners.
• The ability to have pets is also a top consideration with two-thirds of owners rating pets as very or extremely
important.
Source: 2018 household survey
Rees Consulting, Inc. / Willliford, LLC PART II 37OWNERSHIP HOUSING – DESIGN AND
DEVELOPMENT
In addition:
• Owners who live alone generally place less importance on character and proximity attributes but rank
availability of bus service and proximity to skiing/recreation higher than other types of households.
• Couples with children generally rank location attributes higher than other households, especially
availability of day care and quality of schools. They place lower than average importance on bus service
and proximity to skiing/recreation.
• The importance ratings by other types of households tend to fall in between the preferences of people
living alone and couples with children.
• Mid valley resident rate most location attributes slightly higher than other owners while down valley
owners generally place lower importance on location attributes. A few specific distinctions
• Mid valley residents place greater importance on proximity to work and community character.
• Quality of schools and availability of day care is higher for mid and down valley owners.
• Up valley owners place greater importance on availability of bus service.
Amenities
Households ranked amenities as follows:
• In-unit washers and dryers top the list of amenities, rated either very or extremely important by 85% owners.
• Decks or patios rate equally with energy efficient heat - 70% of owners rank both very/extremely important.
• Playgrounds or parks on site are also important to owners, especially households with children, and
considerably more important to owners than renters.
• Fitness centers on site are generally not important, as is typically the case in mountain communities where
recreation opportunities are abundant. Fewer than 9% of owners consider on-site fitness centers important.
As with location attributes,
mid valley owners generally
rate the importance of
amenities higher than
elsewhere in the valley. There
are few differences in the rank
order of amenities by area
of the valley though down
valley owners rate energy
efficient appliances and heat,
and exterior storage lockers
noticeably lower than other
owners, presumably due to its
milder climate and because
many down valley homes
have garages.
Source: 2018 household survey
38 PART II Rees Consulting, Inc. / Willliford, LLCOWNERSHIP HOUSING – DESIGN AND
DEVELOPMENT
Unit Type
Residents who want to buy within the next five years were asked to rate four housing options on a scale
where 1 = not at all interested and 5 = very interested. The hypothetical home types were created to test
demand and tradeoffs. The prices are based on price points affordable to local employees and recent history
of deed restricted home sales.
Condominium Townhome Duplex/Triplex SIngle Family Home
1 Bed/1 Bath 2 Bed/1.5 Bath 2 Bed/2 Bath 3 Bed/2 Bath
800 Sq Ft 1000 Sq Ft 1250 Sq Ft 1500 Sq Ft
$200,000 $320,000 $375,00 $475,00
Renters who want to buy are flexible with regards to unit type, with single family homes, duplex/triplex units
and townhomes receiving similar ratings despite large price differences. Owners who want to buy a different
home have strong preferences for a single-family home.
Income levels and type of units that residents are interested in buying are correlated.
• Lower income households are more interested in attached units, with townhomes rating higher than
condominiums or duplexes/triplexes.
• Higher income residents have little interest in condominiums and a strong preference for single family
homes, with duplexes and triplexes preferred over townhomes.
Source: 2018 household survey
Rees Consulting, Inc. / Willliford, LLC PART II 39You can also read