UK Insurance and Long-Term Savings - The state of the market - Association of British Insurers

Page created by Ronald Stone
 
CONTINUE READING
UK Insurance and Long-Term Savings - The state of the market - Association of British Insurers
Association of British Insurers

     UK Insurance and
     Long-Term Savings
     The state of the market

abi.org.uk

@BritishInsurers
UK Insurance and Long-Term Savings - The state of the market - Association of British Insurers
2       UK Insurance and Long-Term Savings: The state of the market

    Contents
    3           Welcome
    4           Introduction
    5           The UK insurance and savings market
    5           Economic context
    9           The UK insurance and savings market
    13          Importance to UK households
    16          General insurance
    16          The total market
    18          Motor
    20          Property
    21          Other lines
    26          Life and long-term savings
    26          Summary
    27          Pensions
    29          Retirement income
    31          Protection
    33          ABI contacts

        abi.org.uk

        @BritishInsurers
UK Insurance and Long-Term Savings - The state of the market - Association of British Insurers
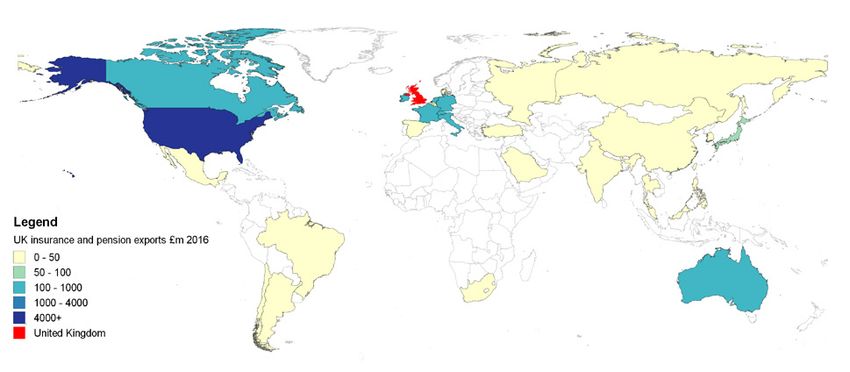
UK Insurance and Long-Term Savings: The state of the market   3

Welcome
Huw Evans
Director General

It is a pleasure to introduce the ABI’s first State of
the Market publication. Having detailed market
data to inform our policy positions and illustrate our
arguments is a must-have in our dealings with ministers,
policymakers, regulators and customers.
Over the last two years, we have fundamentally
modernised our Data & Analytics work under Matt
Cullen’s leadership to produce more timely analysis as
well as raw data. This publication is the next step in using
that analysis to inform debate to the benefit of all.
I hope you find this a stimulating read and a useful reference
point for your work in the months ahead. We hope this is the
first publication of many and that you will continue to let us
know what you need from our Data & Analytics work as we
all navigate this fast-changing world together.

About the ABI
The Association of British Insurers is the voice
of the UK’s world leading insurance and long-
term savings industry.
A productive, inclusive and thriving sector, we
are an industry that provides peace of mind
to households and businesses across the UK
and powers the growth of local and regional
economies by enabling trade, risk taking,
investment and innovation.
UK Insurance and Long-Term Savings - The state of the market - Association of British Insurers
4     UK Insurance and Long-Term Savings: The state of the market

    Introduction
    Matt Cullen
    Assistant Director, Head of Strategy, Data & Analytics

    Welcome to our State of the Market report. Building on
    our annual Key Facts summary document, this more
    detailed report uses the ABI’s wide range of data on the
    UK insurance and long-term savings market to paint
    a picture of the key trends affecting our sector, and
    considers the reasons behind them. The ABI statistics
    used are freely available to ABI members on our website
    (www.abi.org.uk), and can be purchased by non-
    members in a range of different subscription packages.
    Over the last two years – the period to which data used
    in this report relates – a wide range of forces have been
    exerted on the UK insurance and long-term savings
    market. Long-term savings firms have continued to adjust
    to a world of auto-enrolment and pension freedoms,
    while general insurers have been stung by the 2017
    reduction of the Ogden discount rate on the one hand,
    but helped by a soft reinsurance market and benign
    weather on the other. Across the industry, companies
    have had to adjust to a new prudential regulation regime
    – Solvency II, have engaged with a wide range of conduct
    regulation issues, and have begun detailed planning
    for Brexit. This is not to mention the broader long-
    term trends impacting firms – the accelerating digital
    revolution, the shifting dynamics of the global economy,
    an ageing population etc.
    While the market has inevitably been affected by all
    of these forces, our industry’s role in society remains
    steadfast. From London to Liverpool, and indeed from
    Lagos to Los Angeles, the UK insurance industry is
    helping families and businesses thrive by managing risk
    and providing long-term security and stability. The ABI’s
    Helping Britain Thrive campaign, launched in 2017, sets
    out the industry’s contribution to UK society – employing
    hundreds of thousands of people, paying billions in taxes
    and, as shown in this report, writing more insurance and
    savings business than ever before.
    We are always keen to engage with industry participants
    and analysts on the state of the market, so please do feel
    free to get in touch with any questions, or suggestions for
    future work.

      abi.org.uk

      @BritishInsurers
UK Insurance and Long-Term Savings: The state of the market   5

Section 1
The UK insurance and savings market
By Daniel Sadler – Manager, Data & Analytics

The UK is one of the most prosperous and developed                       Figure 2: GDP growth, top five economies by GDP (%), 2016
countries in the world. Residents enjoy a relatively high
                                                                                                       1.6%
standard of living compared to the rest of the world;                     United States

businesses benefit from competitive tax rates, a mature                   Japan                      1.0%
legal system and a well-educated workforce.
                                                                          China                                                                     6.7%
The UK Insurance and Long-Term Savings Industry plays
a significant role in this, helping households safeguard                  United Kingdom                1.8%
their possessions and manage the risk of adverse life
                                                                          Germany                        1.9%
events, as well as safeguarding savings for their future.
Businesses are better able to manage their risks and
more efficiently deploy their resources with suitable
insurance arrangements in place.
                                                                         Key industries
Economic context                                                         The UK economy is dominated by the services sector,
                                                                         which comprises 80% of total GDP; the next largest
                                                                         sector, manufacturing, comprises just 19% of GDP, with
Economic output
                                                                         the remaining 1% being agriculture5. This structure has
The UK has the fifth largest economy in the world, with                  been relatively consistent for the UK over the last 25
a Gross Domestic Product (GDP) of just over £1.9 trillion                years, with services accounting for 69% of GDP in 1990
in 20161; only Germany, Japan, China and the USA have a                  and growing to current levels due to the gradual decline
larger output than the UK (see Figure 1).                                of UK manufacturing (see Figure 3).

Figure 1: World top five economies by GDP (£trillion,                    Figure 3: Output by main industrial sector in the UK
current prices)2, 2016                                                   (% of GDP, 1990-2016)
                                                                            %
                                                                          100
                                                                          90
United States                                               13.75         80
                                                                          70
Japan                  3.66
                                                                          60
                                                                          50
China                               8.29
                                                                          40
                                                                          30
United Kingdom       1.94
                                                                          20
                                                                          10
Germany                 2.57                                              0
                                                                                1990
                                                                                1991
                                                                                1992
                                                                                1993
                                                                                1994
                                                                                1995
                                                                                1996
                                                                                1997
                                                                                1998
                                                                                1999
                                                                                2000
                                                                                2001
                                                                                2002
                                                                                2003
                                                                                2004
                                                                                2005
                                                                                2006
                                                                                2007
                                                                                2008
                                                                                2009
                                                                                2010
                                                                                2011
                                                                                2012
                                                                                2013
                                                                                2014
                                                                                2015
                                                                                2016

UK GDP has continued to grow over recent periods,                                                Services, value added (% of GDP)
                                                                                                 Industry, value added (% of GDP)
despite the long-term fallout from the 2007-08 recession                                         Agriculture, value added (% of GDP)
and the UK’s vote to leave the European Union. UK
annual GDP growth for 2016 was 1.8%3 ; however, this
has since fallen to 1.5% for the twelve months preceding                 This structural composition is similar to that of the
2017Q34. The 2016 estimate compares favourably to the                    USA, where the service sector accounts for 79% of GDP;
other largest economies, with both the USA and Japan                     meanwhile, Germany and China both have a larger
experiencing a lower growth rate than the UK.                            manufacturing sector in relative terms, with 41% of
                                                                         output in China from manufacturing industries (See
                                                                         Figure 4).

                               1
                                 ONS (2017) “Gross Domestic Product: chained volume measures: Seasonally adjusted £m”,
                               2
                                 The World Bank (2017) “World Development Indicators: GDP Current US$ & GDP (current LCU)”
                               3
                                 The World Bank (2017) “World Development Indicators: GDP growth (annual %)”
                               4
                                 ONS (2017) “Time Series: Gross Domestic Product: q-on-q4 growth rate CVM SA% (PGDP)”
                               5
                                 The World Bank (2017) “World Development Indicators: Economy Structure”
6

    Figure 4: Output by main industrial sector, largest five                                        Taxation
    world economies (% of GDP, 2015)6
                                                                                                    The UK remains one of the most competitive places
      %                                                                                             in the world to base a company, with corporation tax
    100                                                                                             rates currently at 19%11 and scheduled to drop to 17%12
    80
                                                                                                    in 2020. This is lower than any other country in the G7;
                                                                                                    corporation tax in the USA is over double that of the UK
    60                                                                                              at 40%, with the next lowest after the UK being Canada
                                                                                                    at 26.5%. However, with Brexit looming in 2019, other
    40
                                                                                                    European jurisdictions, such as Ireland and Liechtenstein
    20                                                                                              with a corporate tax rate of just 12.5%, pose even more
                                                                                                    serious competition to the UK than they already do.
    0
          United Kingdom      United States           Japan               Germany       China
                                    Services, value added (% of GDP)                                Figure 6: Corporate tax, top five insurance markets plus
                                    Industry, value added (% of GDP)                                Ireland and EU average (%, 2017)
                                    Agriculture, value added (% of GDP)

    Population and productivity                                                                                  United States                                                                                                            40

    The UK population is currently 65.6 million people7; this                                                    Japan                                                                                                  30.86

    is significantly smaller than that of the other top five                                                     China                                                                                       25
    economies. Relative to GDP, the UK population compares
    favourably, with GDP per capita at just over £31,440 per                                                     United Kingdom                                                         19

    person; Japan’s equivalent sits at £30,307; however, the                                                     France                                                                                                     33.33
    USA figure is significantly higher at £41,9998.
                                                                                                                 Ireland                                                  12.5
    Despite a relatively high GDP per capita, UK workers
    are less productive than their peers in the other largest                                                    EU average                                                               21.51
    economies. The average UK worker contributed £52,229
    to the UK economy in 2016; by comparison, workers in
    Germany produced £61,753 a year, and US employees                                               Figure 7: Corporate tax time series for the UK, USA,
    produced over £71,254 per year.                                                                 Ireland and EU average (%, 2003-2017)

    Figure 5: GDP per capita and employee productivity (£, 2016)                                                          %
                                                                                                                         45
         £                                                                                                               40
    80,000                                                                                                               35
                                                                                                    Corporate tax rate

    70,000                                                                                                               30
    60,000                                                                                                               25

    50,000                                                                                                               20
                                                                                                                         15
    40,000
                                                                                                                         10
    30,000
                                                                                                                         5
    20,000
                                                                                                                         0
                                                                                                                              2003

                                                                                                                                      2004

                                                                                                                                             2005

                                                                                                                                                    2006

                                                                                                                                                           2007

                                                                                                                                                                   2008

                                                                                                                                                                          2009

                                                                                                                                                                                 2010

                                                                                                                                                                                        2011

                                                                                                                                                                                               2012

                                                                                                                                                                                                      2013

                                                                                                                                                                                                              2014

                                                                                                                                                                                                                     2015

                                                                                                                                                                                                                            2016

                                                                                                                                                                                                                                   2017

    10,000
    0
              United       United         China      Germany       Japan        World   European                                     United States                United Kingdom                 Ireland                EU average
             Kingdom       States                                                        Union
                                    GDP Per Capita, PPP current £

                                                                                                    The world’s fourth largest insurance market
                                    GDP Per Employee, PPP current £

    Employment in the UK, taken as the proportion of the
    population at working age and also working, is quite                                            The UK hosts the fourth largest insurance market in the
    high compared to other developed countries at 74.2%;                                            world, and the largest in Europe, with a total premium
    the average employment level for EU member states is                                            volume in 2016 of just under £225 billion13. The world’s
    currently 67.6% and 70% for the USA9. However, the UK                                           largest insurance market is located in the USA, with a
    lags well behind the OECD leader – Iceland – with 86.5%.                                        2016 premium income of £998 billion – roughly four and a
                                                                                                    half times the size of the UK market.
    Meanwhile, the unemployment rate in the UK has dropped
    slightly from 5.4% in 2015 to 4.9% in 201610 - below levels
    seen immediately prior to the 2007-8 financial crisis.

                                                       6
                                                        The World Bank (2017) “World Development Indicators: Economy Structure”
                                                       7
                                                         ONS (2017) “Article: Overview of the UK population: July 2017”
                                                      8
                                                         The World Bank (2017) “World Development Indicators: GDP per capita (current US$)”
                                                      9
                                                         OECD (2017) “Employment situation, second quarter 2017, OECD”
        abi.org.uk                                    10
                                                         ONS (2017) “Time series: Unemployment rate (aged 16 and over, seasonally adjusted)”
                                                      11
                                                         KPMG (2017) “Corporate tax rates table”
        @BritishInsurers                              12
                                                         HM Treasury (2017) “Policy paper, Spring Budget 2017, Published 8 March 2017: 4.3 Business Tax”
                                                      13
                                                         Swiss Re Sigma 3 (2017)
UK Insurance and Long-Term Savings: The state of the market            7

Figure 8: Top Five countries by Total Premium Income                                   Figure 10: Insurance density: premiums per capita by
(£m, 2015 & 2016)                                                                      business type (£, 2016)16

United                                                              998,102
States                                                    862,600                       United States                 1273                                          1808
                               347,830
Japan
                            293,497                                                     Japan                                   2069                                  685

                              344,019
PR China                                                                        2016    China            140 109
                         252,862
                                                                                2015

United               224,515                                                            United Kingdom                              2239                                    761
Kingdom             215,167
                                                                                        France                            1644                                862
                   175,389
France
                 155,715
                                                                                                             Life business: £              Non-Life business: £

The UK market grew by just under 4% in real terms from
201514. This is the second largest growth rate in the top
five markets after China at 25% growth (see Figure 9),                                 Figure 11: Insurance penetration: premiums as a % of
and the largest growth rate in the top five EU markets                                 GDP by business type (%, 2016)
by some margin. Note, however, that when including
the impact of depreciation of the pound compared to
overseas currencies over 2016, this change appears                                      France                               6.06                                   3.17
significantly smaller than in some other EU states.
                                                                                        United Kingdom                              7.58                                      2.58

Figure 9: Inflation adjusted growth rate by market top five                             PR China               2.34             1.81
insurance markets( %, 2016)
                                                                                        Japan                                    7.15                                      2.37
                                    25
                                                                                        United States              3.02                          4.29

                                                                                                            Life business %             Non-Life business %

                                                                                       It is worth noting that certain significantly smaller
                                                                                       markets eclipse the UK under the per capita and GDP
                                                                                       equivalent measures; the Cayman Islands reports both
                                                       3.7                             the highest 2016 premiums per capita at £8975 per
         1.3
                  Japan                                                 France         person, and the highest insurance penetration figure
 United States                   PR China         United Kingdom         -0.1          with premiums equivalent to 22.6% of GDP.
                  -5.1

                                                                                       The world’s largest insurance exporter
Taking account of population and economy size when
comparing the top five insurance markets paints a                                      With such a large insurance market, it is perhaps unsurprising
somewhat different picture. The UK has the second                                      that the UK is a significant exporter of insurance services. In
largest market in the top five relative to its population,                             fact, the UK is the single largest exporter of insurance and
with premiums per capita in 2016 at just under £3000 per                               pensions services in the world, exporting just under £15
person, just behind the USA at £3080 per person15                                      billion17 in 2016; this is more than the combined insurance and
(see Figure 10). The UK insurance market is also very large                            pensions exports of Asia (£13.4 billion), and significantly more
compared to the overall size of the economy, with UK                                   than the next largest exporter, the USA, which exported just
premium volume equivalent to just over 10% of GDP (see                                 over £13 billion in 2016.
Figure 11).

                                            14
                                               Swiss Re Sigma 3 (2017)
                                            15
                                               Swiss Re Sigma 3 (2017)
                                            16
                                               The World Bank (2016) “GDP per capita (current US$)”
                                            17
                                               WTO (2017) “Trade and tariff data”
8     UK Insurance and Long-Term Savings: The state of the market

    Figure 12: Top five insurance exporters + Asia (£m, 2016)18

    United Kingdom                                                                   14,880

    United States                                                           13,094

    Germany                                             8,251

    Ireland                                         7,652

    France                             6,343

    Asia                                                                     13,414

    The UK insurance market also caters for the vast majority
    of domestic demand, importing just £149 million of
    overseas insurance and pensions business in 2016.
    Amongst the top five insurance markets, the UK is the only
    country with a positive trade balance (exporting more than
    it imports). By comparison, the USA imported just under
    £36 billion of insurance and pensions business in 2016.

    Figure 13: Top five insurance markets – trade balance
    (exports minus imports) (£m, 2016)

                                           -385             France

                                   United Kingdom                                    14,731

                          -6,522                            China

                                      -2,903                Japan

    -22,626                                                 United States

    The UK exports insurance and pension services to many
    different countries around the world. Its largest export
    market by far is the USA, with just under a third (31%)19
    of exports heading there in 2015 (see Figure 14). The UK
    actually exported more to the US than it did to Europe,
    with 28% of exports in 2015 going to EU28 countries.

    Figure 14: UK insurance export destinations (£m, 2016)

                                               18
                                                    WTO (2017) “WTO-UNCTAD-ITC annual trade in services dataset”
      abi.org.uk
                                               19
                                                    ONS (2016) “UK Balance of Payments, Pink Book 2016”

      @BritishInsurers
UK Insurance and Long-Term Savings: The state of the market      9

The UK insurance and savings market                                                                         Figure 16: UK Insurance Sector - tax contribution
                                                                                                            breakdown (%, 2014) 23

Contribution to the UK economy
The UK insurance and long-term savings industry is                                                                                                            Employment taxes 26.3%
not only significant on the world stage; it also plays a                                                                                                      Insurance premium tax 19.5%
significant role in the prosperity of the UK economy.                                                                                                         PAYE on annuities 17.3%
                                                                                                                                                              VAT 14.8%
                                                                                                                                                              Corporation tax 12.9%
Economic output                                                                                                                                               Tax deducted at source other 4.8%
                                                                                                                                                              Other taxes 4.3%
The insurance and pensions sector is a significant
contributor to UK output, adding between £42 and
£45 billion in gross value to the UK economy in 2015.
This includes £34 billion20 from the core insurance and
                                                                                                            Insurance and pensions companies account for
pensions sector, as well as approximately £8-11 billion
                                                                                                            approximately 3.4% of all corporation tax receipts; they
from a variety of auxiliary professions that support the
                                                                                                            also pay a significant amount of VAT (approximately
sector. Insurance and pensions account for roughly a
                                                                                                            30% of all taxes borne by the industry). This is a result of
third of output from the Financial Services sector.
                                                                                                            insurance products being VAT-exempt, with IPT charged
                                                                                                            instead; this therefore precludes insurers from recovering
Figure 15: Growth in GVA for various UK sectors
                                                                                                            some of the VAT paid on their own expenses.
(2010=100, 2010-2015)21
                       %
                     200                                                                                    Jobs
                     180
                     160
                                                                                                            The insurance sector is also a very significant employer,
                                                                                                            with approximately 324,100 individuals employed by the
Index (2010 = 100)

                     140
                     120
                                                                                                            sector in 2016. Just under a third of these employees
                     100                                                                                    (105,000) are directly employed by the sector, whilst a
                     80                                                                                     further 219,000 are employed in auxiliary services such as
                     60                                                                                     claims handling and broking (see Figure 17).
                     40
                     20                                                                                     Figure 17: Employment in the UK insurance industry
                     0                                                                                      (%, 2016)24
                           2010          2011           2012          2013          2014           2015

                                  Finance & Insurance                 Services auxiliary to financial
                                                                      services and insurance
                                  Financial service activities
                                                                      All employment
                                  Insurance & Reinsurance

Taxation
                                                                                                                                                                 Full Time 84%
The UK insurance industry contributed approximately
£11.8 billion in tax to the Exchequer in 2014 (excluding
                                                                                                                      324K jobs                                  Part Time 15%
                                                                                                                                                                 Other (inc. self employed) 2%

Lloyd’s), equivalent to just under 2% of all Government
tax receipts22. This figure includes a variety of taxes borne
by the industry – including Corporation Tax, Business
Rates, etc. – and tax collected by the industry on behalf
of the Government – such as Insurance Premium Tax
(IPT), PAYE on employees and annuitants, and so on.

                                                                 20
                                                                    ONS (2016) “UK National Accounts, The Blue Book: 2016”
                                                                 21
                                                                    ABI (2017) “Helping Britain Thrive”
                                                                 22
                                                                    Source: PWC, Total Tax Contribution of the UK Insurance Industry, 2014
                                                                 23
                                                                    PWC (2014) “Total Tax Contribution of the UK insurance industry”
                                                                 24
                                                                    ABI (2017) “Helping Britain Thrive”
10        UK Insurance and Long-Term Savings: The state of the market

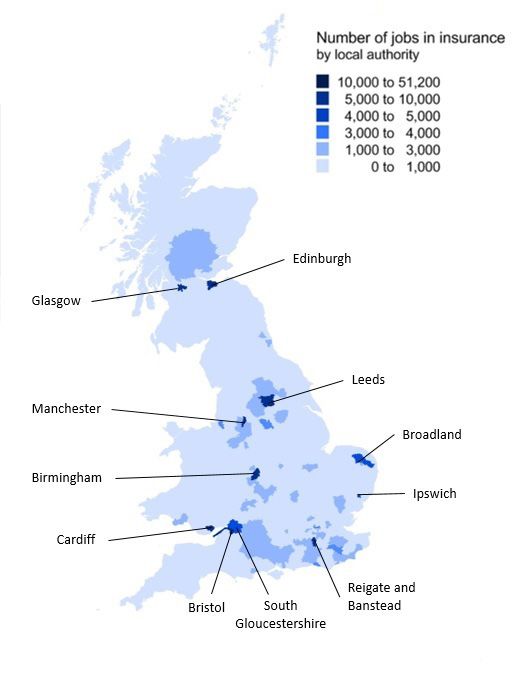
     Figure 18: Employment in the insurance industry                                                          Figure 19 Regional employment in the insurance industry
     (jobs, 2016)                                                                                             (jobs, 2015)

      140,000
                                                                                   116,293
      120,000

      100,000
                                                                                                 88,005
      80,000                 70,195

      60,000

      40,000     33,526

      20,000                                                            14,668
                                           471         943
      0
                   Life      Non-life       Life      Non-life         Risk and    Insurance      Other
                Insurance   insurance   reinsurance reinsurance        damage        agents      activities
                                                                      evaluation      and      auxiliary to
                                                                                    brokers     insurance

                    Core insurance industry                       Auxiliary to insurance
                           106k jobs                                    218k jobs

     As well as contributing to UK employment as a whole,
     insurers also contribute significantly to regional
     employment across the whole of the UK. Though the
     City of London has the highest regional employment
     with 51,000 jobs, there are many other key insurance
     employment hotspots including Leeds (18,000 jobs),
     Greater Manchester (15,000 jobs) and Bristol (11,000 jobs)
     – see Figure 19 for more detail. Overall, around two thirds
     of the sector’s employees are based outside London.

                                                                                                              Investing in the UK
                                                                                                              Insurers also contribute to the economy indirectly, with
                                                                                                              investments in Government debt, UK listed corporations
                                                                                                              and other assets enabling further output. As of 2016, UK
                                                                                                              insurance and pensions companies held a total of £1.7
                                                                                                              trillion of investments – equivalent to just under 90% of
                                                                                                              UK GDP26. These investments include money managed
                                                                                                              on behalf of savers such as pension policyholders,
                                                                                                              insurance reserves and long-term investments to fund
                                                                                                              pension annuities.
                                                                                                              Approximately £156 billion of these investments are
                                                                                                              held in UK Government debt – typically gilts of varying
                                                                                                              maturities – and a further £244 billion is invested in UK
                                                                                                              private sector securities (equities, corporate bonds, etc.)
                                                                                                              – see Figure 20.
                                                                                                              Investment varies across the sector. General insurance
                                                                                                              companies, driven primarily by the need for liquidity
                                                                                                              and short-term certainty, tend to invest largely in cash
                                                                                                              and ‘Overseas Debentures, Loan Stocks, Preference &
                                                                                                              Guaranteed Stocks & Shares’. In comparison, long-term
                                                                                                              insurance companies, driven by the needs to both deliver
                                                                                                              good returns long-term, and match assets against long-
                                                                                                              term liabilities, focus much less on these areas, and more
                                                                                                              on traditional equities and property.

                                                        25
                                                             ABI (2017) “Helping Britain Thrive”19 ONS (2016) “UK Balance of Payments, Pink Book 2016”
          abi.org.uk
                                                        26
                                                             ABI Statistics – Invested Assets

          @BritishInsurers
UK Insurance and Long-Term Savings: The state of the market   11

Figure 20: Aggregated invested assets (%, 2016)27                                Market subsectors

  %                                                                              The UK life sector received just under twice as much
100                                                                              premium volume as the non-life sector in 2016, at £147
90                                                                               billion in premiums29. The non-life sector meanwhile
80
70
                                                                                 received approximately £77 billion in premiums in 2016 – see
60                                                                               Figure 21.
50
40                                                                               Figure 21: UK Life and Non-Life premium volume (£m, 2016)
30
20
10

        General                 Long-Term                    Total                Non-Life
                                                                                  Premium Volume                               77,374
        Business                 Business                   Business

            UK Public Sector    Overseas Public Sector    Other
            UK Private Sector   Overseas Private Sector                           Life Premium
                                                                                  volume                                                                 147,141

A leading UK exporter
One of the secondary impacts of being the world’s                                The UK Insurance market hosts a large number of
largest exporter of insurance and pensions is a significant                      companies. Many of these are authorised by UK
contribution to the UK’s balance of payments. The UK                             regulators to write insurance business, whilst other are
has experienced a consistently negative trade balance                            authorised in their parent country and ‘passport’ into
for almost 20 years, with Q3 1998 being the last quarter                         the UK. As of June 2017, there were 605 companies in the
to experience a positive trade balance being. Meanwhile,                         UK authorised to write motor insurance30; 229 of these
the UK insurance industry has experienced a consistently                         were authorised in the UK, and 376 passported in from
positive trade balance since at least 1986.                                      an EEA member state. In total 300 UK companies were
                                                                                 authorised to write some form of general insurance
Insurance is a significant exporter compared to other                            business; see Figure 22 for the full breakdown. It is worth
major industry sectors, both in the services and                                 noting that we do not have data on the number of these
manufacturing sectors. During 2013-15, the UK exported                           that are actually active.
£11.58 of insurance and pensions services on average
for each £1 that it imported28; by comparison the rest of                        Figure 22: General Insurance Authorisations (summer 2017)
the UK financial services sector exported just £4.55 on
average for every £1 of imported financial services, and                                                                Number of         Number of
the UK exported just 70 pence worth of trade in goods for                         Product                               UK                EEA              Total
every £1 imported.                                                                                                      companies         companies
                                                                                  Motor Insurance                            229               376          605

Market overview                                                                   Accident and Sickness                      253               359          612
                                                                                  Fire and damage to property                223               423          646
                                                                                  Marine, aviation and railway
Key companies                                                                     rolling stock
                                                                                                                             224               352          576

UK insurers and pension providers are among the                                   General liability                          229               399          628
largest companies in the UK. Thirteen of the FTSE100                              Credit and suretyship                      201               219          420
index of largest UK listed companies are either                                   Other classes                              264               458          722
insurance or pension providers, or own large insurance
                                                                                  Total companies                            300               624          924
/ pensions subsidiaries. Of these, the combined market
capitalisation of the eight insurance-focussed companies
in the FTSE 100 is substantial – just over £122 billion –
and comprises approximately 6% of the overall value of
the index. In addition to the large listed companies, there
are several large mutual and friendly societies, such as
NFU Mutual, LV= and Royal London.

                                       27
                                          ABI (2017) “Industry data: Invested assets”
                                       28
                                          ONS (2016) “UK Balance of Payments, Pink Book 2016 – Time Series Dataset”
                                       29
                                          Swiss Re Sigma 3 (2017)
                                       30
                                          Bank of England (2017) “Insurance Information – Lists of Insurers”
12     UK Insurance and Long-Term Savings: The state of the market

     The UK hosts significantly fewer companies that are
     authorised to transact life and pensions business,
     with 355 companies overall with some sort of life
     authorisation – of which 187 passport in from the EEA.
     Again, we do not have data on the number of these that
     are actually active.

     Figure 23: Life Insurance Authorisations

                                     Number of       Number of
      Product                        UK              EEA             Total
                                     companies       companies
      Life and annuity                    115             172         287
      Marriage and birth                   48              56         104
      Linked long-term                    142             138         280
      Permanent health                     94              39         133
      Tontines                             1                7          8
      Capital redemption                   47              79         126
      Pension fund management              60              40         100
      Collective insurance                 1                6          7
      Social insurance                     0                4          4
      Total companies                     168             187         355

       abi.org.uk

       @BritishInsurers
UK Insurance and Long-Term Savings: The state of the market                                                            13

Importance to UK households                                                                                                              Figure 25: UK household disposable incomes
                                                                                                                                         (£median, 2003-2017)
UK households are very diverse, with significant
variations in demographic background, income and
                                                                                                                                         31,000
assets. The insurance and pensions industry provides
                                                                                                                                         29,000
financial security and assistance across the whole
                                                                                                                                         27,000
spectrum of different household types, helping protect
                                                                                                                                         25,000
everything from their possessions to their pensions, and
                                                                                                                                         23,000
many things in-between.
                                                                                                                                         21,000
                                                                                                                                         19,000

Overview of UK households                                                                                                                17,000
                                                                                                                                         15,000

                                                                                                                                                  2003/04

                                                                                                                                                            2004/05

                                                                                                                                                                       2005/06

                                                                                                                                                                                 2006/07

                                                                                                                                                                                            2007/08

                                                                                                                                                                                                       2008/09

                                                                                                                                                                                                                 2009/10

                                                                                                                                                                                                                           2010/11

                                                                                                                                                                                                                                      2011/12

                                                                                                                                                                                                                                                2012/13

                                                                                                                                                                                                                                                          2013/14

                                                                                                                                                                                                                                                                     2014/15

                                                                                                                                                                                                                                                                               2015/16

                                                                                                                                                                                                                                                                                         2016/17
Size and composition
The UK population reached a new high in 2016, with                                                                                                    All households                              Retired households                                Non-retired households

65.631 million people living in just over 27 million32
households. The number of households in the UK has
increased by 7% since 2006; this increase has broadly                                                                                    Household expenditure on general insurance
stayed in line with population growth, resulting in the
average household size remaining at 2.4 people over the                                                                                  Households purchase a variety of different types of
past decade33.                                                                                                                           insurance to meet their needs. Households spent, on
                                                                                                                                         average, £16.30 a week on general insurance in 2016, and
Figure 24: UK Population / household count (millions,                                                                                    a further £21.50 a week on pensions and life assurance
2005-2016)34                                                                                                                             products; this equates to approximately £1966 a year, or
                                                                                                                                         around 7% of household disposable income. This is costing
                        m                                                                                              m                 households nearly £619 more than in 2012. For comparison,
                       27.5                                                                                            67
                                                                                                                                         households spent around £1200 on clothing and footwear
                       27.0
                                                                                                                       66
                                                                                                                                         and £1800 on household goods and services in 2016.
                                                                                                                       65
                       26.5                                                                                            64
                                                                                                                                         Motor insurance
Number of Households

                                                                                                                       63
                       26.0
                                                                                                                            Population

                                                                                                                       62                Motor insurance is the most widely held type of general
                       25.5
                                                                                                                       61                insurance product in the UK, with 74%36 of households
                       25.0                                                                                            60
                                                                                                                                         purchasing one or more policies in 2016. The median
                                                                                                                       59
                                                                                                                                         expenditure of these households on motor insurance
                       24.0
                                                                                                                       58
                                                                                                                                         was approximately £450/year in 2016; for comparison, the
                                                                                                                                         ABI’s motor premium tracker for 2016 showed an average
                       24.0                                                                                            57
                                                                                                                                         premium of £44137. Households spend significantly more
                              2005

                                     2006

                                            2007

                                                   2008

                                                          2009

                                                                 2010

                                                                        2011

                                                                                    2012

                                                                                           2013

                                                                                                  2014

                                                                                                         2015

                                                                                                                2016

                                                                                                                                         than this on purchasing and maintaining their vehicles;
                                            Number of Households                     Population                                          on average they spent £1227 purchasing vehicles, and a
The UK, like many countries, has a diverse range of                                                                                      further £1690 operating and maintaining them38.
household types. Over the past decade there has been a
66% rise in the number of multi-family households, and                                                                                   Figure 27: Average UK household motoring expenses
a 7% increase in the number of households with adult                                                                                     (£median, 2016)
children still living at home.
                                                                                                                                                                                                                                                                    1,227
                                                                                                                                                                                                                                     1,123

Household income
UK household incomes have been slowly increasing
in recent years, following several years of stagnant
                                                                                                                                                                                                      567
growth after the recession. The median UK household                                                                                                                   450
disposable income in 2015/16 was £26,683, an increase of
just over £560 on the previous year; disposable incomes
have grown on average by just under 3% per year since
2013/14 (Figure 25)35. Retired households have bucked
                                                                                                                                                               Motor                       Maintenance                               Petrol                  Purchase
the overall trend somewhat, with steady growth in                                                                                                            insurance                      of vehicles                                                      of vehicles
                                                                                                                                                              (median)
disposable incomes over the last decade.
                                                                               31
                                                                                  ONS (2017) “Population estimates”
                                                                               32
                                                                                  ONS (2017) “Living costs and food survey”
                                                                               33
                                                                                  ONS (2016) “Statistical bulletin: Families and households in the UK: 2016”
                                                                               34
                                                                                  ONS (2017) “Population estimates” and “Labour Force Survey”
                                                                               35
                                                                                  ONS (2017) “Statistical bulletin: Nowcasting household income in the UK: financial year ending 2017”
                                                                               36
                                                                                  ONS (2017) “Living Costs and food survey”, ABI analysis
14        UK Insurance and Long-Term Savings: The state of the market

     Home insurance                                                                         Other insurance expenditure
     The average household in the UK had approximately                                      Households spend money on a variety of other types of
     £34,900 worth of contents in their primary residence in                                insurance, protecting not only their property but their
     2012-1439; this is approximately 1.4 times as large as the                             incomes, their health and their future.
     annual household disposable income for that period.
                                                                                            In 2016, around 7% of households spent money on travel
     This represents a considerable amount of household
                                                                                            insurance – on average around £160 per year – compared
     wealth contained in the contents of people’s homes, and
                                                                                            to an average expenditure of £1200 per year on package
     many choose to take measures to protect these assets.
                                                                                            holidays. Just over 6% of households reported some
     Home contents insurance is the second most widely                                      level of expenditure on private medical insurance in 2016,
     held form of insurance amongst households, with 72%                                    with the median average expenditure at just over £528;
     having some form of contents insurance expenditure                                     meanwhile, around 22% of households had some sort of
     in 2016 40. Of those with contents insurance, the median                               life insurance coverage, spending on average £336 in 2016.
     expenditure was approximately £128 per year; similar
     equivalent household expenditures include an average of
     £125/year spent on cleaning materials.                                                 Households & pensions
     Many UK households own their own home, with
     64% of households living in their own home (with or                                    Contributing to pensions
     without a mortgage) compared to 36% who rent41. A                                      Households need to make provisions for later life to
     large proportion of these households purchase home                                     maintain their standard of living, with the state pension
     buildings insurance to help cover the risk of losing                                   currently providing just £159.55 a week (or £8,297 per
     their home to events such as flooding or fire; indeed,                                 year). In 2015/16 there were approximately 13.4 million
     mortgage providers generally require those in the 43%                                  actively contributing members of occupational pension
     of households purchasing with a mortgage to protect                                    schemes43 - schemes set up and administered by an
     their home. In 2016, approximately 61% of households                                   employer on behalf of their employees – and a further
     spent money on home buildings insurance – spending on                                  8.9 million44 members of personal pension schemes
     average £158 per household on obtaining cover.                                         (including group personal pensions, stakeholder
     A large proportion of households – 56% - chose to                                      pensions, etc.).
     combine their purchase of buildings and contents                                       This represents a considerable increase over the last
     insurance, and spent approximately £279 on a combined                                  few years, with the equivalent total in 2010/11 being
     policy42. For comparison, the ABI’s household insurance                                approximately 13.7 million active occupational and
     premium tracker recorded an average premium paid                                       personal pensions scheme members combined. This
     figure of £307 in 2016. It is also worth noting that, in 2016,                         increase has largely been driven by the introduction of
     households spent significantly more money on furniture -                               auto-enrolment, which legally requires employers to
     £848 - and newspapers and magazines - £280 – than they                                 enrol and contribute towards their employees’ pensions
     did on obtaining the peace of mind afforded by home                                    (unless the employee specifically opts out).
     insurance.
                                                                                            The average contribution of a scheme member can
     Figure 28: Average UK household expenditure on home                                    vary widely between the type of pension. For a Defined
     insurance (£median, 2016)                                                              Benefit (i.e. final/average salary) style occupational
                                                                                            pension scheme, the 2016 average contribution was
                                                             848
                                                                                            the equivalent of between 22.7% and 24.9% of salary,
                                                                                            depending on the valuation basis of the scheme; of this
                                                                                            total, the employee themselves contributed between
                                                                                            5.8% and 7.5% of their salary45.
                                                                                            Looking at Defined Contribution style occupational
                                                                                            schemes paints a radically different picture, with the
             279                                                           280              average overall contribution approximately 4.2% - of which
                                     158                                                    1% is contributed by the employee. This will likely increase
                         127
                                                                                            significantly in 2018, however, with the forthcoming rise in
                                                                                            minimum contributions for auto-enrolment schemes to
           Property    Property    Property                Furniture    Newspapers          3% from employees and 2% from employers46.
          Combined     Contents    Structure                           and magazines

     37
        ABI “Quarterly Motor Premium tracker”                                                           43
                                                                                                           ONS (2016) “Occupational Pensions Scheme Survey”
     38
        ONS (2017) “Living Costs and food survey”                                                       44
                                                                                                           HMRC (2017) “Table PEN6: Personal pensions”
     39
        ONS (2015) “Wealth and Assets Survey: Physical Wealth, Wealth in Great Britain, 2012 to 2014”   45
                                                                                                           ONS (2016) “Occupational Pensions Scheme Survey”
     40
        ONS (2017) “Living Costs and food survey”, ABI analysis                                         46
                                                                                                           The Pensions Regulator “Increases in minimum contributions
     41
        ONS (2017) “Labour force survey”                                                                   for automatic enrolment pensions”
     42
        ONS (2017) “Living Costs and food survey”, ABI analysis
UK Insurance and Long-Term Savings: The state of the market                                                                                                                               15

Households in retirement                                                           Household impact of recent Government
There were 11.8 million people aged 65 and older in the           47
                                                                                   legislation
UK in 2016 – approximately 18% of the population. This
proportion has been steadily growing over the last few
                                                                                   Insurance Premium Tax (IPT)
years, from 16% in 2010. The UK population is ageing.
                                                                                   The IPT rate has increased to 12%, around five times
Figure 29: UK population aged 65+ (%, 2010-2015)48                                 more than when it was first introduced in 1994 at 2.5%.
                                                                                   The latest increase could add around £50 to the average
     %                                                                             annual household bill51. Those who are likely to see their
18.00
                                                                                   premiums rise the most are young and older drivers, who
17.50                                                                              pay more for their motor insurance52.
17.00
                                                                                   Figure 31: Historical IPT rates (%, 1994-2016)53
16.50
                                                                                       %
                                                                                      25
16.00

15.50
                                                                                      20
         Mid-   Mid-     Mid-               Mid-       Mid-          Mid-
         2010   2011     2012               2013       2014          2015
                                Year                                                  15

There were approximately 8.75 million pensioner                                       10
households in 2016 49; a little over half of these (57%) were
couples, and the remainder were single. 97% of these                                  5

households received the state pension50, whilst 70% had
                                                                                      0
some form of private pension income. Investment income
                                                                                                      1994
                                                                                                      1995
                                                                                                      1996
                                                                                                      1997
                                                                                                      1998
                                                                                                      1999
                                                                                                      2000
                                                                                                      2001
                                                                                                      2002
                                                                                                      2003
                                                                                                      2004
                                                                                                      2005
                                                                                                      2006
                                                                                                      2007
                                                                                                      2008
                                                                                                      2009
                                                                                                      2010
                                                                                                      2011
                                                                                                      2012
                                                                                                      2013
                                                                                                      2014
                                                                                                      2015
                                                                                                      2016
was also a popular source of income for pensioner units
in 2016, with 63% in receipt of an average income of £260                                                                                            Standard rate                                                     Higher rate

a year. Additionally, approximately 17% of pensioner                               The amount of revenue raised from IPT, on a per
households still received income from employment.                                  household basis, stood at £179 in the 2016/17 fiscal
From a value perspective, 43% of their household income                            year54. The Government received £4.8 billion from
came from benefits (state pension, etc.), with a further                           Insurance Premium Tax in 2016/17. It is estimated that the
33% received from private and occupational pensions                                annual costs of IPT per household will increase to more
(see Figure 30 for the full breakdown).                                            than £200 from 201855.
Figure 30: UK pensioner income sources                                             Figure 32: Past and predicted IPT revenue to the
(% of pensioner households, 2016)                                                  exchequer (£bn, 1990-2021)

                                                                                                      7.00

                                                                                                      6.00

                                                   Benefit income 43%                                 5.00
                                                   Occupational pension 29%
                                                                                   IPT Revenue, £bn

                                                                                                      4.00
                                                   Personal pension income 4%
                                                   Investment income 8%                               3.00

                                                   Earnings 16%                                       2.00
                                                   Other income 1%
                                                                                                      1.00

                                                                                                      0.00
                                                                                                             1999-00
                                                                                                                       2000-01
                                                                                                                                 2001-02
                                                                                                                                           2002-03
                                                                                                                                                     2003-04
                                                                                                                                                               2004-05
                                                                                                                                                                         2005-06
                                                                                                                                                                                   2006-07
                                                                                                                                                                                             2007-08
                                                                                                                                                                                                       2008-09
                                                                                                                                                                                                                 2009-10
                                                                                                                                                                                                                           2010-11
                                                                                                                                                                                                                                     2011-12
                                                                                                                                                                                                                                               2012-13
                                                                                                                                                                                                                                                         2013-14
                                                                                                                                                                                                                                                                   2014-15
                                                                                                                                                                                                                                                                             2015-16
                                                                                                                                                                                                                                                                                       2016-17
                                                                                                                                                                                                                                                                                                 2017-18
                                                                                                                                                                                                                                                                                                           2018-19
                                                                                                                                                                                                                                                                                                                     2019-20
                                                                                                                                                                                                                                                                                                                               2020-21

                                       47
                                          ONS (2017) “Article: Overview of the UK population: July 2017”
                                       48
                                          ONS (2017) “UK and Regional population estimates 1838-2015”
                                       49
                                          Pensioner household defined as a single individual over state pension age (SPA), or couple with at least one individual over SPA
                                       50
                                          Department for Work and Pensions (2017) “Pensioners’ income series: financial year 2015/16”
                                       51
                                          SMF (2017) “The impact of Insurance Premium Tax on UK households”
                                       52
                                          ABI (2017) “News: news articles: 2017/05: third rise in insurance premium tax in under two years”
                                       53
                                          HM Revenue & Customs (2017) “UK trade info: Tax and duty bulletins: Insurance Premium Tax”
                                       54
                                          SMF (2017) “The impact of Insurance Premium Tax on UK households”
                                       55
                                          SMF (2017) “The impact of Insurance Premium Tax on UK households”
16     UK Insurance and Long-Term Savings: The state of the market

     SECTION 2
     General insurance
     By Rachel Pearson – Data & Analytics Adviser (General Insurance)

     The total market                                                                                                                                                   Figure 34: Total UK GI business by territory of risk (%, 2016)
     The UK general insurance market provides support and
     certainty to households and businesses within the UK
     and abroad, across a wide range of business lines. In
     2016, the overall size of the market reached £59 billion,
     of which £39 billion related to domestic risks, while                                                                                                                                                           UK 66%

     £20 billion was focussed overseas. This is, however,                                                                                                                                                            EU 17%
                                                                                                                                                                                                                     Other 10%
     only looking at ABI members – when looking to include
                                                                                                                                                                                                                     Home-Foreign 8%
     non-members, including notably business done through
     Lloyd’s of London, there was almost £87 billion worth of
     business written in the UK in 2016. Going forward in this
     document, unless stated otherwise, statistics represent
     ABI data providers only.
                                                                                                                                                                        Delving deeper into the ABI’s data, we clearly see the impact
     Figure 33: Total UK gross written premium (£m, 1995-2016)                                                                                                          of Solvency II, which came into effect in January 2016.
         £m
                                                                                                                                                                        This caused significant reshuffling, with many insurers
     70,000                                                                                                                                                             buying more reinsurance, or consolidating their books
                                                                                                                                                                        and passing risks from solo entities up to group level.
     65,000
                                                                                                                                                                        With Solvency II in mind, there have also been some
     60,000
                                                                                                                                                                        shifts in the way that the ABI has collected and calculated
     55,000                                                                                                                                                             the data, aligning ourselves as much as possible with
     50,000
                                                                                                                                                                        SII reporting, and allowing us to examine the market in
                                                                                                                                                                        more detail. For example, we are now able to calculate
     45,000                                                                                                                                                             underwriting results in terms of earned premiums,
     40,000                                                                                                                                                             and look at a more detailed breakdown of insurers’
                                                                                                                                                                        commission and expenses than ever before. We are also
              1995
                     1996
                            1997
                                   1998
                                          1999
                                                 2000
                                                        2001
                                                               2002
                                                                      2003
                                                                             2004
                                                                                    2005
                                                                                           2006
                                                                                                  2007
                                                                                                         2008
                                                                                                                2009
                                                                                                                       2010
                                                                                                                              2011
                                                                                                                                     2012
                                                                                                                                            2013
                                                                                                                                                   2014
                                                                                                                                                          2015
                                                                                                                                                                 2016

                                                                                                                                                                        now taking into consideration changes in provisions for
     This represents market growth of £1.5 billion, or 3% on                                                                                                            future claim payments within Gross Claims Incurred.
     2015, of which almost £2 billion came from foreign risks.
                                                                                                                                                                        The reinsurance industry stood out in particular in 2016,
     Over a third of business written by UK insurers is written
                                                                                                                                                                        with an increase in the proportion of Gross Written
     through either the overseas branches or subsidiaries of
                                                                                                                                                                        Premiums being ceded to reinsurers to a record 29% of
     UK entities, or through Freedom of Services, highlighting
                                                                                                                                                                        UK business. This record is unsurprising given:
     just how significant the international dimension is for
     our sector, and how important it is to maintain strong                                                                                                             1. The impact of Solvency II on capital requirements,
     trade relations. With the UK having voted to withdraw                                                                                                                 which has made increased reinsurance protection
     from the European Union in June 2016, and triggering                                                                                                                  more attractive for certain firms;
     Article 50 in March 2017, a difficult and complicated
                                                                                                                                                                        2. The continued softening of a global reinsurance market
     set of negotiations has now begun, creating significant
                                                                                                                                                                           swimming in capital as a result of the rise of Insurance-
     uncertainty about the shape of the UK insurance
                                                                                                                                                                           Linked Securities (ILS) and alternative capital.
     industry’s future presence in Europe.

       abi.org.uk

       @BritishInsurers
UK Insurance and Long-Term Savings: The state of the market                                    17

Figure 35: Proportion of total GWP reinsured (% , 1995-2016)                                                                                                    Returning to the direct market, Insurance Premium Tax
                                                                                                                                                                has been making headlines recently, having been hiked
%                                                                                                                                                               up for the third time in just two years, and doubling since
100                                                                                                                                                             November 2015. The most recent rate increase, from 10%
                                                                                                                                                                to 12%, is estimated to cost the average household an
80                                                                                                                                                              extra £47 a year, and has been labelled as a ‘raid on the
                                                                                                                                                                responsible’ by the ABI.
60                                                                                                                                                              In February 2017, the Ministry of Justice announced that
                                                                                                                                                                the Ogden Discount Rate would change, for the first
                                                                                                                                                                time since 2001, from 2.5% to -0.75%. This is the rate
40
                                                                                                                                                                used in calculating lump-sum compensation for those
                                                                                                                                                                suffering life changing injuries. The announcement sent
20                                                                                                                                                              shockwaves through the industry, with insurers facing an
                                                                                                                                                                immediate, sizeable capital hit, followed by significant
0                                                                                                                                                               ongoing increased costs, which will inevitably feed
                                                                                                                                                                through into motor and liability premiums. Subsequently,
      1995
             1996
                    1997
                           1998
                                  1999
                                         2000
                                                2001
                                                       2002
                                                              2003
                                                                     2004
                                                                            2005
                                                                                   2006
                                                                                          2007
                                                                                                 2008
                                                                                                        2009
                                                                                                               2010
                                                                                                                      2011
                                                                                                                             2012
                                                                                                                                    2013
                                                                                                                                           2014
                                                                                                                                                  2015
                                                                                                                                                         2016
                                                                                                                                                                the Government has announced plans to change the
                      Reinsurance Ceded (£m)                                         Net Written Premium(£m)
                                                                                                                                                                legal basis on which the Discount Rate is set, with the
                                                                                                                                                                intention of the rate returning to a level that more
There has also been a significant increase in the number                                                                                                        realistically represents the investment behaviour of
of ABI members now reporting for reinsurance, with ABI                                                                                                          claimants.
members’ share of the UK reinsurance market more than
doubling since 2015.                                                                                                                                            Figure 37: Total UK GI market underwriting result
                                                                                                                                                                (%, 1983-2015)
This year saw insurers paying out more in claims, driven
by the direct market where Gross Claims Incurred grew                                                                                                            %
                                                                                                                                                                10
by 6% on 2015. However, it was reinsurers that picked
                                                                                                                                                                5
up much of the additional bill here, paying out a record
                                                                                                                                                                0
share of claims at 34%. Without this, the insurance
                                                                                                                                                                -5
market could have been telling a very different story.
                                                                                                                                                                -10
This also demonstrates a shift in the balance of the
                                                                                                                                                                -15
market, with reinsurers’ share of claims higher than the
                                                                                                                                                                -20
proportion of premiums ceded to reinsurance for the first
                                                                                                                                                                -25
time since 2005, as shown in Figure 36.
                                                                                                                                                                -30
                                                                                                                                                                -35
Figure 36: Proportion of business reinsured against
                                                                                                                                                                      1983

                                                                                                                                                                             1985

                                                                                                                                                                                    1987

                                                                                                                                                                                           1989

                                                                                                                                                                                                  1991

                                                                                                                                                                                                         1993

                                                                                                                                                                                                                1995

                                                                                                                                                                                                                       1997

                                                                                                                                                                                                                              1999

                                                                                                                                                                                                                                     2001

                                                                                                                                                                                                                                            2003

                                                                                                                                                                                                                                                   2005

                                                                                                                                                                                                                                                          2007

                                                                                                                                                                                                                                                                 2009

                                                                                                                                                                                                                                                                        2011

                                                                                                                                                                                                                                                                               2013

                                                                                                                                                                                                                                                                                      2015
proportion of claims incurred paid by reinsurers
(% , 1999-2016)

%
50

40

30

20

10

0
      1999
              2000
                      2001
                              2002
                                         2003
                                                2004
                                                         2005
                                                                 2006
                                                                            2007
                                                                                   2008
                                                                                           2009
                                                                                                   2010
                                                                                                               2011
                                                                                                                      2012
                                                                                                                              2013
                                                                                                                                      2014
                                                                                                                                              2015
                                                                                                                                                         2016

                      Reinsurance Ceded                                              Reinsurance’ Share
18       UK Insurance and Long-Term Savings: The state of the market

     Motor                                                                                      Figure 39: Average UK premium for private car (including IPT)
                                                                                                (£, 2012Q1-2017Q3)
     After the first year of underwriting profit in 21 years in
     2015, the UK insurance market made a loss of £194m
                                                                                                  £
     in 2016, with a Combined Operating Ratio of 102.3%.                                        600
     This was very much expected however, with rising
     claims costs – particularly relating to repair bills and the                               500
     weakening of the pound - putting significant pressures
     on the market. The losses were contained within the                                        400
     domestic market, with commercial motor insurance
     making an underwriting profit for the second year in a                                     300
     row. The size of the market has been growing steadily,
     with Gross Written Premiums for comprehensive private                                      200
     car policies growing 12% from 2015 to £12 billion. There
     has also been steady growth in volume in recent years,                                     100
     with over 27m policies written in 2016.
                                                                                                0
     Figure 38: UK direct motor GWP (£m) and underwriting

                                                                                                      2012 Q1
                                                                                                      2012 Q2
                                                                                                      2012 Q3
                                                                                                      2012 Q4
                                                                                                      2013 Q1
                                                                                                      2013 Q2
                                                                                                      2013 Q3
                                                                                                      2013 Q4
                                                                                                      2014 Q1
                                                                                                      2014 Q2
                                                                                                      2014 Q3
                                                                                                      2014 Q4
                                                                                                      2015 Q1
                                                                                                      2015 Q2
                                                                                                      2015 Q3
                                                                                                      2015 Q4
                                                                                                      2016 Q1
                                                                                                      2016 Q2
                                                                                                      2016 Q3
                                                                                                      2016 Q4
                                                                                                      2017 Q1
                                                                                                      2017 Q2
                                                                                                      2017 Q3
     result (%, 1995-2016)
        £m                                                                                %     With premiums rising rapidly, young drivers were the
     16,000                                                                               5
                                                                                                unexpected exception to the rule, with the average
     14,000                                                                                     premium for those aged 18-20 falling from £997 in 2015
                                                                                          0
                                                                                                to £973, with telematics encouraging and rewarding safer
     12,000
                                                                                                driving. Younger drivers continued to pay comfortably
                                                                                          -5
     10,000                                                                                     the highest premiums however, and claimed significantly
     8,000                                                                                -10
                                                                                                more frequently than any other age group. The only age
                                                                                                group that had a higher average claim cost than 18-20
     6,000
                                                                                          -15   year olds was the over 91s, whose average claim was over
     4,000                                                                                      £5,500, driven up by a few large claims in a very small
                                                                                          -20   pool of drivers.
     2,000
                                                                                                Claims costs dominated the motor insurance industry in
     –                                                                                    -25
                                                                                                2016, with the domestic claims ratio at its highest level
              1995
              1996
              1997
              1998
              1999
              2000
                              2001
                              2002
                              2003
                              2004
                                         2005
                                                2006
                                                2007
                                                2008
                                                2009
                                                              2010
                                                              2011
                                                                     2012
                                                                     2013
                                                                            2014
                                                                            2015
                                                                                   2016

                                                                                                since the LASPO reforms came into effect in 2012. This
                             GWP(£m)            Underwriting Result (%)                         is even without the full impact of the Ogden Discount
                                                                                                Rate change coming through, with the Discount Rate
                                                                                                having been adjusted in early 2017, for the first time
                                                                                                since 2001, from 2.5% to -0.75%. Bodily injury claims are
     Motor premiums reached a record high at the end of
                                                                                                unsurprisingly the most expensive part of claims costs for
     2017 Q3, at £485, £57 higher than the average motor
                                                                                                insurers, with 40% of all private car claims costs paid out
     premium at the beginning of 2016. Rising repair costs,
                                                                                                relating to bodily injury claims.
     repeated hikes in Insurance Premium Tax, and with the
     industry anticipating significantly higher bodily injury
                                                                                                Figure 40: Gross claims paid for private car, split by type
     claims costs following the Ogden Discount Rate change in
                                                                                                of claim (%, 2016)
     February 2017, all contributed to this trend. In the second
     quarter of 2017, the ABI was also able to measure average
     premiums month by month, to better understand the
     instant impact of increases in IPT. The AA suggested                                                                                    Bodily Injury 41%
     that this rise in IPT could increase the number of people                                                                               Theft 3%
     choosing to risk driving uninsured56, at the same time as                                                                               Property Damage 23%
     the Motor Insurers Bureau reported the first rise since                                                                                 Accidental Damage 25%
     2004 in the number of claims against uninsured drivers57.                                                                               Windscreen Only 2%
                                                                                                                                             Replacement Vehicle 5%
                                                                                                                                             Other 1%

                                            56
                                                 ABI (2017) “Helping Britain Thrive”19 ONS (2016) “UK Balance of Payments, Pink Book 2016”
         abi.org.uk
                                            57
                                                 ABI Statistics – Invested Assets

         @BritishInsurers
UK Insurance and Long-Term Savings: The state of the market                                                                                                             19

In the Queen’s Speech in 2017, the Government                            Figure 41: Average cost (£) and volume (000’s) of motor
announced that they would tackle escalating whiplash                     theft claims (1996-2016)
claims in their Civil Liability Bill, following many years of
                                                                                                                                                                                                                                                                          %
ABI campaigning on the topic. Whiplash type claims have                                                          120                                                                                                                                                      6,000
remained high in recent years, with over 671,000 people
making a whiplash type claim in 2016/201758. Proposed

                                                                                                                                                                                                                                                                                  Average cost of settled theft claim (£)
                                                                                                                 100                                                                                                                                                      5,000

                                                                         Number of theft claims settled (000s)
reforms, including increasing the small claims track (SCT)
limit to £5,000, seek to tackle the growing compensation                                                         80                                                                                                                                                       4,000

culture, while still ensuring that genuinely injured
claimants receive the care and compensation they need.                                                           60                                                                                                                                                       3,000

While the use of Advanced Driver Assistance Systems                                                              40                                                                                                                                                       2,000
(ADAS) is growing, with the industry fully supporting
the development of autonomous driving, replacing and                                                             20                                                                                                                                                       1,000

repairing cars with such sophisticated technology proves
                                                                                                                 0                                                                                                                                                        0
more complex, and naturally more expensive59. Rising

                                                                                                                       1996
                                                                                                                              1997
                                                                                                                                     1998
                                                                                                                                            1999
                                                                                                                                                   2000
                                                                                                                                                          2001
                                                                                                                                                                 2002
                                                                                                                                                                        2003
                                                                                                                                                                               2004
                                                                                                                                                                                      2005
                                                                                                                                                                                             2006
                                                                                                                                                                                                    2007
                                                                                                                                                                                                           2008
                                                                                                                                                                                                                  2009
                                                                                                                                                                                                                         2010
                                                                                                                                                                                                                                2011
                                                                                                                                                                                                                                       2012
                                                                                                                                                                                                                                              2013
                                                                                                                                                                                                                                                     2014
                                                                                                                                                                                                                                                            2015
                                                                                                                                                                                                                                                                   2016
vehicle repair costs are proving increasingly problematic
for insurers, with increasingly expensive spare parts
being required, and the weakening of the pound forcing
up import costs. Brexit is also expected to exacerbate the
situation, with the SMMT warning that a poor deal, or no
deal would add further pressure on import, and therefore
repair costs60.
Theft has also been on the rise, with the number of
theft claims reaching its highest levels since early 2013,
although nowhere near the heights of the 1990s and
early 2000s. The cost of these claims has also been rising,
with the average theft claim costing 15% more in just 18
months. The police have been reporting a similar trend,
with a 19% rise since April 2015 in the number of thefts
of motor vehicles61. As the number of cars on the market
with keyless entry systems grows, thieves are increasingly
intercepting these signals to hack into and steal the car.
With thieves targeting these higher-end cars, this will
undoubtedly be a driver of the increasing average cost
of theft.

                                58
                                   Department for Work and Pensions’ Compensation Recovery Unit (CRU)
                                59
                                   http://news.thatcham.org/pressreleases/repair-focus-2017-thatcham-research-calls-for-new-
                                   thinking-and-approaches-to-halt-spiralling-cost-of-repair-2002192
                                60
                                   https://www.smmt.co.uk/2017/07/government-urged-put-automotive-heart-brexit-agenda-uk-
                                   motorists-face-10-increase-servicing-costs/
                                61
                                   https://www.ons.gov.uk/peoplepopulationandcommunity/crimeandjustice/bulletins/
                                   crimeinenglandandwales/yearendingmar2017
20     UK Insurance and Long-Term Savings: The state of the market

     Property                                                                                                                                                               The aftermath of Storm Desmond, Eva and Frank
                                                                                                                                                                            formed the greatest hurdle for property insurers in
     There was a collective sigh of relief at the end of 2016, as
                                                                                                                                                                            2016, as insurers were left with the significant costs and
     insurers welcomed a year of benign weather. As the UK
                                                                                                                                                                            challenges caused by the floods, with an estimated
     began to recover from the effects of Storms Desmond,
                                                                                                                                                                            15,000 claims costing around £1.3 billion. With flooding
     Eva and Frank at the end of 2015, insurers’ results also
                                                                                                                                                                            becoming a growing risk for families across Britain,
     began to pick back up, with a Combined Operating Ratio
                                                                                                                                                                            the launch of Flood Re in April 2016, after years of
     of 89.3 (the lowest since 2004), and Direct Gross Written
                                                                                                                                                                            development by the ABI and wider industry, has helped
     Premiums growing by 4% to £10.4 billion.
                                                                                                                                                                            to keep home insurance accessible and affordable for
                                                                                                                                                                            those living in high flood risk areas.
     Figure 42: UK direct property gross written premium
     (£m , 1995-2016)
                                                                                                                                                                            Figure 44: UK Gross property claims incurred per quarter
        £m                                                                                                                                                                  (£m, 2004-2017)
     12,000
                                                                                                                                                                              £m
     10,000                                                                                                                                                                 3,000

      8,000                                                                                                                                                                 2,500

      6,000                                                                                                                                                                 2,000

      4,000                                                                                                                                                                 1,500

      2,000                                                                                                                                                                 1,000

           -                                                                                                                                                                500
                  1995
                         1996
                                1997
                                       1998
                                              1999
                                                     2000
                                                            2001
                                                                   2002
                                                                          2003
                                                                                 2004
                                                                                        2005
                                                                                               2006
                                                                                                      2007
                                                                                                             2008
                                                                                                                    2009
                                                                                                                           2010
                                                                                                                                  2011
                                                                                                                                         2012
                                                                                                                                                2013
                                                                                                                                                       2014
                                                                                                                                                              2015
                                                                                                                                                                     2016

                                                                                                                                                                            0
                                                                                                                                                                                    2004

                                                                                                                                                                                           2005

                                                                                                                                                                                                  2006

                                                                                                                                                                                                         2007

                                                                                                                                                                                                                2008

                                                                                                                                                                                                                         2009

                                                                                                                                                                                                                                2010

                                                                                                                                                                                                                                       2011

                                                                                                                                                                                                                                              2012

                                                                                                                                                                                                                                                     2013

                                                                                                                                                                                                                                                            2014

                                                                                                                                                                                                                                                                   2015

                                                                                                                                                                                                                                                                          2016

                                                                                                                                                                                                                                                                                 2017
     Figure 43: UK property underwriting result (% , 1983-2015)                                                                                                                                                        Domestic         Commercial

      %
     25                                                                                                                                                                     With more water than ever now running through families’
     20
                                                                                                                                                                            homes, and the increased tendency to hide plumbing
     15
     10                                                                                                                                                                     away out of sight and out of mind, there has been an
     5                                                                                                                                                                      increase in both the volume and cost of Escape of Water
     0                                                                                                                                                                      claims, with claims costs increasing 50% in the last three
     -5                                                                                                                                                                     years. The weakening of the pound, which has been
     -10
     -15
                                                                                                                                                                            driving up repair costs, and a shift from copper to plastic
     -20                                                                                                                                                                    pipes are thought to have been contributing to the rise in
     -25                                                                                                                                                                    volume and costs of claims in recent years. This has now
     -30                                                                                                                                                                    become a point of focus for the industry, with insurers
           1983

                   1985

                            1987

                                       1989

                                                1991

                                                            1993

                                                                    1995

                                                                             1997

                                                                                        1999

                                                                                                2001

                                                                                                         2003

                                                                                                                    2005

                                                                                                                             2007

                                                                                                                                         2009

                                                                                                                                                 2011

                                                                                                                                                          2013

                                                                                                                                                                     2015

                                                                                                                                                                            looking to better understand and combat this rapidly
                                                                                                                                                                            rising peril.
     Looking more closely at the domestic market, average
     premiums for combined buildings and contents                                                                                                                           Although burglaries are estimated to be down 72% since
     insurance fell through 2016, and reached a record                                                                                                                      199562, with households doing more to protect and
     low at the beginning of 2017 at just £297, with benign                                                                                                                 prevent, the total cost of individual theft claims started
     weather, cheap reinsurance, and high competition                                                                                                                       to rise again at the beginning of 2017, reaching £96m for
     keeping premiums low. The continuing penetration                                                                                                                       domestic theft in Q1 – the highest level since the end
     of aggregators will also be contributing to the overall                                                                                                                of 2012. With households holding increasing numbers
     fall in prices, with 20% of Gross Written Premiums now                                                                                                                 of gadgets and expensive goods, the average cost of
     written through price comparison sites. Premiums picked                                                                                                                domestic theft claims hit a peak at the beginning of 2017,
     up slightly in the second and third quarters of 2017, as                                                                                                               more than doubling in just 10 years.
     Insurance Premium Tax was increased for the third time
     in just two years to 12%.

       abi.org.uk
                                                                                         https://www.ons.gov.uk/peoplepopulationandcommunity/crimeandjustice/
                                                                                        62

       @BritishInsurers                                                                 bulletins/crimeinenglandandwales/yearendingdec2016
UK Insurance and Long-Term Savings: The state of the market                                    21

As the 350th anniversary of the Great Fire of London                    Liability (including cyber insurance)
came around in September 2016, the ABI called for a
                                                                        Reinsurance protection saved the day for liability
review of fire regulations, paying particular attention
                                                                        insurers, who saw record underwriting profits of £312m
to the need for sprinklers in buildings with vulnerable
                                                                        in 2016. With gross claims rising, reinsurers paid out
occupants, including schools and care homes, as well as
                                                                        over 50% of claims following a significant shift towards
warehouses over 2,000m2. Fire is by far the most costly
                                                                        reinsurance in 2015. This, combined with significant
peril for commercial property insurers, with over 50%
                                                                        reserve releases throughout the market, drove the
of the total claims paid out for fire & explosions. Similar
                                                                        underwriting profit in an environment that otherwise
to theft claims, while the volume of fire-related claims is
                                                                        surely would have led to underwriting losses.
decreasing, the impact of this is cancelled out by the cost
of these claims increasing rapidly, with the average fire
                                                                        Figure 45: UK liability underwriting result (% , 1983-2015)
claim costing almost three times more than claims ten
years ago.
                                                                          %
Following the catastrophic Grenfell Tower fire in June                   20

2017, insurers worked closely on the ground with those                   10
affected by the fire, and will continue to offer help and                0
support moving forward. There is now a countrywide                       -10
effort to review and amend building regulations, with a                  -20
public inquiry investigating what happened at Grenfell                   -30
Tower, and a forward looking Independent Review
                                                                         -40
of Building Regulations and Fire Safety for fire safety,
                                                                         -50
which the ABI has submitted a response to, advocating
for wide-ranging improvements to the building control                    -60
                                                                               1983

                                                                                      1985

                                                                                             1987

                                                                                                    1989

                                                                                                           1991

                                                                                                                  1993

                                                                                                                         1995

                                                                                                                                1997

                                                                                                                                       1999

                                                                                                                                              2001

                                                                                                                                                     2003

                                                                                                                                                            2005

                                                                                                                                                                   2007

                                                                                                                                                                          2009

                                                                                                                                                                                 2011

                                                                                                                                                                                        2013

                                                                                                                                                                                               2015
system, and clarity on the roles and responsibilities of
those involved.
In October 2017, the ABI launched ‘The Insurance                        GWP fell slightly in 2016, down to below £4 billion, with
Experiments’ – a series of short, accessible animations                 some of the business that used to be included under
helping consumers better understand their insurance.                    the ‘liability’ umbrella splitting out under the other
With property insurers accepting over 80% of claims                     Solvency II classes of insurance. Within Liability, Public
made in 2015 and 2016, the ABI is initially focusing on                 and Products Liability was the largest line at 40% of
property insurance, as the complex nature of add-ons                    GWP, while also making the least profit at just £23m, with
and limits can appear daunting to consumers, with this                  product recalls at an all-time high.
confusion ultimately leading to underinsurance.                         Employers’ liability had the lowest Combined Operating
                                                                        Ratio, at just 78, driven by a particularly low claims
                                                                        ratio, as reinsurers’ share of claims came to almost 60%.
                                                                        Changes in the Ogden Discount Rate will undoubtedly
                                                                        have an effect on the liability market, with insurers
                                                                        accounting for significant cost increases on high value
                                                                        claims. Even taking into consideration the expected
                                                                        revision of the calculation of the Discount Rate, there will
                                                                        still have been an overall reduction in the rate, driving up
                                                                        the pay-outs of large claims.
                                                                        The ABI, for the first time, is able to estimate the size of
                                                                        the UK cyber insurance market, at around £20m in 2016.
                                                                        This is however, likely to be just the tip of the iceberg,
                                                                        with much of cyber insurance expected to be written
                                                                        through Lloyd’s of London. Following the ‘Wannacry’
                                                                        crisis in May 2017, cyber insurance has been gaining more
                                                                        profile as part of the toolkit for businesses in managing
                                                                        cyber risk, and this should contribute to sustained
                                                                        growth over the coming years.

                               58
                                  Department for Work and Pensions’ Compensation Recovery Unit (CRU)
                               59
                                  http://news.thatcham.org/pressreleases/repair-focus-2017-thatcham-research-calls-for-new-
                                  thinking-and-approaches-to-halt-spiralling-cost-of-repair-2002192
                               60
                                  https://www.smmt.co.uk/2017/07/government-urged-put-automotive-heart-brexit-agenda-uk-
                                  motorists-face-10-increase-servicing-costs/
                               61
                                  https://www.ons.gov.uk/peoplepopulationandcommunity/crimeandjustice/bulletins/
                                  crimeinenglandandwales/yearendingmar2017
You can also read