State Health Insurance Exchange Websites: A Review, Discussion and Recommendations for Providing Consumers Information about Quality and Performance
←
→
Page content transcription
If your browser does not render page correctly, please read the page content below

State Health Insurance
Exchange Websites:
A Review, Discussion and Recommendations
for Providing Consumers Information about
Quality and Performance

          Carol Cronin, Executive Director
            Informed Patient Institute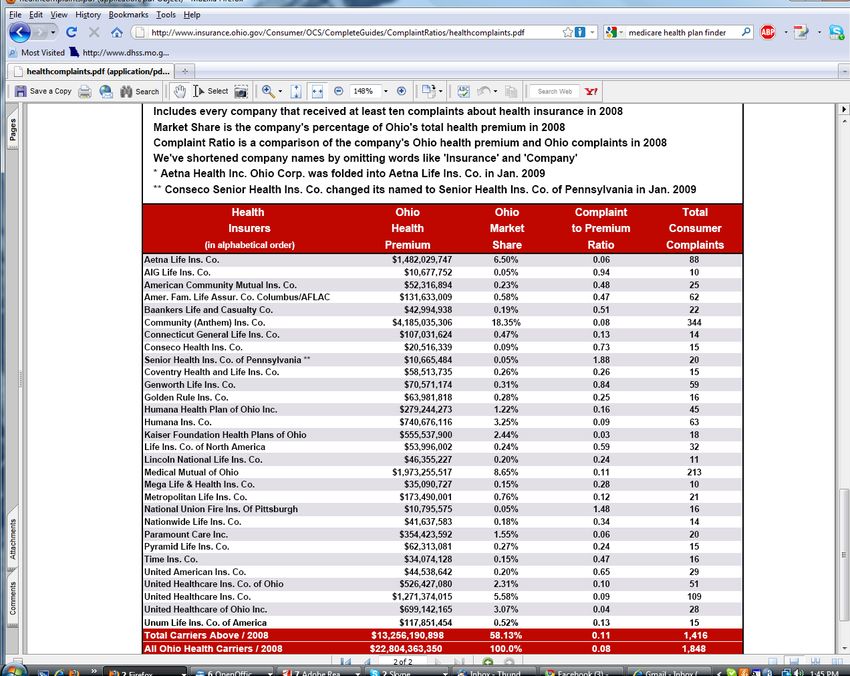
TABLE OF CONTENTS

I. INTRODUCTION.............................................................................................................Page 3

II. HEALTH INSURANCE EXCHANGES AND PERFORMANCE REPORTING.............5

III. MEASURING THE PERFORMANCE OF HEALTH PLANS: A BRIEF HISTORY.....6

IV. METHODOLOGY...................................................................................................................7

V. FINDINGS: REPORT CARD VARIABLES……......................................................9

A. Number of Health Plan Choices Available to Consider..............................................................9

B. Health Plan Quality and Patient Experience of Care ...............................................................12

C. Information on Complaints, Grievances, Appeals, Medical Loss Ratios and Compensation...17

D. Other Types of Performance and Cost/Payment Information...................................................21

VI. EDUCATION AND DECISION SUPPORT.......................................................................24

A. Educational Information...........................................................................................................24

B. Health Plan Selection Tools......................................................................................................26

C. Language and Use of Videos....................................................................................................30

VII. INTEGRATION OF INFORMATION ABOUT PHYSICIANS, HOSPITALS
AND OTHER HEALTH PROVIDERS....................................................................................32

VIII. CONCLUSION..................................................................................................................34

IX. COMPILED LIST OF RECOMMENDATIONS..............................................................35

SAMPLE REPORT CARD SCREENSHOTS:
NCQA Health Plan Report Card....................................................................................................38
MA Health Connector....................................................................................................................39
Medicare Plan Finder.....................................................................................................................40
WI State Employee Decision Guide..............................................................................................43
ME Bureau of Insurance................................................................................................................44
TX Dept. of Insurance....................................................................................................................45
OH Dept. of Insurance ..................................................................................................................46

APPENDIX: List of Health Plan Report Cards Reviewed......................................................48

                                                                      2
Copyright AARP, 2011. All rights reserved.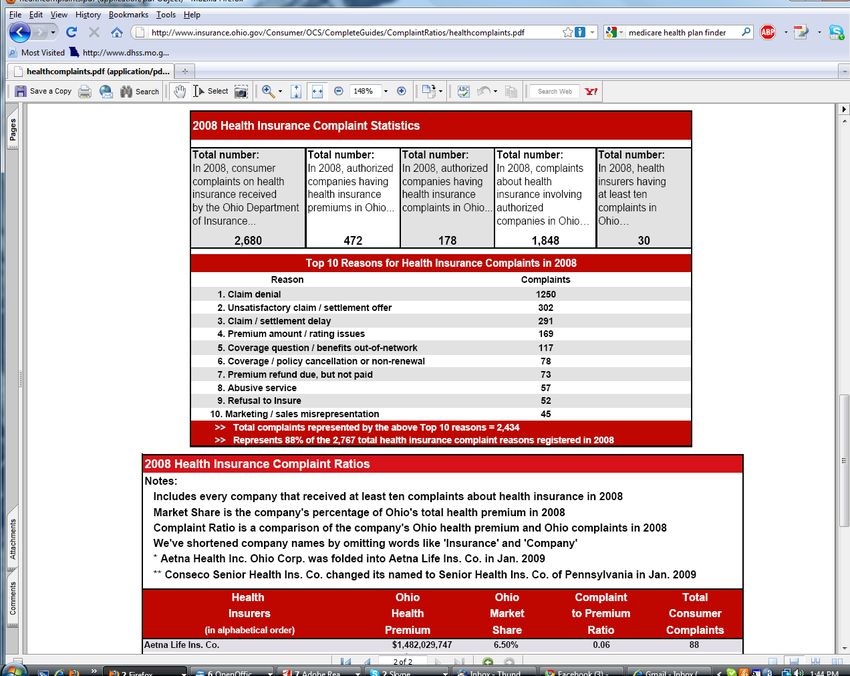
I. INTRODUCTION
A centerpiece of the recently enacted health reform legislation—the Patient Protection and
Affordable Care Act (ACA)—is the creation of state-level health insurance exchanges. The
exchanges must be certified by the Department of Health and Human Services (DHHS) by January
1, 2013 and fully operational by January 1, 2014. They are to provide a ―one-stop‖ place for
individuals and small employers to learn about their health insurance options and purchase the plan
that best meets their needs. By design, they should offer a structured way to compare health
insurance plan premiums, benefit packages, cost-sharing, and quality in order to facilitate a
purchase decision. A key element of their success will be the extent to which consumers and small
employers find the purchase experience to be informative and easy.
While the exchanges must undertake many important activities, those that relate to the consumer
shopping and purchase decision include:
Deciding which plans to offer
Maintaining a website that provides plan information in a standardized format
Operating a toll-free hotline
Establishing a navigator program to assist consumers
This study addresses the second health exchange function: maintaining a website—with a particular
focus on information about health plan quality and performance that could be made available to the
public to help them select a plan. To inform the decisions states will make about the content and
appearance of their websites, this study examines the current ―state-of-the-art‖ of online consumer-
oriented health plan report cards available in states and nationwide. These report cards bring
various types of quality, patient experience of care and other organizational information into one
consumer-oriented report available through the Internet. They usually provide information on
several aspects of performance for different types of managed care plans including Health
Maintenance Organizations (HMOs), Point-of-Service Plans (POS) plans, combined HMO/POS
plans and sometimes Preferred Provider Organization (PPO) plans.1
The exchanges can play a key role in ensuring that consumers (individuals and families as well as
small business purchasers) will have information they’ll need to make informed decisions in
selecting health insurance options. Several principles should guide their work:
Information provided by exchanges should be easy to understand and use.
1
Typically, information about quality is not available for fee-for-service programs. In the
commercial sector, managed care plans are the dominant insurance model. However, in Medicare,
the Medicare Advantage plans (which are largely managed care plans) represent only about 25
percent of the market. Information on quality in the Medicare program is generally available only
for the Medicare Advantage plans.
3
Copyright AARP, 2011. All rights reserved.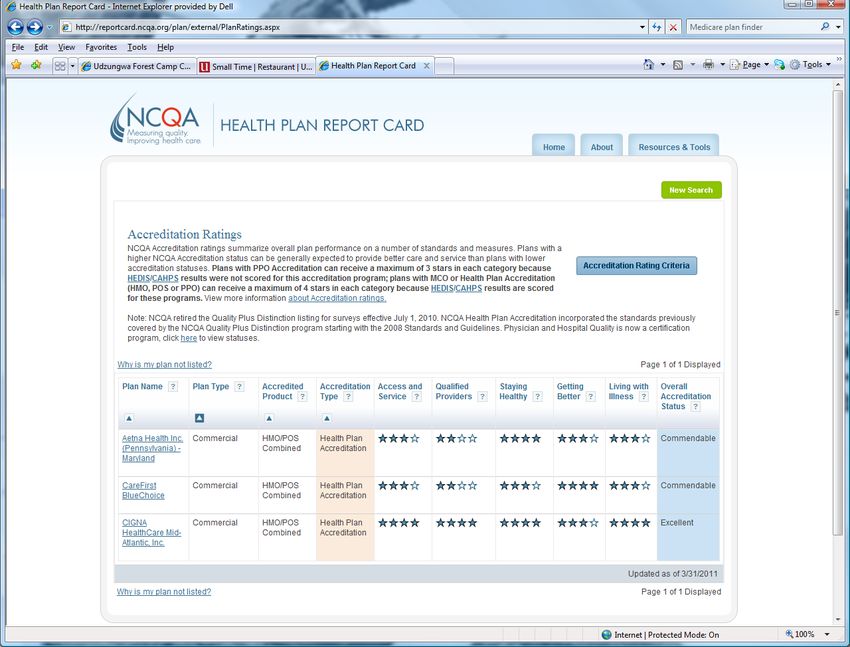
The quality of health plans offered through the exchange should be measured and publicly
reported based on accepted national standards.
Decision-support tools and ―plain language‖ educational materials should be available to
assist consumers.
Consumers should be involved in all aspects of exchange website design—including testing
performance report formats and site navigation to assure accessibility and understanding.
Report Overview
This report first summarizes the ACA requirements for the health insurance exchange websites. It
then provides a brief overview of managed care measurement systems that are typically used to
evaluate the quality of care in health plans, including the experience of care as reported by health
plan members. The methodology section details the review of 70 websites in six categories.
Findings describing the content of the report cards on the following topics are then presented:
Number of Health Plan Choices Available to Consider
Health Plan Quality and Patient Experience of Care
Information on Complaints, Grievances, Appeals, Medical Loss Ratios and Executive
Compensation
Other Types of Performance and Cost/Payment Information
Education and Decision Support
Integration of Information About Physicians, Hospitals and Other Health Providers
At the conclusion of each section, there is a brief discussion of issues raised by the findings and a
set of related recommendations. For the ease of readers most interested in the recommendations,
the concluding section contains a complete listing of all recommendations. In addition, to inform
the decisions exchanges will make when they begin operations, a prioritized list of the types of
performance information that should be made available by health insurance exchanges is also
provided in the recommendations section. Finally, screenshots of sample websites and an appendix
of all of the managed care report card websites reviewed for this study are also provided.
Purpose of this Study
The main purpose of this study was to determine the content of public reports on health plan quality
and performance, based on selected report cards from the database of the Informed Patient Institute
(IPI), a non-profit organization dedicated to providing consumer access to credible online
information about quality and patient safety. The study sought to identify the types of information
health plans currently report that might inform what exchanges websites will post when they first
begin operations. It is noteworthy that while consumers and purchasers have a great interest in
having plan-specific information on the cost of care, most of the report cards reviewed (which were
primarily sponsored by states) did not include actionable cost information—such as premiums or
out-of-pocket costs—that should be an essential part of health insurance exchange website
information. Therefore, due to the paucity of publicly-reported information on cost, this important
dimension of public reporting is addressed only to a limited extent in this report.
In addition, there may be other types of quality information presented by private or public
employers to convey plan performance to their employees, dependents and retirees during open
4
Copyright AARP, 2011. All rights reserved.
enrollment periods. Further research on these efforts to determine other areas of consumer-oriented
performance information that should be available through health insurance exchanges is strongly
recommended.
II. HEALTH INSURANCE EXCHANGES AND PERFORMANCE REPORTING
The ACA requires state health insurance exchanges to maintain an Internet website through which
consumers can get standardized comparative information on plans. Exchanges also must assign a
rating to each qualified health plan offered. DHHS is tasked with developing a system that rates
health plans on the basis of their relative quality and price.
The website must also include the results of plan enrollee satisfaction for plans that had at least 500
enrollees in the previous year and establish and make available a calculator to determine the actual
cost of coverage. The legislation notes that the Secretary will develop a model template for an
Internet website to assist consumers in making health insurance choices.
Health plans offered by the exchange must be accredited based on their local clinical quality and
patient satisfaction results as well as consumer access, utilization management, quality assurance,
provider credentialing, complaints and appeals, network adequacy and access and patient
information programs. Accreditation must be done by an entity recognized by the Secretary that has
transparent and rigorous methodological and scoring criteria.
In addition, the plans must disclose information on:
Claims payment policies and practices
Periodic financial disclosures
Data on enrollment
Data on disenrollment
Data on the number of claims that are denied
Data on rating practices
Information on cost-sharing and payments with respect to any out-of-network
coverage.
Information on enrollee and participant rights under this title
Other information as determined appropriate by the Secretary.
The law requires that this information shall be provided in plain language noting that ―plain
language‖ means language that the intended audience, including individuals with limited English
proficiency, can readily understand and use because that language is concise and well organized. It
requires that the DHHS Secretary and the Secretary of Labor jointly develop and issue guidance on
best practices of plain language writing.
Upon request, health plans on the exchange must provide information on the amount of cost-sharing
(including deductibles, co-payments, and coinsurance) for which individuals are responsible in
terms of specific items or services rendered by a participating provider. At minimum, such
information shall be made available through an Internet website or other means for individuals
without access to the Internet. Finally, as part of the certification process health plans must:
5
Copyright AARP, 2011. All rights reserved.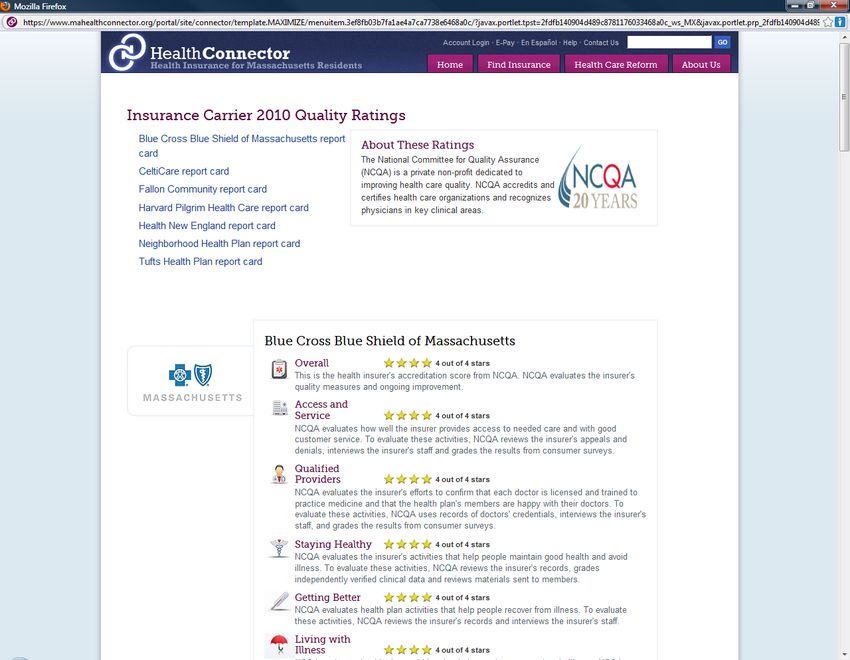
Provide information on health plan quality measures to enrollees and prospective enrollees,
and to each exchange in which the plan is offered.
Prominently post on their website premium increase justifications prior to their
implementation.
Health insurance exchange sponsors will need to address at least three aspects of providing
information to the public: 1) What quality and performance information is integrated into an online
health insurance exchange plan report card that consumers see as they review their plan options and
choose a specific plan; 2) What other types of plan performance information is publicly available
from the exchange, but not integrated into the selection website; and 3) What types of information
should be publicly disclosed by the plan itself rather than on the exchange. Recommendations
presented at the end of this report offer suggestions that address these questions.
III. MEASURING THE PERFORMANCE OF HEALTH PLANS: A BRIEF HISTORY
HEDIS: Accompanying the growth of managed care in the late 1980s and 1990s was the
development of a performance measurement system now called the Healthcare Effectiveness Data
and Information Set (HEDIS). HEDIS measures capture information about the care delivered in
health plans in a wide range of areas, such as preventive care, diabetes care, or heart care. The
National Committee for Quality Assurance (NCQA), an accreditor of managed care plans, is the
steward of HEDIS and as such, ensures that the measures remain consistent with current evidence,
maintains a data base of HEDIS performance scores, and provides technical support for HEDIS
users. A Medicaid and Medicare HEDIS was also developed to capture performance information
about those populations, but no longer exists as a separate measurement set. Now the same
measures are used and the results are stratified by type of coverage (i.e., Commercial, Medicare,
Medicaid).
CAHPS: Another major measurement tool was developed by the federal Agency for Healthcare
Research and Quality (AHRQ) in the mid-1990s. This validated tool, called the Consumer
Assessment of Healthcare Providers and Systems (CAHPS), is a patient survey that assesses
performance from the enrollee's perspective in areas such as getting needed care, getting care
quickly or how well doctors in the plan communicate. CAHPS and HEDIS are used by NCQA to
measure and accredit health plans. CAHPS surveys are available at several units of analysis, such as
the health plan, clinician/group, hospital, and nursing home levels. Each level could potentially be
useful for reporting patient experience in the exchanges. However, because this study examined
managed care report cards, only information on the availability of health plan CAHPS is
considered.
State agencies responsible for licensing HMOs and other types of health plans, such as State
Departments of Health, often require the collection and reporting of HEDIS and CAHPS
information as part of their oversight of these organizations. Another state agency—the
Departments of Insurance generally collects other types of information about health plans, such as
complaints, grievances, appeals and financial information.
6
Copyright AARP, 2011. All rights reserved.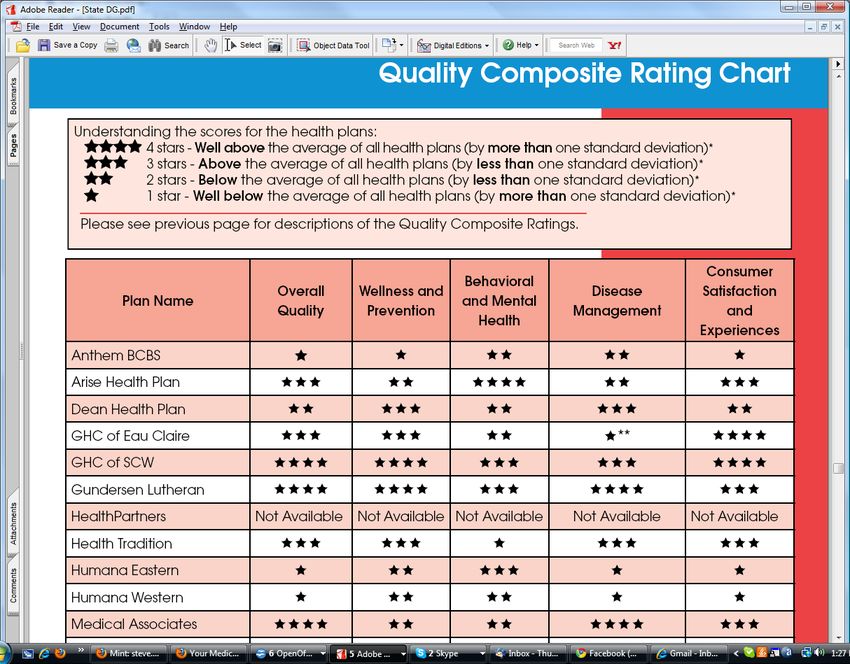
Early managed care report cards comparing multiple plan options were available to employees and
dependents of large employers. Local employer coalitions also made report cards available to their
employer members and their employees. States such as Florida, Maryland, Michigan, Minnesota,
New Jersey and New York printed and made publicly available HMO performance reports as early
as the mid-1990s. The growth of the Internet at that time allowed many of these reports to become
more accessible and their availability has grown. Now, managed care report cards are published by
a variety of sponsors including federal and state regulatory agencies, public and private purchasers,
and employer, consumer, and community groups. They are often featured as a resource during
annual ―open enrollment‖ periods when consumers have the opportunity to consider their health
insurance choices for the coming year.

IV. METHODOLOGY

This report analyzed 70 managed care report cards during the period October-November 2010.
Seven of the report cards offered information about health plans available nationwide, while 62
provided information from 34 different states and one at a regional level (Puget Sound, WA). The
report cards were drawn from the IPI database, which was initiated in 2007 when IPI staff
identified a wide range of online report cards—including those pertaining to managed care plans—
by conducting a state-by-state and national analysis. Since that time, the IPI database has been
maintained and updated. A list of all of the report cards reviewed for this report is available in the
appendix.

In general, the managed care report cards reviewed provided information from 2009 – 2011. Ten
report cards provided information prior to 2009, with the oldest from 2006. Most were free, though
permission was granted to review two subscription sites: Consumers' CHECKBOOK's Guide to
Plans for Federal Employees and Annuitants and Consumer Union's Consumer Reports on Health
Insurance. Most were designed for consumers—although a small number were more oriented to
health policy makers or employers.

                                                   7
Copyright AARP, 2011. All rights reserved.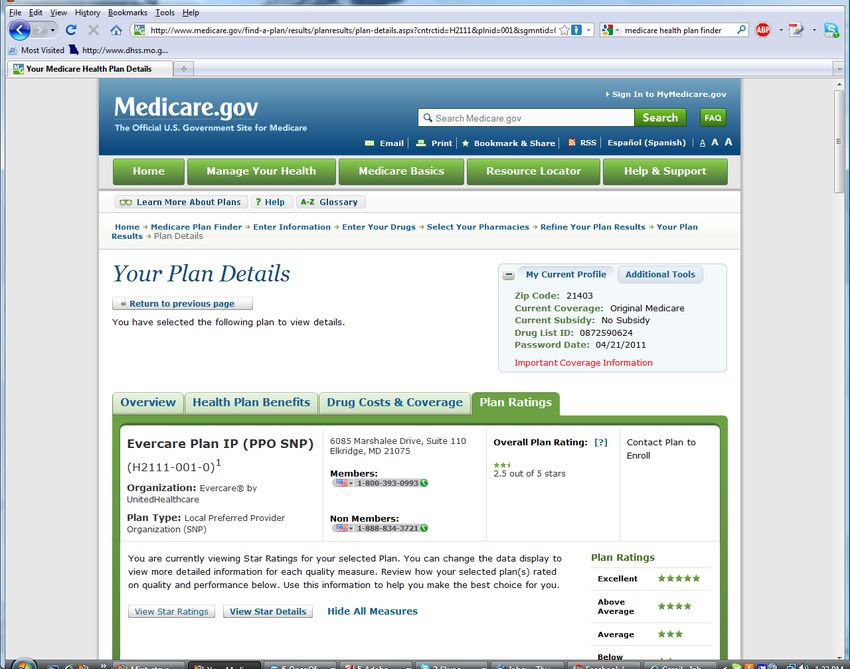
As indicated in Figure 1, several types of managed care report card sites were reviewed that varied
by sponsor or scope:

Figure 1: Types of Report Cards Reviewed              State Department of Health or other state
 Type of Report Cards        No. Reviewed             health organization report cards – These
                                                      report cards provided a range of quality,
 State Insurance                             25       patient satisfaction, and other types of
 Departments                                          information about a state's HMOs,
 State Health Departments                    15       HMOs/POS, and, sometimes, PPO plans.
 Medicaid                                    7        They were most often sponsored by a state
                                                      health agency such as the State Department of
 Non-profit Community                        5        Health (15 sites). Other types of sponsors
 Collaboratives                                       included non-profit community collaboratives
 National Report Cards                       5        made up of stakeholders from multiple
                                                      sectors, such as the Wisconsin Collaborative
 Public Employer                             5
                                                      for Healthcare Quality (5 sites) and employer
 Employer Coalition                          4        coalitions (4 sites). One site, the New York
                                                      State Health Accountability Foundation,
 Health Insurance Exchanges 4                         provided report card information in
 TOTAL                                       70       multiple states (Connecticut, New Jersey,
                                                      New York, Rhode Island, and Vermont).
                                                      Twenty-four of these sites were reviewed.

State Department of Insurance report cards – These sites provided information reflecting a
Department of Insurance's regulatory oversight of its state's health insurance plans, such as data on
complaints, grievances, appeals and financial information. The sites provided information about a
wide range of health insurance products besides managed care plans, such as individually purchased
health insurance and Medigap (i.e., Medicare supplemental insurance). They also included
information on other types of insurance such as auto or homeowners insurance. Twenty-five of
these sites were reviewed.

Report cards providing information nationwide – These five sites offered information about
plans nationwide. The nationwide sponsors included federal agencies, such as the federal
Department of Health and Human Services (DHHS) and the Centers for Medicare and Medicaid
Services (CMS), as well as non- profit organizations, such as the National Association of Insurance
Commissioners (NAIC), NCQA, and Consumers Union.

Health insurance exchanges – Websites for the two current health insurance exchanges were
reviewed: the Massachusetts Health Connector and the Utah Health Exchange. In addition, the
website for a small business membership organization, the Connecticut Business and Industry
Association, was reviewed. The Wisconsin Health Insurance Exchange has posted a prototype
website with fabricated information that was also reviewed.

Public employer health plan information - Five managed care report cards issued by public
employers were reviewed: the Federal Employee's Health Benefit Program (FEHBP) (providing
information nationwide); and three state employee benefit programs in California (CalPERS),

                                                  8
Copyright AARP, 2011. All rights reserved.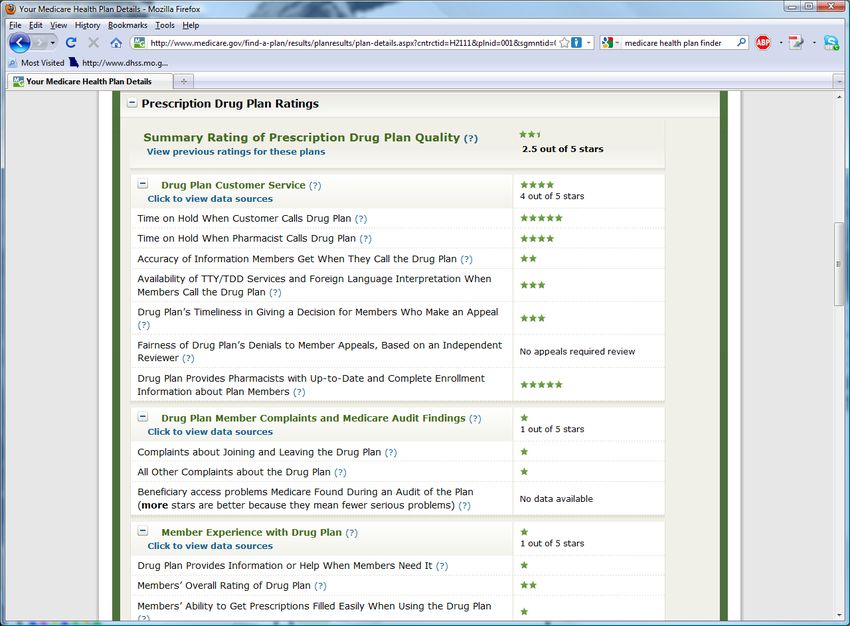
Maryland, and Wisconsin. Consumers' CHECKBOOK's Guide to Plans for Federal Employees and
Annuitants, which is available by subscription, was also reviewed.

Medicaid report cards – Seven Medicaid report cards were reviewed for California, Maryland,
Michigan, Pennsylvania, South Carolina, Virginia and Wisconsin.

V. FINDINGS: REPORT CARD VARIABLES

A. Number of Health Plan Choices Available to Consider

One function of the exchanges that affects the shopping and purchasing decision is the number of
health insurance plan choices available to consumers for consideration. Too many choices can
overwhelm decision making, while too few can limit an individual’s ability to match his needs to an
insurance option. Some also argue that if too few options are offered, the benefits of market
competition are reduced.

The number of choices available to consumers reflects differences in health care markets. In some
parts of the country (or even within states), there will be more choice than in other areas. To
illustrate these differences, we sought information about commercial managed care plans from two
national report card sites, NCQA and Consumers Union, for Maryland and Wyoming. We found
information for 10-13 plans in Maryland compared to just 2-3 in Wyoming.

When deciding on a health plan, there are at least three different aspects a consumer must consider,
each of which can affect quality and other performance issues to a greater or lesser extent. These
aspects are: the benefit package, type of health plan, and company offering the plan. At the highest
level is the company or corporation offering the health plan. Insurance companies may offer plans
in many or all states, such as Aetna, CIGNA, or UnitedHealthcare, or in one state or region, such as
a Blue Cross Plan, or Kaiser Permanente. In some cases, a health plan may just serve a local
market.

The next level of choice involves the types of health plans that are available, whether an Health
Maintenance Organizations (HMO), a Point of Service (POS), a Preferred Provider Organization
(PPO), or some other type of plan. The third, and probably most important, level of choice is the
actual benefit package offered—the combination of co-pays, deductibles, and benefits covered. For
example, the Massachusetts Health Connector Exchange structures choice by benefit level—the
―Bronze‖, ―Silver‖ or ―Gold‖ plans (also required in the ACA).

Number of organizations for which information is presented in report cards

The reviewed report cards varied significantly in the number of entities that were included in the
report. State health report cards varied from the two plans reviewed in the Rhode Island state
report card to over 60 in the Wisconsin Health Plan Report. The typical state report card included
8-10 plans. These report cards provided information only at the highest organizational level—by
product line at the corporate level. For example, the Maryland Health Plan Performance report
presents information about seven combined HMO/POS plans in the state (Aetna, Carefirst
BlueChoice, CIGNA, Coventry, Kaiser, MD-IPA and Optimum Choice) and three PPO plans
                                                 9
Copyright AARP, 2011. All rights reserved.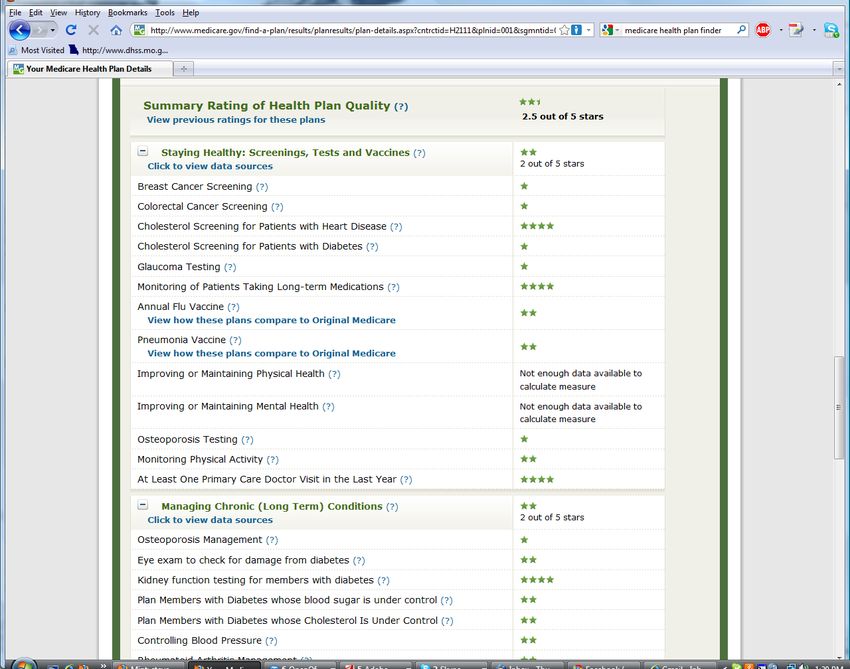
(Aetna, BluePreferred, and Connecticut General Life Insurance Company). Information that is
aggregated at the state-level can obscure local performance levels. Thus, consumers seeking
information about care in their local areas may not necessarily be able to draw valid conclusions
from state-wide reports.

Many of the state insurance department websites included information on dozens or hundreds of
insurance companies in the state—including health insurance companies. In some cases, they
indicated which of the health insurance companies were HMOs or other managed care plans, in
other cases, it was not possible to determine the type of health plan.

Number of plan options/benefit options

To assess the range of choices that are available at the plan and benefit option level, six report card
sites were reviewed in some detail. These sites more closely mirror what consumers using the
exchange likely will experience. These sites were: the FEHBP program, Healthcare.gov (utilizing
the section on health insurance plans for individuals and families), the Medicare Plan-Finder, Cal-
PERS, the Massachusetts Connector, and the Utah Health Exchange.

To conduct this assessment, in December 2010 and January 2011sample data for an individual
looking for health insurance in Maryland and Wyoming were entered into the Medicare Plan-Finder,
Healthcare.gov and the FEHBP site; data were also entered in the Massachusetts Health Connector
site for an individual from Boston and Pittsfield (a more rural city in Western, MA). The CalPERS
and Utah sites offered statewide options that did not vary by area.

As indicated in Figure 2, the two sites offering the highest number of choices were the
Healthcare.gov private health plan offerings in Wyoming (86) and Maryland (80). These results
included all types of health insurance options—not just managed care plans.

Medicare (with 41 plan benefit options in Maryland and 39 plan options in Wyoming) and the
Massachusetts Health Connector (with 42 options in Boston, MA and 29 in Pittsfield, MA) offered
the next highest number of plan options. The Federal Employee Health Benefit Plan offered a more
moderate set of choices, with 17 plan choices in Maryland and 13 in Wyoming.

At the other end of the spectrum, Cal-PERS offers six choices to their employees statewide—three
HMOs and three PPOs (excluding association plans only open to certain populations). The Utah
Health Exchange does not list benefit plan options to individuals and families, but rather directs
potential purchasers to the ―Get a Quote‖ sections of one of five health plans that offer coverage in
the state. It also provides links to websites that provide side-by-side comparisons of health
insurance options.

                                                   10
Copyright AARP, 2011. All rights reserved.
Figure 2: Number of Health Plan Offerings Available
Across Six Selected Sites
Name of Site # of plan
offerings
Healthcare.gov- WY 86
Healthcare.gov-MD 80
MA Healthconnector-Boston 42
Medicare-MD 41
Medicare-WY 39
MA HealthConnector- 29
Pittsfield
FEHBP-MD 17
FEHBP-WY 13
Cal-PERS 6
UT Health Exchange (links) 5
Discussion and Recommendations
Offering the ―right‖ level of choice for consumers as they consider their health insurance options
will be a challenge. This challenge is related to the larger policy decision about whether health
insurance exchanges will offer every plan that meets their criteria or be more selective purchasers
and offer fewer plans chosen on the basis of even more competitive criteria. It is instructive that
some of the most oft-cited large purchasers—FEHPB and CalPERS—offer more limited choice of
health plans than other report card sponsors reviewed. One could have a strategy to narrow plan
offerings over time after gaining experience on the quality of the options available as well as how
consumers navigate the available choices. A downside of this strategy however, is that individuals
and families who have existing provider relationships could be forced to change health plans and
therefore have their care relationships potentially disrupted.
To assist with choice, exchanges should build in tools and resources that help users narrow their
choices. As will be further detailed later, plan selection tools can assist in this task by taking
consumers through a process of considering their options and eliminating those that do not match
their personal preferences. Another tool used by some of the reviewed websites, such as Medicare's
Health Plan Finder and Healthcare.gov, is one that allows users to sort or narrow their choices based
on specific criteria, such as out-of-pocket limits, annual deductible, monthly premium, quality, or
doctor choice.
The multiple layers of the health plan choice adds complexity and confusion to the decision making
process as one is making a choice of a company, a type of plan (HMO, PPO) and a specific benefits
package (e.g., Bronze, Silver, Gold). The same companies offering plans through the exchange may
be offering other health plan products outside the exchange and to different populations, such as
Medicare or employers. Trying to minimize confusion by standardizing as much as possible the
names of products is one strategy that could be considered. For example including in the product
name the name of the company, the type of product and the annual deductible, such as Tufts Bronze
11
Copyright AARP, 2011. All rights reserved.1000 or Carefirst PPO 250 could potentially clarify the choice for people contemplating multiple
options.
RECOMMENDATONS:
Consider the burden of consumer decision making in deciding how many health plans to
offer. In general—fewer, rather than more, choices will assist in decision making.
Include tools and resources to assist consumers in narrowing choices.
Minimize consumer confusion by considering ways to standardize and ―name‖ health plan
benefit package options.
B. Health Plan Quality and Patient Experience of Care
HEDIS Scores and Information on Accreditation
A little over one-half of the reviewed sites (53% or 37 sites) included HEDIS quality information in
the managed care report card. Almost all of the national, state level and Medicaid report cards
report information on HEDIS measures, while only a few of the state insurance department report
cards included HEDIS information.
There was variation in the breadth of HEDIS information conveyed in the report cards. As will be
further discussed below, some report cards rolled up all HEDIS information into one overall score.
Others included a wide range of individual measure results. Some do both. For example, the New
York Health Accountability Foundation report cards included 32 separate HEDIS measures, the
California Office of the Patient Advocate included 29, the FEHBP program included 23, and the
Utah state report card included 21. Medicare's report card provided both a rolled up score and
information on 21 individual HEDIS scores. When published on a web page, the user viewing an
overall score can easily drill down to see the individual scores, if he is interested in more granular
information.
The most commonly reported HEDIS measures in the reviewed report cards were largely measures
that indicate whether a particular clinical process had been conducted, such as: breast cancer
screening, diabetes care measurements, blood pressure screening, and cervical cancer screening.
Medicaid report cards included more pediatric measures and measures of particular interest to that
population such as lead screening and dental visits. Medicare's report card included measures
applicable especially to older adults, such as glaucoma testing or prescriptions for rheumatoid
arthritis medications.
Twenty of the managed care report cards reviewed included accreditation status which was
primarily NCQA accreditation, but also included URAC, and the Accreditation Association for
Ambulatory Health Care (AAAHC).
12
Copyright AARP, 2011. All rights reserved.Patient Experience of Care
Similar to the HEDIS findings, 36 plans (51%) reported CAHPS patient experience of care
information. In many cases, managed care report cards included both HEDIS and CAHPS
information, though a few included one and not the other.
Information about CAHPS information was presented in a variety of ways ranging from a rolled-up
summary score to reporting by individual CAHPS questions. The results seen most often included
these questions and composites:
Overall rating of the health plan
Getting care quickly
Getting needed care
How well doctors communicated
Presentation Frameworks for Quality and Patient Experience of Care Information
Report cards used a variety of frameworks to organize the presentation of their quality information.
Seven of the report cards reviewed simply presented results for each HEDIS or CAHPS measure
individually. Most of them, however, used some type of framework to sort the performance
measures into categories. These categories included:
Disease or condition categories such as ―Heart‖ or ―Cardiovascular care‖, ―Diabetes‖, or
―Mental health‖
Demographic categories such as ―Women's health‖ or ―Children's health
Type of measure categories such as ―Access/Availability‖, ―Effectiveness of care‖, or
―Member satisfaction‖
Broad health categories such as ―Preventive care‖,‖ Acute care‖, ―Chronic care‖, or
―Behavioral health‖
Broad health categories described in ―plain language‖ such as ―Staying healthy‖, ―Getting
better‖ or ―Living with illness‖
Many report cards used several topic headings to convey performance results in different areas and
included some disease categories, some demographic categories, and some type of measure
categories. For example, topics on the Louisiana Health Finder
(http://www.healthfinderla.gov/CQHealthPlans.aspx) included: ―Customer satisfaction‖, ―Diabetes
care‖, ―Maternity care‖, ―Medical care‖, ―Women's health‖ and ―Youth care‖.
NCQA used a broader framework: ―Access & Service‖, ―Qualified providers‖, ―Staying healthy‖,
―Getting better‖ and ―Living with illness‖. (See Screenshot #1) This same framework is used in
other reports such as:
The Michigan HMO Consumer Guide
The New York Consumer Guide to Health Insurers (slightly modified)
The Massachusetts Health Connector (See Screenshot #2)
13
Copyright AARP, 2011. All rights reserved.The Medicare Plan Finder (See Screenshot #3) used the following framework: ―Staying healthy‖,
―Managing chronic (long term) conditions‖, ―Ratings of health plan's responsiveness and care‖,
―Health plan member complaints and appeals‖, and ―Health plan's telephone customer service.‖
How Report Cards Convey Plan Performance: Use of Easy-to-Interpret Methods
There were a variety of methods used to convey how well managed care plans did in comparison to
one another or to a benchmark. The use of these methods is intended to help the user determine
quickly how to interpret performance and draw the right conclusion about top or poor performers.
The most common format used to present performance results in the managed care report cards
were stars and bar graphs. Most star rating systems used either 1-3 stars or 1-4 stars to convey
relative performance—with more stars generally conveying higher performance. The Medicare
Plan Finder, however, used a 5-star rating system with 5 stars being excellent, 4-above average, 3-
average, 2-below average and 1-poor. The Medicare Plan Finder also included a Caution Symbol
(an exclamation point in a red triangle) for plans that had earned three stars or fewer for three years
in a row. To reinforce the caution symbol, an explanatory note was included: ―If you are
considering enrolling in this plan, look closely at the detailed ratings for this plan.‖
Other less common methods included:
Charts with percentages and numbers
―Consumer Reports‖-type circles
Checkmarks
Up/Down arrows
Grades (A-D)
Words such as ―Higher than average‖, ―Average‖, ―Lower than average‖
Color/Shading (green to indicate better performance/red-poor performance)
Rank ordering – with best plans appearing first
Functionality to permit sorting results based on performance
One report card sponsor (Maryland Health Care Commission) indicated the total number of
measures where the plan had an ―above average‖ score within four measure categories. For
example, one plan (Kaiser Permanente) had six measures with above average scores in the measure
categories of ―member satisfaction‖, ―preventive care‖, ―chronic care‖ and ―behavioral health‖.
Some reports used more than one method to convey relative performance. For example, the South
Carolina Medicaid Health Plan rating used green shading to accentuate the 3-star (top) rated plans.
A few report cards included an ―overall plan rating or score‖ that combines sub-scores into one or a
few overall numbers. These included:
Consumer Reports uses an overall score on a scale of 1 to 100. The three components of the
overall score are prevention and treatment (60% of score), enrollee satisfaction (25% of
score), and NCQA accreditation (15% of score). They also include subscores on Consumer
14
Copyright AARP, 2011. All rights reserved.Satisfaction, Prevention and Treatment using a ―1‖ to ―5‖ scale, ―1‖ being worse than
average and ―5‖ being ―better than average‖. The rankings and ratings are based on data and
analysis from NCQA through a new publishing arrangement between the two organizations.
The Massachusetts Health Connector includes an overall score based on NCQA's
accreditation score in addition to subscores for HEDIS results that are presented using the
same framework that NCQA uses: ―Access & Service‖, ―Qualified providers‖, ―Staying
healthy‖, ―Getting better‖ and ―Living with illness. Interestingly however, report card
information is not available for plans offered through the Commonwealth Care program for
lower income uninsured residents.
Medicare Plan Finder: Uses a 1-5 star overall plan rating that is prominently displayed on
the results page. The rating combines up to 53 measures in up to 5 categories (Staying
healthy, Managing chronic conditions, Ratings of health plan's responsiveness and care,
Complaints and appeals and Telephone customer service) depending on the type of plan
under consideration.
WI State Employees Decision Guide: Uses an ―Overall Quality Score‖ that is conveyed
using 1 to 4 stars. It includes subscore measures in each of the following areas: wellness
and prevention, behavioral and mental health, disease management and consumer
satisfaction and experiences based on HEDIS and CAHPS measures. Details about the sub-
scores are also available. (See Screenshot #4)
Benchmarks
Just under one-half of the reports reviewed compare plan performance to benchmarks: thirteen sites
use national averages for comparison, while 10 sites used state averages. Many of these showed
both national and state benchmarks. Other less commonly seen benchmarks included regional
averages (such as for New England) or ―best performing‖ or ―90th percentile‖ performance
regionally or nationwide.
Some report card sites also provided information on trends—how well the plans have done over
time. They offered users the option to click into information from previous years. The report card
for Wisconsin state employees included an ―up‖ or ―down‖ arrow indicating whether the plan ―had
statistically significant improvement in their score‖ from one year to the next.
Discussion and Recommendations:
Collecting and making available information about the quality of health plans will be an important
role of the health insurance exchanges. HEDIS and CAHPS information has long been collected by
a variety of health plan overseers and is well suited to being used by health insurance exchanges to
differentiate health plan performance. The measures are evidence-based, circulated for public
comment, and maintained for currency by a highly-respected measure steward. Therefore, ideally,
HEDIS and CAHPS information will be prominently featured by health insurance exchanges in the
first place on the website consumers go to compare information. For example, Medicare includes
15
Copyright AARP, 2011. All rights reserved.information about each plan's overall plan rating on the same page that it provides information
about the costs of the plan.
In addition, the way in which quality and patient experience information is conveyed should be
quickly interpretable and should include an overall score—or only a few higher level scores for
each plan. Users who want more information can be given the option to dig deeper for more details
if they desire. Designing information so that the user can clearly see ―at-a-glance‖ who is the best
or better performers using symbols such as stars, grades, words such as ―Better‖, ―Poorer‖ or colors
will make the information easier to use. Other methods of making information easier to interpret
such as rank ordering health plans by performance (or rank ordering within cost bands) or offering
the ability to sort health plans based on a factor of interest to the user could also be considered.
For those consumers who want to dig deeper and learn more about the underlying measures and
performance, creating an organizing framework for that information by disease or some other easily
understood categorization scheme will assist in using the information. Creatively thinking about
how certain types of more detailed information might be used is another option. For example,
HEDIS measures about the quality of maternity care (pre-natal and post-partum care) could be
featured near the health plan benefits section describing the plan's maternity benefits. Similarly,
information about performance on chronic care could be featured near the descriptions of those
benefits.
In designing report cards and scores based on measures, efforts should be made to help differentiate
the plans on the basis of their performance. One way is to set ―stretch‖ goals for health plans in the
quality arena so that plans that excel by performing well stand out. Rather than design a scoring
system where all health plans are compared to an ―average‖ performance benchmark, they could be
compared to stretch goals—such as the top 10% of plans in the state or nation. This approach will
also motivate plans to improve.
Enrollees and potential enrollees in health plans must be able to trust that the information they are
viewing reflects the performance of the plan that they are enrolling in. This will be determined by
the entity being measured—whether at the corporate organization level, the plan-type level (e.g.,
HMO vs. POS vs. PPO) or the benefit package level. Measuring at only the corporate level might
mask important differences among plan types. On the other hand, measuring at the benefit package
level might not be feasible, given smaller numbers of enrollees. Measurement should occur at the
level closest to that reflecting the actual plan performance that consumers' experience that is both
feasible and that captures differences amongst plan types.
In designing health insurance exchange health plan information, efforts should be made to include
users in the design phase of the information and to test the formats with potential users to ensure
that they understand and can navigate the information.
RECOMMENDATIONS:
Include information on health plan quality based on nationally endorsed measures,
particularly HEDIS and plan member experience of care based on CAHPs, in information
conveyed about plan performance.
16
Copyright AARP, 2011. All rights reserved.Feature plan quality and patient experience of care as prominently as other aspects of plan
information, such as costs.
Ensure that plan quality information can be interpreted ―at-a-glance‖ with the option for
users to dig deeper in areas of interest if desired. Use an organizing framework to categorize
more detailed information.
Consider using ―stretch‖ benchmarks or other approaches when creating plan quality scores
that will both motivate improvement and show variation among plans.
Measure plan performance at the level closest to that reflecting the actual plan that
consumers enroll in that is both feasible and that captures differences amongst plan types.
Include users in the design of health insurance exchange websites.
Test the design to ensure its usefulness and navigability to a range of consumers.
C. Information on Complaints, Grievances and Appeals, Medical Loss Ratios and Executive
Compensation
There are several types of performance information about health plans that are generally available
from state insurance departments including complaints, grievances, appeals, medical loss ratios (the
amount of a premium dollar spent on medical claims vs. administrative costs) and executive
compensation. This information is generally required to be reported to the state as part of their
regulation of insurance, though states vary as to whether and how it is reported to the public.
Typically, it is not integrated with information on the HEDIS and CAHPS results noted above, and,
frequently, it is neither presented in easy to read formats, nor is it easy to find.
Complaints, Grievances and Appeals on State Websites
There were several types of information on complaints, grievances, and appeals found in the
reviewed report cards. The information generally fell into one of the following three categories:
Information about issues or actions ―inside‖ the plan. These are complaints or grievances
from enrollees that are made to plan personnel. In a few report cards, information about
utilization review and outcomes was available—that is when the plan evaluates the
necessity, use, or appropriateness of a service or procedure.
Information about enrollee or provider complaints made to an external body, such as a state
insurance department, Medicare, or a public employer.
Information about external appeals decisions. This generally occurs after an enrollee has
exhausted internal health plan complaint processes and the case is reviewed by an
independent external organization.
17
Copyright AARP, 2011. All rights reserved.Public information about one of the three types of information above is available in 20 states and
through three national resources (Medicare, Consumers' CHECKBOOK's Federal Employee Guide,
and NAIC).
The most common type of information in this category is complaints to state governmental agencies
(usually a Department of Insurance) or to public entities like Medicare, the federal Office of
Personnel Management (for FEHBP participants), or a state employer agency. Fourteen states and
three national sites had this type of information. Often, the information includes the total number of
complaints to the agency, the market share or amount of premium written in the state by the health
insurer and some type of complaint ratio—which adjusts the number of complaints by the insurance
company's size.
Eight states provide some type of information about internal complaints, grievances or appeals.
Generally, the information provided includes the number of complaints/grievances filed and their
disposition (number decided in favor of the enrollee, number decided in favor of the plan). In some
cases, the disposition in favor of the enrollee is expressed as a ―reversal rate‖.
Seven states and one national site (Medicare) include information related to independent external
appeals. Usually this includes the number of external reviews about a health plan and their
disposition—whether decided in favor of the enrollee, in favor of the health plan or partially in
favor of both the plan and the enrollee.
Two states in the review (Connecticut and Maine) have information about utilization review (UR) in
a health plan. This includes the number of UR requests in the plan, the total number and percentage
of UR denials, the total number of denials that were appealed, and the total number and percentage
of denials that were reversed on appeal. Connecticut also includes utilization review statistics for
mental health, chemical dependency and alcohol and other drug services.
One state in the review (Maine Department of Insurance) has data on all four types of information
in this area (though the data in some cases are old) (See Screenshot # 5.) They publicly report:
1) A complaint index based on complaints to the state insurance department
2) The number of complaints received by the health plan and their disposition (including
reversal rate)
3) The number of first-time utilization review requests made to the plan, how many were
denied, how many were appealed and the number reversed
4) The number of external reviews upheld, overturned or withdrawn
New York State requires that health insurance plans pay claims to doctors and other providers
within certain timeframes. In their managed care report card, they include ―prompt-pay‖
complaints—the number of complaints from doctors and other providers about getting paid. They
also rank the health plans from 1-12 on their performance in this area. While this information is
mostly of interest to doctors, a poor rating in this area may result in higher doctor turnover thereby
affecting their patients.
18
Copyright AARP, 2011. All rights reserved.Medicare and NAIC Complaints and Appeals Information
The Medicare Plan Finder also includes information about complaints as part of its overall plan
rating. With reference to drug plan rating results, one of the sections of the ratings is: ―Drug Plan
Member Complaints and Medicare Audit Findings‖. The complaint related components of that
rating are:
1) Complaints about joining/leaving the drug plan (The number of complaints received
by Medicare from every 1,000 people enrolled in the plan)
2) All other complaints about the drug plan (How many other complaints Medicare got
about the drug plan)
With reference to Medicare health plans with or without drug coverage, complaints are part of the
overall plan rating in a section titled: Health Plan Member Complaints and Appeals. The
components of that section include:
1) Complaints about the health plan (How many complaints Medicare receives about the
health plan)
2) Timely decisions about appeals (% of plan members who got a timely response when
they made a written appeal to the health plan about a decision to refuse payment or
coverage)
3) Fairness of health plan's denials to a member's appeal, based on an independent
review (How often an independent reviewer agrees with the plan's decision to deny
or say not to a member's appeal)
The NAIC CIS database also includes complaint ratios about health plans nationwide. However
users can't see this information in a side-by-side comparative view, but rather must enter the name
of each company separately and dig through several screens to find the information.
As part of the ―Quality Ratings‖ section of their website, Consumers' CHECKBOOK's Guide to
Health Plans for Federal Employees and Annuitants also includes information on disputed claims
per 10,000 filed with OPM and the number in which the plan's initial decision was changed or
reversed.
Presentation Formats for Complaint and Appeals Information
Much of this type of organizational information is presented in charts with a list of the names of
health insurance companies, numbers, percentages, and ratios. In the case of complaints to State
Insurance Departments, it is sometimes difficult to tell which companies in a list are HMOs vs.
other types of insurance companies. Some websites break out HMOs separately or indicate them in
some way. For example, the Maryland format allowed the user to see the plan types along with the
corporate sponsor so that under the corporate name UnitedHealthcare, the report had information
on: Optimum Choice, MD IPA, Golden Rule and others. In other states, information would only be
available at the United HealthCare corporate level.
19
Copyright AARP, 2011. All rights reserved.In some cases, sites allowed the user to search for information from a database. In others the
information was in a pdf report format. In only two cases (TX and WI) was there use of a graphic
to convey relative performance:
WI State employee brochure presented information about both complaints and grievances in
a bar graph format.
The Texas Department of Insurance included information in bar graph format and also
included three years of complaint data (See Screenshot # 6).
A few states allowed users to sort complaint performance from high to low—or presented the
information in rank order. In many states, the user could see information from previous years.
Ohio had a two-page brochure about consumer complaints on health insurance that provided some
context for the topic, as well as additional information—including the top 10 reasons for health
insurance complaints in 2008 (See Screenshot # 7).
Medical Loss Ratio Information/ Executive Compensation
Nine of the managed care report cards reviewed included information about medical-loss ratios (the
amount of a premium dollar spent on medical claims vs. administrative costs). This information
was available from state insurance departments in Connecticut, Maine, Maryland, Massachusetts,
Minnesota, Missouri, Oregon and Rhode Island. The Connecticut Business and Industry
Association (a small business exchange in CT) also made the medical loss ratios of its plans
available.
In addition, the NAIC Consumer Information Source (CIS) nationwide database includes the
medical loss ratio as part of its financial information on plans, but as previously noted, the site is not
easy to use.
In most cases, the medical loss ratio is provided in a chart as a percentage number. For example
the medical loss ratios for the plans offered by the Connecticut Business and Industry Association
ranged from 81.2% to 96%.
With reference to executive compensation, Maine provides information on executive salaries,
bonuses, and all other compensation. Certain levels of executive compensation are also available
for health plans in Minnesota through their IRS Form 990 non-profit filings.
Discussion and Recommendations
Information on complaints, grievances, appeals and other issues has traditionally not been well
integrated into existing managed care report cards and this was confirmed by this study. Often this
is because the information has been gathered by the State Department of Insurance, rather than the
State Department of Health or another more health-oriented organization. This information is
important and represents another aspect of performance that should be collected and integrated into
the information that is available to consumers about health plans. Of particular interest to
20
Copyright AARP, 2011. All rights reserved.consumers would be information about what happens ―inside‖ the health plan on the disposition of
such matters as utilization review or grievances. The importance of this information will be
enhanced if there is a robust complaint, grievance and appeal process that is well publicized to
enrollees and their families.
Just as efforts have been made to develop ―scores‖ or composites of performance information in the
HEDIS and CAHPS areas, the ability to roll several measures on grievances and appeals into one
score that is easy for consumers to understand could be investigated. As noted above, the Medicare
Plan Finder includes such an approach as it rolls several sub-scores about complaints and other
findings into an overall score called ―Health Plan Member Complaints and Appeals‖.
As with the other types of quality and patient experience information noted above, making this
information easily understandable ―at-a-glance‖, with the opportunity to dig deeper for those who
are interested is necessary. And again, including users in the design of this type of information will
improve its usefulness and navigability.
RECOMMENDATIONS:
Integrate information about complaints, grievances, utilization review outcomes and appeals
into the performance reports about health plans.
Ensure that plan information in this area can be interpreted ―at-a-glance‖ with the option to
dig deeper to get more information if interested. Include users in the design of the
information and test with multiple audiences before implementation of the design.
D. Other Types of Performance and Cost/Payment Information
There were several other types of information that appeared on a small number, or single, managed
care report card sites, such as information from an employer-oriented survey called eValue8,
information about the costs of hospital, physician and other services provided by the state's health
plans, and a range of other types of information on utilization, broker compensation and other
topics.
The eValue8 Tool
Several reviewed report cards provided information derived from the National Business Coalition
on Health's eValue8 tool. This survey tool is primarily used by employers and business coalitions to
assess health plans by gathering information in such areas as consumer engagement (how
effectively a plan helps members navigate through the health care system, offers choice tools, web-
based visits, e-mail and assesses patient experience via CAHPS etc.), provider measurement (how
plans use clinical information to differentiate among doctors and hospitals etc.), prescription drug
management, prevention and health promotion, chronic disease management and behavioral
health—with a particular focus on depression and substance abuse. While primarily for employer
use, the following report cards present the eValue8 results for consumers:
21
Copyright AARP, 2011. All rights reserved.You can also read