Australia's Future Health Workforce - Dermatology - Department of Health - May 2017 - Australian Government ...
←
→
Page content transcription
If your browser does not render page correctly, please read the page content below
Department of Health

Australia’s Future
Health Workforce –
Dermatology

May 2017
Contents
Executive Summary .......................................................................................................... 5
   Key considerations ................................................................................................................. 5
Key findings ...................................................................................................................... 5
   Supply and demand projections ............................................................................................. 5
   Training program.................................................................................................................... 6
   Capacity and distribution for vocational training ................................................................... 6
      Funding ............................................................................................................................... 6
      Distribution ......................................................................................................................... 6
      Supervisory capacity........................................................................................................... 6
   Current MBS services ............................................................................................................ 7
   Recommendations .................................................................................................................. 7
Overview ........................................................................................................................... 8
   Background ............................................................................................................................ 8
   Determining the Future Capacity for Training Needs ............................................................ 9
Introduction ..................................................................................................................... 10
   Results from the HW 2025 Vol 3 ......................................................................................... 10
Current workforce status ................................................................................................. 11
   Registration, accreditation and specialty fields .................................................................... 11
      Aged and Gender .............................................................................................................. 12
      Growth .............................................................................................................................. 13
   Current specialist clinicians ................................................................................................. 13
      Distribution ....................................................................................................................... 14
      Hours worked ................................................................................................................... 15
   Current trainees .................................................................................................................... 17
      Fellowship program .......................................................................................................... 17
      Trainee data ...................................................................................................................... 18
      Trainee demographics....................................................................................................... 18
   Prevocational intentions ....................................................................................................... 21
   Summary of total workforce by remoteness classification .................................................. 23
General Practitioners providing skin cancer services ..................................................... 23
   Background .......................................................................................................................... 23
   Current MBS services .......................................................................................................... 24
Workforce projections .................................................................................................... 26
   Supply................................................................................................................................... 26
   Demand ................................................................................................................................ 26

                                                                                                                           Page 1 of 51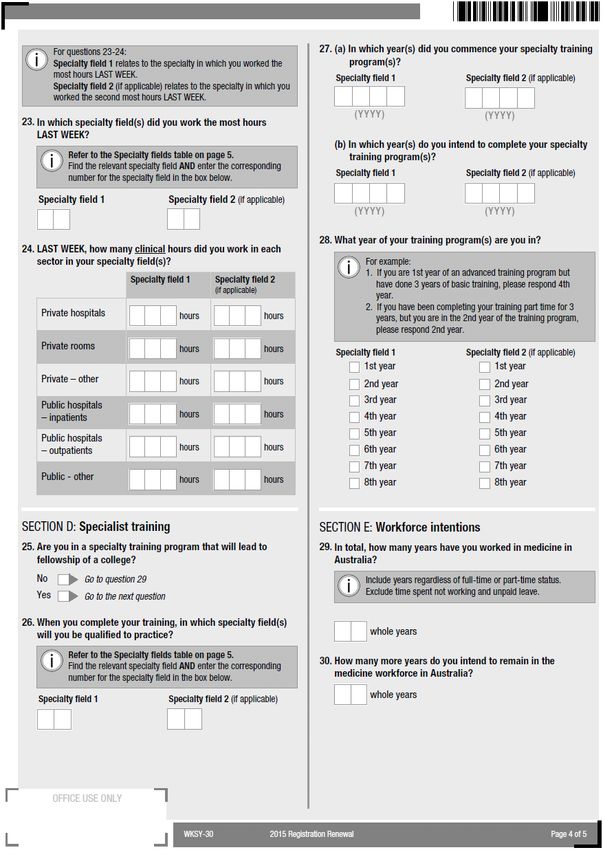
Projection results ............................................................................................................. 26
Sensitivity ............................................................................................................................. 26
Interpretation of results for workforce position ................................................................... 26
Scenarios .............................................................................................................................. 27
Scenario 1: Static FTE intake ........................................................................................... 27
Scenario 2: Balancing the static FTE ............................................................................... 27
Scenario 3: Balancing the static FTE (pro rata deficit) .................................................... 28
Scenario comparison......................................................................................................... 28
Ongoing monitoring ......................................................................................................... 28
Training Analysis Pipeline (TAP) .................................................................................. 29
Results of TAP ..................................................................................................................... 31
Capacity and Distribution for Training ........................................................................... 31
Results of consultation ......................................................................................................... 32
College consultation ......................................................................................................... 32
Appendices ...................................................................................................................... 36
Appendix 1: Summary of modelling inputs ......................................................................... 36
Updating supply and demand ........................................................................................... 36
Descriptive characteristics of the dermatology workforce ............................................... 36
Capacity ............................................................................................................................ 36
Distribution ....................................................................................................................... 37
Modelling inputs ............................................................................................................... 37
Supply assumptions .......................................................................................................... 37
Demand assumptions ........................................................................................................ 38
Appendix 2: Definition of a Specialist (example using anaesthesia) ................................... 39
Appendix 3: Hours worked .................................................................................................. 43
Appendix 4: Trainees and intentions.................................................................................... 44
Appendix 5: Data variables and sources .............................................................................. 46
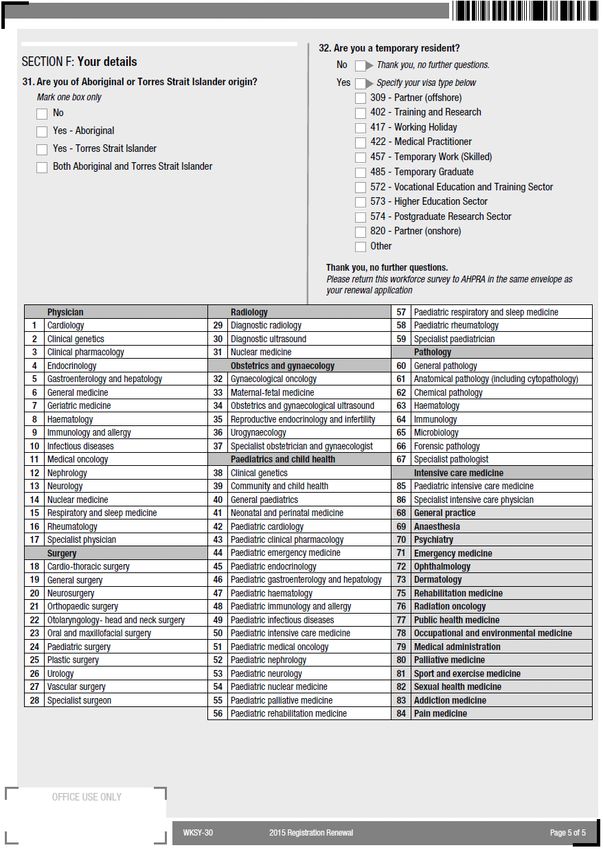
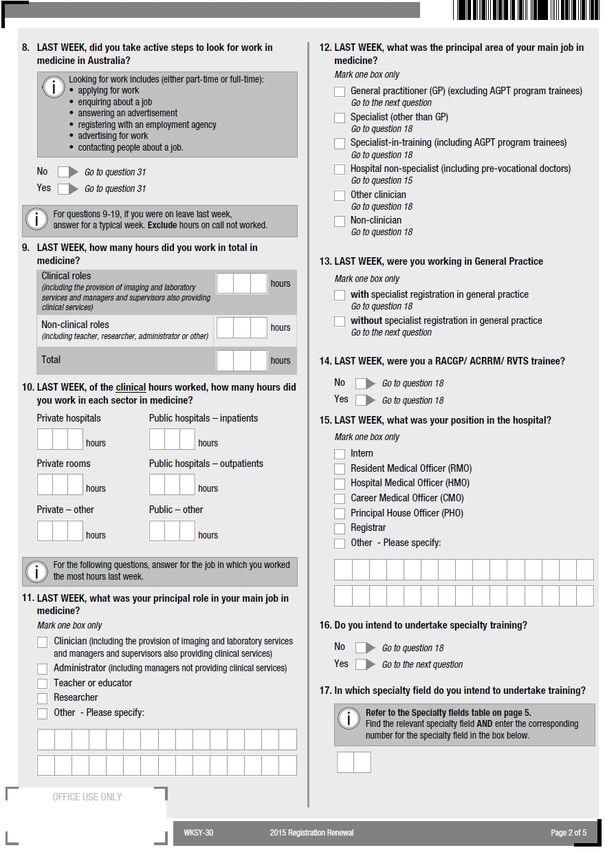
Appendix 6: Medical Practitioners survey 2015 .................................................................. 47
Page 2 of 51
Tables
Table 1: Definitions of the Modified Monash Categories ................................................................................... 15
Table 2: Dermatology specialist clinicians (headcount and sector: proportion of specialist clinical FTE in public
     and private) by state and territory ................................................................................................................ 17
Table 3: Trainees (headcount) by training level, age group, 2015 ........................................................................ 19
Table 4: Trainees (headcount) by age group, gender and training year (current year of training program) ......... 19
Table 5: Trainee FTE (total hours) by training year and sector, 2015 .................................................................. 21
Table 6: Summary of dermatology workforce (Headcount and FTE) by MM ..................................................... 23
Table 7: Summary of Medicare skin cancer services by service group, 2015 ...................................................... 24
Table 8: MBS items billed in 2014 & 2015 by skin cancer clinic GPs ................................................................ 25
Table 9: Headcount GP Skin cancer by state and number of services provided, 2015 ......................................... 25
Table 10: Top 10 MBS items claimed by skin cancer GPs, 2015 ......................................................................... 25
Table 11: Top 10 Procedural skin MBS items claimed by Dermatologists, 2015 ................................................ 25
Table 12: Static FTE intake scenario 1 ................................................................................................................. 27
Table 13: Scenario 2: Balancing the static FTE scenario ..................................................................................... 27
Table 14: Balancing the static FTE (pro rata deficit eight years) scenario 3 ........................................................ 28
Table 15: TAP transition calculation .................................................................................................................... 29
Table 16: Static FTE intake TAP, 2010 – 2030 .................................................................................................... 30

Figures
Figure 1: Dermatology workforce by job role, 2015 ............................................................................................ 11
Figure 2: Comparison of specialist dermatologists that are registered, employed, working in dermatology,
     clinicians (headcount) by age group ............................................................................................................ 12
Figure 3: Gender distribution of dermatology workforce, 2015 .......................................................................... 12
Figure 4: Employed specialist dermatologists by gender, 2011 to 2015 .............................................................. 13
Figure 5: Demographics of the dermatology workforce, 2015 ............................................................................. 13
Figure 6: Dermatology workforce (clinicians) by MM, 2015 .............................................................................. 14
Figure 7: Average hours by total, clinical, specialist clinical and specialist total hours worked, 2015 ................ 15
Figure 8: Average total specialist hours and clinical specialist hours by sex and age group, 2015 ...................... 16
Figure 9: Average total specialist hours by state and territory.............................................................................. 16
Figure 10: Average specialist clinical hours worked by MM ............................................................................... 17
Figure 15: Demographics of dermatology trainees in 2015 .................................................................................. 19
Figure 11: Distribution of dermatology trainees ................................................................................................... 20
Figure 13: Trainees by state and territory and MM, 2015 .................................................................................... 20
Figure 14: Proportion of trainee FTE by geographic distribution (MM) and sector, 2015 ................................... 21
Figure 15: Characteristics of HNS who intend to undertake dermatology training .............................................. 22
Figure 16: HNS who intend to undertake dermatology specialist training by position, 2015 .............................. 22
Figure 17: Proportion of HNS intentions and trainees by geographic distribution, 2015 ..................................... 22
Figure 18: Summary of the projections ................................................................................................................ 28
Figure 19: New Fellows pipeline projections ....................................................................................................... 31
Figure 20: Survey questions relating to Employment Status ................................................................................ 39

                                                                                                                                       Page 3 of 51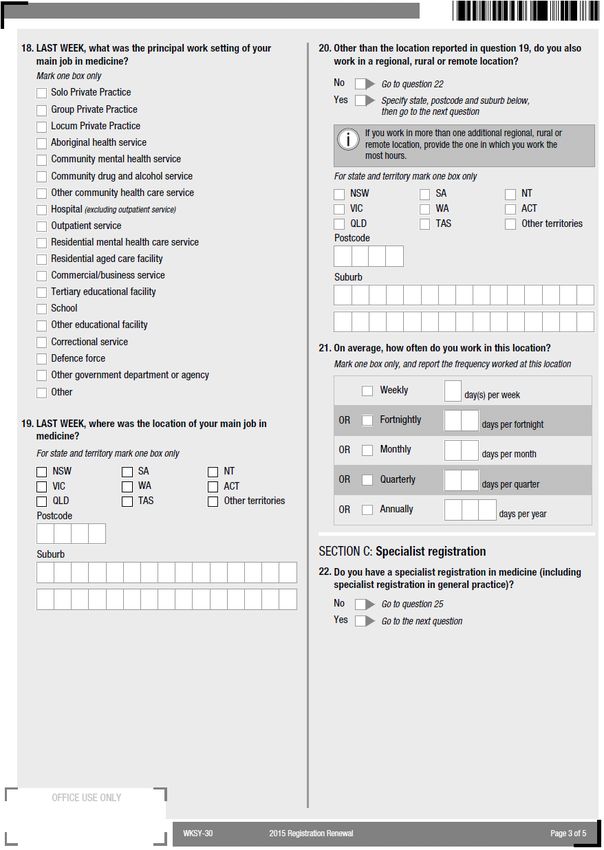
Figure 21: Survey questions relating to Clinician Status ...................................................................................... 40
Figure 22: Survey questions relating to clinical and non-clinical hours ............................................................... 40
Figure 23: Survey questions relating to principal field of main specialties .......................................................... 41
Figure 24: Survey questions relating to training ................................................................................................... 42
Figure 25: Erroneous answer recorded in question 23 .......................................................................................... 42
Figure 26: Hours worked as captured in the workforce survey. ........................................................................... 43
Figure 27: Estimating total specialty hours .......................................................................................................... 44
Figure 28: Total specialty hours used in modelling – example ............................................................................ 44
Figure 29: Survey question related to current specialist training .......................................................................... 45
Figure 30: Survey question relating to current year of training program.............................................................. 45
Figure 31: Survey questions relating to intending to train .................................................................................... 45

                                                                                                                                    Page 4 of 51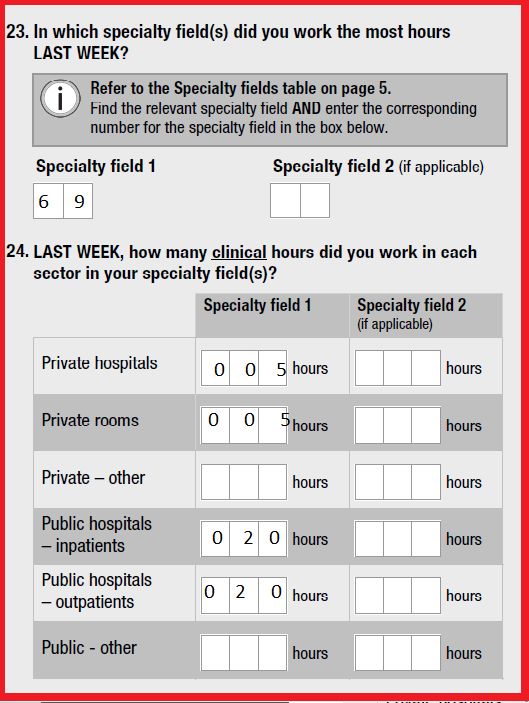
Executive Summary
The Australia’s Future Health Workforce – Doctors (AFHW - Doctors) report published in
December 2014 indicated that Australia’s health workforce is under pressure and must
undergo significant transformation to meet future demands for healthcare.
Despite the projected overall position of oversupply, imbalances within the medical specialty
workforces currently exist and are projected to continue.
The development of the AFHW – Doctors report was guided by the expert input of the
National Medical Training Advisory Network (NMTAN) that has representation from all the
key stakeholder groups in medical education, training and employment.
The report makes recommendations for future work including:
- updates to the workforce modelling results to determine requirements for future
    adjustments every two years; and
- prioritisation of future policy work to gain a better understanding of the prevocational
    years and overall capacity for and distribution of vocational medical training.
The NMTAN currently has two subcommittees that explore different aspects of medical
training to inform workforce planning:
- employment patterns and intentions of prevocational doctors and development of fact
    sheets on supply and demand in each of the medical specialties; and
- the capacity for and distribution of medical training, including the geographic distribution
    of medical training and community needs.
The dermatology report is part of the first segment of analysis under the capacity and
distribution work. This report involves updating the supply and demand projections
previously completed by the former Health Workforce Australia (HWA) and published in
Health Workforce 2025 - Medical Specialists Volume 3 (HW 2025 Vol 3).
Key considerations
It is important to note the following regarding demand and supply modelling for all
specialties:
-   Supply only includes the hours worked by specialist clinicians in the specific speciality
    being modelled.
     o For dermatology this means only the hours worked by dermatology specialists in
         dermatology contribute toward the supply Full Time Equivalent (FTE). In particular
         there are 40 dermatology specialists who work in dermatology AND another
         speciality: 81 percent of their FTE was spent working in dermatology while 19
         percent of their FTE was spent working in their other specialty. Only the hours
         worked in dermatology contribute toward the supply FTE for dermatology.
-   The projections depend on a number of key assumptions which underpin each scenario.
Key findings
Supply and demand projections
The results of the projections reveal a substantial undersupply of dermatology specialists
throughout the entire projection period. Assuming a static intake, the projected workforce
deficit accumulates to 90 FTE dermatologists by 2030 and is 60 FTE by 2025. The deficit is
more extensive than the results of the comparison scenario in HW 2025 which projected the
workforce would be in undersupply of 31 dermatology specialists by 2025.

                                                                                 Page 5 of 51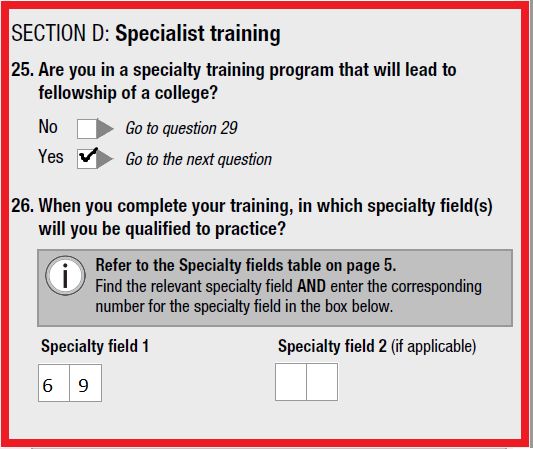
The predicted undersupply could be addressed by facilitating specialist dermatologists to
manage complex, rare or severe skin conditions, and support specialist nurses and general
practitioners to manage patients with common or more straightforward conditions.
Training program
The training program intake would need to increase by 5.2 FTE annually from 2018 to 2025
in order to balance the deficit that has been accumulated over the 15 year projection period
(2016-2030) pro-rated to the nine years (2022-2030) in which change is achievable.
To accommodate this increased intake, an evaluation of the current training program will be
required and novel models for funding and delivery of training may need to be explored for
feasibility and sustainability.
Reassessment of approaches to IMG comparability and post-training candidate outcomes may
positively impact availability of training posts and transition rates throughout the program.
Capacity and distribution for vocational training
Key considerations for program expansion include:
Funding
Securing long-term Federal or jurisdictional funding for new posts is fundamental to program
expansion.
Distribution
Currently, the majority of training occurs in public hospitals. In this setting, the presence of
many patients with ongoing chronic disease of considerable complexity create opportunities
for learning that are less available in the private sector, where activity is rewarded. As a
result, sizable hospitals remain central to dermatology training. However new training models
whereby an increased proportion of training can occur within the larger private practices and
in regional/rural areas have the potential to open up new posts. Maintaining a high quality and
clinically diverse program with exposure to general dermatology and its sub-specialties is
essential. This could be achieved by greater use of telehealth and store/forward tele-
dermatology services during training.
Supervisory capacity
The current supervisory capacity is a potential limitation on the rapid expansion of the
training program, due to the number of consultants required to ensure delivery of the full
training curriculum, the impact of retirement rates and the limited capacity in regional areas.
There is potential to expand training capacity into several larger metropolitan hospitals or
smaller regional hospitals where there are currently no dermatology departments. This will
require jurisdictional support for Registrar funding and in the appointment of fractional
consultants and ongoing liaison with local health services. Establishing dermatology
departments which work in an integrated manner with other medical sub specialties
(oncology, rheumatology, immunology, infectious diseases, gynaecology, paediatric) in a
multidisciplinary setting will encourage consultants to undertake managerial or supervisory
roles within the public system. Supervisory capacity could be increased by urban specialists
using ICT to support and oversee senior registrars in rural or regional areas, thus injecting
academic expertise into areas of need.

                                                                                   Page 6 of 51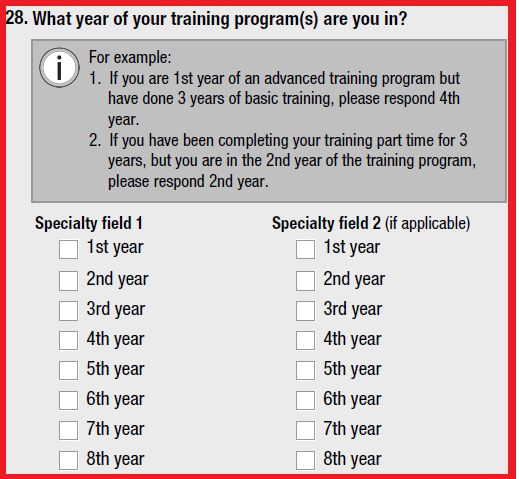
Current MBS services
Given that two in three Australians will develop skin cancer, GPs have to play an important
role in the first line of care for skin cancer surveillance and management1. Analysis of 2015
Medicare Benefits Schedule (MBS) data shows that a subset of General Practitioners (GPs),
particularly in QLD and NSW, are providing a high level of skin cancer services. Billing of
dermatology MBS items by this subset of GPs exceeds that of the entire dermatology
workforce.
These results suggest the emergence of a sub-specialisation in general practice. Skin cancer
surveillance is an expected skill for both GP professional colleges. Increasing numbers of
GPs undertake further training in skin cancer but there is no agreed standard or training that is
accredited by the Australian Medical Council (AMC).
There is some evidence that there are cost inefficiencies from over-servicing. The
Department, NMTAN, ACRRM, RACGP and ACD develop a joint strategy to address to
ensure optimal use of in MBS skin cancer items utilisation by skin cancer GPs.
Ongoing analysis of patient outcomes and health system cost implications is required to
inform further action.
Recommendations
-     The supply and demand projection be closely monitored by NMTAN and the Australian
      Government Department of Health (the Department), with updates every two years.
-     The ACD put forward the following recommendations for consideration by the NMTAN
      and the Department.
NMTAN:
-     to facilitate dialogue between ACD and jurisdictional health departments; notably
      WA, Qld and NSW. The College seeks funding for new training positions in regional
      hubs identified as appropriate training locations, offering supervisory capacity potentially
      supplemented with remote supervision. Jurisdictional support is urgently required to
      expand public hospital services, incorporating both qualified dermatologists and trainees,
      into new teaching hospital units in outer metropolitan and regional/rural areas where there
      are associated medical school clinical teaching units. In addition, expansion of
      prevocational generalist training opportunities for junior medical officers with an interest
      in undertaking dermatology specialist training is recommended, to ensure growth in
      generalist skills.
The Department, NMTAN and ACD:

-     to develop a joint strategy to address inefficiencies in MBS skin cancer item
      utilisation by skin cancer GPs. Improving diagnostic and treatment capabilities will help
      to reduce system wastage. The College is best placed to set the clinical and ethical
      standards in GP training and upskilling in skin cancer management and is prepared to take
      on this role with Department, NMTAN, ACRRM, RACGP to explore implementation
      strategies with relevant stakeholders and facilitated by NMTAN, including offering
      certification as the national education provider and offering continuing professional
      development potentially managed via a joint council with relevant medical colleges.

1
    House of Representatives Standing Committee on Health. Skin Cancer in Australia: Our National Cancer. Canberra 2015.

                                                                                                         Page 7 of 51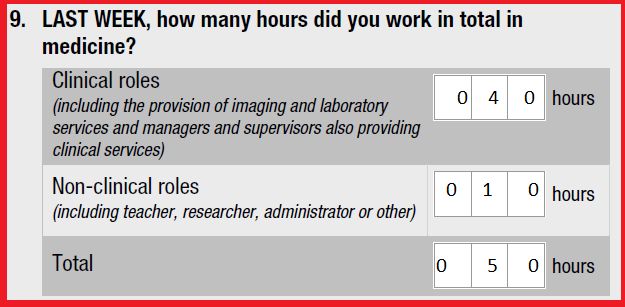
Overview
The Australia’s Future Health Workforce – Doctors (AFHW – Doctors) report published in
December 2014 indicated that Australia’s health workforce is under pressure and must
undergo significant transformation to meet future demands for healthcare.
Despite the projected overall position of oversupply, imbalances within the medical specialty
workforces currently exist and are projected to continue.
The medical workforce is a national resource; a resource that is valuable to the community
both in terms of the cost of training, which is substantially borne by the taxpayer, and in terms
of the benefit derived by the community from a well-trained health workforce.
In the past, uncoordinated decision making in the absence of an active workforce planning
mechanism has seen a “boom and bust” cycle in medical training and resulting doctor
numbers. This has been a cost to the community.
The AFHW - Doctors report shows there are three key factors that underpin the importance of
national workforce planning for doctors. First, there is an immediate need to deal with the
significant increase in domestic medical students that has occurred over the last ten years.
This presents an opportunity to influence further training for medical students, to encourage
doctors to move into the locations and specialties that will be needed in the future.
Second, due to the age demographic of the medical workforce, a number of doctors will retire
from 2025. The length of time it takes to train a doctor means that short term changes in
training levels are not an effective response to short term imbalances between supply and
demand. This re-enforces the need to plan over a medium term time horizon and to minimise
short term movements in medical intakes, which could be better dealt with using temporary
migration.
Third, the report states there is a lack of coordination across the medical training pipeline.
Between governments, universities, medical colleges and the various employers of doctors,
there are hundreds of individuals making decisions on how many doctors and what type of
doctors are trained in Australia. Ensuring these individual decisions are aligned to what
Australia needs from doctors in the future is essential.
The development of the AFHW – Doctors report was guided by the expert input of the
National Medical Training Advisory Network (NMTAN) that has representation from all the
key stakeholder groups in medical education, training and employment.
The report makes recommendations for future work including:
-   updates to the workforce modelling results to determine requirements for future
    adjustments every two years; and
-   prioritisation of future policy work to gain a better understanding of the prevocational
    years and overall capacity for and distribution of vocational medical training.
Background
The establishment of the NMTAN was approved on 10 August 2012 by the then Standing
Council on Health (SCOH) as a mechanism to enable a nationally coordinated medical
training system in Australia. The NMTAN was established under the auspices of the former
Health Workforce Australia (HWA) and held its first meeting in February 2014. Since August
2014, support to the NMTAN has been provided by the Australian Government Department
of Health (the Department).
The NMTAN provides guidance in the development of a series of medical training reports to
inform government, health and education sectors. In addition, the NMTAN provides policy
advice about the planning and coordination of medical training in Australia, in collaboration
with other networks involved in the medical training space.

                                                                                    Page 8 of 51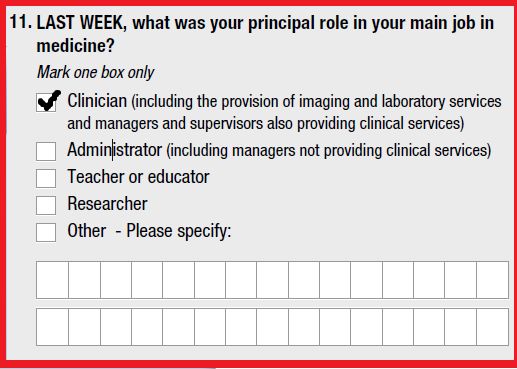
The NMTAN currently has subcommittees that explore different aspects of medical training
to inform future workforce planning: In addition to the policy-focussed subcommittees, a data
subcommittee – is responsible to support the production of an annual report of medical
education and training, including undergraduate, postgraduate and vocational training
projects. The functions of this subcommittee were transferred from the Medical Training
Review Panel to the NMTAN in 2015.
This dermatology report is part of the first segment of analysis under the capacity and
distribution subcommittee work. It involves updating the supply and demand projections
previously completed by the former HWA and published in HW 2025 – Medical Specialists
Volume 3 (HW 2025 Vol 3).
This work has been guided by the input of the NMTAN and has been completed in two
stages:
-   Stage 1: review and analysis of supply and demand through the modelling of the
    dermatology workforce with projections to 2030 and analysis of current training capacity
    and identification of pipeline issues. This resulted in the development of an interim report
    for targeted consultation with NMTAN and relevant stakeholders/experts.
-   Stage 2: consolidation of the feedback on the interim report to identify issues to develop
    training target ranges and policy recommendations for dermatology.
Determining the Future Capacity for Training Needs
Australia’s medical training system is delivered through a complex interconnection of
funding and organisation channels that span Commonwealth and state and territory
governments, as well as private and non-government agencies. The cross-sectional nature of
delivering and funding medical training in Australia makes workforce planning difficult for
any particular agency or sector to deliver in isolation. There is also a risk there will be an
ongoing mismatch between the medical workforce that is trained and that is required to
deliver necessary services.
The pathway to independent practice as a vocationally recognised specialist is long and there
are multiple layers of investment in the training from university entrance to the completion of
specialist vocational training. At the same time, there are numerous players involved in the
training pathway, from universities to public and private hospitals and private medical
practices.
The recent growth in the medical workforce is important in the calculated supply and demand
for health services over the time period covered by the workforce modelling.
This increase in the number of medical students and graduates demonstrates a large increase
in the inflows into the medical workforce over a short space of time. This has implications for
clinical training capacity, initially at the university level but extending into the prevocational
and vocational training years. This pressure has already been seen in the availability of intern
training places, which to date has largely kept pace with the increasing number of graduates.
This pressure is now beginning to move into the next stages of the training pipeline. There
has been an increase of over 30 percent in vocational training positions with 15,478 in 2011
moving to 20,069 by 2015 with unclear links to future workforce requirements. Previous
workforce modelling demonstrates an emerging mismatch between the number of trainees
seeking a vocational training place and the availability of places based on community need.
This mismatch emerges from around 2017 in the most recent modelling presented in the
AFHW – Doctors report and extends to approximately 1,000 places by 2030.

                                                                                    Page 9 of 51
Introduction
A dermatologist is a qualified medical specialist who has obtained postgraduate qualifications
specialising in the diagnosis, treatment and prevention of skin diseases and cancers.
Dermatologists look after patients of all ages, from babies and children to adolescents and
adults. Australian dermatologists spend a lot of time treating diseases caused by sun exposure
including sunspots and skin cancers, and need advanced skills in melanoma diagnosis and
treatment. Dermatologist also diagnose, treat and manage other skin conditions including
acne, psoriasis, atopic eczema, skin infections as well as conditions affecting hair, nails and
the mucosa surfaces.
Dermatologists use a wide variety of treatments (such as creams, liquid nitrogen, oral
medication and ultraviolet therapy) and specific treatment for skin cancers. Dermatologists
also deliver cosmetic services (e.g. laser therapy, muscle relaxants, fillers).
Results from the HW 2025 Vol 3
Dermatology was selected as a medical specialty to be considered in the first segment of
analysis by the NMTAN largely due to concerns identified in HW 2025 Volume 3. The
dermatology chapter indicated that the workforce was perceived to have some difficulty in
filling positions, either through maldistribution or insufficient workforce. The comparison
scenario projected the workforce would be in undersupply by 31 specialist dermatologists by
2025. The scenario results generated minimal net change in the workforce over the projection.
While the replacement rate was rated at the lowest level, consultation highlighted limitations
on future training capacity which may potentially affect this assessment.
In the HW 2025 Volume 3 report, stakeholder views agreed that:
- The shift that has occurred to private practice (led by some states) has resulted in a
predominately private sector led service. This has caused some issues as there are long
waiting times to see a dermatologist.
- The increasing sub-specialisation within dermatology was also highlighted as an issue. An
example was cited where a patient referred to a dermatologist was not seen, as the practice
only saw people with skin cancers.
The ACD had provided a range of considerations that may impact supply or demand:
- A likely increase in the number of females in the dermatology workforce and the
consequent impact on average hours worked.
- A trend for increasing sub-specialisation within dermatology.
- Reduced numbers of public hospital outpatient clinics in dermatology, leading to a shift
from public to private practice.
- Training capacity limitations, with a reliance on limited sectors for training places, and
infrastructure limitations in a predominantly private practice environment. It was noted
that training capacity has increased as a result of the Commonwealth funded specialist
training program, which now accounts for 20 percent of training places.
- While there is geographic maldistribution of the dermatology workforce, a number of
mechanisms exist to improve this, including:
o college selection processes, with rural origin registrars;
o regional training; and
o service delivery models, such as the Rural Health Outreach Fund, telehealth and
store/forward tele-dermatology such as TeleDerm
A summary of the approved modelling inputs can be found in Appendix 1.
Page 10 of 51Current workforce status
Registration, accreditation and specialty fields
The Medical Board publishes quarterly statistics on Medical Practitioner Registrant Data2. In
the September 2015 edition there were 513 registrants with a specialty of dermatology.
According to the National Health Workforce Data Set (NHWDS), in 2015 there were 508
accredited dermatology specialists with current medical registration in Australia; 5 fewer than
reported in the Medical Board data. This is because the NHWDS is a snapshot at a point in
time (as at the date of data extraction) and the figures only include medical practitioners with
current registration. The Medical Board/AHPRA statistics report an annual figure and include
medical practitioners who held a registration at some point in the year but may not have a
current registration.
In the NHWDS there were three dermatology specialists who did not renew their medical
registration in 2015; resulting in a difference of one between the NHWDS and the Medical
Board statistics.
As can be seen in Figure 1, of the 508 accredited dermatology specialists with current
medical registration, 473 (93 percent) were employed in the medical workforce. While the
majority (471) worked in dermatology, two did not work in dermatology. Those who did
work in dermatology were mostly clinicians (98 percent) with the remainder working as
administrators, teachers/educators and researchers.
Nine percent (40) of dermatology specialist clinicians also worked in a specialty other than
dermatology. The most common second specialties were: physician (17), general practice
(10) and anatomical pathology (5).
Figure 1: Dermatology workforce by job role, 2015
512
Total
3 508
Not Registered Registered
473
Employed
471
Employed in
Dermatology
463 3 2 2 1
Clinicians Administration Teacher/Educator Researcher Other
Source: NHWDS, Medical Practitioner 2015
2
http://www.medicalboard.gov.au/News/Statistics.aspx
Page 11 of 51Aged and Gender
The age distribution of specialist dermatologists in Australia (Figure 2) show the majority are
in the 35-64 year age groups for registered, employed, clinicians and those working in
dermatology. There are fewer dermatologists between 25-34 years, as at this age most have
yet to complete training (see Table 3: 75 percent of trainees are aged 25-34 years). The
proportion of the registered, employed, clinicians and those working in dermatology were
similar within each of these age groups. The largest age group for specialist dermatologists is
40-49 years with the numbers in the workforce reducing significantly beyond 64 years of age.
Due to the nature of the specialty, some dermatologists choose to practice well beyond
retirement age with focus on general dermatology or lower risk cases, thus making a
continued contribution to the specialist workforce.
Figure 2: Comparison of specialist dermatologists that are registered, employed, working in
dermatology, clinicians (headcount) by age group
90
Registered
80
Employed
70 Working in dermatology
60 Clincian
50
40
30
20
10
0
25-29 30-34 35-39 40-44 45-49 50-54 55-59 60-64 65-69 70-74 75-79 80-84 85-89 90-94
Source: NHWDS, Medical Practitioner 2015
The gender distribution of the dermatology workforce (Figure 3) shows that approximately 57
percent are male across all groups: registered, employed, clinicians and those working in the
field.
Figure 3: Gender distribution of dermatology workforce, 2015
500
400
300 Female
Male
200
100
0
Registered Employed Working in dermatology Clincian
Source: NHWDS, Medical Practitioner 2015
Page 12 of 51Growth
Figure 4 shows that the number of employed specialist dermatologists has grown over the
four year period from 2011 to 2015 (average annual growth of 4.3 percent), with female
specialist dermatologists experiencing the largest growth during this period at an average
annual rate of 6 percent, while males have only increased by 3 percent (average annual
growth). The proportion of females has increased from 40 percent in 2011 to 43 percent in
2015.
Figure 4: Employed specialist dermatologists by gender, 2011 to 2015
500
450
Total
400
350
Male
300
250
200 Female
150
100
50
0
2011 2012 2013 2014 2015
Sources: NHWDS: medical practitioners 2011 to 2015
Current specialist clinicians
According to the 2015 NHWDS, there were 463 specialist dermatologists who indicated they
were employed and working as clinicians (dermatology workforce) with the following
characteristics:
Figure 5: Demographics of the dermatology workforce, 2015
• 51 years • 43% • 38.6 hours
• females 33.3 hours
female
Average Average
Gender
age hours
•63% in NSW and
• 36% VIC
• 7% in public
• 38.2 hours •92% in MM1
55 years
Location Sector
and over
Source: NHWDS, Medical Practitioner 2015
Page 13 of 51Distribution
Figure 6 illustrates the Modified Monash (MM) Model and density of the dermatology
workforce within these areas. The MM is a new classification system that better categorises
metropolitan, regional, rural and remote areas according to both geographical remoteness and
town size.
The system was developed to recognise the challenges in attracting health professionals to
more remote and smaller communities. MM1 indicates major cities and progresses to MM7,
which indicates very remote Australia;
Figure 6: Dermatology workforce (clinicians) by MM, 2015
! Dermatology (Other) - Specialist clinicians (NHWDS 2015) Brisbane
Modified Monash Model
1 (2.5 per 100,000) !
2 (0.7 per 100,000)
! !!! ! !
3 (1.3 per 100,000) !!!!!! !!! !
!
4 (0 per 100,000) !
5 (0 per 100,000)
6 (0 per 100,000) !!
!
7 (0 per 100,000) Sydney
! ! !
!!
!! ! !
! ! !!! !!! ! !
! ! ! !!!! ! !
! !! ! !!!!
! ! ! ! ! ! !!
!! !
! ! !
!
!! Melbourne
!!!
! !!!! !
!!
!! ! !!!!! !!!!!!
! !! ! !!
! ! ! !!!!!!!!!! !!!!!! !
!!! ! !
!
!
!!! ! !! !
! !
! ! !!!
!!!!!!!!!!!!!
! ! ! !!
!!!!! ! !
!
Perth
!
! !!!!!!!!!!!!
! !!! !! !
!
!!
!! !!! !
! !!
! !
! !
!
Source: NHWDS, Medical Practitioner 2015
The old classification system was based on the Australian Standard Geographical
Classification – Remoteness Area (ASGC-RA) system. The Australian Bureau of Statistics
(ABS) has now replaced to ASGC with the Australian Statistical Geography Standard
(ASGS). The ASGS uses the latest residential population data to determine the five base
categories. The MM will overlay the ASGS for the purposes of administering some health
workforce programs.
Page 14 of 51Table 1 defines each of these MM categories. As can be seen in the map, the dermatology
workforce is located throughout Australia, but almost exclusively concentrated in
Metropolitan areas (92 percent in MM1).
Table 1: Definitions of the Modified Monash Categories
MM Definition
Category
1 All areas categorised ASGS-RA1.
2 Areas categorised ASGS-RA 2 and ASGS-RA 3 that are in, or within 20km road distance, of a
town with population >50,000.
3 Areas categorised ASGS-RA 2 and ASGS-RA 3 that are not in MM 2 and are in, or within 15km
road distance, of a town with population between 15,000 and 50,000.
4 Areas categorised ASGS-RA 2 and ASGS-RA 3 that are not in MM 2 or MM 3, and are in, or
within 10km road distance, of a town with population between 5,000 and 15,000.
5 All other areas in ASGS-RA 2 and 3.
6 All areas categorised ASGS-RA 4 that are not on a populated island that is separated from the
mainland in the ABS geography and is more than 5km offshore.
7 All other areas – that being ASGS-RA 5 and areas on a populated island that is separated from
the mainland in the ABS geography and is more than 5km offshore.
Source: www.doctorconnect.gov.au
Hours worked
The Medical Practitioner workforce survey (Appendix 6) captures the hours worked at three
levels, namely; total hours (A), clinical hours (B) and specialist hours (C and D). The detailed
analysis of how the hours worked are determined is outlined in Appendix 3.
Figure 7 below shows the difference between the hours worked by the dermatology
workforce, by gender. There is a clear difference between males and females; with females
working fewer hours on average. As expected, for both males and females, the total hours are
greater than the clinical hours and these are again greater than the specialist clinical hours.
The difference between the total specialist (D) and specialist clinical (C) hours indicates the
clinical support component (non-clinical hours) for the dermatology workforce (D). On
average 5.2 hours for males and 3.6 hours per week for females is spent performing clinical
support in dermatology.
Figure 7: Average hours by total, clinical, specialist clinical and specialist total hours worked,
2015
43.9
(A) Total Hours
34.2
38.5
(B) Clinical hours
30.4
Male
37.4 Female
(C) Specialist clinical hours
29.7
42.6
(D) Total specialist hours
33.3
0 5 10 15 20 25 30 35 40 45 50
Source: NHWDS, Medical Practitioner 2015
Figure 8 below shows the difference between the total specialist hours (D) and clinical
specialist hours (C) by gender and age group. The largest gap can be seen between total
Page 15 of 51specialist hours and clinical specialist hours in the 50-54 year age group for males and 60-64
year age group for females.
Figure 8: Average total specialist hours and clinical specialist hours by sex and age group, 2015
50
45
40
Average weekly hours
35
30
25
Full time
20
Male - Total specailist hours
15 Male - Specialist clincial hours
10 Female - Total specialist hours
5 Female - Specialist clinical hours
0
25-29 30-34 35-39 40-44 45-49 50-54 55-59 60-64 65-69 70-74 75-79 80-84 85-89
Source: NHWDS, Medical Practitioner 2015
The average total specialist hours worked by states and territories is shown below (Figure 9).
Specialist dermatologists in TAS, NT, and ACT tend to work more than the national average
(38.6 hours), while those in SA and VIC tend to work less than the national average.
Figure 9: Average total specialist hours by state and territory
50 National Average
48
46
44
42
40 49.3
38
43.9
36
39.7 40.2
34 39.0 38.2
37.4 36.6
32
30
NSW VIC QLD SA WA TAS NT ACT
Source: NHWDS, Medical Practitioner 2015
Figure 10 shows there large variations in the total specialist hours worked by the very few
specialist dermatologists outside MM1; ranging from 45.4 hours per week in MM3 to 32
hours per week in MM5.
Page 16 of 51Figure 10: Average specialist clinical hours worked by MM
50 National Average
45
40
35
30
44.2 45.4
25 38.0
20 32.0
15
10
MMM1 MMM2 MMM3 MMM5
Source: NHWDS, Medical Practitioner 2015
Table 2 indicates specialist dermatologists’ clinical workload between sectors and states and
territories. The data shows nationwide the majority of specialist dermatologists FTE occurs in
the private sector (93 percent) with seven percent in the public sector.
The ACT had the highest proportion of clinical FTE in the private sector (96 percent) while
Vic had the lowest (89 percent). The majority of specialist dermatologists are located in the
highly populated states of NSW, VIC and QLD and proportionally less in lower populous
states and territories such as NT, ACT and TAS.
Table 2: Dermatology specialist clinicians (headcount and sector: proportion of specialist
clinical FTE in public and private) by state and territory
Headcount Specialist clinical FTE
% Public % Private
NSW 169 5.2 95.2
VIC 122 11.1 89.3
QLD 79 4.5 95.8
SA 39 9.2 91.1
WA 41 7.3 93.0
TAS 6 6.6 93.4
NT 1 7.0 95.1
ACT 6 4.7 96.1
Total 463 7.1 93.3
Source: NHWDS, Medical Practitioner 2015
Current trainees
Fellowship program
Traditionally, dermatology was seen as a branch of general medicine and dermatological
training had been undertaken mainly through the Royal Australasian College of Physicians
(RACP). The ACD was established in 1966 as the medical college responsible for the training
and professional development of medical practitioners in the speciality of dermatology. The
ACD is governed by a Board of Directors who are elected, appointed and co-opted by the
ACD membership.
To be eligible to enter the ACD Training program registered medical practitioners must have
completed 24 months in prevocational training (PGY1 and PGY2 years) and have resident
status in Australia. Training Positions are available in NSW, VIC, QLD, SA and WA. There
are a limited number of training positions each year and selection is competitive.
Page 17 of 51ACD training comprises 4 years (46 weeks per annum excluding leave provisions):
- Year 1: Complete the 1st year workshop, Clinical Sciences Online Competency Modules
Attain a pass in the Pharmacology Examination, Summative-In-Training-Assessments
(SITAs) and clinical training in an accredited training position
- Year 2: Summative-In-Training-Assessments (SITAs); and clinical training in an
accredited training position.
- Year 3: Complete the 3rd year workshop, Summative-In-Training-Assessments (SITAs),
clinical training in an accredited training position and research requirements.
- Year 4: Summative-In-Training-Assessments (SITAs); clinical training in an accredited
training position, five prescribed modules TAE40110 Certificate IV Training &
Assessment, Written Fellowship Examinations, Histopathology/Dermoscopy Fellowship
Viva, and Clinical fellowship Examination
- Year 5 +: Those who do not successfully complete the examinations continue as Post
training candidates.
IMGs specifically must complete their required training time as per their assessment of
Overseas Trained Specialist Report in an accredited training position, with the following
training/upskilling requirements to be fulfilled:
- 24 months requires completion of 104 weeks of training (including leave provision)
- 12 months requires completion of 52 weeks of training (including leave provision)
- 6 months requires 26 weeks continuous training time (including leave provision) and
completion of all contractual obligations with their employer. They may be required to
complete additional mentoring time as decided by the IMG Assessment Committee.
Trainee data
The NHWDS data is used herein to describe trainees (those that have identified as specialist-
in-training (SIT) (Appendix 4)). For the purposes of modelling, the Department has used a
combination of data from the ACD and the NHWDS: Medical Practitioner 2015 survey,
noting that there are variances between these data sources. This is largely due to the self-
reported nature of the medical workforce survey data.
In comparison to the ACD data, the 2015 medical workforce survey data reported 14 fewer
(14 percent) dermatology trainees. There are a number of reasons for this, including that not
every practitioner fills out the survey, they are not indicating that they are undertaking
dermatology training, and each data set has a different collection time point/ cut-off, which
will affect the number of trainees counted in a given year.
The number of trainees by training level is also collected through the Medical Training
Review Panel (MTRP) data collection each year from medical colleges and reported on in the
MTRP Report. There are differences in the numbers in this report and the MTRP as the latter
captures the number of trainees as at 30 June each year.
Trainee demographics
The following tables make comparisons with the data supplied from ACD and that from the
NHWDS. Data supplied by ACD provides the total number of trainees by training level by
state and territory for 2015. Table 3 includes all domestic trainees; in 2015 there were a total
of 101 trainees.
Page 18 of 51Table 3: Trainees (headcount) by training level, age group, 2015
Age YR1-YR2 YR3-YR4/PTC Total
25-29 18 4 22
30-34 24 30 54
35-39 7 9 16
40-44 0 2 2
45-49 0 5 5
50+ 0 2 2
Total 49 52 101
Source: ACD, 2015
In comparison,
Table 4 details the trainees by age group, gender and self-reported training year according to
the NHWDS. The main trend that can be seen is that trainees are predominantly in the 25-39
age groups (92 percent of total), and that there are more female trainees (66 percent of total).
Table 4: Trainees (headcount) by age group, gender and training year (current year of training
program)
Age 1st 2nd 3rd 4th 5th 6th 7th 8th Unknown Total
Male
25-29 2 3 0 1 0 0 0 0 0 6
30-34 1 1 3 7 0 0 0 0 0 12
35-39 2 1 1 3 1 0 0 0 0 8
40-44 0 0 1 0 0 0 0 0 0 1
45-49 0 0 0 0 0 1 0 1 0 2
50+ 0 0 0 0 1 0 0 0 0 1
Total 5 5 5 11 2 1 0 1 0 30
Female
25-29 6 5 3 2 0 0 0 0 0 16
30-34 7 6 7 8 0 0 0 0 1 29
35-39 1 3 1 1 0 1 0 0 0 7
40-44 1 0 1 0 0 0 0 0 0 2
45-49 0 0 0 0 0 0 0 1 0 1
50+ 1 0 0 1 0 0 0 0 0 2
Total 16 14 12 12 0 1 0 1 1 57
Grand 21 19 17 23 2 2 0 2 1 87
Total
Unknown/not stated are included in these totals.
Source: NHWDS, Medical Practitioner 2015
According to the 2015 NHWDS for medical practitioners, there were 87 dermatology trainees
in Australia, with the following characteristics:
Figure 11: Demographics of dermatology trainees in 2015
•79% in NSW,
• 75% • 66% VIC and QLD • 70% in
female •95% in MM1 public
25-34
Gender Location Sector
years
Source:
NHWDS, Medical Practitioner 2015
Page 19 of 51The following map (Figure 12) gives a visual representation of the geographical location of
dermatology trainees at a particular point in time during 2015.
Figure 12: Distribution of dermatology trainees
! Dermatology (Other) - Trainees (NHWDS 2015)
Brisbane
Modified Monash Model
1
2
! !!
3 !!
4 !
5
6
7 Sydney
! !
!! ! !
! !! !
!
Melbourne
!! !
!
!!!! !
!
!
!! !
! !
! !!!!!
!
! Perth
!
!!!!!!
! !
!
Source: NHWDS, Medical Practitioners 2015
Figure 13 outlines the distribution of trainees and shows that almost all trainees (95 percent)
are located in major cities (MM1). Only two trainees were in MM2 and MM3.
Figure 13: Trainees by state and territory and MM, 2015
ACT MMM
1
NT MMM
2
TAS MMM
3
WA
SA
QLD
VIC
NSW
0 5 10 15 20 25 30
Source: NHWDS, Medical Practitioner 2015
Table 5 details the trainees (FTE) by location, current year of training and sector. Nationwide
the public sector is still dominant with 70 percent of training occurring there.
Page 20 of 51Table 5: Trainee FTE (total hours) by training year and sector, 2015
State Sector 1st 2nd 3rd 4th 5th 6th 7th 8th * Total
NSW Public 4.4 3.1 3.5 4.4 0.0 0.0 0.0 0.0 1.1 16.5
Private 1.0 0.0 0.0 0.0 1.1 2.4 0.0 1.0 0.0 5.5
Both 4.5 2.7 0.0 0.0 0.0 0.0 0.0 0.0 0.0 7.2
VIC Public 1.0 5.8 9.9 5.6 0.0 0.0 0.0 0.0 0.0 22.2
Private 0.0 0.0 1.4 0.0 0.0 0.0 0.0 0.0 0.0 1.4
Both 2.4 1.7 0.5 0.0 0.0 0.0 0.0 0.0 0.0 4.6
QLD Public 1.0 1.1 5.1 4.8 0.0 0.0 0.0 0.0 0.0 12.1
Private 3.9 1.0 0.0 0.4 0.0 0.0 0.0 0.0 0.0 5.3
Both 0.0 1.1 0.0 0.0 1.1 0.0 0.0 0.8 0.0 2.9
SA Public 0.0 3.6 0.0 7.5 0.0 0.0 0.0 0.0 0.0 11.1
WA Public 3.5 0.0 1.1 2.9 0.0 0.0 0.0 0.0 0.0 7.5
Private 1.0 0.0 0.0 0.0 0.0 0.0 0.0 0.0 0.0 1.0
NT Private 1.0 0.0 0.0 0.0 0.0 0.0 0.0 0.0 0.0 1.0
ACT Both 0.0 1.1 0.0 0.0 0.0 0.0 0.0 0.0 0.0 1.1
% Public 10.0 13.8 19.7 25.3 0.0 0.0 0.0 0.0 1.1 69.9
Australia
% Private 6.9 1.0 1.4 0.4 1.1 2.4 0.0 1.0 0.0 14.2
% Both 7.0 6.6 0.5 0.0 1.1 0.0 0.0 0.8 0.0 15.9
Source: NHWDS, Medical Practitioner 2014 *unknown year of training
The proportion of trainees by MM (
Figure 14) also shows that private sector training positions are mostly available outside of
metropolitan areas.
Figure 14: Proportion of trainee FTE by geographic distribution (MM) and sector, 2015
80
70
60
50
40
30
20
10
0
MMM1 MMM2 MMM3
Public Private Both
Source: NHWDS, Medical Practitioner 2015
Prevocational intentions
In 2013, new questions were included in the Medical Practitioner workforce survey which
identifies those who intend to undertake vocational training. The information collected from
these questions form part of the future planning process providing an indication of the future
intentions of trainees (Appendix 4).
Figure 15 details the characteristics of the 54 hospital non-specialists (HNS) who indicated
their intentions to undertake dermatology training:
Page 21 of 51Figure 15: Characteristics of HNS who intend to undertake dermatology training
• 87% • 63% • 59% in • 56% were
female NSW&VIC RMOs
25-34
Gender Location Vocation
years
Source: NHWDS, Medical Practitioner 2015
The primary group of HNS who intend to undertake dermatology training are Resident
Medical Officers, followed by Registrars and Hospital Medical Officers (Figure 16).
Figure 16: HNS who intend to undertake dermatology specialist training by position, 2015
30
25
20
Male
15
Female
10
5
0
Resident Medical Hospital Medical Career Medical Principal House Registrar Other
Officer (RMO) Officer (HMO) Officer (CMO) Officer (PHO)
Source: NHWDS, Medical Practitioner 2015
Similar to the location of trainees in Figure 12 and Figure 13, HNS with intentions of training
in dermatology are mostly located in the same areas as current trainees – primarily major
cities in NSW, VIC and QLD (Figure 17).
Figure 17: Proportion of HNS intentions and trainees by geographic distribution, 2015
35
30 Intentions
Trainees
25
20
15
10
5
0
MMM1 MMM3 MMM1 MMM1 MMM2 MMM4 MMM1 MMM1 MMM1 MMM2 MMM1 MMM2 MMM1
NSW VIC QLD SA WA TAS NT ACT
Source: NHWDS, Medical Practitioner 2015
Page 22 of 51Summary of total workforce by remoteness classification
Table 6 is a broad summary of the population and remoteness characteristics of the
dermatology workforce. As can be seen the number of specialist dermatologists and trainees
per 100,000 population. There were 3.0 per 100,000 in MM1 areas, 0.9 per 100,000 in MM2
areas and 1.4 per 100,000 in MM3 areas. There is only 1 specialist dermatologist outside of
MM3.
Table 6: Summary of dermatology workforce (Headcount and FTE) by MM
Modified 2015 Specialists and Headcount Specialists FTE per
Monash population trainees per 100,000 and trainees 100,000
Category (headcount) population (FTE) population
1 16,885,670 508 3.0 487.9 2.9
2 2,195,310 19 0.9 20.8 0.9
3 1,543,912 22 1.4 24.9 1.6
4 873,037 0 0.0 0.0 0.0
5 1,779,535 1 0.1 0.8 0.0
6 312,590 0 0.0 0.0 0.0
7 218,161 0 0.0 0.0 0.0
Grand Total 23,808,215 550 2.3 534.4 2.2
Note – Trainee FTE is based on clinical hours and specialist FTE is based on total specialist hours.
Source: NHWDS, Medical Practitioner 2015
General Practitioners providing skin cancer services
Background
Patients can and are encouraged to have skin checks from their GP. A GP can also refer
patients to a dermatologist for diagnosis and ongoing management or indeed for a skin check.
GPs may be able to treat some skin cancers, or may refer to a dermatologist for a second
opinion or treatment.
Patients can also attend a skin cancer clinic for a skin check. These are walk-in, no referral-
needed GP-run clinics marketing themselves as holding a special interest in skin cancer. Note
the potentially misleading use of language pitting ‘special interest’ in contrast with
‘specialist’. Most doctors who work in skin cancer clinics are GPs, not dermatologists or
other specialists. Not all these GPs are vocationally registered specialist GPs with Fellowship
of either the Australian College of Rural and Remote Medicine (ACRRM) or the Royal
Australian College of General Practitioners (RACGP). Although some may have undergone
extra training, GPs are not required to have special qualifications to work in a skin cancer
clinic3. Research has shown that GPs working in general practice and those working in skin
cancer clinics diagnose skin cancer with similar accuracy2. Dermatologists have been shown
to have greater skin cancer diagnostic accuracy than referring GPs.3
Unfortunately many members of the general public are unable to differentiate between a
medical specialist and a GP with a “special interest” based on the information they are
presented with. In many cases, consumers believe they are attending a medical
specialist/dermatologist when in fact attending a skin cancer clinic and receiving care from
GP without specialist qualifications.
2
http://www.cancercouncil.com.au/wp-content/uploads/2013/04/Getting-your-skin-checked.pdf
3
. Tran, H et al. Assessing diagnostic skill in dermatology: A comparison between general practitioners and dermatologists. Australasian
Journal of Dermatology (2005) 46, 230–234.
Page 23 of 51You can also read