Climate protection with rapid payback - Energy and CO 2 savings potential of industrial insulation in EU27 - EiiF
←
→
Page content transcription
If your browser does not render page correctly, please read the page content below
Climate protection with rapid payback Energy and CO2 savings potential of industrial insulation in EU27 Ecofys study identifies a large energy efficiency potential of industrial insulation
European Industrial Insulation Foundation   Ecofys Netherlands BV

Avenue du Mont-Blanc 33                     Kanaalweg 15-G
CH-1196 Gland, Switzerland                  NL-3256 KL Utrecht, The Netherlands

t: +41 22 99 500 70                         t: +31 30 662 31 20
f: +41 22 99 500 71                         f: +31 30 662 33 01
info@eiif.org                               info@ecofys.com

www.eiif.org                                www.ecofys.com
Climate protection with rapid payback

Energy and emissions savings potential of industrial insulation in EU27

By: Maarten Neelis, Paul Blinde, Martijn Overgaag and Yvonne Deng

By order of: European Industrial Insulation Foundation

Date: 19 June 2012
Climate protection with rapid payback                                                       Summary

Executive summary

Background of the study
Current practice in industry is reported to lead to levels of insulation that are less than those
which would be cost-effective under current market conditions. This can result from the use of
design criteria based only on maximum safe surface temperature or based on generic heat loss
rates without consideration of the cost effective level.

It is also observed that in many cases thermal insulation in industry is poorly maintained and
parts remain uninsulated creating thermal bridges resulting in excessive heat losses. Poor insu-
lation not only leads to increased cost for energy and unnecessary emissions but also to higher
thermal stresses, which can accelerate wear and leading to more frequent breakdowns. Other
effects of poor insulation include reduced product quality and increased costs of maintenance.
In many cases, the loss of energy to work spaces that are climate controlled creates additional
burdens on cooling systems.

The industrial insulation industry is therefore convinced that there is a significant energy saving
and emissions mitigation potential related to improved thermal insulation in EU27 industry. This
potential is currently untapped despite being cost-effective to implement and offering the addi-
tional benefits mentioned above. Against this background, the European Industrial Insulation
Foundation (EiiF) commissioned Ecofys to study this potential.

Research questions and approach
This study aims to answer the following four questions:

    1)     What is the energy savings and CO2 emissions mitigation potential resulting from
           insulating currently uninsulated parts and from better maintenance of insulation
           systems?

    2)     What is the energy savings and CO2 mitigation potential from improving current
           insulation to cost-effective levels? Cost-effective insulation in this study is defined
           as the insulation that minimises the sum of the costs of heat loss and the costs of
           insulation.

    3)     What is the energy savings and CO2 mitigation potential from improving current
           insulation beyond cost-effective levels to even more energy-efficient levels?
           Energy-efficient insulation in this study is defined as the insulation at which the
           sum of the costs of heat loss and the annualised insulation investments are
           equal to the costs of typical current insulation while offering an additional energy
           savings and CO2 mitigation potential.

    4)     How can these potentials best be realised?

This study investigates savings potentials from improved insulation in EU industry and the
power sector under realistic market conditions. Nuclear power plants and power production
by renewable sources were left outside the scope of this study as well as insulations of cold
applications.

                                                                                                      I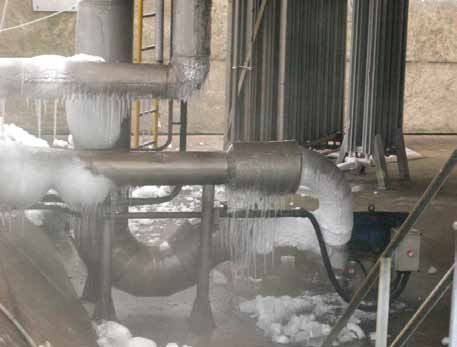
Summary

Case studies of insulation projects have been used to compare energy loss and investments
related to different levels of insulation. The analysis was performed for three temperature levels:
300 °C. Results at the level of the case studies were extrapolated
to European level using data on current energy use. Other assumptions have been made where
needed on the basis of literature and expert input. All potentials are based on a 9% discount
                                               1

rate, an average insulation lifetime of 15 years and a 2-3% per year increase of the price of
energy net of inflation.

Energy savings and CO emissions mitigation potentials
                                      2

The saving potentials are shown in the figure and table below. A savings potential was found
to exist across all regions, sectors and equipment and operating temperatures. Potentials vary
between regions and sectors, due to differences in energy use, temperature profiles and fuel
mix. About two thirds of the energy and emission savings potential is in uninsulated or damaged
insulation. The remaining part of the potential would come from improving insulation on currently
insulated surfaces.

The results show that insulating all surfaces to cost-effective levels would avoid approximately
66% of current heat loss. This corresponds to about 620 PJ (~480 PJ for industry and ~140
PJ for fossil fuel-fired power plants). Improving insulation to energy-efficient levels would even
avoid approximately 75% of current heat loss. This corresponds to about 710 PJ (~550 PJ for
industry and ~160 PJ for fossil fuel-fired power plants). These saving potentials represent about
5% of industrial energy consumption and about 1% of energy input to fossil fuel-fired power
plants .
      2

Table         Total annual savings potential of improving thermal insulation up to cost-effective or energy
              efficient levels in EU27
                                                                      Annual cost -              Annual energy -
                                                                    effective savings            efficient savings
                                                                        potential                    potential
    Energy savings potential                                              620 PJ                       710 PJ
    CO2 emissions reduction potential                                    49 Mt CO2                    56 Mt CO2
    Reduction of heat loss over surfaces                                    -66%                         -75%

1
    The group of experts that provided input to this study represented different insulation companies and most of
them are certified TIPCHECK engineers trained by EiiF in insulation energy appraisals (TIPCHECK = Technical
Insulation Performance Check). All experts within the group have extensive experience with insulation projects and
throughout their careers held different positions in the insulation industry.
2
   Even though the energy savings potential for the power sector is substantial in absolute terms, compared to the
savings potential for industry, it is relatively low as share of total input. The reason for this is the nature of the power
generation which is an energy conversion process.

II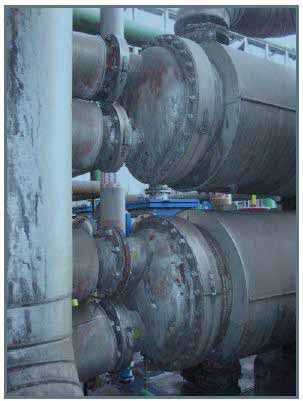
Climate protection with rapid payback                                                                                                       Summary

                                          1,000
                                                                                              Heat loss over surface without
                                           900                                                insulation and surface with damaged
                                                                                              insulation
                                           800                                                Heat loss over insulated surface
               Heat loss in PJ per year

                                           700

                                           600

                                           500

                                           400
                                                                                       -66%
                                           300
                                                                                                                      -75%
                                           200

                                           100

                                             0
                                                  C urrent typical insulation   C ost-effective insulation   Energy-efficienct insulation
                                                          practices                       levels                       levels

Figure       Potential from improving current insulation and insulating surfaces without or with damaged insu-
             lation; Reductions in heat loss assume insulation of the total surface of all equipment. In reality, a
             small share of the total surface cannot be insulated due to technical restrictions.

How big is the potential?
The annual cost-effective potential is more than:

         •   The annual energy consumption of 10 million households
         •   The annual energy input to 15 coal-fired power plants with a production capacity
             of 500 MW
         •   The annual industrial energy consumption of the Netherlands.
         •   The annual CO2 emissions of 18 million middle class cars each running 12,500
             kilometres per year.
         •   The order of magnitude of the total savings potential from technical insulation
             (~5% of industrial energy consumption and ~1% of energy input to fossil fuel-
             fired power plants) shows that improving insulation can significantly contribute to
             achieving EU’s 2020 climate and energy targets, known as the “20-20-20” targets:
             -- A 20% reduction in primary energy use compared with projected levels, to be
                 achieved by improving energy efficiency.
             -- A reduction in EU greenhouse gas emissions of at least 20% below 1990 levels
             -- 20% of EU energy consumption to come from renewable resources

Investments in energy efficient insulations pay back
Improving insulation will not only save energy but also reduce costs. The figure below shows the
total costs of two different insulation solutions over a 15-year lifetime. The costs of the current

                                                                                                                                                 III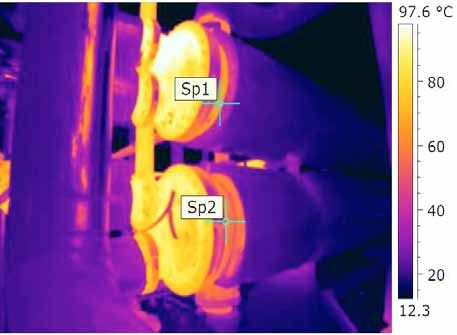
Summary

typical insulation solution (usually fulfilling process or safety requirements only) are taken as
reference.

                    Current typical                    Cost-effective
                      insulation                         insulation
                     11%
                                                    23%

                                                                                      Costs of heat
                                                                                      loss over
                                                          1st Qtr                     lifetime
                                                          2nd Qtr
                                                                            58%       Investments

                                                 19%

                                                                                      Cost savings
                                    89%                                               from reduced
                                                                                      heat loss
Figure     Visualisation of cost savings from reduced heat loss due to the use of cost-effective insulation

The figure shows that although cost-effective insulation requires a higher initial investment,
because of cost savings from reduced energy loss, it will lead to lower costs over the total insu-
lation lifetime.

Costs for current typical insulation:

11% investment in insulation + 89% costs for energy due to heat loss                     = 100%

Costs for cost-effective insulation:

19% investment in insulation + 58% costs for energy due to heat loss                     = 77%

The cost-savings that can be achieved depend on characteristics of the specific application. As
a general rule, the achievable cost savings of improved insulation increase with longer operation
times and lifetimes.

Cost-effective or energy efficient industrial insulation will generate jobs
Apart from saving energy and costs, implementing cost-effective technical insulation on all
surfaces could save jobs and even increase employment by, roughly estimated, 4,000 people
EU-wide. All results were found to be consistent with expert opinions and figures found in
literature.

How to tap the potential?
     1)    Insulate uninsulated and damaged parts

This study shows that insulating uninsulated equipment and repairing damaged insulation
parts combines the biggest energy and emission cost-effective saving potential with payback
periods of less than one year. It is therefore recommended that industry focuses first on those
uninsulated and damaged parts which can be insulated quickly and easily and bring immediate
benefits.

IV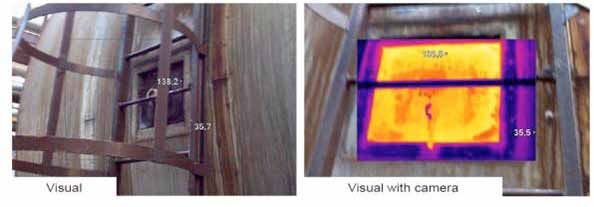
Climate protection with rapid payback                                                      Summary

    2)     Evaluate cost-effectiveness and consider insulating today beyond today’s
           cost-effective levels to be prepared for likely increasing costs for energy
           and CO2 emissions

Most plants have an insulation system that meets safety rules and process needs or that leads
to a generic maximum heat loss rate. Such insulation systems typically have a lower perfor-
mance than what would be cost-effective. Compared to current practices, cost-effective insu-
lation will therefore in general save both heat and money. This study therefore recommends
evaluating cost-effectiveness in future insulation projects. Since insulating now saves money
in the future, the cost-effectiveness should be evaluated using expected future costs of energy.
Removal and replacement of current insulation is only attractive under some circumstances.
Replacing damaged insulation or insulating bare equipment is normally always cost-effective.
The savings potential of improving current insulation to cost-effective levels is therefore best
realised during general overhauls and installation of new equipment when new insulation needs
to be applied anyway.

Insulating beyond cost-effective levels is a way to partly mitigate the risk of increasing energy
prices and can help achieve company goals for energy efficiency and for greenhouse gas emis-
sions reduction. This study investigated the level of energy efficient insulation. This term stands
for insulation beyond the cost-effective level at which the sum of the costs of heat loss and the
annualised insulation investments are equal to the costs of typical current insulation. The level
of energy efficient insulation reduces heat loss sustainably at no additional overall costs but
requires higher initial investments than typical insulation.

According to experts, the present absence of cost-effective insulation is partly the result of
organisational barriers. To realise the potential of improved insulation, it is therefore recom-
mended that these barriers are identified and tackled where they exist.

    3)     Involve insulation experts early in the planning of new build and turn-
           around projects to ensure thermal efficient and cost-effective insulation
           systems:

Application of insulation material is quite often hampered by limitations in the space available,
for example between pipes with different temperatures. Although this can (partly) be solved
by using insulation materials with better insulating properties these would typically be more
expensive. This drawback can be minimised or even avoided by involving insulation engineers
early enough during the design phase of new equipment or retrofit projects.

                                                                                                    V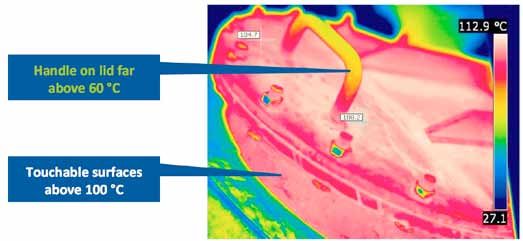
Summary

VI
Climate protection with rapid payback                                                                                                                                              Contents

Contents

1             Summary.  .  .  .  .  .  .  .  .  .  .  .  .  .  .  .  .  .  .  .  .  .  .  .  .  .  .  .  .  .  .  .  .  .  .  .  .  .  .  .  .  .  .  .  .  .  .  .  .  .  .  .  .  .  . I

1             Contents .  .  .  .  .  .  .  .  .  .  .  .  .  .  .  .  .  .  .  .  .  .  .  .  .  .  .  .  .  .  .  .  .  .  .  .  .  .  .  .  .  .  .  .  .  .  .  .  .  .  .  .  .  . VII

1             List of Figures. .  .  .  .  .  .  .  .  .  .  .  .  .  .  .  .  .  .  .  .  .  .  .  .  .  .  .  .  .  .  .  .  .  .  .  .  .  .  .  .  .  .  .  .  .  .  .  .  . IX

1             List of Tables. .  .  .  .  .  .  .  .  .  .  .  .  .  .  .  .  .  .  .  .  .  .  .  .  .  .  .  .  .  .  .  .  .  .  .  .  .  .  .  .  .  .  .  .  .  .  .  .  .  . XI

1             Introduction. .  .  .  .  .  .  .  .  .  .  .  .  .  .  .  .  .  .  .  .  .  .  .  .  .  .  .  .  .  .  .  .  .  .  .  .  .  .  .  .  .  .  .  .  .  .  .  .  .  .  . 13
    1.1       Framework and goal of this study. . . . . . . . . . . . . . . . . . . . . . . . . . . . . . . . . . . 13
    1.2       Why insulate?. . . . . . . . . . . . . . . . . . . . . . . . . . . . . . . . . . . . . . . . . . . . . . . . . . . 14
    1.3       Why is the potential still there?. . . . . . . . . . . . . . . . . . . . . . . . . . . . . . . . . . . . . . 14
    1.4       Approach . . . . . . . . . . . . . . . . . . . . . . . . . . . . . . . . . . . . . . . . . . . . . . . . . . . . . . 15
    1.5       Outline of this report. . . . . . . . . . . . . . . . . . . . . . . . . . . . . . . . . . . . . . . . . . . . . . 18

2             Inputs to calculations. . . . . . . . . . . . . . . . . . . . . . . . . . . . . . . . . . . . . . . . . . . 19
    2.1       Current insulation. . . . . . . . . . . . . . . . . . . . . . . . . . . . . . . . . . . . . . . . . . . . . . . . 19
    2.2       Current heat loss . . . . . . . . . . . . . . . . . . . . . . . . . . . . . . . . . . . . . . . . . . . . . . . . 20
    2.2.1     Fuel-use related to each temperature-level. . . . . . . . . . . . . . . . . . . . . . . . . . . . 20
    2.2.2     Energy loss over surfaces . . . . . . . . . . . . . . . . . . . . . . . . . . . . . . . . . . . . . . . . . 21
    2.3	Investments in insulation . . . . . . . . . . . . . . . . . . . . . . . . . . . . . . . . . . . . . . . . . . 24
    2.3.1     Total investments. . . . . . . . . . . . . . . . . . . . . . . . . . . . . . . . . . . . . . . . . . . . . . . . 24
    2.3.2     Annualisation of investments. . . . . . . . . . . . . . . . . . . . . . . . . . . . . . . . . . . . . . . 25
    2.4       Costs of heat loss. . . . . . . . . . . . . . . . . . . . . . . . . . . . . . . . . . . . . . . . . . . . . . . . 27
    2.4.1     Costs of fuel. . . . . . . . . . . . . . . . . . . . . . . . . . . . . . . . . . . . . . . . . . . . . . . . . . . . 27
    2.4.2     Costs of greenhouse gas emissions. . . . . . . . . . . . . . . . . . . . . . . . . . . . . . . . . 28

3             Energy savings and CO2 emissions mitigation potentials .  .  .  .  .  .  .  .  .  .  .  .  . 30
    3.1       Overview of different potentials . . . . . . . . . . . . . . . . . . . . . . . . . . . . . . . . . . . . . 30
    3.2       The potential from insulating currently uninsulated parts and from better
              maintenance of insulation systems. . . . . . . . . . . . . . . . . . . . . . . . . . . . . . . . . . 32
    3.3       The potential from improving insulation of currently insulated surfaces. . . . . . . 34

                                                                                                                                                                                              VII
Contents
4 Investments and employment. . . . . . . . . . . . . . . . . . . . . . . . . . . . . . . . . . . . . 37
4.1 Investments . . . . . . . . . . . . . . . . . . . . . . . . . . . . . . . . . . . . . . . . . . . . . . . . . . . . 37
4.2 Employment. . . . . . . . . . . . . . . . . . . . . . . . . . . . . . . . . . . . . . . . . . . . . . . . . . . . 39
5 Conclusions and recommendations. . . . . . . . . . . . . . . . . . . . . . . . . . . . . . . 40
5.1 Size of the potential . . . . . . . . . . . . . . . . . . . . . . . . . . . . . . . . . . . . . . . . . . . . . . 40
5.2 How to tap the potential?. . . . . . . . . . . . . . . . . . . . . . . . . . . . . . . . . . . . . . . . . . 40
6 Reference sources. . . . . . . . . . . . . . . . . . . . . . . . . . . . . . . . . . . . . . . . . . . . . . 43
A Breakdown of potential by sector and region. . . . . . . . . . . . . . . . . . . . . . . . 46
A.1 Potential per sector. . . . . . . . . . . . . . . . . . . . . . . . . . . . . . . . . . . . . . . . . . . . . . 46
A.2 Potential per region . . . . . . . . . . . . . . . . . . . . . . . . . . . . . . . . . . . . . . . . . . . . . . 46
B Sensitivity analyses. . . . . . . . . . . . . . . . . . . . . . . . . . . . . . . . . . . . . . . . . . . . . 48
B.1 Missing and damaged insulation . . . . . . . . . . . . . . . . . . . . . . . . . . . . . . . . . . . . 48
B.2 Cost-effective insulation. . . . . . . . . . . . . . . . . . . . . . . . . . . . . . . . . . . . . . . . . . . 48
B.3 Energy-efficient insulation . . . . . . . . . . . . . . . . . . . . . . . . . . . . . . . . . . . . . . . . . 49
C Best practice in industry. . . . . . . . . . . . . . . . . . . . . . . . . . . . . . . . . . . . . . . . . 50
C.1 Chemical plant, France. . . . . . . . . . . . . . . . . . . . . . . . . . . . . . . . . . . . . . . . . . . 50
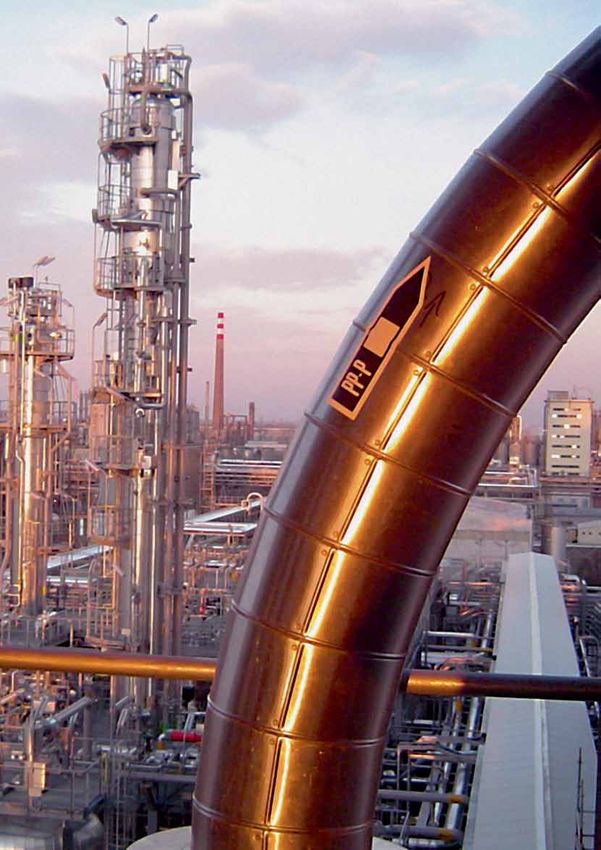
C.2 Refinery tower, Italy . . . . . . . . . . . . . . . . . . . . . . . . . . . . . . . . . . . . . . . . . . . . . . 52
C.3 Processing plant, Germany . . . . . . . . . . . . . . . . . . . . . . . . . . . . . . . . . . . . . . . . 53
C.4 Chemical plant, the Netherlands . . . . . . . . . . . . . . . . . . . . . . . . . . . . . . . . . . . . 53
C.5 Machine room, the Netherlands. . . . . . . . . . . . . . . . . . . . . . . . . . . . . . . . . . . . . 54
C.6 Refinery, Belgium. . . . . . . . . . . . . . . . . . . . . . . . . . . . . . . . . . . . . . . . . . . . . . . . 55
C.7 Processing line, The Netherlands. . . . . . . . . . . . . . . . . . . . . . . . . . . . . . . . . . . . 55
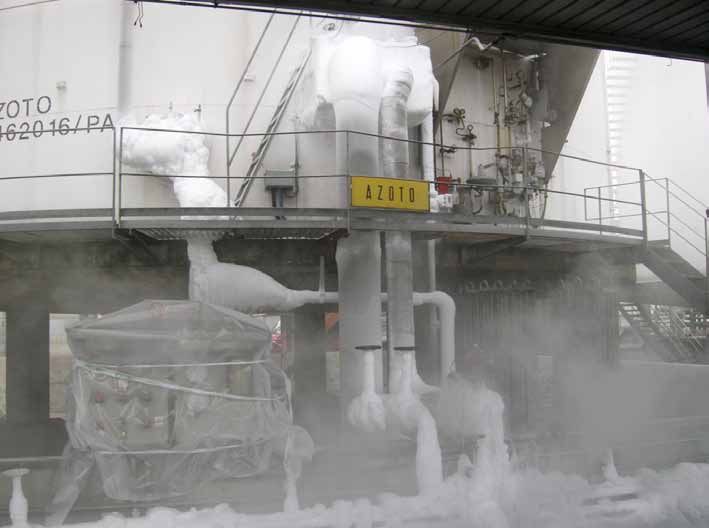
C.8 Condensation on uninsulated parts . . . . . . . . . . . . . . . . . . . . . . . . . . . . . . . . . . 56
VIIIClimate protection with rapid payback List of Figures
List of Figures
Figure 1-1 Cost curve of insulation of a flat surface . . . . . . . . . . . . . . . . . . . . . . . . . . 15
Figure 1-2 Overview of data sources and study results . . . . . . . . . . . . . . . . . . . . . . . 16
Figure 2-1 2007 fuel consumption by refineries and manufacturing industry . . . . . . . 20
Figure 2-2 Distribution of fuel input over surfaces with different temperature
levels in various industrial sectors. . . . . . . . . . . . . . . . . . . . . . . . . . . . . . . 21
Figure 2-3 Current heat loss as share of fuel consumption in EU27. . . . . . . . . . . . . . 23
Figure 2-4 Current heat loss over surfaces in EU27. . . . . . . . . . . . . . . . . . . . . . . . . . 23
Figure 2-5 Typical required investments in insulation as function of insulation
thickness for a pipe . . . . . . . . . . . . . . . . . . . . . . . . . . . . . . . . . . . . . . . . . . 24
Figure 2-6 Required insulation thickness for different heat loss rates. . . . . . . . . . . . . 25
Figure 3-1 Potential from improving current insulation and insulating surfaces
without or with damaged insulation. . . . . . . . . . . . . . . . . . . . . . . . . . . . . . 31
Figure 3-2 Potential in the EU from insulating currently non-insulated and
repairing damaged insulation. . . . . . . . . . . . . . . . . . . . . . . . . . . . . . . . . . . 33
Figure 3-3 Comparison of heat loss rates resulting from cost-effective insulation
and typical current insulation. . . . . . . . . . . . . . . . . . . . . . . . . . . . . . . . . . . 34
Figure 3-4 Comparison of heat loss rates resulting from energy-efficient
insulation and typical current insulation. . . . . . . . . . . . . . . . . . . . . . . . . . . 35
Figure 3-5 Heat loss at current, cost-effective and energy-efficient level of
insulation in EU27 . . . . . . . . . . . . . . . . . . . . . . . . . . . . . . . . . . . . . . . . . . . 35
Figure 4-1 Investments required for improving insulation to cost-effective and
energy-efficient levels and corresponding annual savings from
reduced heat loss. . . . . . . . . . . . . . . . . . . . . . . . . . . . . . . . . . . . . . . . . . . . 37
Figure 4-2 Visualisation of cost savings from reduced heat loss for an average
insulated surface. . . . . . . . . . . . . . . . . . . . . . . . . . . . . . . . . . . . . . . . . . . . 38
Figure A-1 Annual energy and emissions savings potential per sector. . . . . . . . . . . . 46
Figure A-2 Regional division of EU27 for the purpose of this study . . . . . . . . . . . . . . 47
Figure A-3 Annual energy and emissions savings potential per region. . . . . . . . . . . . 47
Figure C-1 Regular and thermographic photo of a boiler window. . . . . . . . . . . . . . . . 50
Figure C-2 Regular and thermographic photo of an uninsulated valve. . . . . . . . . . . . 51
Figure C-3 Thermographic photo of a tank . . . . . . . . . . . . . . . . . . . . . . . . . . . . . . . . . 51
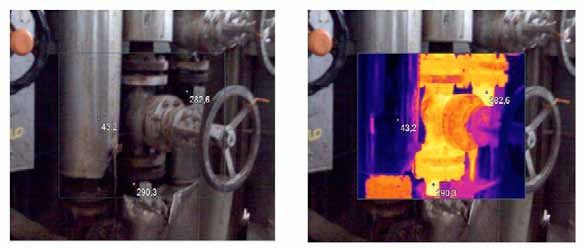
Figure C-4 Regular and thermographic photo showing dangerously high-
temperature surfaces. . . . . . . . . . . . . . . . . . . . . . . . . . . . . . . . . . . . . . . . . 54
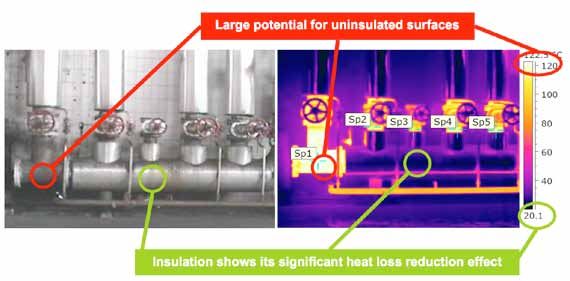
Figure C-5 Regular and thermographic photo showing high-temperature surfaces . . 54
Figure C-6 Regular and thermographic photo showing high-temperature surfaces . . 55
Figure C-7 Regular and thermographic photo showing dangerously high-
temperature surfaces. . . . . . . . . . . . . . . . . . . . . . . . . . . . . . . . . . . . . . . . . 56
IXList of Figures Figure C-8 Pump breaks down . . . . . . . . . . . . . . . . . . . . . . . . . . . . . . . . . . . . . . . . . . 56 Figure C-9 Valve can no longer be operated. . . . . . . . . . . . . . . . . . . . . . . . . . . . . . . . 56 Figure C-10 Extensive ice building on pipes and valves. . . . . . . . . . . . . . . . . . . . . . . . 57 Figure C-11 Broken vapour barriers and insufficient insulation. . . . . . . . . . . . . . . . . . . 58 X
Climate protection with rapid payback                                                                                List of Tables

List of Tables
 Table 2-1          Assumptions for current rates of heat loss at different temperature levels.20
 Table 2-2          Current heat loss . . . . . . . . . . . . . . . . . . . . . . . . . . . . . . . . . . . . . . . . . . . 22
 Table 2-3          Assumptions for the calculation of annual capital costs . . . . . . . . . . . . . . 26
 Table 2-4          2010 price of main fuel types. . . . . . . . . . . . . . . . . . . . . . . . . . . . . . . . . . . 28
 Table 3-1          Potential from improving current insulation and insulating surfaces
                    without or with damaged insulation. . . . . . . . . . . . . . . . . . . . . . . . . . . . . . 31
 Table 3-2          Fuel savings from measures that involve applying insulation to bare
                    surfaces or repairing insulation . . . . . . . . . . . . . . . . . . . . . . . . . . . . . . . . . 33
 Table 3-3          Fuel savings from measures that involve improving insulation to
                    optimum levels. . . . . . . . . . . . . . . . . . . . . . . . . . . . . . . . . . . . . . . . . . . . . . 36
 Table 4-1	Investments required for improving insulation to cost-effective and
            energy-efficient levels . . . . . . . . . . . . . . . . . . . . . . . . . . . . . . . . . . . . . . . . 38
 Table B-1          Savings potentials for different shares of surfaces without or with
                    damaged insulation. . . . . . . . . . . . . . . . . . . . . . . . . . . . . . . . . . . . . . . . . . 48
 Table B-2          Cost-effective rate of heat loss . . . . . . . . . . . . . . . . . . . . . . . . . . . . . . . . . 49
 Table B-3	Rate of heat loss at energy-insulation levels and corresponding
            savings potential . . . . . . . . . . . . . . . . . . . . . . . . . . . . . . . . . . . . . . . . . . . . 49

                                                                                                                                   XI
List of Tables XII
Climate protection with rapid payback                                                  1 Introduction

1          Introduction

1.1        Framework and goal of this study
In 2007, EU leaders endorsed a set of ambitious climate and energy targets to be met by the
year 2020. These EU ambitions are known as the 20-20-20 targets:

       •    A 20% reduction in primary energy use compared with projected levels, to be
            achieved by improving energy efficiency.
       •    A reduction in EU greenhouse gas emissions of at least 20% below 1990 levels
       •    20% of EU energy consumption to come from renewable resources
In this policy context, there is significant attention on measures that reduce energy demand and
mitigate CO2 emissions in all sectors of the economy such as the built environment, transport
and industry.

From their experience, the European industrial insulation Foundation (EiiF) is convinced that
there is a significant energy saving and CO2 mitigation potential related to improved thermal
insulation in industry and that this potential is currently untapped despite being cost-effective to
implement. With energy and CO2 prices likely to rise, this potential is probably growing. Against
this background, EiiF commissioned Ecofys to answer the following three questions:

      1)     What is the energy savings and CO2 mitigation potential resulting from better
             maintenance of insulation systems and from insulating currently uninsulated
             parts?

      2)     What is the energy savings and CO2 mitigation potential resulting from cost-
             effective thermal insulation in the power sector and industry?

      3)     What is the technical potential available beyond current cost-effective insulation?

The potentials assessed in this study would on average be profitable under real market condi-
tions for industrial sectors and fossil-fuel power generation. Together these sectors constitute
around 35% of Europe’s primary energy use (based IEA, 2010). Fossil-fuel fired power gen-
eration covers both electricity only and combined heat and power (CHP) plants. These plants
account for 56% of total power generation in EU 27. The remainder is generated by nuclear
power plants (28%) and renewable sources (16%). Neither of these last two is covered by this
study as they do not give rise to greenhouse gas emissions.

Insulations of cold applications also fall outside the scope of this study as the majority of indus-
trial processes take place in hot applications (in industry cold insulations have a market share
of about 5%). Furthermore the effects of inadequate cold insulation are better detectable (con-
densation formation most often followed by ice building) so that e.g. uninsulated parts in cold
processes are less to be found. Nevertheless, wherever and whenever cold systems are not
insulated properly: insulation is e.g. insufficiently dimensioned, damaged or not maintained
consequently; they cause, besides large energy losses, also immediate condensation problems.
(For more information, please see info box about special requirements for cold applications in
chapter 1.4).

                                                                                              13 / 58
1 Introduction
1.2 Why insulate?
In both the power sector and industry, fuel is burned to generate heat (in furnaces, steam boilers
etc.) that is used in a variety of process units. The larger the share of heat that is used produc-
tively, the higher the efficiency of a process. To reduce heat loss, thermal insulation is therefore
applied to boilers and ovens, pipes, tanks and vessels and other equipment. This allows an
efficiency gain that reduces the energy use per unit of output and of the associated greenhouse
gas emissions and those of other pollutants such as CO, NOx and SOx.
In many cases, insulation also plays an important role in providing functions such as personal
protection, process control, product stabilisation, freeze protection, noise control and fire pro-
tection (Barnett, 2003). Poor insulation not only leads to increased costs for energy, but also to
higher thermal stresses, which can accelerate wear and subsequently lead to more frequent
breakdowns. Other effects of poor insulation can include reduced product quality, increased
costs of maintenance (U.S. DOE, 2007) and additional burdens on air conditioning, wherever
excess heat is lost to work spaces (U.S. DOE, 2007).
1.3 Why is the potential still there?
Industrial insulation experts1 observe that in many cases, thermal insulation in industry is
poorly maintained and that some parts remain uninsulated creating thermal bridges resulting in
excessive heat losses. They also note that the level of insulation applied is typically based on
requirements regarding the maximum surface temperature that equipment is allowed to reach to
avoid personal injuries or based on generic maximum heat loss rates allowed. It is very rare that
industrial companies require that the insulation system is designed based on criteria of cost-
effectiveness over the lifetime of the insulated piece of equipment. In the past, when fuel prices
were lower this would in many cases not have led to a large difference. Nowadays, the price
of energy is higher and is expected to grow even further. As a result there is an increasing gap
between current and cost-effective insulation levels. Additional costs for CO2 emission allow-
ances will accelerate this trend.
According to expert experiences, there are usually several reasons for companies not to
make detailed assessments of the cost-effectiveness of insulation and not to maintain existing
insulation:
There may be a general lack of information for the main decision makers about the large energy
savings potential of industrial insulation
• Insulation is a relatively small part of investments. Even though poor insulation
leads to higher costs of heat loss over many years, it is often seen as less important.
• Retrofitting insulation can, or can be perceived to, cause disruption in production.
• In common with other energy efficiency measures, it is not the core business of the
main decision makers.
1
The group of experts that provided input to this study represented different insulation companies and most of
them are certified TIPCHECK engineers trained by EiiF in insulation energy appraisals (TIPCHECK = Technical
Insulation Performance Check). All experts within the group have extensive experience with insulation projects and
throughout their careers held different positions in the insulation industry.
14 / 58Climate protection with rapid payback 1 Introduction
• There may be a lack of information about improvements in insulation materials
and in the design of modern insulation systems
• Split or unclear responsibility for decisions on maintenance.
1.4 Approach
The total costs of insulation are the sum of annualised investments and the annual costs of heat
loss. As the degree of insulation increases, the investment costs increase and the cost of the
heat loss decrease. As schematically shown in Figure 1 - 1, a minimum exists (point B) where
total costs are lowest1. Throughout this report, this level is referred to as the cost-effective
level of insulation.
Figure 1 - 1 shows that further potential exists beyond cost-effective insulation levels. Beyond
cost-effective level, heat loss is reduced even further at little additional cost. A point (point C)
can be defined where the total costs per year are equal to the costs of current insulation but
where insulation quality is significantly better. Throughout this report, this level is referred to as
the energy-efficient level of insulation.
Costs of insulation
Costs of heat loss
Costs per year
Total costs
Current Energy-efficient
(A) (C)
Cost-effective
(B)
Insulation thickness
Figure 1-1 Cost curve of insulation of a flat surface
The best insulation solution varies from application to application depending on many design
factors such as for example the shape and temperature of the surface that is insulated, sensi-
tivity to corrosion or the need for fire-proof materials. However, the main driver of differences
in heat loss rates is the difference in temperature between a surface and its surroundings. As it
would be impossible to account for all different aspects in a study such as this, this study con-
centrates on an analysis for three temperature levels for each sector:
• Low-temperature (ambient temperature – 100 °C)
2
• Middle-temperature (100 – 300 °C)
• High-temperature (>300 °C)
1
At this point the Net Present Value of the project is highest.
2
This study does not focus on cold insulation where the temperature of equipment is lower than ambient
temperature; see Box 1)
15 / 581 Introduction
Figure 1 - 2 gives a schematic overview of the data sources used. Relations between invest-
ments in insulation (Euro), the ratio between heat loss to current heat loss (-) and the rate of
heat loss (W/m2)1 have been obtained from case studies: a coal-fired power plant for high-
temperature surfaces, part of a chemical plant for middle-temperature surfaces and part of a
brewery for low-temperature surfaces. More background on the case studies used in this study
is provided by Box 2.
The fuel mix for each sector was obtained from energy statistics (IEA, 2009). Current and future
fuel prices were based on a forecasting study of the European Commission (EC, 2009b). This
study accounts for the effect of climate change policies by assuming costs of 15 Euro/tCO2.
Prices of energy are assumed to increase by 2-3% per year net of inflation.
Heat loss, investments and savings have been extrapolated to European level using data on
current energy use from energy statistics and assumptions for current insulation levels and heat
loss on the basis of literature and expert judgements. IPCC emission factors have been used to
express savings in terms of greenhouse gas emissions reduction. All potentials are based on a
9% discount rate and an average insulation lifetime of 15 years.
Input Output
Insulation projects Potential from insulating un-insulated
equipment and repairing damaged
insulation
Energy statistics
Cost-effective levels of thermal
insulation and resulting potential
Literature survey
Further potential beyond cost-effective
Expert opinions levels
Figure 1-2 Overview of data sources and study results
Overall, results are based on the best data available to the authors at the time that the study
was performed. Not enough data about insulation projects was available to allow robust sta-
tistical analyses. This study therefore relies on expert assumptions and secondary data from a
variety of sources.
1 2
The relation between heat loss (TJ /year) and rate of heat loss (W/m ) is not straightforward since the rate of
2
heat loss (W/m ) has area in the denominator and for non-plane surfaces such as cylinders (pipes), spheres etc.,
the surface area increases with increasing insulation thickness.
16 / 58Climate protection with rapid payback 1 Introduction
Box 1 Special requirements for cold applications (temperatures below ambient tem-
perature) (EiiF, 2012)
The FESI Technical Lexicon defines “Cold insulation” as follows: “Assembly of components
which reduces heat gain of the cold medium.” In principle, experts talk of “cold insulation”
wherever the medium temperature is below the temperature of the ambient air. The tem-
perature range of “cold insulation” is therefore between -273 °C and ambient temperature.
Insulations of cold applications fall outside the scope of this study because of their modest
market share (~5%) and due to their special requirements. This does not mean that there
is no energy savings potential in the “cold” temperature range below ambient temperature:
The main duty of all insulation systems, and therefore also of cold insulation is the reduction
of heat flow rates. With hot insulation, the heat flow rate is from the object towards the
ambient air, with cold insulations it is the other way around: from the ambient air to the
object. Compared with hot insulation systems cold insulation systems have however more
and further requirements to fulfil than limiting heat loss or respectively heat gain: cold insu-
lations always need to avoid the danger of moisture entering the insulation material. This
moisture results from condensation of water vapour out of the ambient air, whenever the
temperature at the object or inside the insulation material is below the dew point. Water
vapour will be transported into the insulation by differences in the overall pressure (air
movement) and through differences in the partial water vapour pressure (water vapour dif-
fusion) between the ambient air and the object to be insulated. Therefore it is first of all the
minimisation of moisture in the insulation which determines the design of a cold insulation
system. If this danger is not prevented, immediately water and/or ice form at those parts
of the insulation system where the temperature is below the dew-point temperature or the
freezing point of water. Whereas the heat “just escapes” from poorly or not insulated hot
insulation systems the consequences of ineffective cold insulation systems (below dew-
point temperatures) cause, besides great energy losses, immediately negative effects on
the industrial process:
• In the insulation material, they reduce the insulating effect considerably. The
thermal conductivity of water is 20 times that of air, the thermal conductivity of ice
is 100 times that of air. Extensive heat gain of the cold medium is the consequence.
• Water can cause corrosion on insulated installations and on the inner surface of
the cladding which could lead to material failure and cause severe accidents like
bursting pipes.
• Water and ice increase the weight of the insulated system. Cold piping can col-
lapse under this additional load.
Cold insulations have, in general, a limited life expectancy: They are unstable systems,
which for physical reasons react sensitively to damages. They must be maintained regu-
larly, which includes a routine check of sealings and interruptions. This is needed not only
to save decent volumes of energy but also to keep industrial processes running.
17 / 581 Introduction
Box 2 Case studies
This study uses, amongst others, the data from five insulation projects. For each of these
projects, the investments (Euro), heat loss (TJ/year) and insulation thickness (mm) was
available for a wide range of heat loss rates (W/m ). Consistent data for the price of insu-
2
lation material and installation were used for all projects. Trends observed from the projects
in heat loss, heat loss rate and insulation thickness are the result of laws of physics and
will be valid for typical cases observed in practice. Exact quantitative relations will however
vary from application to application. The relations found for the used case studies are by
insulation experts believed to be within the range of what is typically observed and not to
represent extremes. To allow for comparison, all case studies were normalised with respect
to annual operation time (90% utilization rate) and surface area:
• 1 GW coal-fired power plant: this case study predominantly involves temperatures
between 300 °C and 500 °C although the complete power plant has been consid-
ered including all piping, vessels, channels and plane surfaces, an e-precipitator
and a flue gas desulphurisation plant.
• Part of a chemical plant: the project involved a set of pipes with an average tem-
perature of approximately 200 °C
• Part of a methane compressor station with a throughput of 55,000 Nm3/h and a
pressure increase from 35 to 200 bar; the project involved a set of pipes with a
total length of approximately 200 m and an average temperature of 150 °C.
• Part of a brewery with a capacity of 3,500,000 hl; the project involved the insula-
tion of two lauter tuns (vessel used in the brewing process to separate out wort)
and related pipelines with a temperature of 84 °C.
• Part of an atmospheric distillation unit at a refinery. The unit has a capacity of
143,396 barrels/day and a maximum thermal input rate of 130 MW. The insula-
tion project involved approximately 1,100 m2 of the tower wall. The surrounding
equipment (furnace, heat exchangers, pipelines, other small surrounding towers)
consists of around 40,000 m2 of already insulated surface.
1.5 Outline of this report
The structure of this report is as follows:
• Chapter 2 discusses the project approach and assumptions.
• Chapter 3 shows the energy savings and CO2 emissions mitigation potentials from
improved insulation. The breakdown of these potential by sector and region is
shown in Appendix A. Appendix B describes a number of examples of insulation
projects. The potentials were tested on their sensitivity to a number of key assump-
tions. The results of this sensitivity analysis are shown in Appendix C.
• Chapter 4 discusses the investments required and the effects on employment.
• Finally, chapter 7 gives the main conclusions and recommendations
18 / 58Climate protection with rapid payback 2 Inputs to calculations
2 Inputs to calculations
The general approach to determine savings potentials is described in the introduction. This
chapter describes how the inputs to that approach were obtained: current insulation (section
2.1), current heat loss (section 2.2) and the relation between the rate of heat loss per square
meter on the one hand and investments in insulation (section 2.3) and total heat loss (section
2.4) on the other hand.
2.1 Current insulation
The company which uses insulation typically defines to what level its equipment is insulated.
According to industry experts, most plants are operated with an insulation system specified to
meet safety rules, process needs or a generic maximum heat loss rate. Specifications asking for
an economic insulation system are an exception (EiiF, 2010a; EiiF, 2010b, EiiF, 2010c)
Insulation performance is usually specified as a typical heat loss rate per unit of surface area
(W/m ) insulated. A lower heat loss rate corresponds to a higher degree of insulation. A current
2
heat loss rate of 150 W/m2 can be inferred from a study to technical information from KAEFER
(KAEFER, 2010), expert input (EiiF, 2010b), standards specifications of six companies (four in
the power sector, one in the brewery sector and a provider of boiler systems) (EiiF, 2010c). This
value is used for high- and middle-temperature applications. As heat losses are driven by tem-
perature differences, low-temperature surfaces typically have lower rates of heat loss. In this
study a heat loss rate of 100 W/m2 for low-temperature applications is assumed. Sectors and
regions have different temperature profiles and the distinction of heat loss rates by temperature
levels also leads to differences in the average heat loss rate between sectors and regions.
In reality, the average heat loss at a given temperature level varies from sector to sector and
from region to region. It was not possible within the scope of this study to account for such
variations as even within sectors there are significant differences in insulation performance (EiiF,
2010a; EiiF, 2010b).
The heat loss rates discussed above refer to insulated surfaces. Not all surfaces are however
insulated. The company website of Hertel (2011), a global company, states that in a typical
plant 10-19% of insulation is damaged or missing. For U.S. industry, King (2010) estimates that
10-30% of all exposed mechanical insulation becomes damaged or missing within 1 to 3 years
of installation. Lettich (2003) presents two typical case studies of U.S. plants, a chemical plant
and a refinery, in which about 20% of all insulation is damaged. For the EU, where insulation
performance is typically better, NCTI estimates that on average 5-10% of all surfaces is badly
insulated (EiiF, 2011). Based on the information above and additional expert judgements, the
share of equipment without insulation or with damaged insulation is conservatively estimated to
be 10%, 6% and 2% for low-, middle- and high-temperature surfaces respectively.
The heat loss over surfaces without or with damaged insulation is predominantly dependent
on surface temperature and the remaining degree of insulation (for damaged insulation). Esti-
mates are made based on calculations of heat loss rates in accordance with guidelines from the
Association of German Engineers (VDI, 2008). As a general rule, the heat loss from a hot, bare
surface can be as much as 20 times greater than from a surface insulated to current industry
standards (Hart, 2003). Calculations by experts show that for high-temperature surfaces, heat
loss rates can be even higher depending on the temperature.
19 / 582 Inputs to calculations
Table 2 - 1 provides an overview of assumptions with respect to the status of current insulation.
Table 2-1 Assumptions for current rates of heat loss at different temperature levels, based on expert input
(EiiF, 2010b, 2010c; KAEFER, 2010); heat loss rate over poorly or uninsulated surfaces (based
on calculations); share of equipment that is currently not insulated (Hertel, 2011; Lettich, 2003;
King, 2010 and additional expert judgements)
Average rate of Average share
Average current
heat loss over of equipment
rate of heat loss
Type of application surfaces without without or
over insulated
2 or with damaged with damaged
surfaces in W/m 2
insulation in W/m insulation
Low-temperature applications
100 1,000 10%
(300 °C)
2.2 Current heat loss
To calculate the current heat loss, the fuel input to each sector is first related to the different
temperature levels (section 2.2.1). In a second step, a percentage of that fuel input is assumed
to be lost over insulated surfaces (section 2.2.2).
2.2.1 Fuel-use related to each temperature-level
Figure 2 - 1 shows the 2007 fuel consumption of refineries and manufacturing industry, 10,673
PJ in total. In addition to this fossil fuel-fired power generation used 17,004 PJ.
Petroleum refineries
Iron and steel
Chemical and petrochemical
Non-ferrous metals
Non-metallic minerals
Transport equipment
Machinery
Mining and quarrying
Food and tobacco
Paper, pulp and print
Wood and wood products
Construction
Textile and leather
Non-specified (industry)
0 200 400 600 800 1,000 1,200 1,400 1,600 1,800 2,000
Fuel consumption in PJ / year
Figure 2-1 2007 fuel consumption by refineries and manufacturing industry (IEA energy statistics); The depicted
fuel consumption is net of any fuel used in conversion processes from one energy carrier to another
(e.g. crude oil to petroleum products in refineries, coal to cokes and cokes to blast furnace gas in
the iron and steel industry).
20 / 58Climate protection with rapid payback 2 Inputs to calculations
For each sector considered, the fuel use is distributed over low-, middle- and high-temperature
applications in terms of shares of surface area (see Figure 2 - 2) (based on ECN (2002), FfE
(2007), FfE (2009) and EC (2009)). This distribution takes into account that due to cascading of
energy use, high-temperature processes (e.g. power generation) also involve low temperature
surfaces. The figure shows that some sectors predominately involve high-temperature surfaces
whereas others predominately involve only low-temperature surfaces.
The fuel inputs from Figure 2 - 1 were combined with the temperature profiles from Figure 2 - 2
to obtain the fuel input for each sector associated with each temperature level.
Fossil fuel-fired power generation
Petroleum refineries
Iron and steel
Chemical and petrochemical
Non-ferrous metals
Non-metallic minerals
Transport equipment
Machinery
Mining and quarrying
Food and tobacco
Paper, pulp and print
Wood and wood products
Construction
Textile and leather
Non-specified industry
0% 10% 20% 30% 40% 50% 60% 70% 80% 90% 100%
Low-temp. surfaces (< 100 °C ) Middle-temp. surfaces (100 - 300 °C ) High-temp. surfaces (> 300 °C )
Figure 2-2 Distribution of fuel input over surfaces with different temperature levels in various industrial sectors
based on ECN (2002), FfE (2007), FfE (2009) and EC (2009)
2.2.2 Energy loss over surfaces
The amount of heat that is lost over surfaces normally only represents a small fraction of the
energy input to a process. A share of energy input is converted into useable work driving the
conversion of raw materials or intermediates into final products. Energy that is not converted to
useable work or services can be considered to be lost. Not all losses take place due to heat loss
over surfaces that could be insulated (the following is based on U.S. DOE-ITP, 2004):
• Losses occur in energy conversion systems (e.g., power generation, boilers, heat
exchangers, process heaters, pumps, motors) where efficiencies are thermally or
mechanically limited by materials of construction and equipment design other than
insulation.
• In some cases, heat-generating processes are not located optimally near heat
sinks, and it may be economically impractical to recover the excess energy.
• Energy is sometimes lost simply because it cannot be stored.
• Energy is also lost from processes when waste heat is not recovered and when
waste by-products with fuel value are not utilised.
21 / 582 Inputs to calculations
• Energy may leave the process with the product, cooling water, flue or exhaust gas
Of the energy that is lost over surfaces, the actual loss depends on the specific application.
Pipes with a large diameter for example have less heat loss expressed per unit of energy
throughput as compared to those with a smaller diameter. In lower temperature processes,
energy is consumed mainly via smaller, insulated, steam or hot water based equipment, where
losses over the surface area represent a more significant fraction of the energy used.
One of the case studies considered in this study, the coal-fired power plant (see Box 2: case
studies), predominantly involves high-temperature surfaces. At a currently typical heat loss rate
of 150 W/m2, this plant would have a heat loss that represents about 0.5% of total energy input.
Another case study, the crude distillation tower predominantly involves middle-temperature sur-
faces. At a currently typical heat loss rate of 150 W/m2, this tower has a heat loss representing
about 6% of total energy input.
Based on these case studies and additional expert judgements, the energy loss over insulated
surfaces in fossil fuel-fired power generation is assumed to be 0.5% of energy input. For low,
middle, and high-temperature equipment in industry, the heat loss over insulated surfaces is
assumed to be 6%, 4% and 2% of energy input, respectively. These shares represent the heat
1
loss in case all surfaces would be insulated up to typical levels. Since a share of the surfaces is
currently not insulated, the heat loss over currently insulated surfaces is somewhat lower.
Table 2 - 2, Figure 2 - 3 and Figure 2 - 4 show the current heat loss calculated by combining
the shares of heat loss (see above), the current fuel input per temperature level (see section
2.2.1) and the assumptions regarding current insulation (see section 2.1). Results show that for
the power sector the absolute heat loss is substantial. Even so, the percentage of heat loss as
share of total input is relatively low.
Table 2-2 Current heat loss
Share of energy Share of energy
Total share
that is lost that is lost over
of energy use
Type of application over currently surfaces without
input that is
insulated or with damaged
currently lost
surfaces insulation
Fossil fuel-fired power generation 1.2% 0.5% 0.7%
Industry
Low-temperature surfaces 9.6% 5.4% 4.2%
(300 °C)
1 2
At equal insulation performance in terms of heat loss rate (W/m ), the heat loss as percentage of energy input
is lower for equipment with higher temperatures, since the energy within such equipment is higher. In addition, the
size of higher temperature equipment on average is larger leading to less heat flow over exterior surface per unit
of volume. On top of that, the time that a heat medium remains in higher temperature equipment on average is
shorter, allowing less time for the medium’s heat content to flow over exterior surface.
22 / 58Climate protection with rapid payback 2 Inputs to calculations
10%
Heat loss over surface without
9% insulation and over surface with
Energy loss as share of fuel consumption damaged insulation
Heat loss over insulated surface
8%
7%
6%
5%
4%
3%
2%
1%
0%
Fossil fuel fired Industry low- Industry middle- Industry high-
power generation temp. surfaces temp. surfaces temp. surfaces (>
(< 100 °C) (100 - 300 °C) 300 °C)
Figure 2-3 Current heat loss as share of fuel consumption in EU27
400
Heat loss over surface without
350 insulation and over surface with
damaged insulation
Heat loss over insulated surface
300
Energy loss in PJ per year
250
200
150
100
50
0
Fossil fuel fired Industry low- Industry middle- Industry high-
power generation temp. surfaces temp. surfaces temp. surfaces
(< 100 °C) (100 - 300 °C) (> 300 °C)
Figure 2-4 Current heat loss over surfaces in EU27
The shares in Table 2 - 2 seem conservative compared to assumptions made by the U.S.
Department of Energy (DOE-ITP, 2010) in an energy analysis of U.S. industry. That analysis
assumes that energy losses incurred during distribution of steam within the plant boundaries
amount to 20% of steam production. Losses during process heating due to radiation, con-
vection, insulation, and cooling are estimated to be 15%. Both types of losses include losses
due to missing or damaged insulation.
23 / 582 Inputs to calculations
2.3 Investments in insulation
The annualised investments in insulation over the insulation lifetime are obtained by annualising
(section 2.3.2) total investments required to limit heat loss to a certain level (section 2.3.1).
2.3.1 Total investments
Investments in insulation include material costs and installation costs. Material costs include the
costs of both insulation material and cladding. The costs of maintenance are not considered in
this study.
Figure 2 - 5 shows the typical relation between overall investments and insulation thickness for
a pipe. Thicker insulation requires more material (See Box 3 for the relation between insulation
thickness and heat loss). Material costs therefore scale with the thickness of the insulation.
Costs related to the installation and cladding material are considered to be fixed; each time
however that a new layer of insulation material is required, additional effort needs to be made,
resulting in a small step in installation costs.
2
Costs of insulation per m
Insulation thic kness
Figure 2-5 Typical required investments in insulation as function of insulation thickness for a pipe
In this study, relations between the costs of insulation (Euro) and the rate of heat loss (W/m2)
are obtained from case studies (see Box 2: Case studies): a coal-fired power plant for high-
temperature surfaces, part of a chemical plant for middle-temperature surfaces and part of a
brewery for low-temperature surfaces.
24 / 58Climate protection with rapid payback 2 Inputs to calculations
Box 3 Relation between insulation thickness and heat loss
The insulation thickness required to attain a certain heat loss rate (expressed as W/m
2
of surface area) is a function of the properties of the insulation material, the shape of the
insulated surface, the temperature difference over the insulation layer and the wind speed
in the surrounding environment.
The figure below shows the insulation thickness as a function of heat loss rate for case
studies prepared by EiiF experts and for various heat pipes with different temperatures and
diameters. For the considered applications, the effects of differences in insulation material
used and wind speeds are small compared to the effects of temperature differences and
shape.
Figure 2-6 Required insulation thickness for different heat loss rates
The figure shows that lower heat loss rates require thicker insulation. In addition, the figure
shows that higher temperatures require thicker insulation to reach the same heat loss
rate. For the pipes, the figure also shows that the required thickness depends on the pipe
diameter. This dependence is a result of the fact that for convex surfaces, such as pipes,
the surface area increases with increasing insulation thicknesses.
2.3.2 Annualisation of investments
Installing insulation now saves money in the future. From an investor’s point of view it is
however impossible to simply add and subtract investments and savings if they occur at dif-
ferent points in time. Investors have a time preference. They would rather have cash imme-
diately than in the future. Like most things that lie ahead in time, future savings are moreover
25 / 582 Inputs to calculations
uncertain. This problem is solved in this study by discounting future savings1. Table 2 - 3 pro-
vides an overview of the assumed discount rate and insulation lifetime.
Table 2-3 Assumptions for the calculation of annual capital costs
Parameter Value
Discount rate 9%
Lifetime of insulation 15 years
Insulation lifetime varies from one application to the other. Obviously, longer lifetimes increase
the profitability of investments in insulation. Based on expert judgments the average lifetime of
insulation is estimated to be 15 years; a figure that is supported by Hertel (2011). Insulation of
20 years and older is however also observed in practice. Such insulation generally involves out-
dated types of materials and therefore should normally be replaced as soon as possible to avoid
excessive heat losses.
The discount rate reflects the time preference and risk premium for the investor. When an
investor rather receives 100 Euro now then 108 Euro a year from now, then he is said to have
a discount rate of 8%. The actual discount rate is the sum of the real discount rate plus the
expected rate of inflation. The effects of inflation are excluded from this study by using the real
discount rate and expressing all investments, costs and savings in constant 2010 Euros.
The choice of real discount rate depends on the purpose of the analysis. When investigating the
potential that is economically attractive from a social perspective, typically a real discount rate
of 3 - 5% is used for energy saving investments. When investigating the part of the technical
potential that is economically attractive from the point of view of private investors, discount rates
of 8-15% or higher can be used to reflect real market conditions (EC, 2009b; Blok 2007; U.S.
EPA, 2008). Based on a company survey, Oxera (2009) reports real discount rates of 6 - 9% for
low-risk conventional power generation and discount rates of up to 16% for riskier technologies.
The PRIMES model used for the official EU projections assumes a real discount of 12% for
industry.
A company often bases its hurdle rate (the minimum expected return a company will consider in
accepting investment opportunities or action proposals) on its weighted average cost of capital
(WACC). Typical WACCs are in the order of 8-10% (Acca, 2006; U.S. EPA, 2008; Damodaran,
2011 and WikiWealth, 2011). Many companies were however found to use hurdle rates that are
3 - 5% higher than their cost of capital (Poterba and Summers, 1995; Meier and Tarhan, 2007).
It is worth mentioning here that a firm-wide discount rate would be expected to result in underin-
vestment in low-risk projects whose expected returns would not meet the company-wide hurdle
rate (Oxera, 2011).
Based on the above, a real discount rate of 9% is used which is at the lower bound of typical
private discount rates but well above typical social discount rates. The sensitivity to this choice
is tested by evaluating heat loss reductions for cost-effective insulation at discount rates of 3%
and 15% as well (see Appendix B).
1
This is equivalent to annualising investments by an annuity factor (α) which is a function of insulation lifetime (n)
and discount rate (r):
26 / 58You can also read


