Results for Q1 2020 - Barrick Gold
←
→
Page content transcription
If your browser does not render page correctly, please read the page content below

Results for Q1 2020…
Cautionary Statement on Forward
Looking Information
Certain information contained or incorporated by reference in this presentation, including any information as to our strategy, projects, plans or future financial or operating performance, constitutes “forward-looking statements”. All statements,
other than statements of historical fact, are forward-looking statements. The words “expect”, “target”, “plan”, “project”, “goal”, “continue”, “budget”, “estimate”, “potential”, “may”, “will”, “can”, “could”, “would”, “should” and similar expressions
identify forward-looking statements. In particular, this presentation contains forward-looking statements including, without limitation, with respect to: Barrick’s forward-looking production guidance and estimates of future costs; cash flow
forecasts; projected capital, operating and exploration expenditures, including with respect to Barrick’s 10-year production profile; Barrick’s engagement with local communities to manage the Covid-19 pandemic; Barrick’s response to the
government of Papua New Guinea’s decision not to extend Porgera’s Special Mining Lease; the duration of the temporary suspension of operations at Porgera; the new partnership between Barrick and the Government of Tanzania (“GoT”)
and the agreement to resolve all outstanding disputes between Acacia and the GoT; Barrick’s energy and sustainability strategies, including potential reductions to Barrick’s carbon footprint and costs, and improvements in Barrick’s
sustainability performance, including the timing of Barrick’s updated ESG scorecard; our goals with respect to environmental, health and safety certifications for our operating mines; mine life and production rates; estimated timing for
construction of, and production from, new projects, including the Deep South Project; our pipeline of high confidence projects at or near existing operations; potential for existing or newly acquired and/or developed assets to become Tier One
or Tier Two gold assets; potential extensions to life of mine; potential mineralization and metal or mineral recoveries; our ability to convert resources into reserves; our project pipeline and results of our greenfield and brownfield exploration
work; and expectations regarding future price assumptions, financial performance and other outlook or guidance.

Forward-looking statements are necessarily based upon a number of estimates and assumptions including material estimates and assumptions related to the factors set forth below that, while considered reasonable by the Company as at the
date of this presentation in light of management’s experience and perception of current conditions and expected developments, are inherently subject to significant business, economic and competitive uncertainties and contingencies. Known
and unknown factors could cause actual results to differ materially from those projected in the forward-looking statements and undue reliance should not be placed on such statements and information. Such factors include, but are not limited
to: fluctuations in the spot and forward price of gold, copper or certain other commodities (such as silver, diesel fuel, natural gas and electricity); the speculative nature of mineral exploration and development; changes in mineral production
performance, exploitation and exploration successes; risks associated with projects in the early stages of evaluation and for which additional engineering and other analysis is required; timing of receipt of, or failure to comply with, necessary
permits and approvals, including non-renewal of Porgera’s Special Mining Lease; the benefits expected from recent transactions being realized, including Nevada Gold Mines; diminishing quantities or grades of reserves; increased costs,
delays, suspensions and technical challenges associated with the construction of capital projects; operating or technical difficulties in connection with mining or development activities, including geotechnical challenges and disruptions in the
maintenance or provision of required infrastructure and information technology systems; failure to comply with environmental and health and safety laws and regulations; uncertainty whether some or all of Barrick's targeted investments and
projects will meet the Company’s capital allocation objectives and internal hurdle rate; the impact of global liquidity and credit availability on the timing of cash flows and the values of assets and liabilities based on projected future cash flows;
adverse changes in our credit ratings; the impact of inflation; fluctuations in the currency markets; changes in U.S. dollar interest rates; risks arising from holding derivative instruments; changes in national and local government legislation,
taxation, controls or regulations and/or changes in the administration of laws, policies and practices, expropriation or nationalization of property and political or economic developments in Canada, the United States and other jurisdictions in
which the Company or its affiliates do or may carry on business in the future; lack of certainty with respect to foreign legal systems, corruption and other factors that are inconsistent with the rule of law; risks associated with illegal and artisanal
mining; risks associated with new diseases, epidemics and pandemics, including the effects and potential effects of the global Covid-19 pandemic; disruption of supply routes which may cause delays in construction and mining activities;
damage to the Company’s reputation due to the actual or perceived occurrence of any number of events, including negative publicity with respect to the Company’s handling of environmental matters or dealings with community groups,
whether true or not; the possibility that future exploration results will not be consistent with the Company’s expectations; risks that exploration data may be incomplete and considerable additional work may be required to complete further
evaluation, including but not limited to drilling, engineering and socioeconomic studies and investment; risk of loss due to acts of war, terrorism, sabotage and civil disturbances; litigation and legal and administrative proceedings; contests over
title to properties, particularly title to undeveloped properties, or over access to water, power and other required infrastructure; business opportunities that may be presented to, or pursued by, the Company; risks associated with the fact that
certain of the initiatives described in this presentation are still in the early stages and may not materialize; our ability to successfully integrate acquisitions or complete divestitures, including our ability to successfully reintegrate Acacia’s
operations; risks associated with working with partners in jointly controlled assets; employee relations including loss of key employees; increased costs and physical risks, including extreme weather events and resource shortages, related to
climate change; and availability and increased costs associated with mining inputs and labor. Barrick also cautions that its 2020 guidance and five and ten year plan may be impacted by the unprecedented business and social disruption
causes by the spread of Covid-19. In addition, there are risks and hazards associated with the business of mineral exploration, development and mining, including environmental hazards, industrial accidents, unusual or unexpected formations,
pressures, cave-ins, flooding and gold bullion, copper cathode or gold or copper concentrate losses (and the risk of inadequate insurance, or inability to obtain insurance, to cover these risks).

Many of these uncertainties and contingencies can affect our actual results and could cause actual results to differ materially from those expressed or implied in any forward-looking statements made by, or on behalf of, us. Readers are
cautioned that forward-looking statements are not guarantees of future performance. All of the forward-looking statements made in this presentation are qualified by these cautionary statements. Specific reference is made to the most recent
Form 40-F/Annual Information Form on file with the SEC and Canadian provincial securities regulatory authorities for a more detailed discussion of some of the factors underlying forward-looking statements and the risks that may affect
Barrick’s ability to achieve the expectations set forth in the forward-looking statements contained in this presentation. We disclaim any intention or obligation to update or revise any forward-looking statements whether as a result of new
information, future events or otherwise, except as required by applicable law.
Preparedness for Covid-19…
  Proactive and considered engagement with all stakeholders has mitigated the
impact of the Covid-19 pandemic on our people and supported the sustainability of
                          the business during this time

                                                                Proactive
 Paramount to Barrick during the Covid-19                       Response
 pandemic is the Health and Safety of our
 workforce and communities
 Implemented a number of measures and actions
 designed to protect our employees and
 contractors on site                              Perspective                Preparedness
 The four ‘Ps’ approach
     Proactive Response
     Preparedness
     Prevention
     Perspective                                                Prevention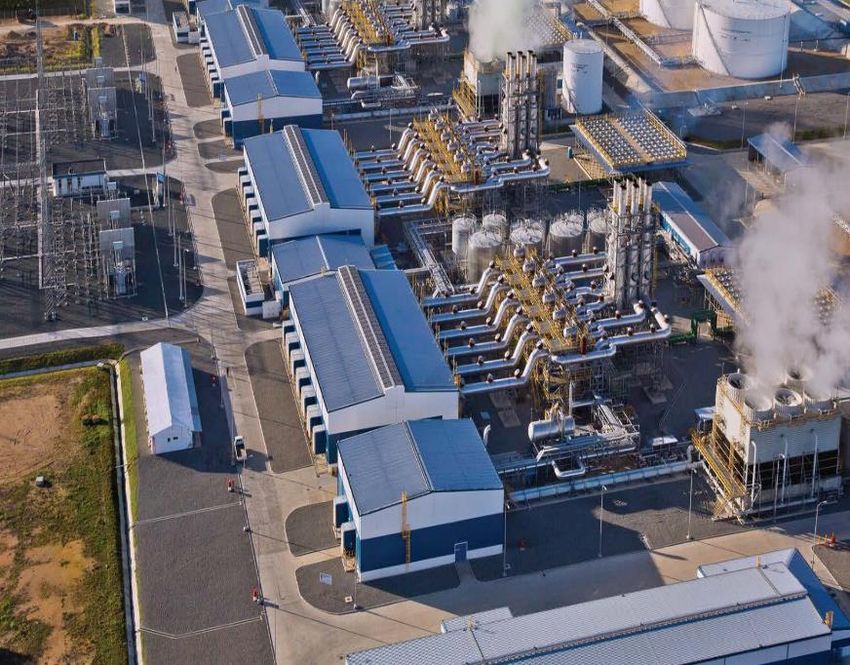
Fighting Covid-19…
Proactive engagement with our host countries, communities and employees limits
spread of the virus in our communities
   Medical supplies ordered for local clinics:
       Gloves; Masks; Hand sanitisers including an
       ethyl alcohol donation in Dominican Republic
   Medical Equipment:
       Test Kits; Ventilators; Beds
   Isolation centres
   Food and medical supplies to communities where
   mandatory self isolation impacted the most vulnerable
       Food banks
       Food kits
       Meals for students who no longer have access to meals during school closure
       Provision of supplies to our indigenous populations
Over $20 million contributed in direct support of host countries and
communities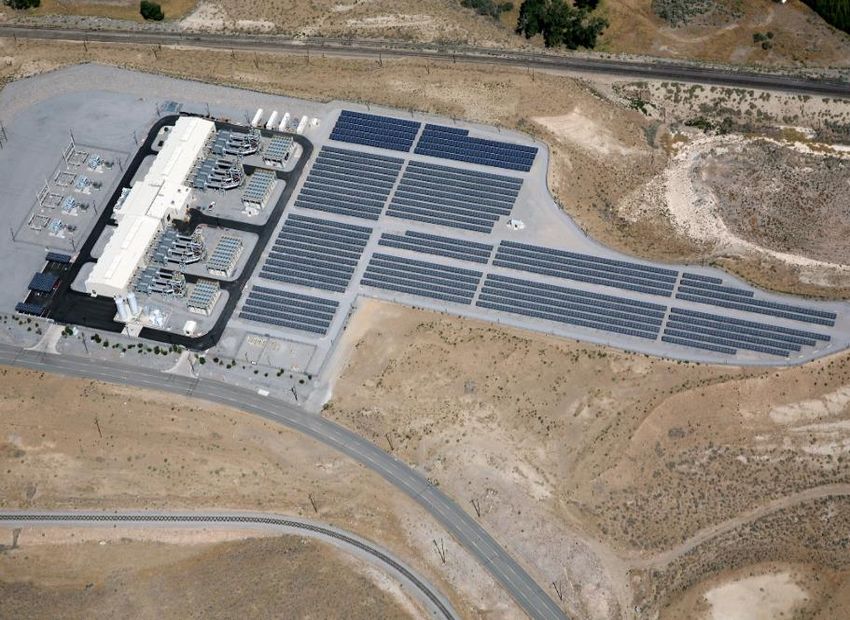
Sustainability Report &
Scorecard…
 Sustainability report published on April 7 reaffirming our
 commitment to ESG and sustainability - improved performance
 against all key KPIs
 Developed a sustainability scorecard to rate our ESG
 performance over the past year - an industry first
     Scorecard compares our performance against our peers: Health
     and Safety, Social and Economic Development, Human Rights,
     the Environment and Governance
     Comprises 18 indicators - based on our sustainability vision and
     principles
     Identification of indicators largely informed by our investor and
     sustainability reporting expectations
     We have ranked ourselves in quintiles against our peers and
     internal metrics
     Graded B for 2019 reflecting improvement in sustainability
     performance and progress against goals
     Plan to update this scorecard in Q2 2020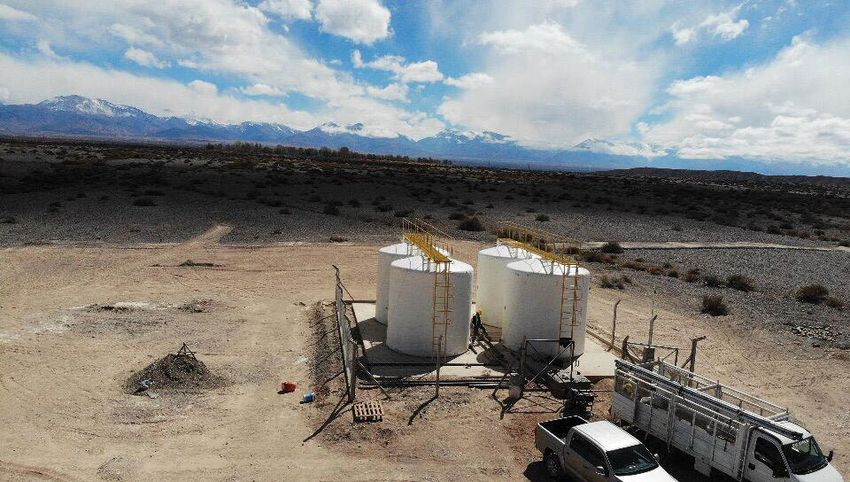
Health & Safety…

LTIs 1 decreased to 9 in Q1 – 4 less than                               LTIFR1                    TRIFR2
previous quarter                                  3.0
                                                               2.75
LTIFR1 decreased to 0.32 in Q1 from 0.47 in
                                                  2.5
previous quarter                                                             2.18          2.23
46 injuries recorded during Q1 – 5 less than      2.0                                                    1.86
previous quarter                                                                                                       1.64

TRIFR2 decreased to 1.64 from 1.86 in             1.5
previous quarter
                                                  1.0
100% of Safety Leadership Interactions                  0.61          0.52                        0.47
achieved in Q1                                    0.5
                                                                                    0.41
                                                                                                                0.32
Progressing well towards the goal of having all
operational mines certified to the ISO 45001      0.0
                                                         Q1 19         Q2 19         Q3 19         Q4 19         Q1 20
Health and Safety standard by the end of 2021
Environment & Community…
Zero class 1 (high impact) environmental
incidents3 recorded in Q1
77% water reuse and recycling rate
Pueblo Viejo power plant received first natural
gas shipment in Q1 - lowers GHG emissions and
cuts costs
Nevada Gold Mines approved conversion of TS
Power Plant from coal to natural gas as well as
100MW solar power installation
Approved tailings treatment project at Golden
Sunlight in Montana reducing long term closure
liabilities
On track to achieve ISO 14001:2015 certification
for all operating mines by end of 2020
                                                   Veladero - 3 Water Treatment Plants completed for
$4.2 million invested in community development     use by the communities in the area
projects over and above Covid-19 prevention
support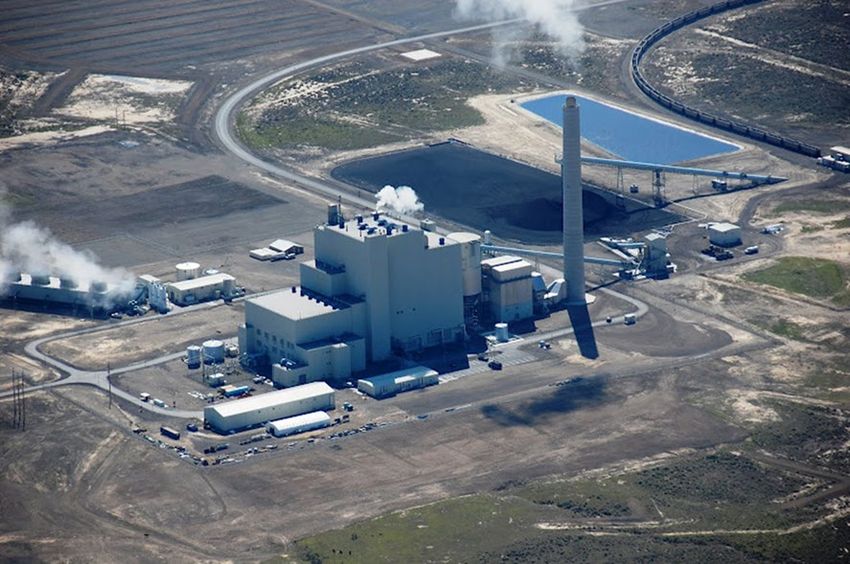
Barrick…Q1 2020 KPIs
 Solid start to the year from all operations
 Gold production and costs consistent with full year guidance
 Debt, net of cash, down a further 17% to $1.85 billion with no significant maturities until 2033
 Operating Cash Flow increases to $889 million and Free Cash Flow4 to $438 million
 Net earnings per share of 22 cents for the quarter; Adjusted net earnings per share of 16 cents for the quarter5
 Copper costs per pound significantly lower demonstrating resilience of business
 Successful completion of Massawa sale creates value for all stakeholders
 Signing of framework agreement in Tanzania paves way for exporting concentrate
 Continued focus on safety delivers improvements in injury rates
 2019 Annual Report highlights ten-year plan as Barrick looks to next phase of value creation
 Proactive engagement with all stakeholders ensures protection of our people and supports sustainability of the
 business during Covid-19 pandemic
 Barrick’s sustainability vision demonstrated by publication of industry-first ESG scorecard
 Brownfields exploration success points to life of mine extensions
 Global exploration portfolio expanded with new projects and targets
 Barrick declares $0.07 quarterly dividend per share
Group operating results…

                Strong Q1 2020 production consistent with                                                                                        Gold operating results                                   Q1 2020 Q4 2019 Q1 2019
                guidance, despite Covid-19 pandemic, but care and
                                                                                                                                                 Production (oz 000)                                             1,250       1,439   1,367
                maintenance at Porgera necessitates revised group
                guidance of 4.6Moz to 5.0Mozi for the year                                                                                       Cost of sales ($/oz)6                                           1,020       1,046    947
                          Costs well contained and in line with prior quarter                                                                    Total cash costs ($/oz)7                                            692      692     631
                          Gold production in Q2 expected to be lower than Q1                                                                     All-in sustaining costs ($/oz)7                                     954      923     825
                          due to mine sequencing and planned maintenance, but
                          scheduled to increase in second half of the year as                                                                    Copper operating results Q1 2020 Q4 2019 Q1 2019
                          guided
                                                                                                                                                 Production (millions of pounds)                                     115      117     106
                Copper sales increased from the previous quarter                                                                                 Cost of sales ($/lb)6                                              1.96      2.26    2.21
                as local smelters restart after maintenance shut down
                                                                                                                                                 C1 cash costs ($/lb)8                                              1.55      1.90    1.66
                          Significant drop in costs demonstrates resilience of this
                          business                                                                                                               All-in sustaining costs ($/lb)8                                    2.04      2.82    2.46
                          Copper production on track to meet guidance of 440 to
                          500 Mlb in 2020i

iBarrick   is closely monitoring the global Covid-19 pandemic and Barrick’s guidance may be impacted if the operation or development of our mines and projects is disrupted due to efforts to slow the spread of the virus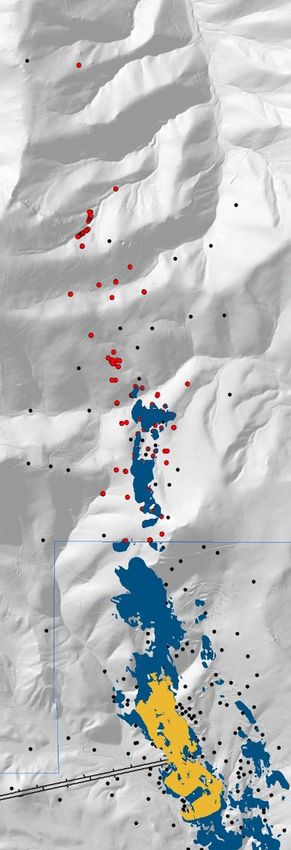
Group financial results…
           Adjusted net earnings5 of $0.16 per share in Q1                             Financial Results                      Q1 2020 Q4 2019 Q1 2019
           2020                                                                        Revenue ($ million)                      2,721   2,883   2,093
           Increased free cash flow4 of $438 million in Q1                             Net earnings ($ million)                  400    1,387    111
           compared to prior quarter, driven by good                                   Adjusted net earnings ($ million)5        285     300     184
           performance from operations and higher gold
                                                                                       Adjusted EBITDA9                         1,466   1,562   1,002
           prices
                                                                                       Net cash provided by operating
           Debt, net of cash is at $1.85 billion, down 17%                                                                       889     875     520
                                                                                       activities ($ million)
           from the end of 2019
                                                                                       Free cash flow ($ million)4               438     429     146
                      Massawa transaction in March 2020 provided $256 million
                      in cash (net) and an ~11% interest in Teranga Gold               Net earnings per share ($)                0.22    0.78    0.06
                      On January 31, 2020, we completed a make-whole                   Adjusted net earnings per share ($)5      0.16    0.17    0.11
                      repurchase of our $337m, 3.85% notes due 2022
                                  Annualized interest savings of $13 million           Total attributable capital
                                                                                                                                 364     393     361
                                  No significant public debt maturities until 2033     expenditures ($ million)10

           Quarterly dividend per share at $0.07,                                      Cash and equivalents ($ million)         3,327   3,314   2,153
           underpinned by our strong balance sheet and                                 Debt, net of cash ($ million)            1,852   2,222   3,654
           free cash flow4 outlook based on our five-year
                                                                                       Dividend per share ($)                    0.07    0.07    0.04
           guidance
Refer to Appendix D for assumptions used in our five and ten-year indicative outlook
To be World Class requires a
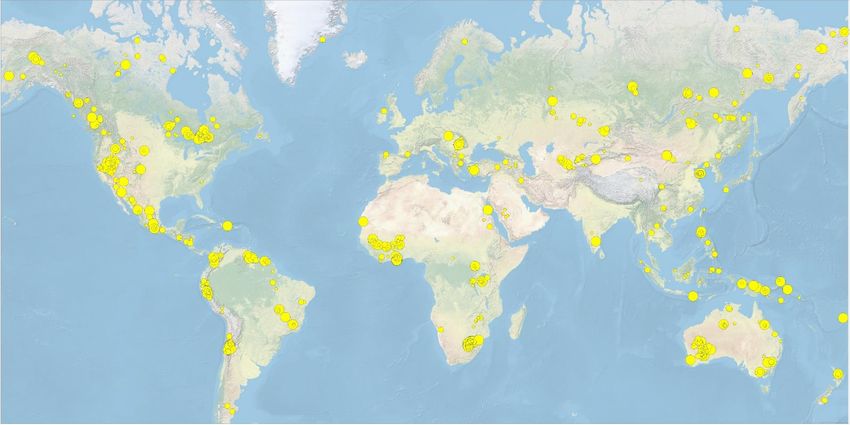
global presence…
Operating presence in prolific gold districts
Dominant district scale land positions
Understand mineral systems at district and deposit scale
Barrick projects
3 - 5Moz
5 – 10Moz Exploration presence in under-explored or emerging frontiers
>10Moz
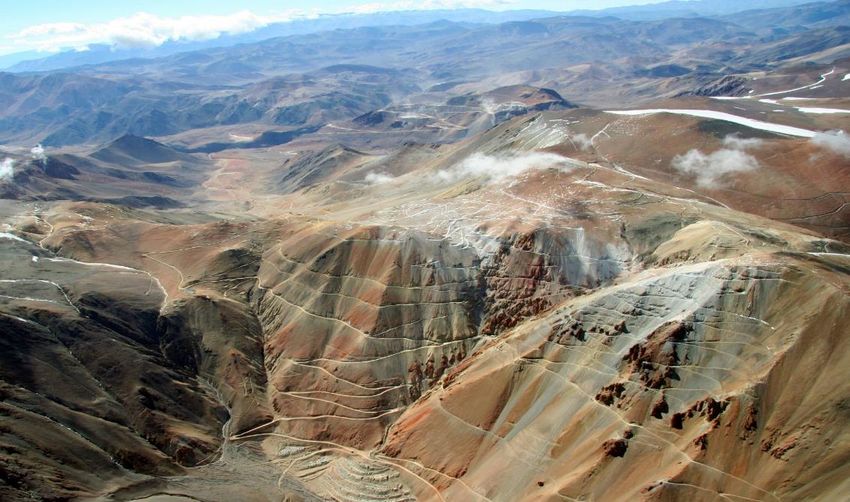
Actively evaluating external opportunities that could meet company filtersCarlin…
Nevada, USA
Production 8% lower compared to prior quarter, Carlin11 (61.5%) Q1 2020 Q4 2019 Q1 2019
primarily due to increase in higher grade Cortez ore Total tonnes mined (000) 17,120 13,639 11,982
processed by Carlin roasters displacing lower grade Average grade processed
Carlin ore in the feed mix 3.41 3.65 4.31
(g/t)
Total cash cost per ounce7 in line with the prior quarter Ore tonnes processed (000) 3,229 3,156 2,162
AISC per ounce 7 higher than the prior quarter due to Recovery rate (%) 71% 75% 78%
additional capitalized stripping and underground Gold produced (oz 000) 253 276 233
development
Gold sold (oz 000) 256 275 239
Exploration Income ($ millions) 153 133 83
The Carlin Trend is the most active exploration area in EBITDA ($ millions)9 202 191 149
Barrick’s portfolio with: Capital expenditures ($
55 51 50
millions)
Near-mine extension potential at Ren, Rita K and
Minesite sustaining 55 51 50
Greater Leeville
Cost of sales ($/oz)6 970 975 947
Generative activities focused on building regional scale
model of the Roberts Mountains Thrust connecting the Total cash costs ($/oz)7 776 766 671
Carlin Trend with the Battle Mountain-Eureka Trend All-in sustaining costs ($/oz)7 1,007 965 891
See the Technical Report on the Carlin Complex, dated March 25, 2020, and filed on SEDAR at www.sedar.com and EDGAR at www.sec.gov on March 25, 2020Cortez…
Nevada, USA
Cortez12 (61.5%) Q1 2020 Q4 2019 Q1 2019
Production 4% lower compared to prior quarter, Total tonnes mined (000) 22,696 23,422 27,572
primarily due to lower processed grades following
Average grade processed (g/t) 1.06 1.29 1.66
depletion of higher-grade CHOP oxide stockpile
Ore tonnes processed (000) 4,783 4,259 5,473
Total cash cost per ounce7 10% lower than prior
Recovery rate (%) 84% 75% 85%
quarter due to improved cost control
Gold produced (oz 000) 128 133 262
Projects and Exploration Gold sold (oz 000) 128 132 259
Cortez Deep South remains on track to Income ($ millions) 89 69 155
contribute to production in 2020 EBITDA ($ millions)9 122 105 219
Goldrush permitting activities continue to Capital expenditures ($
50 43 76
millions)13
advance - Record of Decision in Q4 2021, in line
Minesite sustaining13 46 40 13
with plan
Project13 4 3 63
Cost of sales ($/oz)6 876 945 682
Total cash costs ($/oz)7 614 681 433
All-in sustaining costs ($/oz)7 1,009 1,012 506
See the Technical Report on the Cortez Joint Venture Operations, dated March 22, 2019, and filed on SEDAR at www.sedar.com and EDGAR at www.sec.gov on March 22, 2019Turquoise Ridge…
Nevada, USA
Turquoise Ridge14
Q1 2020 Q4 2019 Q1 2019
Production lower than the prior quarter, primarily (61.5%)
due to lower throughput and lower grades Ore tonnes processed (000) 862 934 155
processed at the autoclave Average grade processed
3.35 4.28 17.71
Total cash cost per ounce7 slightly higher than prior (g/t)
quarter mainly due to the impact of lower grade Recovery rate (%) 84% 86% 94%
offset by improved underground mining efficiencies Gold produced (oz 000) 84 111 77
AISC per ounce7 was in line with prior quarter Gold sold (oz 000) 87 99 76
Income ($ millions) 47 56 54
EBITDA ($ millions)9 78 90 60
Turquoise Ridge Third Shaft and Exploration Capital expenditures
19 24 16
($ millions)
Construction of third shaft remains on schedule and
Minesite sustaining 11 18 7
within budget
Project 8 6 9
Continued integration of the legacy Twin Creeks and
Cost of sales ($/oz)6 1,032 971 592
TR geological models generates new targets – to be
Total cash costs ($/oz)7 668 625 506
tested in Q2 2020
All-in sustaining costs ($/oz)7 806 800 592
See the Technical Report on the Turquoise Ridge mine, dated March 25, 2020, and filed on SEDAR at www.sedar.com and EDGAR at www.sec.gov on March 25, 2020Other - Nevada Gold Mines…
Phoenix Phoenix (61.5%)i Q1 2020 Q4 2019
Production 13% higher compared to the prior Gold produced (oz 000) 35 31
quarter, primarily due to higher grade and better Cost of sales ($/oz)6 1,583 2,025
recoveries Total cash costs ($/oz)7 737 902
AISC per ounce7 12% lower All-in sustaining costs ($/oz)7 914 1,034
Long Canyon
Long Canyon (61.5%)i Q1 2020 Q4 2019
Production was lower compared to Q4 2019, primarily
due to leach cycle timing Gold produced (oz 000) 26 34
Despite this, AISC per ounce 7 decreased by 15% Cost of sales ($/oz)6 1,025 1,026
compared to the prior quarter due to lower capitalized Total cash costs ($/oz)7 345 317
stripping All-in sustaining costs ($/oz)7 561 657
iA 61.5% interest in these sites was acquired as a result of the formation of Nevada Gold Mines on July 1, 2019Nevada upside…
Carlin
Goldrush Exploration Declines and Final Feasibility on track
Turquoise Ridge third shaft advances as expected Leeville Complex and surrounding
area is an NGM exploration priority
Fourmile drilling expands mineralization Near mine extension potential at
Rita K, Greater Leeville, 4 Corners
Strong project pipeline along full
Turquoise Ridge/ length of the trend
Twin Creeks
Turquoise Ridge
Twin Creeks
South Arturo N
Newly integrated geology Winnemucca Wells
model identifies high Goldstrike Leeville
potential targets Long Canyon
Battle Elko
TR third shaft advances Lone Tree Mountain Gold Quarry
as expected Emigrant
Phoenix Goldrush / Fourmilei
Cortez
Robertson Goldrush Exploration
Cove/McCoy JV Pipeline Fourmile Declines and Final
Multiple projects exploring
for the next discovery Feasibility on track
Cortez Hills Goldrush
Fourmile drilling continues
*Fourmile is currently a Barrick asset with potential to be added to Nevada Gold Mines if certain targets are met
to expand mineralisation
iFourmile is currently a Barrick asset with potential to be added to Nevada Gold Mines if certain targets are metFourmile…
Expanding high-grade mineralization
High-grade mineralization intersected 150m down dip west of Fourmile
Significant mineralization in step out holes 150m west of Sophia and 135m west of Dorothy
Mineralized system extended another 900m to the north of Dorothy, for a total of +3.0 kilometres
Mineralization remains open in multiple directions
2019 Resource Footprint Barrick NGM
N
Drill intercepts > 5 g/t Au
No significant intercept GOLDRUSH
Sophia best result
20.4m @ 54.1g/t
FOURMILE
Dorothy best results
FM19-12DW1 2.7m @ 180.3g/t &
4.6m @ 9.0g/t 3.7m @ 86.2g/t
Sophia
Dorothy
FM20-151D
FM20-153D FM20-152D 3.4m @ 9.4g/t
Partial Results 1.5m @ 10.0g/t 2.1m @ 22.3g/t
1.2m @ 41.1g/t 1.1m @ 6.6g/t
FM20-154D 0.9m @ 14.2g/t 2019 MI&I Resource
3.2m @ 12.7g/t
In progress 5.8m @ 27.1g/t P&P Reserve
9.9m @ 48.3g/t
500m 3m @ 39.6g/t Drill intercepts >5 g/t Au
1.5m @ 18.4g/t
1.3m @ 29.9g/t No Significant Intercept
See Appendix A for additional details including assay results for the significant interceptsNevada power projects…
TS Power Plant
TS power plant conversion to natural gas
We expect permit approval in Q4 2020
Project allows us to replace the original coal fuel with
cleaner natural gas
Reduction of 650,000 tonnes of CO 2 per year
TS solar project
Initial phase of 100MW (potential to go to 200MW with
battery back-up) Western 102 power plant with its 1MW solar facility
Permitting approvals expected from Q3 2020 through Q1
2021
Reduction of 130,000 tonnes of CO 2 per year (for the
100MW initial phase)Hemlo…
Ontario, Canada
Production 6% higher than the prior quarter due Hemlo (100%) Q1 2020 Q4 2019 Q1 2019
to higher grades from C-Zone underground and Ore tonnes processed (000) 493 795 733
open pit stockpiles Average grade processed (g/t) 3.64 2.28 2.49
Quarter on quarter unit costs lower as a result of Recovery rate (%) 95% 94% 94%
the higher grade and improved recoveries Gold produced (oz 000) 57 54 55
Cost of sales ($/oz) 1,119 1,632 906
Total cash costs ($/oz)7 945 1,091 769
Advancing to Tier 215 Status All-in sustaining costs ($/oz)7 1,281 1,380 915
Moved to underground contract mining model and open pit mining will cease in H2 2020
Exploration and ongoing MRM evaluation of both C-Zone and areas to the west of Hemlo are key opportunities
Drilling to date confirm plunge of C-Zone mineralization and fold structures remain consistent to 500m below
current resources and 1km below existing development
Activities in Q2 2020 will focus on:
1) evaluating the potential of the dormant Golden Giant and David Bell mines
2) assessing district scale exploration potential after years of inactivity
See the Technical Report on the Hemlo Mine, Marathon, Ontario, Canada, dated April 25, 2017, and filed on SEDAR at www.sedar.com and EDGAR at www.sec.gov on April 25, 2017North America…
31Moz Reserves16
70Moz M&I Resources16
11Moz Inferred Resources16
NGM – the largest gold mining complex in the Donlin JV
world delivering 3.5-3.8Moz (100%) over the
next 5+ years Eskay Creek
Hemlo – continues path to Tier 2 status
Donlin JV – provides gold price optionality
Drilling underway to improve orebody Golden Sunlight
knowledge to enhance value
Hemlo
Several framework drilling programs Nevada Gold
underway to fill in gaps and pave the way Mines JV
for targeting and defining mineral
inventories
Refer to Appendix D for assumptions used in our five and ten-year indicative outlookPueblo Viejo…
Dominican Republic
Pueblo Viejo17 (60%) Q1 2020 Q4 2019 Q1 2019
Production lower than the prior quarter due to
lower feed grade in-line with the planned mine Open pit tonnes mined (000) 4,039 5,729 7,070
and processing sequence Average grade processed (g/t) 3.44 4.20 3.75
Lower grade stockpile ore in the feed blend is Ore tonnes processed (000) 1,471 1,464 1,306
forecast to steadily increase until the mine Recovery rate (%) 89% 89% 89%
expansion pits are fully developed as part of the Gold produced (oz 000) 143 179 148
proposed plant and tailings expansion project
Gold sold (oz 000) 144 174 142
Production to be lower in the second quarter due Income ($ millions) 102 125 98
to scheduled major plant maintenance shutdown
EBITDA ($ millions)9 134 159 126
Total cash cost per ounce7 and AISC per ounce7 Capital expenditures
17 14 16
were higher than the prior quarter due to lower ($ millions)
grade, partially offset by lower contractor and fuel Minesite sustaining 17 14 16
costs Cost of sales ($/oz)6 767 660 696
Total cash costs ($/oz)7 502 422 421
All-in sustaining costs ($/oz)7 626 517 543
See the Technical Report on the Pueblo Viejo mine, Sanchez Ramirez Province, Dominican Republic, dated March 19, 2018, and filed on SEDAR at www.sedar.com and EDGAR at www.sec.gov on March 23, 2018Dominican Republic…mine
prepares for upgrade
Quisqueya 1
Process plant expansion engineering and cost estimates
completed
TSF3 feasibility study temporarily delayed due to Covid-19
impacts and postponement of presidential election
Expansion project remains on-track:
The current tailings disposal facilities can operate until 2028
as we mine and process fresh ore under the expanded
process plant scenario
The new TSF is not directly related to the construction
activities of the process plant expansion
Exploration
The conversion of Pueblo Viejo’s Quisqueya 1 power plant to
Agreement with Precipitate Gold to explore on large natural gas has successfully been commissioned. This will cut
property contiguous to Pueblo Viejo mining lease greenhouse gases by 30% and nitrogen oxide by 85%, further
reducing Pueblo Viejo’s impact on the environmentVeladero…
Argentina
Production 6% higher than prior quarter as a result Veladero18 (50%) Q1 2020 Q4 2019 Q1 2019
of higher recoveries Average grade processed (g/t) 0.80 0.88 0.75
Partially offset by a decrease in head grade Ore tonnes processed (000) 3,243 3,880 3,416
and fresh ore stacked on the heap leach pad Gold produced (oz 000) 75 71 70
due to Covid-19 restrictions Gold sold (oz 000) 57 70 68
Operations ramped up after mining declared Income ($ millions) 24 21 10
essential industry - lower production expected EBITDA ($ millions)9 46 50 40
in Q2 2020 Capital expenditures ($ millions) 40 28 40
Reduced export duties to 8% implemented for all Minesite sustaining 25 28 25
doré shipments starting in April 2020 Project 15 0 15
Commissioning of the power line project delayed to Cost of sales ($/oz) 1,182 1,138 1,195
year end Total cash costs ($/oz)7 788 710 713
All-in sustaining costs ($/oz)7 1,266 1,142 1,100
See the Technical Report on the Veladero Mine, San Juan Province, Argentina, dated March 19, 2018, and filed on SEDAR at www.sedar.com and EDGAR at www.sec.gov on March 23, 2018South America…
Veladero and El Indio Belt
Veladero
Chile Argentina Resources added, pits
N
reoptimized and mine plans
updated to extend the LOM
from 2028 to 2031
Los
Veladero
Pascua
Lama
Amarillos
ARGENTINA Mine
Brecha Porfiada
Penélope
Amarillos Camp
Penelope Lama Process
Veladero Fabiana
CHILE
Pascua
Piuquenes Lama
Esperanza
Argenta
Pupa
Coiron
Barrick projects
Pascua Lama – back to basics
Favourable Construct 3D geology model, update
alteration zone resource model, geotech, hydrology
Pits first; update FS to determine optimum
Veladero
Barrick property value path
Sur 10km
Third party propertyLatAm offers exciting prospects
for new discoveries… El Indio Belt
Robust mineral inventory Pascua
Lama
Veladero
22Moz Reserves16 Pueblo Viejo JV
71Moz M&I Resources16
18Moz Inferred Resources16
Ownership of some of the largest
undeveloped growth assets Lagunas Norte
Pascua-Lama Chile Argentina
Pierina
Alturas El Indio
Lagunas PMRi Zaldívar
Norte Abierto
Norte Abierto Pascua-Lama Veladero
Alturas
Alturas – incorporate last season’s
drilling and update PEA to determine Alturas
pathway to value
El Indio Belt target regeneration aided by
new mineralization vectors
iRefractory Sulphide MineralizationPorgera…
Papua New Guinea
Production lower than prior quarter primarily due Porgera19 (47.5%) Q1 2020 Q4 2019 Q1 2019
to lower ore grade mined as planned, resulting in Total tonnes mined (000) 2,809 2,880 2,964
increased costs per ounce Average grade processed (g/t) 2.98 3.94 3.19
Autoclave tonnes processed
(000) 736 705 673
Special Mining Lease Extension Recovery rate (%) 90% 92% 96%
In response to a request from PNG Prime Minister
Gold produced (oz 000) 62 82 66
Marape, Barrick proposed a benefit-sharing
arrangement in 2019 that would deliver more than half Gold sold (oz 000) 63 82 65
the economic benefits from Porgera to PNG Income ($ millions) 29 44 18
stakeholders for 20 years EBITDA ($ millions)9 39 56 29
Barrick believes the government’s decision not to Capital expenditures ($
8 11 8
extend the SML is without due process and in violation millions)
of the government’s legal obligations to BNL Minesite sustaining 8 11 8
Barrick commenced a judicial review of the Cost of sales ($/oz) 1,097 909 1,031
government’s decision and obtained a preliminary order Total cash costs ($/oz)7 941 757 854
of care and maintenance and directing negotiations
All-in sustaining costs ($/oz)7 1,089 894 978
between the partiesLoulo-Gounkoto…
Mali
Production slightly lower than prior quarter mainly Loulo-Gounkoto20 (80%) Q1 2020 Q4 2019 Q1 2019
due to lower feed grade from Yalea underground Total tonnes mined (000) 7,572 7,250 8,779
partially offset by higher throughput and higher Average grade processed (g/t) 4.96 5.64 4.19
recovery Ore tonnes processed (000) 980 886 1,011
Lower production is expected in Q2 2020 in line with Recovery rate (%) 90% 89% 94%
the mine plan
Gold produced (oz 000) 141 144 128
Total cash cost per and AISC per ounce7 ounce7 Gold sold (oz 000) 123 144 128
lower quarter on quarter due to improved cost Income ($ millions) 68 65 29
control EBITDA ($ millions)9 115 123 76
Projects Capital expenditures ($
32 38 18
millions)
Gounkoto UG on track to start development in Q4 2020 Minesite sustaining 32 37 18
20MW Solar power on schedule for H2 2020 and Project 0 1 0
forecast to: Cost of sales ($/oz)6 1,002 1,037 1,052
Reduce operating costs Total cash costs ($/oz)7 614 631 684
Cut carbon emissions by ~27,000 tonnes per year
All-in sustaining costs ($/oz)7 891 917 840
Save 10 million litres of diesel per year
See the Technical Report on the Loulo-Gounkoto Gold Mine Complex, Mali dated September 18, 2018 with an effective date of December 31, 2017, and filed on SEDAR at www.sedar.com and EDGAR at www.sec.gov on January 2, 2019Kibali…
DRC
Production 5% higher than prior quarter due to improved Kibali21 (45%) Q1 2020 Q4 2019 Q1 2019
underground feed grade Total tonnes mined (000) 3,175 3,096 3,162
Throughput and recovery in line with Q4 2019
Average grade processed (g/t) 3.77 3.67 3.89
Total cash cost per ounce7 4% lower than the prior quarter
due to higher grade and lower reagent costs Ore tonnes processed (000) 838 839 840
AISC per ounce 7 increased by 4% compared to prior Recovery rate (%) 89% 88% 89%
quarter due to higher capitalized drilling and underground Gold produced (oz 000) 91 87 93
development
Gold sold (oz 000) 88 89 90
Projects and Exploration Income ($ millions) 48 30 10
Grid stabilizer commissioning: EBITDA ($ millions)9 89 82 66
9MW of battery storage installed Capital expenditures ($ millions) 15 9 10
10% more usage of hydropower in the wet season,
Minesite sustaining 15 9 9
reducing our reliance on diesel
Project 0 0 1
Cut carbon emissions by 8,000 tonnes per year and
reduces diesel consumption by 4.5 million litres per year Cost of sales ($/oz)6 1,045 1,205 1,202
Drilling to test down plunge continuity of the KCD system Total cash costs ($/oz)7 582 608 573
in a 500m step-out hole is underway, All-in sustaining costs ($/oz)7 773 740 673
See the Technical Report on the Kibali Gold Mine, Democratic Republic of the Congo dated September 18, 2018 with an effective date of December 31, 2017, and filed on SEDAR at www.sedar.com and EDGAR at www.sec.gov on January 2, 2019Tongon…
Côte d'Ivoire
Production in line with the prior quarter Tongon (89.7%) Q1 2020 Q4 2019 Q1 2019
Decrease in unit costs primarily driven by lower Total tonnes mined (000) 5,211 5,251 6,009
processing and mining costs Average grade processed (g/t) 2.34 2.56 2.39
Ore tonnes processed (000) 982 899 958
Exploration Recovery (%) 83% 83% 84%
Nielle permit – drill program focuses on Mercator Gold produced (oz 000) 61 61 61
project and northern pit extension Gold sold (oz 000) 58 59 61
Both programs confirm geological continuity of the system down - Cost of sales ($/oz)6 1,368 1,476 1,451
dip and along strike
Total cash costs ($/oz)7 762 803 799
Generative review across the entire permit results in an All-in sustaining costs ($/oz)7 788 867 836
updated structural, geochemical and geological
framework
To date, 11 new targets have been identified
Targets will be validated, ranked and exploration programs will
commence in Q2 2020 with the aim of increasing the resource
inventory to potentially extend Tongon’s mine lifeWest Africa…regional field work identifies a new
prospective NNW corridor
Siliclastic, volcaniclastic and carbonate rocks
Siliclastic and carbonate rocks
Saraya Batholith
Faleme Batholith Complex High K Calc
Loulo:
Alkaline incl Albitites Yalea Ridge rock chip sampling averages 3.65g/t over
Deposits
N Yatela Baboto 550m of strike. Exciting new drill targets emerging
High grade Yalea Transfer Zone extended by 320m. Scout
Sadiola Gara Loulo 3 drilling continues 480m south of the current block model
Yalea Higher grade panel defined at Loulo 2/3 Gap
Gounkoto:
Greenfields RCi drilling on Domain Boundary Structure
Loulo
District
returns intercepts of 6.00m @ 4.12g/t & 8.00m @ 3.35g/t
Gounkoto
Faraba
New high-grade shoot defined at Gounkoto MZ1 North.
Sabodola
Gara Highlights include 17.55m @ 8.75g/t
Yalea Focus Six new sub parallel zones defined at Faraba North
Massawa Tabakoto Areas
Gounkoto including higher grade footwall
Petowal Saraya Kenieba
Bambadji
Bambadji JV:
JV Exciting new kilometric scale auger anomalies emerging.
Kedougou Fekola RC drilling validates source
25km
Diakha New modelling has highlighted new styles of mineralization
Boto
in the west of the permit with significant upside
5km
Fekola
See Appendix B and C for additional details including assay results for the significant intercepts iReverse circulationNorth Mara…
Tanzania
Signing of the Framework Agreement and the 84:16 joint North Mara (84%)22 Q1 2020 Q4 2019 Q1 2019
venture results in a decrease in attributable production Total tonnes mined (000) 2,448 3,529 2,368
Production impacted by lower grades mined and Average grade processed
3.42 4.78 3.00
processed in line with the mine plan (g/t)
Successful transition from underground contractor to Ore tonnes processed (000) 636 714 477
owner-operator along with better cost control measures Recovery rate (%) 93% 94% 92%
delivers improved costs per ounce compared to the prior Gold produced (oz 000) 65 103 42
quarter
Gold sold (oz 000) 70 103 43
Income ($ millions) 49 52 9
Exploration EBITDA ($ millions)9 70 87 22
Capital expenditures ($
Scout drilling planned to explore below Nyabigena pit 13 16 7
millions)
could support a larger pit cut-back
Minesite sustaining 11 15 6
New Gokona geological model indicates potential for
Project 2 1 1
additional target generation
Cost of sales ($/oz)6 959 1,021 1,064
A total of ten conversion, resource extension, and conceptual
near mine targets have been generated along the Gokona Total cash costs ($/oz)7 646 675 755
mineralized trend All-in sustaining costs ($/oz)7 816 830 944Bulyanhulu and Buzwagi…
Tanzania
Bulyanhulu Bulyanhulu (84%)22 Q1 2020 Q4 2019 Q1 2019
Integrated study aimed at optimizing the complete Gold produced (oz 000) 7 9 6
orebody and recapitalizing existing infrastructure Cost of sales ($/oz)6 1,685 1,293 1,008
to resume underground mining operations by year Total cash costs ($/oz)7 686 752 646
end
All-in sustaining costs ($/oz)7 906 909 728
Buzwagi Buzwagi (84%)22 Q1 2020 Q4 2019 Q1 2019
Focus is on optimising throughput and managing
Gold produced (oz 000) 22 28 18
grade from stockpile processing
Cost of sales ($/oz)6 1,373 1,235 1,243
Geological modelling and analysis points to
Total cash costs ($/oz)7 1,275 1,144 1,178
potential additional resource opportunities
All-in sustaining costs ($/oz)7 1,288 1,169 1,204
Exports of Concentrate Stockpiled
Exports of the concentrate stockpile commenced in April 2020 and income to be recognized starting in
Q2 2020
Payment of $100 million representing the first installment of the Settlement Payment to GoT expected
in Q2 2020Central and East Africa…
Congo – Tanzania Craton
Central African
Republic South Sudan Kibali
District scale mapping and modelling reveals new
Kibali target areas
Uganda N
Ngayu Belt Renewed interest in district potential
Robust drill intercepts on multiple satellite and
Kenya
Lake extension programs
Democratic Victoria North Mara
Could provide both open pit and underground
Republic of
Congo Bulyanhulu feed in future
Gold deposits Buzwagi Tanzania
Exploration focus
Full re-log and remodeling of Gokona/Nyabigena
Greenstone Belt
Tanzania deposits identifies multiple open target areas with
Archean Granitoid the potential to grow the resources
Phanerozoic
Proterozoic New partnership with the government of Tanzania
Archean Gneiss opens up opportunities to develop exploration
portfolio in country
500kmAfrica & Middle East…unrivalled
success and deep experience
Reserves: 18Moz16
M&I Resources: 27Moz16
Inferred Resources: 10Moz16 Loulo- Jabal
Gounkoto Sayid
Morila
Tongon
Mali – Senegal structures keep yielding high quality
Kibali
orebody extensions and new kilometric scale North Mara
anomalies Bulyanhulu
Buzwagi
Lumwana
Kibali orebody extensions intersected, and
satellite targets adding to LOM
Uncovering multiple opportunities in Tanzania
Jabal Sayid intersected very high-grade copper
mineralisation extending Lode 4 by at least 125m.
Also targeting Lode 2 extensions. Regional target
generation advances.Copper mines….
Lumwana, Zambia Lumwana (100%) Q1 2020 Q4 2019 Q1 2019
Production 2% higher than the prior quarter as increased feed
Copper produced (lbs million) 64 63 61
grade outweighed lower throughput
Cost of sales ($/lb) 1.94 2.22 2.16
Lower costs quarter-over-quarter were due to improved grade
and lower G&A C1 cash costs ($/lb)8 1.63 2.10 1.67
Costs also benefited from increase in copper sales All-in sustaining costs ($/lb)8 2.26 3.41 2.79
Jabal Sayid, Saudi Arabia (50%) Jabal Sayid (50%) Q1 2020 Q4 2019 Q1 2019
Production 11% higher compared to prior quarter on increased Copper produced (lbs million) 20 18 17
throughput and improved recoveries
Cost of sales ($/lb)6 1.28 1.47 1.55
Concentrate filter expansion project on plan and budget
C1 cash costs ($/lb)8 0.97 1.29 1.10
Extension drilling at Lodes 2 and 4 has progressed with positive
All-in sustaining costs ($/lb)8 1.11 1.78 1.30
outcomes
Zaldívar (50%) Q1 2020 Q4 2019 Q1 2019
Zaldívar, Chile (50%)
Production lower than the prior quarter mainly due to lower Copper produced (lbs million) 31 36 28
grades and recoveries Cost of sales ($/lb)6 2.39 2.59 2.68
Per pound costs improved from the prior quarter due to a C1 cash costs ($/lb)8 1.71 1.95 1.91
favorable exchange rate and lower input costs All-in sustaining costs ($/lb)8 1.99 2.56 2.12Innovation…
New global SAP ERP (Enterprise Resource Planning) System on track
First implementation at NGM commencing in Q3 2020
More agile, less overly-customized tool, focused on getting the right information
Unlock synergies for NGM and lay the groundwork for a solution that will be rolled out to the other regions in 2021
Standardized global design will improve ease of obtaining and reporting real -time efficiency and cost data across the business
Enable faster scaling at new sites as required
Mining
UG Digital transformation progressing with real time monitoring of personnel, equipment productivity and health to increase efficiencies
and reduce downtime via predictive maintenance
Surface Haulage Automation Proof of Concept allowing manned and unmanned operations in the same zone completed
UG Battery Electric equipment - 50 tonne truck and Development Drill
Automated secondary ventilation control through RFID, reducing power consumption
Power Generation
Micro grid stabilization with fast battery response at Kibali
Delivers power as it’s needed to mitigate cyclical power loads such as the shaft winder
Eliminates costly thermal spinning reserve
Processing
Advance Process Control systems on our milling and reagent control
Real-time data feedback is interpreted using Model Predictive Control to achieve rapid
loop tuning to optimize the mill throughput
Similarly, reagent over-addition is reduced with the faster control responseGroup Gold Production…10 year plan
Gold Production (attributable) koz Cost of Sales6, Total Cash Costs7 and
Total Gold Capital Expenditures (attributable) $million AISC7, $/oz
1400
5000
1200
4000
1000
3000 800
600
2000
400
1000
200
0 0
2020 2021 2022 2023 2024 2025 2026 2027 2028 2029
North America Africa and Middle East LATAM and AP ii Porgera 23
Total Capital i, iii Cost of Sales iii AISC iii Total Cash Costs iii
iGold capital expenditures includes project and sustaining capital expenditures across all gold operations but does not include capital expenditure related to the copper operations
iiExcludes iiiCosts per ounce and total capital expenditures are stated prior to any adjustment related to Porgera
Porgera
Refer to Appendix D for assumptions used in our five and ten-year indicative outlook. Barrick is closely monitoring the global Covid-19 pandemic and our guidance may be impacted if the operation or development of our mines and projects is disrupted due to efforts to slow the spread of the virusRelative Share Price Performance…
Relative Share Price Performance since Relative Share Price Performance YTD
merger announcement with Randgold Base = 100
Base = 100
275 150
Barrick 157% Barrick 45%
250 140
130
225
120
200
110
175
100
150
90
125 80 GDX 14%
GDX 77% Spot Gold 12%
100 70
Spot Gold 42%
75 60
21-Sep 21-Mar 21-Sep 21-Mar 01-Jan 01-Feb 01-Mar 01-Apr 01-May
Note: Market data as at May 1, 2020. Share price performance based in USD.
Source: Bloomberg Financial Markets.Endnotes
1. Loss time injury frequency rate (LTIFR) is a ratio calculated as follows: number of loss time injuries x 1,000,000 hours divided by the total number of hours worked.
2. Total reportable incident frequency rate (TRIFR) is a ratio calculated as follows: number of reportable injuries x 1,000,000 hours divided by the total number of hours worked. Reportable injuries include fatalities, lost time
injuries, restricted duty injuries, and medically treated injuries.
3. Class 1 - High Significance is defined as an incident that causes significant negative impacts on human health or the environment or an incident that extends onto publicly accessible land and has the potential to cause
significant adverse impact to surrounding communities, livestock or wildlife.
4. “Free cash flow” is a non-GAAP financial performance measure which deducts capital expenditures from net cash provided by operating activities. Barrick believes this to be a useful indicator of our ability to operate without
reliance on additional borrowing or usage of existing cash. Free cash flow is intended to provide additional information only and does not have any standardized meaning under IFRS and may not be comparable to similar
measures of performance presented by other companies. Free cash flow should not be considered in isolation or as a substitute for measures of performance prepared in accordance with IFRS. For further details on this
non-GAAP measure, please refer to page 80 of the MD&A accompanying Barrick’s first quarter 2020 financial statements filed on SEDAR at www.sedar.com and on EDGAR at www.sec.gov.
5. “Adjusted net earnings” and “adjusted net earnings per share” are non-GAAP financial performance measures. Adjusted net earnings excludes the following from net earnings: certain impairment charges (reversals) related
to intangibles, goodwill, property, plant and equipment, and investments; gains (losses) and other one-time costs relating to acquisitions or dispositions; foreign currency translation gains (losses); significant tax adjustments
not related to current period earnings; unrealized gains (losses) on non-hedge derivative instruments; and the tax effect and non-controlling interest of these items. The Company uses this measure internally to evaluate our
underlying operating performance for the reporting periods presented and to assist with the planning and forecasting of future operating results. Barrick believes that adjusted net earnings is a useful measure of our
performance because these adjusting items do not reflect the underlying operating performance of our core mining business and are not necessarily indicative of future operating results. Adjusted net earnings and adjusted
net earnings per share are intended to provide additional information only and do not have any standardized meaning under IFRS and may not be comparable to similar measures of performance presented by other
companies. They should not be considered in isolation or as a substitute for measures of performance prepared in accordance with IFRS. For further details on these non-GAAP measures, please refer to page 79-80 of the
MD&A accompanying Barrick’s first quarter 2020 financial statements filed on SEDAR at www.sedar.com and on EDGAR at www.sec.gov.
6. Cost of sales applicable to gold per ounce is calculated using cost of sales applicable to gold on an attributable basis (removing the non-controlling interest of 38.5% of Nevada Gold Mines (including 63.1% of South Arturo),
40% Pueblo Viejo, 20% of Loulo-Gounkoto, 10.3% of Tongon, and 16% of North Mara, Bulyanhulu and Buzwagi from cost of sales and including our proportionate share of cost of sales attributable to our equity method
investments in Kibali and Morila), divided by attributable gold ounces sold. Cost of sales applicable to copper per pound is calculated using cost of sales applicable to copper including our proportionate share of cost of sales
attributable to our equity method investments in Zaldívar and Jabal Sayid, divided by consolidated copper pounds sold (including our proportionate share of copper pounds sold from our equity method investments).
7. “Total cash costs” per ounce and “All-in sustaining costs” per ounce are non-GAAP financial performance measures. “Total cash costs” per ounce starts with cost of sales applicable to gold production, but excludes the
impact of depreciation, the non-controlling interest of cost of sales, and includes by-product credits. “All-in sustaining costs” per ounce begin with “Total cash costs” per ounce and add further costs which reflect the additional
costs of operating a mine, primarily sustaining capital expenditures, sustaining leases, general & administrative costs, minesite exploration and evaluation costs, and reclamation cost accretion and amortization. Barrick
believes that the use of “total cash costs” per ounce and “all-in sustaining costs” per ounce will assist investors, analysts and other stakeholders in understanding the costs associated with producing gold, understanding the
economics of gold mining, assessing our operating performance and also our ability to generate free cash flow from current operations and to generate free cash flow on an overall Company basis. “Total cash costs” per
ounce and “All-in sustaining costs” per ounce are intended to provide additional information only and do not have any standardized meaning under IFRS. Although a standardized definition of all-in sustaining costs was
published in 2013 by the World Gold Council (a market development organization for the gold industry comprised of and funded by 25 gold mining companies from around the world, including Barrick), it is not a regulatory
organization, and other companies may calculate this measure differently. Starting from the first quarter of 2019, we have renamed "cash costs" to "total cash costs" when referring to our gold operations. The calculation of
total cash costs is identical to our previous calculation of cash costs with only a change in the naming convention of this non-GAAP measure. These measures should not be considered in isolation or as a substitute for
measures prepared in accordance with IFRS. For further details on these non-GAAP measures, please refer to pages 81-92 of the MD&A accompanying Barrick’s first quarter 2020 financial statements filed on SEDAR at
www.sedar.com and on EDGAR at www.sec.gov.Endnotes
8. “C1 cash costs” per pound and “All-in sustaining costs” per pound are non-GAAP financial performance measures. “C1 cash costs” per pound is based on cost of sales but excludes the impact of depreciation and royalties
and production taxes and includes treatment and refinement charges. “All-in sustaining costs” per pound begins with “C1 cash costs” per pound and adds further costs which reflect the additional costs of operating a mine,
primarily sustaining capital expenditures, general & administrative costs and royalties and production taxes. Barrick believes that the use of “C1 cash costs” per pound and “all-in sustaining costs” per pound will assist
investors, analysts, and other stakeholders in understanding the costs associated with producing copper, understanding the economics of copper mining, assessing our operating performance, and also our ability to generate
free cash flow from current operations and to generate free cash flow on an overall Company basis. “C1 cash costs” per pound and “All-in sustaining costs” per pound are intended to provide additional information only, do
not have any standardized meaning under IFRS, and may not be comparable to similar measures of performance presented by other companies. These measures should not be considered in isolation or as a substitute for
measures of performance prepared in accordance with IFRS. For further details on these non-GAAP measures, please refer to pages 92-93 of the MD&A accompanying Barrick’s first quarter 2020 financial statements filed
on SEDAR at www.sedar.com and on EDGAR at www.sec.gov.
9. EBITDA is a non-GAAP financial measure, which excludes the following from net earnings: income tax expense; finance costs; finance income; and depreciation. Management believes that EBITDA is a valuable indicator of
our ability to generate liquidity by producing operating cash flow to fund working capital needs, service debt obligations, and fund capital expenditures. Management uses EBITDA for this purpose. Adjusted EBITDA removes
the effect of impairment charges; acquisition/disposition gains/losses; foreign currency translation gains/losses; other expense adjustments; unrealized gains on non-hedge derivative instruments; and the impact of the
income tax expense, finance costs, finance income and depreciation incurred in our equity method accounted investments. We believe these items provide a greater level of consistency with the adjusting items included in
our Adjusted Net Earnings reconciliation, with the exception that these amounts are adjusted to remove any impact on finance costs/income, income tax expense and/or depreciation as they do not affect EBITDA. We believe
this additional information will assist analysts, investors and other stakeholders of Barrick in better understanding our ability to generate liquidity from our full business, including equity method investments, by excluding these
amounts from the calculation as they are not indicative of the performance of our core mining business and not necessarily reflective of the underlying operating results for the periods presented. EBITDA and adjusted
EBITDA are intended to provide additional information only and do not have any standardized meaning under IFRS and may not be comparable to similar measures of performance presented by other companies. They
should not be considered in isolation or as a substitute for measures of performance prepared in accordance with IFRS. For further details on these non-GAAP measures, please refer to pages 93-95 of the MD&A
accompanying Barrick’s first quarter 2020 financial statements filed on SEDAR at www.sedar.com and on EDGAR at www.sec.gov.
10. These amounts are presented on the same basis as our guidance and include our 60% share of Pueblo Viejo, 80% share of Loulo-Gounkoto, 89.7% share of Tongon, 45% share of Kibali, 40% share of Morila and 60% share
of South Arturo (36.9% of South Arturo from July 1, 2019 onwards as a result of its contribution to Nevada Gold Mines), our 84% share of Tanzania starting January 1, 2020, the date the GoT's 16% free carried interest was
made effective (63.9% share from January 1, 2019 to September 30, 2019; notwithstanding the completion of the Acacia transaction on September 17, 2019, we consolidated our interest in Acacia and recorded a non-
controlling interest of 36.1% in the income statement for the entirety of the third quarter of 2019 as a matter of convenience, and 100% share from October 1, 2019 to December 31, 2019) and our 50% share of Zaldívar and
Jabal Sayid. Starting July 1, 2019, it also includes our 61.5% share of Nevada Gold Mines.
11. On July 1, 2019, Barrick's Goldstrike and Newmont's Carlin were contributed to Nevada Gold Mines and are now referred to as Carlin. As a result, the amounts presented represent Goldstrike on a 100% basis (including our
60% share of South Arturo) up until June 30, 2019, and the combined results of Carlin and Goldstrike (including NGM's 60% share of South Arturo) on a 61.5% basis thereafter.
12. On July 1, 2019, Cortez was contributed to Nevada Gold Mines, a joint venture with Newmont. As a result, the amounts presented are on an 100% basis up until June 30, 2019, and on a 61.5% basis thereafter.
13. Amounts presented exclude capitalized interest.
14. Barrick owned 75% of Turquoise Ridge through the end of the second quarter of 2019, with our joint venture partner, Newmont, owning the remaining 25%. Turquoise Ridge was proportionately consolidated on the basis that
the joint venture partners that have joint control have rights to the assets and obligations for the liabilities relating to the arrangement. The figures presented in this table are based on our 75% interest in Turquoise Ridge until
June 30, 2019. On July 1, 2019, Barrick's 75% interest in Turquoise Ridge and Newmont's Twin Creeks and 25% interest in Turquoise Ridge were contributed to Nevada Gold Mines. Starting July 1, 2019, the results
represent our 61.5% share of Turquoise Ridge and Twin Creeks, now referred to as Turquoise Ridge.You can also read