Results for Q2 2020 - Barrick Gold Corporation
←
→
Page content transcription
If your browser does not render page correctly, please read the page content below
Results for Q2 2020…
Cautionary Statement on Forward
Looking Information
Certain information contained or incorporated by reference in this presentation, including any information as to our strategy, projects, plans or future financial or operating performance, constitutes “forward-looking statements”. All statements,
other than statements of historical fact, are forward-looking statements. The words “expect”, “target”, “plan”, “project”, “goal”, “continue”, “budget”, “estimate”, “potential”, “may”, “will”, “can”, “could”, “would”, “should” and similar expressions
identify forward-looking statements. In particular, this presentation contains forward-looking statements including, without limitation, with respect to: Barrick’s forward-looking production guidance and estimates of future costs; cash flow
forecasts; projected capital, operating and exploration expenditures; Barrick’s engagement with local communities to manage the Covid-19 pandemic; future investments in community projects and contributions to local economies; Barrick’s
response to the government of Papua New Guinea’s decision not to extend Porgera’s Special Mining Lease; the duration of the temporary suspension of operations at Porgera; our goals with respect to environmental, health and safety
certifications for our operating mines; mine life and production rates; estimated timing for development of projects, including Goldrush, Turquoise Ridge underground third shaft, Gounkoto underground project and Zaldivar Chloride Leach
Project; timing of resumption of mining operations at Bulyanhulu; our pipeline of high confidence projects at or near existing operations; potential for existing or newly acquired and/or developed assets to become Tier One gold assets; potential
extensions to life of mine; potential exploration targets and potential mineralization and metal or mineral recoveries; our ability to convert resources into reserves; our project pipeline and results of our greenfield and brownfield exploration work;
our non-core asset disposition strategy; and expectations regarding future price assumptions, financial performance and other outlook or guidance. Forward-looking statements are necessarily based upon a number of estimates and
assumptions including material estimates and assumptions related to the factors set forth below that, while considered reasonable by the Company as at the date of this presentation in light of management’s experience and perception of
current conditions and expected developments, are inherently subject to significant business, economic and competitive uncertainties and contingencies. Known and unknown factors could cause actual results to differ materially from those
projected in the forward-looking statements and undue reliance should not be placed on such statements and information. Such factors include, but are not limited to: fluctuations in the spot and forward price of gold, copper or certain other
commodities (such as silver, diesel fuel, natural gas and electricity); the speculative nature of mineral exploration and development; changes in mineral production performance, exploitation and exploration successes; risks associated with
projects in the early stages of evaluation and for which additional engineering and other analysis is required; timing of receipt of, or failure to comply with, necessary permits and approvals, including the non-renewal of Porgera’s Special Mining
Lease; the benefits expected from recent transactions being realized, including Nevada Gold Mines; diminishing quantities or grades of reserves; increased costs, delays, suspensions and technical challenges associated with the construction
of capital projects; operating or technical difficulties in connection with mining or development activities, including geotechnical challenges and disruptions in the maintenance or provision of required infrastructure and information technology
systems; failure to comply with environmental and health and safety laws and regulations; uncertainty whether some or all of Barrick's targeted investments and projects will meet the Company’s capital allocation objectives and internal hurdle
rate; the impact of global liquidity and credit availability on the timing of cash flows and the values of assets and liabilities based on projected future cash flows; adverse changes in our credit ratings; the impact of inflation; fluctuations in the
currency markets; changes in U.S. dollar interest rates; risks arising from holding derivative instruments; changes in national and local government legislation, taxation, controls or regulations and/or changes in the administration of laws,
policies and practices, expropriation or nationalization of property and political or economic developments in Canada, the United States and other jurisdictions in which the Company or its affiliates do or may carry on business in the future; lack
of certainty with respect to foreign legal systems, corruption and other factors that are inconsistent with the rule of law; risks associated with illegal and artisanal mining; risks associated with new diseases, epidemics and pandemics, including
the effects and potential effects of the global Covid-19 pandemic; disruption of supply routes which may cause delays in construction and mining activities; damage to the Company’s reputation due to the actual or perceived occurrence of any
number of events, including negative publicity with respect to the Company’s handling of environmental matters or dealings with community groups, whether true or not; the possibility that future exploration results will not be consistent with the
Company’s expectations; risks that exploration data may be incomplete and considerable additional work may be required to complete further evaluation, including but not limited to drilling, engineering and socioeconomic studies and
investment; risk of loss due to acts of war, terrorism, sabotage and civil disturbances; litigation and legal and administrative proceedings; contests over title to properties, particularly title to undeveloped properties, or over access to water,
power and other required infrastructure; business opportunities that may be presented to, or pursued by, the Company; risks associated with the fact that certain of the initiatives described in this presentation are still in the early stages and
may not materialize; our ability to successfully integrate acquisitions or complete divestitures, including our ability to successfully reintegrate Acacia’s operations; risks associated with working with partners in jointly controlled assets; employee
relations including loss of key employees; increased costs and physical risks, including extreme weather events and resource shortages, related to climate change; and availability and increased costs associated with mining inputs and labor.
Barrick also cautions that its 2020 guidance and ten year plan may be impacted by the unprecedented business and social disruption causes by the spread of Covid-19. In addition, there are risks and hazards associated with the business of
mineral exploration, development and mining, including environmental hazards, industrial accidents, unusual or unexpected formations, pressures, cave-ins, flooding and gold bullion, copper cathode or gold or copper concentrate losses (and
the risk of inadequate insurance, or inability to obtain insurance, to cover these risks).

Many of these uncertainties and contingencies can affect our actual results and could cause actual results to differ materially from those expressed or implied in any forward-looking statements made by, or on behalf of, us. Readers are
cautioned that forward-looking statements are not guarantees of future performance. All of the forward-looking statements made in this presentation are qualified by these cautionary statements. Specific reference is made to the most recent
Form 40-F/Annual Information Form on file with the SEC and Canadian provincial securities regulatory authorities for a more detailed discussion of some of the factors underlying forward-looking statements and the risks that may affect
Barrick’s ability to achieve the expectations set forth in the forward-looking statements contained in this presentation. We disclaim any intention or obligation to update or revise any forward-looking statements whether as a result of new
information, future events or otherwise, except as required by applicable law.
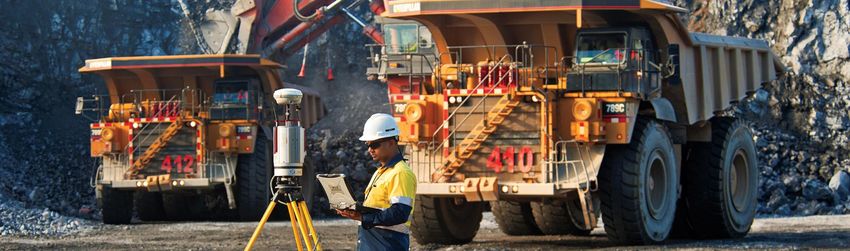
Covid-19…focus on our employees
and communities
 Focus during the Covid-19 outbreak on health and safety of our workforce and communities: proactive
 response, preparedness, prevention and communication
 Engaged with our host authorities, communities and employees as a supportive partner providing
     Medical supplies and equipment for local clinics
     Isolation centres
     Support to communities
          Provision of food parcels and other essentials for vulnerable groups such as the elderly, those with pre-
          existing medical issues, school children and indigenous peoples
          Setting up funds to help drive and support economic recovery for impacted local businesses
     In Latin America – focus on infrastructural and equipment needs
     In Africa – emphasis on improving existing healthcare facilities and capacity
 Financial donations were conditional on government partnership and clear deliverables overseen by
 Barrick management and also included sourcing equipment and supplies
 Over $20 million contributed by the company in support of our host countries and communities in
 Covid-19 infection prevention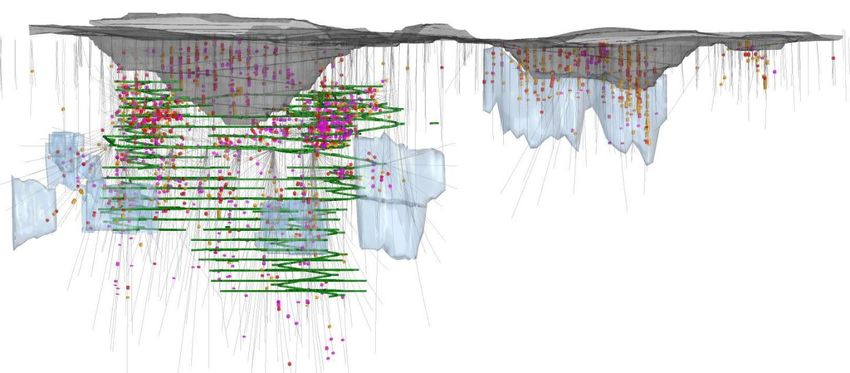
Health & Safety…
                                                   Lost Time Injury Frequency Rate & Total Recordable
                                                                  Injury Frequency Rate
LTIFR1 decreases by 16% quarter on           3.0
                                                          2.75
quarter; Total Recordable Injuries also
decreased from Q1                            2.5
                                                                        2.18          2.23
TRIFR2 1.65 in line with Q1
                                             2.0                                                    1.86
YTD LTIFR of 0.30 and TRIFR of 1.64;                                                                              1.64          1.65
significantly down from the same period in   1.5
2019 (LTIFR of 0.57 and TRIFR of 2.46)
                                             1.0
                                                   0.61
                                                                 0.52                        0.47
                                             0.5                               0.41
                                                                                                           0.32          0.27

                                             0.0
                                                    Q1 19         Q2 19         Q3 19         Q4 19         Q1 20         Q2 20
                                                     LTIFR          TRIFR             Linear (LTIFR)         Linear (TRIFR)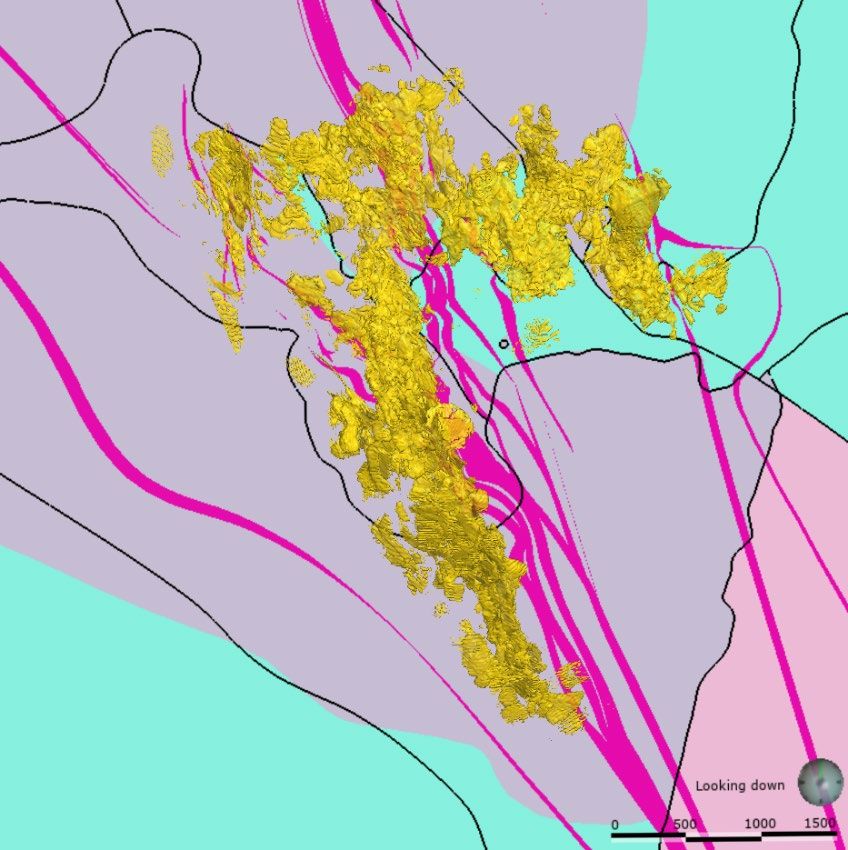
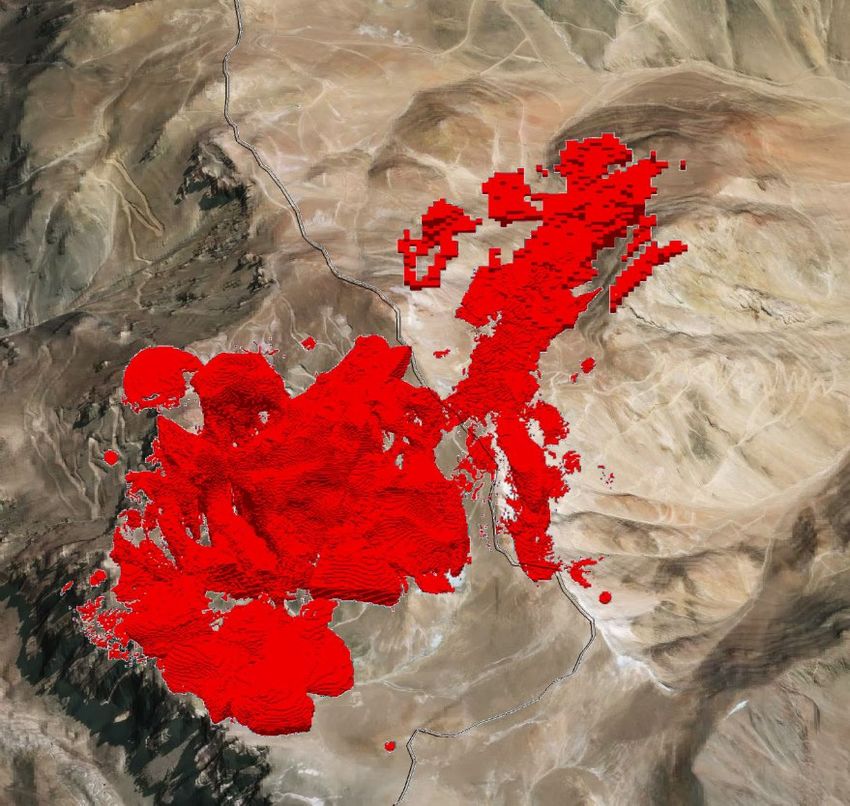
Environment…
Zero Class 1 (high severity)
environmental incidents3
Improvement in water reuse and
recycling rate – 78% in Q2; 77% year to
date
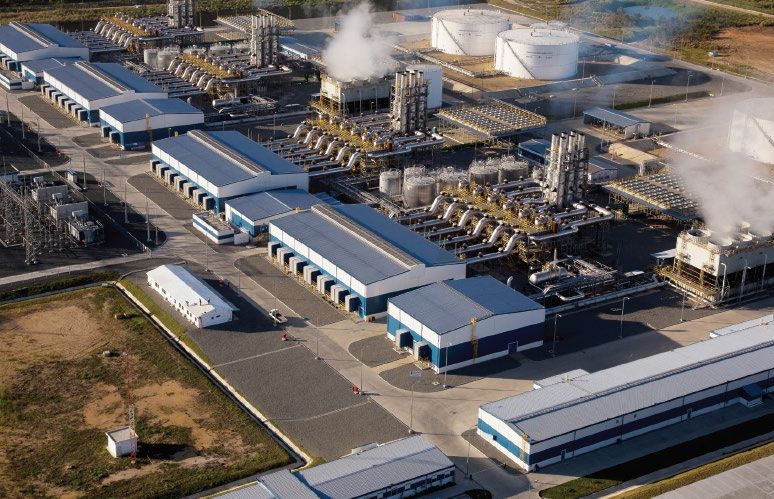
Quisqueya Power Plant,
Reduction in CO2 emissions quarter on Dominican Republic –
quarter – driven by conversion of the natural gas power generation
was fully operational in Q2
Quisqueya Power Plant in the Dominican
Republic from HFO to natural gas and Kibali, DRC – battery power
introduction of battery technology for grid installed for grid stabilisation
stabilisation at Kibali
Barrick on track to achieve its goal of
certifying all operational mines to
ISO 14001:2015 by the end of 2020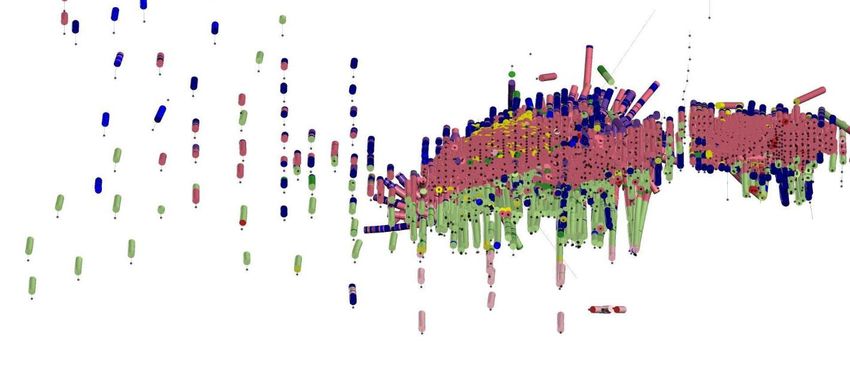
Community…
+$8.8 million YTD community development investment on top
of Covid-19 community related support
Covid-19 related community support > $20 million
Plus $1 billion spent at operational sites on local and national
procurement of goods and services
Western Shoshone Scholarship Foundation –                 Western Shoshone Scholarship Foundation –
2020 graduation reception held during the quarter         2020 Graduation Reception - Nevada

    Total amount of $26 million committed by NGM to the fund
    in support of education of Native American youth creating
    employment opportunities
Reusable face masks issued to employees across Barrick’s
Africa and Middle East operations - proudly sourced from
members within our local communities providing a sustainable
source of income – to date approximately 50,000 reusable
face masks sourced from local community suppliers
                                                             Kakola Village tailor - Tanzania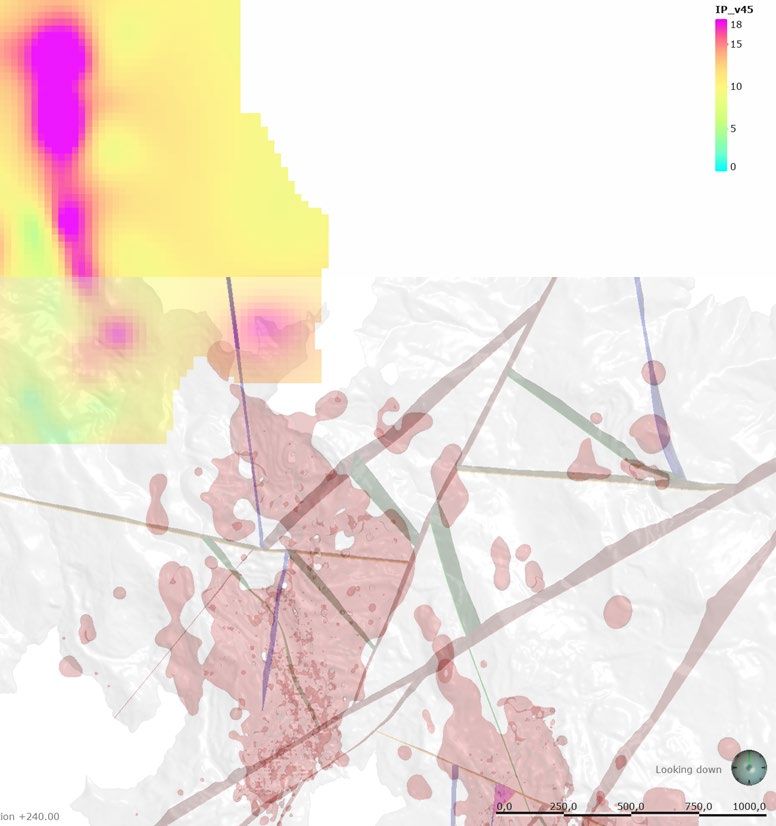
Barrick…Q2 2020 KPIs
Continued solid performance positions Barrick well within annual production guidance, despite Covid-19 challenges
Improvement in safety management following increased focus
Strong cash generation highlights quality of assets and leverage to gold price
Barrick continues to be vigilant in its approach to contain the impact of Covid-19
Higher gold prices also result in higher royalty payments and costs
Strong operating performance for copper with costs per pound at lower end of the guidance range
Operating Cash Flow in excess of $1.0 billion and Free Cash Flow4 greater than $0.5 billion for the quarter
Net debt down almost 25% to $1.4 billion with no significant maturities until 2033
Net earnings per share of 20 cents; adjusted net earnings per share5 up 44% to 23 cents for the quarter
Strong operating performance from Tier One6 assets, with PV production impacted by planned maintenance
shutdown
Veladero production impacted by Argentina's Covid-19 movement and social distancing restrictions
30% of stockpiled concentrate shipped from Tanzania and first $100 million paid to Government
Agreement reached in Mali to extend Loulo convention to 2038
Significant exploration drill results from Nevada, Dominican Republic, Mali and Tanzania
PV expansion, Goldrush development, Turquoise Ridge shaft and other key projects remain on track despite
Covid-19 challenges
Non-core asset disposal strategy delivers $1.5 billion value realisation, including $1.25 billion in cash, with more
to come
Barrick increases quarterly dividend by 14% to $0.08 per share

Group operating results…

              Solid Q2 2020 production despite Covid-19 pandemic
                                                                                                                                           Gold operating results                                      Q2 2020 Q1 2020 Q2 2019
              Group year-to-date production of 2.4Moz at the mid-point                                                                     Production (oz 000)                                                1,149          1,250   1,353
              of guidance of 4.6Moz to 5.0Mozi for the year
                                                                                                                                           Cost of sales ($/oz)7                                              1,075          1,020    964
                        Anchored by strong operating performance from Tier
                        One asset portfolio including NGM, Loulo-Gounkoto                                                                  Total cash costs ($/oz)8                                              716          692     651
                        and Kibali                                                                                                         All-in sustaining costs ($/oz)8                                    1,031           954     869
              H2 2020 gold production expected to be in line with first                                                                    Copper operating results                                    Q2 2020 Q1 2020 Q2 2019
              half of the year
                                                                                                                                           Production (millions of pounds)                                       120          115      97
                        Higher royalty costs due to higher precious metal
                        prices now a common theme across the industry                                                                      Cost of sales ($/lb)7                                                2.08          1.96    2.04

              Copper portfolio continues to outperform                                                                                     C1 cash costs ($/lb)9                                                1.55          1.55    1.59

                        Best quarterly production from Lumwana in several                                                                  All-in sustaining costs ($/lb)9                                      2.15          2.04    2.28
                        years
                        Per pound copper costs trending to low end of
                        guidance

iBarrick   is closely monitoring the global Covid-19 pandemic and Barrick’s guidance may be impacted if the operation or development of our mines and projects is disrupted due to efforts to slow the spread of the virus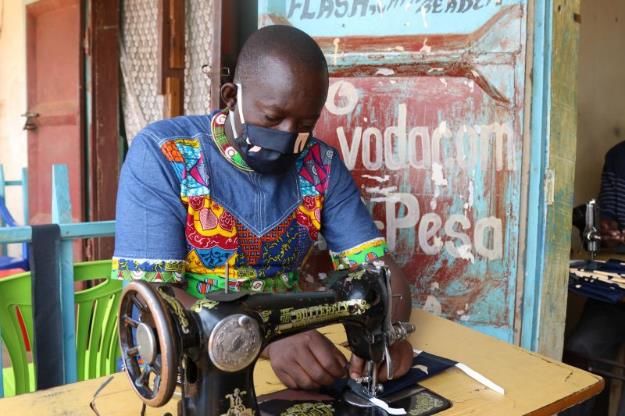
Group financial results…
                                                             Financial Results                      Q2 2020 Q1 2020 Q2 2019

 Free cash flow4 increased by nearly 20% from Q1 to          Revenue ($ million)                      3,055   2,721   2,063
 $522 million in Q2 given diversified and industry-leading   Net earnings ($ million)                  357     400     194
 Tier One asset portfolio                                    Adjusted net earnings ($ million)5        415     285     154
      Captured benefit of higher gold prices through agile                                            1,697   1,466    972
                                                             Adjusted EBITDA10
      management and operational execution
                                                             Net cash provided by operating
 Debt net of cash at $1.4 billion, down almost 25%                                                    1,031    889     434
                                                             activities ($ million)
 from end Q1
                                                             Free cash flow ($ million)4               522     438      55
      No significant public debt maturities until 2033
                                                             Net earnings per share ($)                0.20    0.22    0.11
 Quarterly dividend increased to $0.08 per share
                                                             Adjusted net earnings per share ($)5      0.23    0.16    0.09
      Doubled compared to a $0.04 per share quarterly
      dividend a year ago                                    Total attributable capital
                                                                                                       402     364     361
      A 14% increase on Q1 2020 dividend per share           expenditures ($ million)11
      Dividend underpinned by strong balance sheet and       Cash and equivalents ($ million)         3,743   3,327   2,153
      free cash flow4 outlook based on ten-year guidance     Debt, net of cash ($ million)            1,425   1,852   3,654

                                                             Dividend per share ($)                    0.08    0.07    0.04
Carlin…
     Nevada, USA
                                                                                                                               Carlin12 (61.5%)                  Q2 2020    Q1 2020 Q2 2019
          Lower production compared to Q1 2020 due to scheduled                                                                Total tonnes mined (000)            15,793     17,120   12,138
          plant maintenance at the Goldstrike roaster
                                                                                                                               Average grade processed (g/t)         3.60       3.41     4.26
          Mill 6 completed roaster maintenance in July
                                                                                                                               Ore tonnes processed (000)           2,835      3,229    1,961
          Production also impacted by an increase in higher grade
                                                                                                                               Recovery rate (%)                     80%        71%      71%
          Cortez ore processed by the Carlin roasters, displacing
          lower grade Carlin ore in the feed mix – a synergy                                                                   Gold produced (oz 000)                235        253      181
          captured due to the formation of NGM                                                                                 Gold sold (oz 000)                    234        256      181
          Costs in Q2 reflect lower throughput, plant maintenance                                                              Income ($ millions)                   151        153       33
          and throughput efficiency projects at the Goldstrike roaster                                                         EBITDA ($ millions)10                 195        202       86
                                                                                                                               Capital expenditures ($
                                                                                                                                                                      60         55       54
                                                                                                                               millions)
                                                                                                                                 Minesite sustaining                  60         55       54
                                                                                                                               Cost of sales ($/oz)7                1,037       970     1,116
                                                                                                                               Total cash costs ($/oz)8              850        776      769
                                                                                                                               All-in sustaining costs ($/oz)8      1,130      1,007    1,088

Refer to the Technical Report on the Carlin Complex, dated March 25, 2020, and filed on SEDAR at www.sedar.com and EDGAR at www.sec.gov on March 25, 2020
Carlin trend…growth and discoveryi
Nevada, USA
Best intercept to date at North Leeville 21.3m at 35.3g/t -
geologic model upgraded to support resource evaluation
Bold step out drilling NE of Leeville continues to intersect
Carlin system with gold anomalism and significant alteration
north of Fence (assays pending)
Highest priority target along Post-Gen Fault corridor
successfully tested down plunge of Deep Post, multiple
zones of significant mineralisation and alteration
including 5.2m at 10.9g/t and 3.7m at 9.4g/t (additional
assays pending)
SW of Gold Quarry, framework drilling is answering key
geologic questions and showing down plunge continuation
of the system; gold anomalism associated with strong
decalcification and silicification
Framework drilling in Carlin Basin initiated
At Rain, sub-district scale model highlights new
opportunities; testing priority targets will begin in Q3
iSee Appendix A for additional details including assay results for the significant interceptsCortez…
Nevada, USA
Production improved by 3% from prior quarter and total Cortez13 (61.5%) Q2 2020 Q1 2020 Q2 2019
cash cost per ounce8 on track Total tonnes mined (000) 20,719 22,696 31,598
Higher grades from Crossroads and Pipeline, plus
Average grade processed (g/t) 1.87 1.06 1.82
more Cortez Hills Underground Ore processed
through oxide mill Ore tonnes processed (000) 2,381 4,783 5,014
Cortez Hills Underground productivity continues to Recovery rate (%) 84% 84% 84%
outperform due to ongoing efficiency and availability Gold produced (oz 000) 132 128 280
initiatives
Gold sold (oz 000) 132 128 281
Improvements on the CIL tanks and ore
Income ($ millions) 109 89 158
characterization have boosted oxide mill recoveries
EBITDA ($ millions)10 144 122 223
Goldrush Capital expenditures ($
52 50 83
Construction of twin exploration declines ahead of millions)14
schedule Minesite sustaining14 42 46 15
Transition from contract to owner mining brought forward Project14 10 4 68
to Q4 2020 – six months earlier than planned Cost of sales ($/oz)7 870 876 719
Scheduled to intersect first ore in first half of 2021 Total cash costs ($/oz)8 613 614 489
Permitting timeline for a Record of Decision in Q4 2021
All-in sustaining costs ($/oz)8 950 1,009 561
is unchanged
Refer to the Technical Report on the Cortez Joint Venture Operations, dated March 22, 2019, and filed on SEDAR at www.sedar.com and EDGAR at www.sec.gov on March 22, 2019Cortez Hills Underground (CHUG) Upside…
Hanson Footwall Target
A A’
Lithology 3900’ CHUG – Overview Map
Au g/t
A’ Au g/t
171.4
34.28
17.14
6.86
3.43
1.71
29.6m at 8.64g/ti 0.68
0.34
0.17
0.03
0
12.8m at 7.95g/ti
18.6m at 4.94g/ti
A
300m
Significant upside identified at CHUG
Tertiary Quartz Porphyry Current Reserves and Resource base15:
Devonian Wenban P&P: 3.9Moz at 10.03g/t
Silurian Roberts Mountain M&I: 4.7Moz at 8.85g/t (inclusive of P&P)
Ordovician Hanson Creek Inferred: 0.3Moz at 8.33g/t
Fault
N Drilling the Hanson Footwall – first upside target – confirmed
3.43 g/t (0.1 opt) grade shell
mineralisation ~100m below existing R&R
Upside Potential 1km
m m
Test targets to expand R&R and extend asset life of mine
iSee Appendix B for additional details including assay results for the significant interceptsFourmile…expanding high grade
mineralisationi
Nevada, USA FM20-154D
1.4 m @ 14.6 g/t 2019 Resource Footprint
N
9.4 m @ 17.9 g/t Exploration Upside
1.5 m @ 24.0 g/t Dorothy Drill intercepts > 5g/t Au
Significant mineralisation intersected west of Dorothy;
0.9 m @ 16.0 g/t No significant intercept
strong alteration intersected to the south
FM20-161D
Significant mineralisation in step-out holes west and 1.5 m @ 30.3 g/t FM20-169D
southwest of Sophia; strong alteration intersected in another 2.4 m @ 15.1 g/t6 9.1m, 2.0m, & 10.0m of
hole to the northwest 2.9 m @ 13.1 g/t significant alteration
3.2 m @ 10.5 g/t (assays pending)
Two holes between Fourmile and Goldrush intersected
Sophia
strong mineralisation and alteration at favourable FM20-153D
1.2 m @ 41.1 g/t
stratigraphic contact 3.2 m @ 12.7 g/t
Infill drilling program to de-risk Fourmile inferred resource 9.9 m @ 48.4 g/t Blanche
1.5 m @ 18.4 g/t
confirmed tenor; variability consistent with inferred 4.7 m @ 41.5 g/t Fourmile
classification FM20-170D
FM20-158D 20.4m of significant
Refinement of Fourmile ore controls and geologic model 8.4 m @ 21.5 g/t Rose alteration (assays
continues to yield strong results from target testing; footprint 0.9 m @ 10.6 g/t pending)
continues to grow Barrick
FM20-160D
Extracting maximum value from every drill hole to support 5.2 m @ 10.6 g/t
NGM
1.5 m @ 5.6 g/t
project design and execution Goldrush
3.9 m @ 7.3 g/t
400m
iSee Appendix C for additional details including assay results for the significant interceptsTurquoise Ridge…
Nevada, USA
Production and total cash costs per ounce8 impacted by Turquoise Ridge16 (61.5%) Q2 2020 Q1 2020 Q2 2019
lower head grade and recoveries for the autoclave versus
Ore tonnes processed (000) 821 862 -
the prior quarter, partially offset by higher grades for the
oxide mill but at lower throughput Average grade processed (g/t) 3.61 3.35 -
AISC per ounce8 slightly higher – up 3% from Q1 Overall recovery rate (%) 82% 84% 91%
Gold produced (oz 000) 79 84 65
TR Underground Third Shaft Gold sold (oz 000) 79 87 85
Construction of the third shaft remains on schedule and Income ($ millions) 48 47 53
within budget
EBITDA ($ millions)10 73 78 62
Shaft liner advanced to a depth of 509m below the collar
Capital expenditures
Commissioning expected in late 2022 9 19 19
($ millions)
Minesite sustaining 3 11 7
Exploration
Project 6 8 12
MRM and exploration teams continue to integrate the
geological models between Turquoise Ridge UG and Vista Cost of sales ($/oz)7 1,073 1,032 665
and Mega pits on the legacy Twin Creeks property Total cash costs ($/oz)8 753 668 569
Still more work required to deliver comprehensive All-in sustaining costs ($/oz)8 829 806 667
integrated orebody and grade control models
Refer to the Technical Report on the Turquoise Ridge mine, dated March 25, 2020, and filed on SEDAR at www.sedar.com and EDGAR at www.sec.gov on March 25, 2020Other Nevada Gold Mines…
Phoenix Phoenix (61.5%) Q2 2020 Q1 2020
Consistent performance with production in line compared to
Gold produced (oz 000) 35 35
the prior quarter at lower total cash cost per ounce8
Cost of sales ($/oz)7 1,726 1,583
AISC per ounce8 5% higher due to increased capitalised
stripping, in line with mine sequencing Total cash costs ($/oz)8 725 737
All-in sustaining costs ($/oz)8 957 914
Long Canyon Long Canyon (61.5%) Q2 2020 Q1 2020
Production 54% higher than prior quarter due to a focus on Gold produced (oz 000) 40 26
pad inventory reduction as mining and stacking moves Cost of sales ($/oz)7 1,009 1,025
towards main part of the Cut 7 orebody
Total cash costs ($/oz)8 308 345
Together with a decrease in capitalised stripping in Cut 7,
All-in sustaining costs ($/oz)8 430 561
AISC per ounce8 fell by 23% compared to the prior quarterHemlo…
Ontario, Canada
Production slightly lower than prior quarter due to lower
Hemlo (100%) Q2 2020 Q1 2020 Q2 2019
throughput, partially offset by higher grades from the
underground C-Zone Ore tonnes processed (000) 472 493 779
Average grade processed (g/t) 3.89 3.64 2.38
2020 Outlook Recovery rate (%) 96% 95% 94%
Production remains on track to achieve guidance Gold produced (oz 000) 54 57 55
Costs higher as a result of –
Cost of sales ($/oz) 1,268 1,119 953
Increase in royalty expense from higher gold prices and
mining in underground zones that incur a higher NPI Total cash costs ($/oz)8 1,080 945 822
royalty burden All-in sustaining costs ($/oz)8 1,456 1,281 1,015
Temporary delay in new underground contractor arriving
at site due to movement restrictions in response to
Covid-19, resulting in increased proportion of higher
cost stockpiled material being processed
New underground contractor started mobilising to site at
end of Q2 2020, with ramp-up of underground
development now underway
Refer to the Technical Report on the Hemlo Mine, Marathon, Ontario, Canada, dated April 25, 2017, and filed on SEDAR at www.sedar.com and EDGAR at www.sec.gov on April 25, 2017Hemlo deposit…growth upside
Golden Giant David Bell
3 Williams
1
2
4 N
5 B ZONE
6
1000m
MINE ZONES [Series] Western Discovery potential for new orebodies
(Blackfly) [100 & 300 series]
1. B ZONE [MAIN] Recent field evidence of plunging zones
Moose Lake Porphyry [300-series] 2. B ZONE [FW] Western extension of known orebodies [100 & 300
series] in C Zone
Volcaniclastics [100-series] 3. C ZONE [100]
Focus of significant future drill targeting
WOC/GG/DB headframes 4. BLACKFLY [100] Down-plunge extension of C Zone
Williams open pit extents 5. C ZONE [300] Recently confirmed by ultra-deep drilling
Down-plunge extension of B Zone [FW]
Further western extension potential 6. SOUTH RIM [FW]
Future deep drill-testingPueblo Viejo…
Dominican Republic
Pueblo Viejo17 (60%) Q2 2020 Q1 2020 Q2 2019
As expected, production 22% lower than the prior quarter Open pit tonnes mined (000) 4,647 4,039 6,116
due to a total plant maintenance shutdown Average grade processed (g/t) 3.45 3.44 3.56
Production expected to be higher in H2 2020 with Ore tonnes processed (000) 1,088 1,471 1,212
major scheduled maintenance shutdowns now Recovery rate (%) 89% 89% 90%
complete for the year
Gold produced (oz 000) 111 143 124
Together with higher royalties from higher gold prices, total
Gold sold (oz 000) 115 144 132
cash cost per ounce8 and AISC per ounce8 increased from
prior quarter due to lower throughput from planned Income ($ millions) 92 102 75
shutdown – partially offset by lower energy costs EBITDA ($ millions)10 125 134 104
Commenced early works expenditures for proposed plant Capital expenditures
21 17 18
and tailings expansion ($ millions)
Minesite sustaining 15 17 18
Project 6 - -
Cost of sales ($/oz)7 935 767 852
Total cash costs ($/oz)8 579 502 557
All-in sustaining costs ($/oz)8 720 626 702
Refer to the Technical Report on the Pueblo Viejo mine, Sanchez Ramirez Province, Dominican Republic, dated March 19, 2018, and filed on SEDAR at www.sedar.com and EDGAR at www.sec.gov on March 23, 2018Pueblo Viejo expansion… Dominican Republic Plant expansion project environmental impact study submitted to authorities – no issues identified in subsequent field visit Engineering of process plant facilities progressed to plan during Q2 and orders placed for critical long lead items – including an LOI for the oxygen plant which is on the critical path for the plant expansion schedule Field work for baseline environmental assessment of additional tailings capacity commenced. Discussions continue with national authorities to obtain the necessary tenure and permitting Implementation strategy for the expansion project is focused on utilising local Dominican businesses – targeting over $100 million contribution to the local construction industry by the end of 2022 Agribusiness project team engaged with stakeholders and will now commence pilot projects with local cocoa farmers
Pueblo Viejo JV…new targets
                                                                                                                                      Foundational geology (structural framework) with state-of-the-art
                                                                                                    N
                                                                                                                                      geophysics unveils new targets in proximity to a significant orebodyi
                                                                                                                                      Anomaly analogous to known deposits (scale, tenor and orientation)
                         DPV20778                           Arroyo El Rey
                                                                target
                                                                                                                                      Initial drilling intersected zones of sulphides
                          Arroyo
                          Hondo                                                                                                       Two holes drilled with evidence of sulphides and potential
                                                                                                                                      mineralisation
                                                                                                                                      Geophysics to be expanded along structural intersections and
                                                      Growth                                                                          projected into new Pueblo Grande JV property
                                                        Pit
      275 RL
                                                                                                                                                     Arroyo                               DPV20778
                                                                                                                                                     Hondo
                                                                                                                              Favourable alteration
                                       Monte                                                                                  and sulphides
                                       Negro                                                                                  intersected but low
                                                                                          Mejita
                                                                                           NE                                 grade so far
       Au contours
           0.72g/t
           Structural
           Framework
                                                                           Moore
           Inferred Faults

iAs   at December 31, 2019, orebody estimated to contain 25Moz of measured and indicated resources and 3.7Moz of inferred resources with 7.9Moz historical contained ounces processed. Refer to endnote 24 for further details.
Veladero…
Argentina
As previously reported, production and costs at Veladero Veladero18 (50%) Q2 2020 Q1 2020 Q2 2019
in Q2 2020 were impacted by: Average grade processed (g/t) 0.93 0.80 0.75
A mandatory nationwide quarantine Ore tonnes processed (000) 2,609 3,243 2,828
Followed by movement and social distancing Gold produced (oz 000) 49 75 75
restrictions that limited remobilisation back to site 35 57 74
Gold sold (oz 000)
Further impacted by severe winter weather that Income ($ millions) 16 24 12
impacted both mining and processing operations
EBITDA ($ millions)10 29 46 43
2020 Outlook Capital expenditures ($ millions) 20 40 19
Demobilisation of contractors working on capital projects in Minesite sustaining 20 25 19
accordance with government’s pandemic response Project - 15 -
delayed construction and commissioning of leach pad
Cost of sales ($/oz) 1,228 1,182 1,186
phases
Total cash costs ($/oz)8 801 788 746
Production at Veladero currently trending below guidance
for 2020 at slightly higher per ounce costs All-in sustaining costs ($/oz)8 1,383 1,266 1,046
Refer to the Technical Report on the Veladero Mine, San Juan Province, Argentina, dated March 19, 2018, and filed on SEDAR at www.sedar.com and EDGAR at www.sec.gov on March 23, 2018Veladero…next steps
Argentina
Due to the Covid-19 pandemic in Q2, the Argentinian government limited personnel on site which impacted mining
and project activities. Proposed easing of restrictions in September will allow remobilisation of contractors and
personnel
Mining
Open pit operations stopped for 17 days and were at 30% capacity for a further 23 days. Pit has since
operated at 85% capacity due to personnel restrictions on site contributing to a 10Mt waste stripping deficit in
2020
Equipment orders brought forward to catch up on stripping deficit and phase designs being optimised to
reduce impact of waste stripping. Recommissioning of ore conveyor also under review
Leach Pad Expansions
Phase 6 pad construction works stopped at start of pandemic causing 6 month construction delay due to
winter season. Additional resources to be mobilised at end of the winter season to accelerate construction
works
Phase 4B/5B upgrade program continued throughout winter season and inspections of liner and collection
system in progress
Other Capital Projects
New Veladero airstrip to be completed by end of 2020
Construction of powerline from Chile to recommence dependent on easing of current government restrictionsAlturas - Del Carmen…exploration
drives update of project economics
Argentina
Alturas - Del Carmen District Exploration upside of the district now in a range from
N 352.0 to 374.5 Mt at 1.07 to 1.08 g/t Auii
Outcropping ore in Rojo Grande could provide early
71m at 1.56g/t from 152mi
ore feed
28m at 3.38g/t from 211mi
Rojo Grande
Including 17m at 5.20g/t Exploration upside Updated mineral estimation and pit optimisation in
63.5 to 77.0 Mt at
0.6g/t to 0.9 g/t Auii
progress
Update of scoping level economics scheduled for Q4
Project team engaged and full development timeline
Alturas established with near term strategic filters defined
Inferred Resource C° Amarillo
8.9Moz at 1.1g/t Auiii Exploration upside Structural framework study initiated to establish
15.0 to 18.5Mt at controls to high grade mineralisation
1.75g/t to 2.2g/t Auii
>0.50 Au ppm Block Model
Chile Argentina
Ladera
Exploration upside
iSee Appendix D for additional details including assay results for the significant intercepts
22.0 to 27.0Mt at iiPotentialquantities and grades in these preliminary results are conceptual in nature and there has been insufficient exploration to
1.2g/t to 1.5g/t Auii 1km define a mineral resource at this time and it is uncertain that further exploration will result in the target being delineated as a mineral
resource. Exploration upside has not been optimised in a pit design
iiiBased on a 2018 optimised pit. See endnote 19Porgera…
Papua New Guinea
As previously disclosed, Porgera entered care and Porgera20 (47.5%) Q2 2020 Q1 2020 Q2 2019
maintenance on April 25 654 2,809 3,655
Total tonnes mined (000)
Due to the uncertainty related to the timing and scope
Average grade processed (g/t) 3.16 2.98 3.25
of future developments at Porgera, 2020 guidance for
Ore tonnes processed (000) 200 736 557
this site has been withdrawn
Recovery rate (%) 91% 90% 90%
Special Mining Lease Extension Gold produced (oz 000) 24 62 61
In response to a request from PNG Prime Minister Gold sold (oz 000) 24 63 63
Marape, Barrick proposed a benefit-sharing Income ($ millions) (13) 29 16
arrangement in 2019 that would deliver more than half EBITDA ($ millions)10 (7) 39 24
the economic benefits from Porgera to PNG Capital expenditures ($
stakeholders for 20 years 2 8 12
millions)
Barrick believes the government’s decision not to Minesite sustaining 2 8 12
extend the SML is without due process and in violation Cost of sales ($/oz) 1,141 1,097 1,032
of the government’s legal obligations to BNL
Total cash costs ($/oz)8 875 941 893
All-in sustaining costs ($/oz)8 1,046 1,089 1,112Loulo-Gounkoto…
Mali
Production in line with prior quarter as lower feed grade and Loulo-Gounkoto21 (80%) Q2 2020 Q1 2020 Q2 2019
throughput was offset by higher recovery Total tonnes mined (000) 8,736 7,572 8,048
Total cash cost per ounce8 slightly higher from Q1 due to Average grade processed (g/t) 4.92 4.96 4.74
increased royalties as a result of higher gold prices and Ore tonnes processed (000) 972 980 1,034
marginally higher operating costs Recovery rate (%) 92% 90% 93%
AISC per ounce8
increased by 16% versus prior quarter due Gold produced (oz 000) 141 141 147
to increased capitalised stripping at the Gounkoto open-pit,
Gold sold (oz 000) 157 123 148
in-line with plan
Income ($ millions) 107 68 32
EBITDA ($ millions)10 167 115 102
Projects and Exploration Capital expenditures ($
55 32 31
millions)
Gounkoto underground remains on track to start
Minesite sustaining 55 32 29
development in Q4 2020
Project - - 2
Potential minelife extensions continue to be confirmed in
Cost of sales ($/oz)7 1,012 1,002 1,072
Q2. Drilling at the Yalea Transfer Zone extended
mineralisation by an additional 160m and is currently Total cash costs ($/oz)8 639 614 598
480m south of the extent of the 2019 block model All-in sustaining costs ($/oz)8 1,030 891 811
Refer to the Technical Report on the Loulo-Gounkoto Gold Mine Complex, Mali dated September 18, 2018 with an effective date of December 31, 2017, and filed on SEDAR at www.sedar.com and EDGAR at www.sec.gov on January 2, 2019Loulo District…strong drill results to drive
mine life extensionsi
Loulo:
Baboto Loulo 3 new intersections confirmed high grade
mineralisation is still open down plunge. Footwall intercepts
N Yatela Gara Loulo 3 include 19.25m at 6.06g/t and 6.85m at 5.81g/t
Sadiola Yalea High-grade Yalea transfer zone extended 480m beyond
2019 block model and still open down plunge. Significant
intercepts include 14.95m at 7.34g/t and 8.70m at 22g/t
Senegal Structural thickening at base of Yalea Transfer Zone
supports wider intercepts including 66.0m at 4.83g/t,
Gounkoto 28.0m at 4.10g/t, 25.4m at 4.61g/t, 17.8m at 3.22g/t and
Loulo
District
Faraba 17.4m at 15.68g/t – further enhancing significant resource
Sabodola potential
Tabakoto
Gara Gounkoto:
Yalea
Massawa Mali >1 km long mineralised trend confirmed south of
Gounkoto Gounkoto open pit. Significant results include
Petowal Saraya Kenieba 9m at 3.42g/t and 7m at 7.23g/t
Bambadji JV Bambadji:
Second phase of auger drilling extends Kora-Latifa
Kedougou Fekola
Diakha prospective corridor over 11km. New diamond drilling
25km Boto confirms significance of Gefa mineralised system. Follow
5km
Fekola up drilling in Faleme volcanics highlights positive results
Strong results from prefeasibility studyii at Sabodala-
Focus Areas Massawa complex
iSee iiThe website link to the Teranga press release titled “Teranga Gold Announces Positive Pre-Feasibility Study Results for Top-Tier Sabodala-Massawa Gold Complex” can be found here
Appendix E for additional details including assay results for the significant interceptsTongon…
Côte d'Ivoire
Production 5% higher than the prior quarter due to
Tongon (89.7%) Q2 2020 Q1 2020 Q2 2019
stronger throughput
Per ounce costs improved from Q1 driven by lower Ore tonnes processed (000) 1,013 982 945
processing and mining costs Average grade processed (g/t) 2.34 2.34 2.31
Recovery rate (%) 83% 83% 85%
Delivering Mine Life Extension Gold produced (oz 000) 64 61 61
At Mercator, a revised geological model optimised that Cost of sales ($/oz)7 1,275 1,368 1,562
resulting in higher grades at similar metal content
Total cash costs ($/oz)8 688 762 750
Conceptual economic analysis with final pit designs
underway for this satellite deposit located 15km All-in sustaining costs ($/oz)8 745 788 802
from the Tongon plant
Exploration during Q2 focused on several priority targets
located on three major structures
Follow-up drilling will continue in Q3, including the
evaluation of four targets along the western flank of
the Badenou trendNielle…exploring new corridors for
opportunities to extend LoM
Côte d'Ivoire
Djinni PFS and EISA underway
N SZ and NZ cut back evaluations underway
Stabilo Trend
Tongon West (2) Seydou N-Jubula Stabilo Trend:
Satellite (6) Koro
Sekala Seydou N – Jubula, 5.1km structure beneath
2019 Probable Mineral Reserve:
510kt at 1.85g/t for 30.5koz
Seydou S. ferricrete plateau tested with Auger program for
2019 Probable Mineral follow up in Q3
Reserve:
Djinni 408kt at 1.95g/t for 26koz Moyet Trend:
2019 Indicated Resource:
1.9Mt at 2.30g/t for 139koz North Zone Pit First phase Scout RC at Tiebila East evaluated
2019 Inferred Resource: target prospectivity, alteration system open along
South Zone Pit
1.2Mt at 2.41g/t for 94koz strike supporting prospectivity of the trend
Mercator
Tekono Trend
(2) Soumo Tekono Trend: AC drilling in progress at Soumo
Satellite (6) Rokubo target, 3.6km strike opportunity, 5km from plant
Badenou Trend Badenou Trend:
(10) Kanon
(9) Zulu area Moyet Trend Mercator: Added drilling and updated model
(11) Kamino N
(12) Sougo
(4) Tiebila
(7) Loko drives increase in potential for mineral resource
(5) Rhodia
(8) Mira
definition
Known Deposits 4 targets: Zulu West, Kanon, Zulu main and
Active/historic targets
Kamino North prioritised. Follow up AC drilling
Early stage (map + litho)
10km started to evaluate targets
Q1 generated targets parkedKibali…
DRC
Kibali22 (45%) Q2 2020 Q1 2020 Q2 2019
Kibali continued to deliver consistent results, with Total tonnes mined (000) 3,253 3,175 2,938
production in-line versus Q1 3.68 3.77 3.88
Average grade processed (g/t)
Total cash cost per ounce8 was 6% higher than the prior
Ore tonnes processed (000) 857 838 850
quarter due to increased labour and logistic charges as
well as higher royalties from higher gold prices Recovery rate (%) 89% 89% 89%
Despite this, AISC per ounce8 was 4% lower than Q1 Gold produced (oz 000) 90 91 95
due to decrease in underground development Gold sold (oz 000) 96 88 95
Income ($ millions) 64 48 43
EBITDA ($ millions)10 106 89 74
Capital expenditures ($ millions) 10 15 10
Minesite sustaining 9 15 10
Project 1 - -
Cost of sales ($/oz)7 1,067 1,045 868
Total cash costs ($/oz)8 617 582 540
All-in sustaining costs ($/oz)8 739 773 651
Refer to the Technical Report on the Kibali Gold Mine, Democratic Republic of the Congo dated September 18, 2018 with an effective date of December 31, 2017, and filed on SEDAR at www.sedar.com and EDGAR at www.sec.gov on January 2, 2019North Mara…
Tanzania
North Mara (84%)23 Q2 2020 Q1 2020 Q2 2019
Gold production in Q2 5% higher than prior quarter primarily Total tonnes mined (000) 766 2,448 2,709
due to higher processed grade as open pit mining ceased Average grade processed
3.75 3.42 5.37
during the quarter and mill feed was mainly sourced from (g/t)
higher grade underground zones at Gokona Ore tonnes processed (000) 611 636 467
Total cash cost per ounce8 was 12% higher than Q1 due to Recovery rate (%) 93% 93% 94%
higher direct mining costs from transition to underground
Gold produced (oz 000) 68 65 76
mining
Gold sold (oz 000) 67 70 66
We continue to evaluate sequencing at North Mara and expect
to update the mineplan in due course for an optimised restart Income ($ millions) 44 49 31
of open pit mining EBITDA ($ millions)10 65 70 47
Capital expenditures in Q2 were significantly higher than Q1 Capital expenditures ($
30 13 10
due to our investment in the tailings storage facility, other millions)
water management initiatives and land acquisitions Minesite sustaining 29 11 7
We expect this capital investment to reduce over time as Project 1 2 3
legacy issues in Tanzania are addressed Cost of sales ($/oz)7 1,040 959 800
Total cash costs ($/oz)8 724 646 539
All-in sustaining costs ($/oz)8 1,166 816 675North Mara…Gokona targets
Extensive upside potential, open in all directionsi
West
+2.8km East
GOKONA UG GENA OP
Open Open
KOFIA
Drill Drill
Gap Gap
Shoot
Upper East
Extn. Potential Phase 1 Shoot Phase 2
Reserve Au g/t
Replacement
2.5-5
Deep Gena Conversion Area 5-10
Open Central Potential resource extn. >10
UGKD674 UGKD664 Open
UGKD666: UGKD688: 19.7m @ 37.51g/t UGKD665
6m @ 4.82g/t Priority Targets
6m @ 2.65g/t 7m @ 2.66g/t No sig intercept
UGKD672: 6m @ 30.43g/t UGKD679 Mid 2020 conversion
No sig. intercept UGKD690: Lower West Deep 17m @ 3.44g/t Q2 conversion drilling EOY 2020 conversion
6m @ 3.40g/t Potential Reserve Deep
East UGKD680 Scout drilling
UGKD681: Scout drilling in Q3
6m @ 8.03g/t 7m @ 3.50g/t Extension Centr 5.8m @ 4.01g/t
7m @ 2.50g/t 6.08m @ 7.57g/t al
7m @ 4.38g/t UGKD687: UGKD648 UGKD697 Current targets have capacity to replace 2020 and 2021 depletion
9m @ 11.35g/t UGKD692 No sig intercept 17m @ 18.94g/t
UGKD682:
5m @ 2.35g/t In Q2, re-logging extended geological model 900m along strike,
9m @ 3.62g/t 5.6m @ 3.81g/t UGKD655 7m @ 4.15g/t
9m @ 4.58g/t 5.4m @ 3.74g/t covering Gena
UGKD671: UGKD695
5m @ 3.64g/t UGKD693 8m @ 6.52g/t Scout exploration drilling to test potential for extra resources
6m @ 3.02g/t 6m @ 2.96/t UGKD694A 11m @ 4.03g/t Gena conversion drilling aims to inform a larger pit cutback decision
6m @ 6.83g/t 5m @ 3.43g/t 5.5m @ 22.57g/t 6m @ 2.40g/t end of year 2020
iSee Appendix F for additional details including assay results for the significant interceptsNorth Mara…Kofia target
Potential extension opportunity
Upper Westi
UGKD688 UGKD687
Initial scout drilling aims to extend 7m @ 2.66g/t 9m @ 11.35g/t
Gokona system 500m west of current 6m @ 30.43g/t 5.6m @ 3.81g/t
block model UGKD690 UGKD671
6m @ 3.40g/t 5m @ 3.64g/t
Previous drilling 300m east of Kofia 7m @ 3.50g/t 6m @ 3.02g/t
N
returned strong mineralisation (Upper 6.08m @ 7.57g/t 6m @ 6.83g/t
West)
Kofia has Gokona style potassium 900m
feldspar alteration and the same host
sequence (andesitic porphyry and Nyabigena
sediment). Chargeability anomalies
Gokona
are located on the HW and FW
contacts
Good continuity mapped in geology,
alteration and geophysical response
600m
Kofia Exploration Targetii
Area: 500m strike x 350vm Upper Westi
Average TWiii: 5m (range 3.8m to 6.8m) UGKD666: UGKD681: Tertiary Fault (dextral)
Drillhole geology Potential Grades: 4g/t to 5g/t 6m @ 2.65g/t 6m @ 8.03g/t HW Contact (MSC)
Mafic Schist (MSC) UGKD672: 7m @ 2.50g/t FW Contact (VAN)
iiPotential grades are conceptual in nature and there has No sig intercept 7m @ 4.38g/t
Host Sequence (CAP + SED) been insufficient exploration to define a mineral resource
UGKD682: IP Chargeability Anomaly
at this time and it is uncertain that further exploration will
Volcanic Andesite (VAN) result in the target being delineated as a mineral resource.
iiiTrue width
9m @ 3.62g/t Logged Alteration (A1 to A3)
iSee Appendix F for additional details including assay results for the significant interceptsBulyanhulu and Buzwagi…
Tanzania
Bulyanhulu
Bulyanhulu (84%)23 Q2 2020 Q1 2020 Q2 2019
On track to resume underground mining operations
Gold produced (oz 000) 7 7 6
by end of 2020, in line with guidance
Gold sold (oz 000) 30 7 6
Shaft refurbishment scheduled to start in August
Cost of sales ($/oz)7 1,658 1,685 1,217
Buzwagi Total cash costs ($/oz)8 950 686 525
Focus is on optimising throughput and managing All-in sustaining costs ($/oz)8 1,014 906 666
grade from stockpile processing
Scout drilling to validate the exploration model for Buzwagi (84%)23 Q2 2020 Q1 2020 Q2 2019
upside potential at depth has commenced, totaling Gold produced (oz 000) 20 22 19
2,720m
Gold sold (oz 000) 56 24 20
Exports of Concentrate Stockpiled Cost of sales ($/oz)7 909 1,373 1,198
Approximately 30% of concentrate shipped by Total cash costs ($/oz)8 751 1,275 1,099
end of Q2 with remainder shipped in Q3 All-in sustaining costs ($/oz)8 770 1,288 1,150
First $100 million tranche of settlement paid to
Government of Tanzania in May 2020Central and East Africa…
Congo – Tanzania Craton
Kibali
Central African
Republic South Sudan Drilling in progress confirming presence at depth of plunging
controls on mineralisation at KCD and satellite deposits
Kalimva – deeper drilling scheduled to test for underground
Kibali potential
Uganda
N Follow up work begins on regional anomalies outside the KZ
Ngayu Belt
trend
Kenya
Democratic
Lake
Victoria
Tanzania
North Mara
Republic of North Mara
Congo Bulyanhulu Gokona drill results validate revised geology model and
Gold deposits Buzwagi exceed grade expectations pointing to anticipated
Exploration focus resource increase
District scale mapping and modelling reveals new target
Greenstone Belt area
Tanzania
Archean Granitoid
Nyabigena conversion drilling aims to inform a larger pit
Phanerozoic
cutback decision end of year 2020
Proterozoic
Archean Gneiss Bulyanhulu
Visible gold intersected ~400m below M&I resource
supporting down plunge continuity of high grade Deep
500km
West ShootsCopper mines….
Lumwana, Zambia Lumwana (100%) Q2 2020 Q1 2020 Q2 2019
Best quarterly production from Lumwana in several years
Copper produced (lbs million) 72 64 49
Production 13% higher than Q1 due to improved head grade,
Cost of sales ($/lb) 2.06 1.94 2.07
combined with solid throughput performance at the plant
C1 cash costs ($/lb)9 1.55 1.63 1.70
Higher grades and cost control resulted in a 5% decrease in C1
cash costs per pound9 from Q1 All-in sustaining costs ($/lb)9 2.27 2.26 2.78
Jabal Sayid, Saudi Arabia (50%) Jabal Sayid (50%) Q2 2020 Q1 2020 Q2 2019
Production in line with the prior quarter, delivering Q2 per pound Copper produced (lbs million) 20 20 16
costs below the bottom end of 2020 guidance Cost of sales ($/lb)7 1.41 1.28 1.45
Concentrate filter expansion project to improve milling rates and C1 cash costs ($/lb)9 1.14 0.97 1.22
availability continues to advance to completion for H2 2020
All-in sustaining costs ($/lb)9 1.41 1.11 1.31
Zaldívar, Chile (50%)
Zaldívar (50%) Q2 2020 Q1 2020 Q2 2019
Production lower than Q1 mainly due to lower grades and
recoveries, partially offset by improved heap leach throughput Copper produced (lbs million) 28 31 32
Chloride Leach Project - mobilisation of contractors ramped up Cost of sales ($/lb)7 2.52 2.39 2.32
in July with onsite activities expected to commence in August. C1 cash costs ($/lb)9 1.79 1.71 1.61
Project remains on-budget with efforts underway to minimize All-in sustaining costs ($/lb)9 2.09 1.99 1.85
delays due to Covid-19Relative Share Price Performance…
Relative Share Price Performance
since merger with Randgold announced Relative Share Price Performance YTD
300 Base = 100 170 Base = 100
275
160 Barrick
Barrick:59%
59%
Barrick
Barrick:183%
183%
150
250
140
225
130
200 120
175 110
150
100 SpotGold:
Spot Gold 29%
29%
90
GDX: 49%
125 GDX 49%
80
Spot Gold: 63% GDX: 132%
100 Spot Gold 63% GDX 132% 70
75 60
Sep-18 Jan-19 May-19 Sep-19 Jan-20 May-20 Jan-20 Feb-20 Mar-20 Apr-20 May-20 Jun-20 Jul-20
Market data as at July 28, 2020. Share price performance based in USD. Source: Bloomberg Financial MarketsEndnotes
1. Loss time injury frequency rate (LTIFR) is a ratio calculated as follows: number of loss time injuries x 1,000,000 hours divided by the total number of hours worked.
2. Total reportable incident frequency rate (TRIFR) is a ratio calculated as follows: number of reportable injuries x 1,000,000 hours divided by the total number of hours worked. Reportable injuries include fatalities, lost time
injuries, restricted duty injuries, and medically treated injuries.
3. Class 1 - High Significance is defined as an incident that causes significant negative impacts on human health or the environment or an incident that extends onto publicly accessible land and has the potential to cause
significant adverse impact to surrounding communities, livestock or wildlife.
4. “Free cash flow” is a non-GAAP financial performance measure which deducts capital expenditures from net cash provided by operating activities. Barrick believes this to be a useful indicator of our ability to operate without
reliance on additional borrowing or usage of existing cash. Free cash flow is intended to provide additional information only and does not have any standardized meaning under IFRS and may not be comparable to similar
measures of performance presented by other companies. Free cash flow should not be considered in isolation or as a substitute for measures of performance prepared in accordance with IFRS. For further details on this
non-GAAP measure, please refer to page 80 of the MD&A accompanying Barrick’s second quarter 2020 financial statements filed on SEDAR at www.sedar.com and on EDGAR at www.sec.gov.
5. “Adjusted net earnings” and “adjusted net earnings per share” are non-GAAP financial performance measures. Adjusted net earnings excludes the following from net earnings: certain impairment charges (reversals) related
to intangibles, goodwill, property, plant and equipment, and investments; gains (losses) and other one-time costs relating to acquisitions or dispositions; foreign currency translation gains (losses); significant tax adjustments
not related to current period earnings; unrealized gains (losses) on non-hedge derivative instruments; and the tax effect and non-controlling interest of these items. The Company uses this measure internally to evaluate our
underlying operating performance for the reporting periods presented and to assist with the planning and forecasting of future operating results. Barrick believes that adjusted net earnings is a useful measure of our
performance because these adjusting items do not reflect the underlying operating performance of our core mining business and are not necessarily indicative of future operating results. Adjusted net earnings and adjusted
net earnings per share are intended to provide additional information only and do not have any standardized meaning under IFRS and may not be comparable to similar measures of performance presented by other
companies. They should not be considered in isolation or as a substitute for measures of performance prepared in accordance with IFRS. For further details on these non-GAAP measures, please refer to page 79-80 of the
MD&A accompanying Barrick’s second quarter 2020 financial statements filed on SEDAR at www.sedar.com and on EDGAR at www.sec.gov.
6. A Tier One Gold Asset is a mine with a stated life in excess of 10 years, annual production of at least 500,000 ounces of gold and total cash costs per ounce over the mine life that are in the lower half of the industry cost
curve.
7. Cost of sales applicable to gold per ounce is calculated using cost of sales applicable to gold on an attributable basis (removing the non-controlling interest of 40% Pueblo Viejo; 20% Loulo-Gounkoto; 10.3% Tongon; 16%
North Mara, Bulyanhulu and Buzwagi starting January 1, 2020, the date the GoT's 16% free carried interest was made effective (36.1% from January 1, 2019 to September 30, 2019; notwithstanding the completion of the
Acacia transaction on September 17, 2019, we consolidated our interest in Acacia and recorded a non-controlling interest of 36.1% in the income statement for the entirety of the third quarter of 2019 as a matter of
convenience); 63.1% South Arturo from cost of sales from July 1, 2019 onwards as a result of its contribution to Nevada Gold Mines (and on a 40% basis from January 1, 2019 to June 30, 2019); and our proportionate share
of cost of sales attributable to equity method investments (Kibali, and Morila until the second quarter of 2019), divided by attributable gold ounces. Also removes the non-controlling interest of 38.5% Nevada Gold Mines from
cost of sales from July 1, 2019 onwards. Cost of sales applicable to copper per pound is calculated using cost of sales applicable to copper including our proportionate share of cost of sales attributable to equity method
investments (Zaldívar and Jabal Sayid), divided by consolidated copper pounds (including our proportionate share of copper pounds from our equity method investments).Endnotes
8. “Total cash costs” per ounce and “All-in sustaining costs” per ounce are non-GAAP financial performance measures. “Total cash costs” per ounce starts with cost of sales applicable to gold production, but excludes the
impact of depreciation, the non-controlling interest of cost of sales, and includes by-product credits. “All-in sustaining costs” per ounce begin with “Total cash costs” per ounce and add further costs which reflect the additional
costs of operating a mine, primarily sustaining capital expenditures, sustaining leases, general & administrative costs, minesite exploration and evaluation costs, and reclamation cost accretion and amortization. Barrick
believes that the use of “total cash costs” per ounce and “all-in sustaining costs” per ounce will assist investors, analysts and other stakeholders in understanding the costs associated with producing gold, understanding the
economics of gold mining, assessing our operating performance and also our ability to generate free cash flow from current operations and to generate free cash flow on an overall Company basis. “Total cash costs” per
ounce and “All-in sustaining costs” per ounce are intended to provide additional information only and do not have any standardized meaning under IFRS. Although a standardized definition of all-in sustaining costs was
published in 2013 by the World Gold Council (a market development organization for the gold industry comprised of and funded by gold mining companies from around the world, including Barrick), it is not a regulatory
organization, and other companies may calculate this measure differently. Starting from the first quarter of 2019, we have renamed "cash costs" to "total cash costs" when referring to our gold operations. The calculation of
total cash costs is identical to our previous calculation of cash costs with only a change in the naming convention of this non-GAAP measure. These measures should not be considered in isolation or as a substitute for
measures prepared in accordance with IFRS. For further details on these non-GAAP measures, please refer to pages 81-98 of the MD&A accompanying Barrick’s second quarter 2020 financial statements filed on SEDAR at
www.sedar.com and on EDGAR at www.sec.gov.
9. “C1 cash costs” per pound and “All-in sustaining costs” per pound are non-GAAP financial performance measures. “C1 cash costs” per pound is based on cost of sales but excludes the impact of depreciation and royalties
and production taxes and includes treatment and refinement charges. “All-in sustaining costs” per pound begins with “C1 cash costs” per pound and adds further costs which reflect the additional costs of operating a mine,
primarily sustaining capital expenditures, general & administrative costs and royalties and production taxes. Barrick believes that the use of “C1 cash costs” per pound and “all-in sustaining costs” per pound will assist
investors, analysts, and other stakeholders in understanding the costs associated with producing copper, understanding the economics of copper mining, assessing our operating performance, and also our ability to generate
free cash flow from current operations and to generate free cash flow on an overall Company basis. “C1 cash costs” per pound and “All-in sustaining costs” per pound are intended to provide additional information only, do
not have any standardized meaning under IFRS, and may not be comparable to similar measures of performance presented by other companies. These measures should not be considered in isolation or as a substitute for
measures of performance prepared in accordance with IFRS. For further details on these non-GAAP measures, please refer to pages 99-100 of the MD&A accompanying Barrick’s second quarter 2020 financial statements
filed on SEDAR at www.sedar.com and on EDGAR at www.sec.gov.
10. EBITDA is a non-GAAP financial measure, which excludes the following from net earnings: income tax expense; finance costs; finance income; and depreciation. Management believes that EBITDA is a valuable indicator of
our ability to generate liquidity by producing operating cash flow to fund working capital needs, service debt obligations, and fund capital expenditures. Management uses EBITDA for this purpose. Adjusted EBITDA removes
the effect of impairment charges; acquisition/disposition gains/losses; foreign currency translation gains/losses; other expense adjustments; unrealized gains on non-hedge derivative instruments; and the impact of the
income tax expense, finance costs, finance income and depreciation incurred in our equity method accounted investments. We believe these items provide a greater level of consistency with the adjusting items included in
our Adjusted Net Earnings reconciliation, with the exception that these amounts are adjusted to remove any impact on finance costs/income, income tax expense and/or depreciation as they do not affect EBITDA. We believe
this additional information will assist analysts, investors and other stakeholders of Barrick in better understanding our ability to generate liquidity from our full business, including equity method investments, by excluding these
amounts from the calculation as they are not indicative of the performance of our core mining business and not necessarily reflective of the underlying operating results for the periods presented. EBITDA and adjusted
EBITDA are intended to provide additional information only and do not have any standardized meaning under IFRS and may not be comparable to similar measures of performance presented by other companies. They
should not be considered in isolation or as a substitute for measures of performance prepared in accordance with IFRS. For further details on these non-GAAP measures, please refer to pages 101-102 of the MD&A
accompanying Barrick’s second quarter 2020 financial statements filed on SEDAR at www.sedar.com and on EDGAR at www.sec.gov.
11. These amounts are presented on the same basis as our guidance and include our 60% share of Pueblo Viejo, 80% share of Loulo-Gounkoto, 89.7% share of Tongon, 45% share of Kibali, 40% share of Morila and 60% share
of South Arturo (36.9% of South Arturo from July 1, 2019 onwards as a result of its contribution to Nevada Gold Mines), our 84% share of Tanzania starting January 1, 2020, the date the GoT's 16% free carried interest was
made effective (63.9% share from January 1, 2019 to September 30, 2019; notwithstanding the completion of the Acacia transaction on September 17, 2019, we consolidated our interest in Acacia and recorded a non-
controlling interest of 36.1% in the income statement for the entirety of the third quarter of 2019 as a matter of convenience, and 100% share from October 1, 2019 to December 31, 2019) and our 50% share of Zaldívar and
Jabal Sayid. Starting July 1, 2019, it also includes our 61.5% share of Nevada Gold Mines.You can also read