A Results Oriented Approach for the Animal Welfare Measure of the European Union's Rural Development Programme
←
→
Page content transcription
If your browser does not render page correctly, please read the page content below
Article

A Results‐Oriented Approach for the Animal Welfare Measure
of the European Union’s Rural Development Programme
Angela Bergschmidt 1,*, Solveig March 2, Kathrin Wagner 2 and Jan Brinkmann 2

                                          1 Thünen Institute of Farm Economics, Bundesallee 63, 38116 Braunschweig, Germany
                                          2 Thünen Institute of Organic Farming, Trenthorst 32, 23847 Westerau, Germany;
                                            solveig.march@thuenen.de (S.M.); kathrin.wagner@googlemail.com (K.W.);
                                            jan.brinkmann@thuenen.de (J.B.)
                                          * Correspondence: angela.bergschmidt@thuenen.de; Tel.: +49‐531‐596‐5193

                                          Simple Summary: So far, the animal welfare support measures of the EU’s Common Agricultural
                                          Policy for dairy cows have been action‐oriented. Farmers receive a payment for their welfare
                                          friendly housing system or management (inputs). As the actual animal welfare output is not con‐
                                          sidered, these support‐measures can create good conditions for animal behaviour, but are not able
                                          to address animal health. This would be possible in a results‐oriented support measure, where the
                                          payment is linked to the output (animal‐based indicators). With the aim of making animal welfare
                                          support more effective, we therefore examined which indicators would be suitable for a results‐
                                          oriented support measure and how such a measure would have to be designed to encompass all
                                          dimensions of animal welfare: animal health, behaviour and emotional state. In a multi‐stage selec‐
                                          tion process involving scientists and practitioners, 10 indicators were identified as appropriate. Be‐
                                          cause these only cover animal health, a combined action‐ and results‐oriented measure is recom‐
                                          mended, in which the dimensions “behaviour” and “emotional state” are addressed via action‐ori‐
Citation: Bergschmidt, A.; March, S.;     ented requirements and the dimension “health” via results‐oriented indicators. With the results of
Wagner, K.; Brinkmann, J. A Results‐      our research, we provide the knowledge base for policy makers and administrators to implement
Oriented Approach for the Animal          agricultural support policies which can effectively improve the welfare of dairy cows.
Welfare Measure of the European
Union’s Rural Development                 Abstract: Farm animal welfare is a major concern to the European Union’s citizens, addressed in
Programme. Animals 2021, 11, 1570.        the Rural Development Programmes by a specific animal welfare support measure. Previous eval‐
https://doi.org/10.3390/ani11061570       uation results reveal that the implemented action‐oriented measures fail when it comes to improv‐
                                          ing animal health, an important dimension of animal welfare. Results‐oriented measures could
Academic Editor: David S Beggs, Peter
                                          compensate for this deficiency, but little is known about their design. In order to improve the effec‐
Mansell and Mandy Paterson
                                          tiveness of current animal welfare measures for dairy cows, we analysed the elements of such a
                                          measure in an interdisciplinary, application‐oriented research project involving agricultural econo‐
Received: 12 February 2021
Accepted: 19 May 2021
                                          mists and livestock scientists. We have used a mixed methods approach including a written Delphi
Published: 27 May 2021                    survey, group‐discussions and on‐farm data‐collection to select suitable indicators, develop an ap‐
                                          proach for the identification of threshold values and to design a support measure. Results suggest
Publisher’s Note: MDPI stays neu‐         that, in animal welfare support measures, action‐ as well as results‐oriented elements are necessary
tral with regard to jurisdictional        to address all dimensions of animal welfare.
claims in published maps and institu‐
tional affiliations.                      Keywords: animal welfare; Rural Development Programme (RDP); action‐oriented support; re‐
                                          sults‐oriented support; dairy cows; Welfare Quality®; welfare indicators

Copyright: © 2021 by the authors. Li‐
censee MDPI, Basel, Switzerland.
                                          1. Introduction
This article is an open access article
distributed under the terms and con‐
                                              European citizens are concerned about farm animal welfare. According to a recent
ditions of the Creative Commons At‐       Eurobarometer survey, 82% of the respondents’ state that “in general, the welfare of
tribution (CC BY) license (http://crea‐   farmed animals should be better protected than it is now” [1] (p.12). Scientific studies have
tivecommons.org/licenses/by/4.0/).        detected a large number of animal welfare problems on European farms. These range

Animals 2021, 11, 1570. https://doi.org/10.3390/ani11061570                                                       www.mdpi.com/journal/animals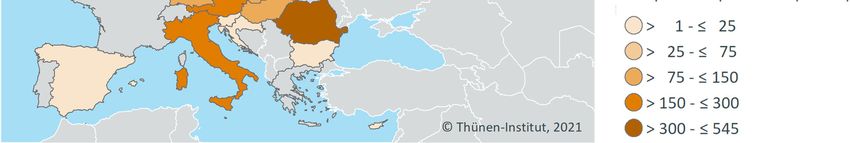
Animals 2021, 11, 1570                                                                                         2 of 20

                         from widespread incidences of disease, such as mastitis in dairy cows; high prevalence of
                         injuries caused by inadequate housing conditions, such as foot pad lesions in poultry; and
                         behavioural disorders, such as tail biting in pigs or feather pecking in laying hens; to rou‐
                         tinely conducted mutilations such as castration, dehorning and tail docking [2–4]. Animal
                         welfare has a number of attributes which characterise it as a public good in short supply
                         [5–7], thus calling for policy intervention to ensure adequate provision. Various instru‐
                         ments can be implemented to support this aim. In addition to a tightening of animal wel‐
                         fare legislation and the provision of appropriate information for consumers (i.e., animal
                         welfare labelling), these include support measures for farmers. Such measures have the
                         advantage of compensating for the higher costs of welfare‐friendly husbandry without
                         challenging the competitiveness of animal production on international markets.
                               The EU’s Common Agricultural Policy (CAP) makes up for over one third of the EU’s
                         budget, its two pillars, the Direct Payments and the Rural Development Programmes
                         (RPD) channelling roughly 60 billion Euro of support for farmers each year [8].
                               In the RDP, one specific measure, “Animal welfare” (M14, Article 33 in [9]), has been
                         programmed to improve animal welfare. Other RDP‐measures which can be imple‐
                         mented to improve farm animal welfare are farm investment support, knowledge transfer
                         and advisory services. However, these are predominantly used to increase the short‐term
                         competitiveness of the supported farms. With the measure M14, farmers “going beyond
                         the relevant mandatory standards” can receive annual payments per livestock unit (LU).
                         So far this measure only accounts for a small percentage of the RDP budget and is not
                         implemented in all member states [10], yet it has gained importance in recent years, with
                         the number of implementing countries, supported holdings, and Livestock Units, as well
                         as public expenditure, increasing steadily (see Figures A1 and A2 in Appendix A for an
                         overview).
                               In future, this measure or alternative animal welfare support such as the ones
                         planned in the framework of the Eco‐Schemes [11] could become even more important as
                         animal welfare remains an issue of high public interest and the existing problems persist.
                         As with all RDP measures, the definition and implementation of the support takes place
                         on the level of the EU‐Member State or even at the regional level (i.e., in Germany, the
                         federal states; in Italy, the regions). Up to now, measure M14 is almost exclusively imple‐
                         mented as an action‐oriented support‐measure and is targeted towards dairy cows in
                         most countries.
                               Action‐oriented measures are the common policy approach for the provision of pub‐
                         lic goods in the EU’s RDP and are widely used in agri‐environment schemes. They com‐
                         pensate farmers for the higher cost incurred dependent on the fulfilment of specific con‐
                         ditions (inputs). In contrast, action‐oriented measures pay for the achievement of a spe‐
                         cific output, in the biodiversity context, for instance, for the occurrence of endangered
                         flora in a habitat.
                               Participating farms commit themselves to requirements such as access to pasture or
                         the provision of straw bedding (for an example of the measure’s requirements, see Ap‐
                         pendix A). The evaluation of M14 in Germany has shown that this action‐oriented ap‐
                         proach can provide good conditions for animal behaviour, but is not able to address ani‐
                         mal health [12]. Results‐oriented measures could compensate for this deficiency, as animal
                         health can be measured adequately using animal‐based indicators. The inclusion of re‐
                         sults‐oriented elements could therefore make M14 more effective, “ensuring that farmers
                         are paid for provision rather than for performing management behaviours that may, or
                         may not, lead to provision” [13]. Results‐oriented approaches are widely used in animal
                         welfare research (“animal‐based indicators”) but are novel with respect to animal welfare
                         support measures.
                               With the aim of providing a knowledgebase for the improvement of the animal wel‐
                         fare effects of agricultural policy support measures, this paper presents the results of an
                         interdisciplinary, application‐oriented research project involving agricultural economists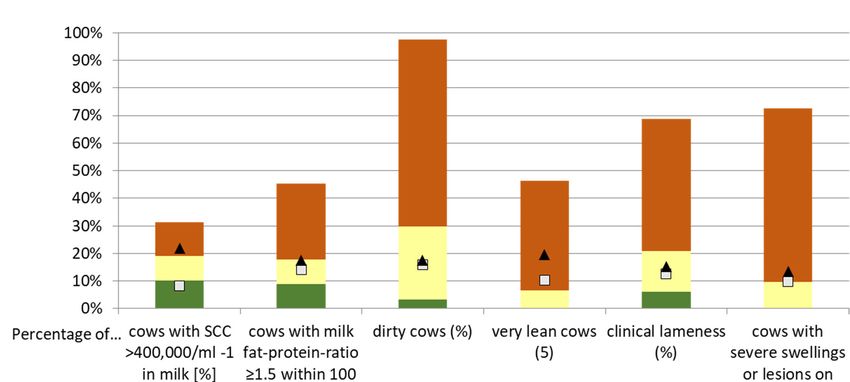
Animals 2021, 11, 1570                                                                                           3 of 20

                         and livestock scientists. The necessary elements of a results‐oriented animal welfare meas‐
                         ure for dairy cows have been analysed and recommendations formulated to increase the
                         effectiveness of the current RDP’s animal welfare support.
                              The project was divided into two phases, (1) the identification of suitable indicators
                         and (2) the determination of threshold values and measure design.

                         1.1. Identification of Suitable Indicators
                              Different concepts exist to operationalise animal welfare. The most widely used are
                         the “five freedoms” [14] and Fraser’s [15] multi‐dimensional model.
                              Both concepts address the same animal welfare issues, but Fraser’s approach makes
                         the missing possibility of compensation between the different animal welfare dimensions
                         obvious. Therefore, a good status of animal health and animal behaviour and emotional
                         state is necessary in order to accomplish high animal welfare (the intersection of the circles
                         in Figure 1).

                         Figure 1. Fraser’s multi‐dimensional animal welfare model ([15] modified).

                               Based on these concepts, the World Organisation for Animal Health (OIE) has drawn
                         up the following definition: “Animal welfare means the physical and mental state of an
                         animal in relation to the conditions in which it lives and dies. An animal experiences good
                         welfare if the animal is healthy, comfortable, well nourished, safe, is not suffering from
                         unpleasant states such as pain, fear and distress, and is able to express behaviours that are
                         important for its physical and mental state.” [16]. Common to all three definitions and of
                         crucial importance to our research is the multidimensional nature of animal welfare.
                               Animal welfare is assessed on the basis of indicators for individual welfare aspects.
                         Different research projects have worked on the development of animal welfare indicators.
                         The Welfare Quality® project [17] has set standards in this field of research and has since
                         become a commonly used reference for animal welfare indicators. Due to the comprehen‐
                         siveness of the assessment, which results in a high survey effort of six or more hours per
                         farm [18], the application of the entire Welfare Quality® protocol is unsuitable for use in the
                         design of support measures. As a consequence, an approach which concentrates on the most
                         important animal welfare issues was adopted for our indicator selection. The Welfare Qual‐
                         ity® protocol for dairy cows does play an important role in this approach, but not all indica‐
                         tors are included, and additional indicators were selected to address specific problems of
                         the German dairy sector.

                         1.2. Determination of Threshold Values and Measure Design
                              In addition to suitable indicators, threshold values are essential components of re‐
                         sults‐oriented policy measures. The threshold value is the indicator value up to which a
                         farm can receive a payment and above which an animal welfare payment is not consid‐
                         ered acceptable. For the design of an animal welfare measure, the definition of such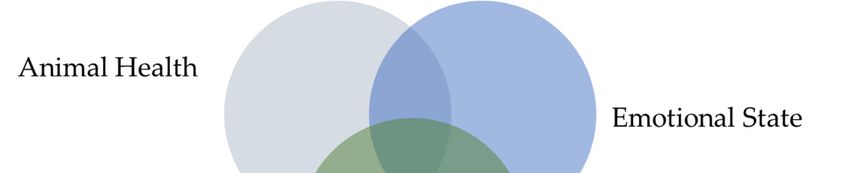
Animals 2021, 11, 1570                                                                                             4 of 20

                         threshold values is necessary for each of the selected indicators. Their definition is based
                         on value concepts, and it can therefore not be achieved solely on the basis of scientific
                         knowledge. Science can nevertheless contribute by testing approaches for the determina‐
                         tion of such values. In principle, normative and status quo‐based procedures can be used
                         to define threshold values. In normative approaches, a value is determined in a political
                         or societal debate. This has the advantage that societal goals or a situation desirable from
                         the point of view of animal welfare can be defined, regardless of the actual setting. Status
                         quo‐based methods are oriented towards the current situation. They have the advantage
                         of “not bypassing reality” as well as avoiding complex value discussions that are difficult
                         to resolve in consensus. Risks associated with the status quo‐based approach are (A) that
                         if prevalences are very high in practice (e.g., lameness), a problematic situation is rendered
                         acceptable and (B) that in the case of very low prevalences, a minor deviation on a farm
                         leads to the assessment of a situation as “problematic” that might be acceptable with re‐
                         spect to animal welfare.

                         2. Materials and Methods
                         2.1. Identification of Suitable Indicators
                         2.1.1. Selection of Indicators by Experts
                               The initial identification of suitable indicators was carried out in a two‐stage process
                         involving scientists and practitioners. First, an indicator‐database was compiled based on
                         a comprehensive literature review. We considered international publications which focus
                         on on‐farm animal welfare assessments, which refer to production systems in dairy cattle
                         similar to those in Germany, e.g., the Welfare Quality® assessment protocol for cattle [18]
                         and the “EFSA‐toolbox“ with animal‐based indicators to assess animal welfare of dairy
                         cows [19]. Furthermore, we took scientific studies into account which address methodo‐
                         logical issues of welfare assessments, such as [20–25], and various welfare indicators de‐
                         scribed by the different authors of the “Welfare Quality Reports No. 11” [26].
                               This “database” was used to assemble a list of 82 indicators. These were presented in
                         a written survey to 42 farm animal welfare scientists from German‐speaking countries
                         (Germany, Austria and Switzerland) to compile a list of indicators identified as suitable
                         according to scientific criteria of validity and reliability. In addition to scientific criteria,
                         the suitability for a problem‐oriented approach (Do the indicators address the most im‐
                         portant problem areas in dairy farming in Germany?) was the main selection criterion.
                         The contacted researchers work on relevant topics of farm animal husbandry in universi‐
                         ties or other research institutes and have expertise in welfare issues of dairy cows. We
                         chose these three countries for several reasons: (I) We assume that (due to the lively sci‐
                         entific exchange between the German‐speaking countries and the geographic vicinity) re‐
                         searchers from these countries are informed about the circumstances of dairy farming,
                         typical productions diseases and specific animal welfare problems in Germany. (II) Ger‐
                         many, Austria and Switzerland implement similar agricultural support measures (i.e.,
                         pasture premium, premium for straw bedding) which helped the scientists to understand
                         the research question. (III) Due to the common language, we were able to involve a larger
                         community (than just German scientists) without having to translate the survey docu‐
                         ments. Most of the 42 scientists approached were from Germany, 5 were based in Austria
                         6 in Switzerland.
                               To reduce heterogeneity, the survey was conducted as a two stage Delphi study. This
                         is a systematic, multi‐stage survey procedure with a feedback of the aggregated anony‐
                         mised results to the participants. A frequently pursued goal of Delphi surveys is to deter‐
                         mine and qualify the views of a group of experts on a diffuse issue [27]. In the context of
                         animal welfare and livestock production, Delphi surveys are a frequently used method
                         [28–32].
                               The initial response rate was 50%, leading to 21 responses in the first round, with an
                         even distribution across gender and origin (15 replies came from Germany, 2 from Austria
Animals 2021, 11, 1570                                                                                         5 of 20

                         and 3 from Switzerland, respectively). In the second round, 17 scientists used the oppor‐
                         tunity to adjust their information.
                              To include the experiences of practitioners in the selection of indicators, representa‐
                         tives of agricultural interest groups and animal welfare NGOs and those of inspection
                         bodies for organic farming and RDP measures, along with agricultural consultants, were
                         invited to a group discussion (“practitioner workshop”). Group discussions are a reliable
                         instrument “not to infer but to understand, not to generalize but to determine the range”
                         [33] and have proven valuable in the selection of indicators [34]. The 20 participants had
                         the task of evaluating the indicators selected by the scientists with regard to their practi‐
                         cability and suitability for measuring animal welfare in the context of an animal welfare
                         support measure. Again, the relevance of the indicators with respect to the most important
                         animal welfare problems (problem‐oriented approach) was emphasised. The participants
                         were informed about the indicators selected by the scientists in the Delphi study and had
                         the opportunity for discussion. They were then asked to rank the indicators presented.
                         For this purpose, small groups were formed and the participants were provided with
                         stickers indicating agreement or disagreement, which they placed on posters with the pre‐
                         selected indicators. In a written follow‐up, the participants were also asked to define
                         threshold values for the selected indicators.

                         2.1.2. On‐Farm Testing of the Project Indicators
                               The indicators, which were approved by at least two‐thirds of the participants of one
                         of the two groups (scientists and practitioners) and not less than half of the second group,
                         were included in a list of eleven “project indicators”. These project indicators were subse‐
                         quently tested in an on‐farm survey comprising 115 dairy farms to assess their practica‐
                         bility. Additionally, some indicators which were mentioned in the discussion with the
                         practitioners such as “broken tails” and “Percentage of cows with milk fat‐protein‐ratio <
                         1.0 as an indication of rumen fermentation disorders” were also tested. The on‐farm sur‐
                         vey was also used to provide the database for the validation of the project indicators with
                         the Welfare Quality® assessment tool. To this end, all indicators of the Welfare Quality®
                         assessment protocol for cattle [18] were also surveyed. The WQ® protocol [18] follows a
                         “bottom‐up” approach. In a first step, around 30 animal‐based indicators are collected.
                         These indicators are aggregated into twelve animal welfare criteria, which are then com‐
                         pressed to provide for an assessment for four animal welfare principles. In a fourth step,
                         an “overall welfare score” is calculated and classified into four categories (“excellent”,
                         “enhanced”, “acceptable” and “not classified”). At the level of animal welfare principles
                         and criteria, a value of 100 corresponds to the best and a value of 0 to the worst result,
                         while a value of 50 describes a “neutral” situation. Values from 0 to 20 are considered as
                         “unacceptable” (“not classified”), an improvement is also required for values between 20
                         and 50 (“acceptable”) and should be improved to values between 50 and 80 (“enhanced”),
                         whereas values between 80 and 100 (“excellent”) represented a very good situation [35].
                         In order to ensure good inter‐observer‐reliability, a training course was held for the four‐
                         member survey team, with inter‐observer reliability tests [36] showing sufficient to very
                         good agreement between the project staff.
                               The 115 farms participating in the survey were selected using a stratified random
                         sample from farms participating in an action‐oriented animal welfare measure (n = 3600
                         farms) and support to organic farming in the federal states of North‐Rhine, Westphalia (n
                         = 62) and Mecklenburg, Western Pomerania (n = 53) in Germany. The stratification made
                         sure that a balanced number of farms were included in the survey with respect to the
                         representation of the two federal states, organic and conventional farming and the sub‐
                         measures of the support (A: summer grazing, n = 27; B: loose housing on straw, n = 32 and
                         a combination of A and B + 3 farms receiving support for organic farming, n = 56). The actual
                         sampling within the defined subgroups was carried out as a random selection. The status
                         quo of animal welfare was recorded for the 115 dairy farms (46 organic and 69 conventional)
                         between November 2013 and May 2014. All surveyed farms had loose housing systems (75
Animals 2021, 11, 1570 6 of 20
with cubicle housing and 40 with free, deeply bedded lying areas), the mean herd size was
155 dairy cows and the annual milk yield per cow was 8137 kg on average. Table 1 presents
the key data of the project farms.
Table 1. Selected key data of the 115 project farms in 2014, mean values and range (min–max) at
herd level.
Item Unit Mean (min–max)
Herd size dairy cows 155 (21–1495)
Milk yield 1 kg/cow/year 8137 (4405–11,988)
Herd age 2 years 4.9 (3.5–6.9)
Culling rate 3 % 27.5 (8.7–56.7)
Mean productive life time 3 years 3.3 (1.9–7.9)
Housing system:
75 farms with cubicle housing and 40 farms with free, deeply bedded lying areas
1 Annual moving average milk yield from milk recording data 2014 (n = 107). 2 Calculations are
based on monthly milk recording data, 2014 (n = 106). 3 Based on milk recording data, calculation
is carried out with the module “Betriebsvergleich” (farm comparison) of ITB‐Controlling software
from dsp‐Agrosoft GmbH, Pareetz (n culling rate = 103; n productive life time = 105).
2.1.3. Statistics
In the two stage Delphi study, the values stated by the experts in the first round of
the survey were evaluated descriptively and reported back to all participants, anonymised
and aggregated as descriptive statistical parameters (mean, minimum, maximum, me‐
dian, number of answers).
For the analysis of the on‐farm survey, individual animal‐related data were con‐
verted into prevalences on herd level. The data evaluation was carried out with the pro‐
gram SAS® 9.4 (SAS Institute Inc., Cary, NC, USA).
2.2. Determination of Threshold Values and Measure Design
Within the framework of the project, normative threshold values were collected from
the scientists involved in the indicator selection as well as from the practitioners who par‐
ticipated in the group discussion (“practitioner workshop”). These values were compared
with the indicator results on the surveyed farms, and the findings used to derive recom‐
mendations for an appropriate procedure for the definition of threshold values.
For the final design of the animal welfare measure, another group discussion, this
time involving seven representatives from extension services and from agricultural min‐
istries was carried out (“expert workshop”). The subjects discussed included the remu‐
neration model of the measure (including the proposed thresholds) as well as additional
requirements needed to address all dimensions of animal welfare.
3. Results
3.1. Identification of Suitable Indicators
3.1.1. Selection of Indicators by Experts
As a result of the Delphi survey and the practitioner workshop, a list of eleven indi‐
cators (Table 2) was identified as suitable for a results‐oriented animal welfare measure
for dairy cows.Animals 2021, 11, 1570 7 of 20
Table 2. Scientists and practitioners indicator selection.
Scientists Practitioners
Indicator
(n = 21/17) 1 (n = 20)
Mastitis: Percentage of cows with SCC > 400,000/mL in milk
(%)
Ketosis: Percentage of cows with milk fat‐protein‐ratio ≥1.5
within 100 days p.p. (%)
Cleanliness: Percentage of dirty cows (%)
Body condition: Percentage of very lean cows (%)
Lameness: Percentage of clinically lame cows (%)
Lameness: Percentage of severely lame cows (%)
Integument alterations on limbs: Percentage of cows with se‐
vere swellings or lesions on carpus or tarsus (%)
Integument alterations, other body regions: Percentage of
cows with severe swellings or lesions on other body regions
(%)
Lying behaviour/Cow Comfort Index: proportion of cows in
stalls that are lying down
Cow mortality: Percentage of euthanized and deceased cows
(%)
Calf mortality: Percentage of euthanized and deceased calves
(%)
Indicators with ≥ 66% acceptance. Indicators with < 66% but >50% acceptance. 1 Number of
responses in Delphi survey in first and second round, respectively.
These indicators were subsequently tested in the on‐farm survey. Based on the results
of the analysis, the following indicators were excluded from the final list (a more detailed
explanation is given in Section 4):
Lameness: Percentage of severe lameness (2), due to collinearity with the indicator
“prevalence of clinical lameness”;
Lying behaviour/Cow Comfort Index: Percentage of cows in stalls that are lying
down (7), because of difficulties in on‐farm data collection;
Calf mortality: Percentage of euthanized and deceased calves (11), as reliable data
proved to be unavailable.
In return, two additional indicators were added to the list:
Percentage of cows with broken tails, an indicator suggested by practitioners, which
proved to be relevant;
Percentage of cows with milk fat‐protein‐ratio < 1.0 as an indication of rumen fermen‐
tation disorders, which also occurred frequently on the surveyed farms and for which
data is readily available.
3.1.2. Testing of the Project Indicators
Results of Selected Indicators
The indicator values from the 115 project farms are shown in Table 3. Some of the
indicators, such as the prevalence of dirty cows, are characterised by a wide range, i.e.,
the results of the individual farms are generally relatively far apart. Other indicator values
were close to each other for most farms, but a few farms have extreme values. This was
true for the prevalence of cows with severe swellings or lesions on carpus or tarsus and
for the indicator cows with broken tails.Animals 2021, 11, 1570 8 of 20
Table 3. Indicator values of the 115 farms surveyed in 2014 (mean, median = MED, minimum = min, maximum = max and
quartiles = Q). Indicators excluded from the final list have a red font colour. Indicators added to the final list have a green
font colour.
Indicator Mean Min Q1 MED Q3 Max n
Mastitis: Cows with SCC > 400,000/mL in milk 1 % 14.9 2.6 10.1 13.3 19.0 31.4 106
Ketosis: Cows with milk fat‐protein‐ratio ≥1.5 within
% 14.5 0.3 8.6 12.1 17.4 45 106
100 days p.p.1
Rumen fermentation disorders: Cows with milk fat‐pro‐
% 8.9 0.7 4.0 6.9 10.8 44.1 106
tein‐ratio < 1.0 1
Cleanliness: Dirty cows 2 % 20.1 0.0 3.3 12.5 29.7 97.5 115
Body condition: Very lean cows 2 % 4.7 0.0 0.0 3.1 6.7 46.3 115
Lameness: Clinically lame cows 2 % 14.7 0.0 6.1 12.1 20.8 68.8 115
Lameness: Severely lame cows 2 % 1.7 0.0 0.0 0.0 2.7 12.5 115
Integument alterations on limbs: Cows with severe
% 7.9 0.0 0.0 3.0 9.8 72.5 115
swellings or lesions on carpus or tarsus 2
Integument alterations, other body regions: Cows with
% 10.8 0.0 2.5 8.0 12.5 56.3 115
severe swellings or lesions on other body regions 2
Cows with broken tails 2 % 5.6 0.0 0.0 2.4 6.3 48.8 115
Lying behaviour/Cow Comfort Index 3: Cows in stalls
% 79.5 10.6 75.9 81.9 87.3 100 115
that are lying down
Cow mortality: Euthanized and deceased cows 4 % 2.8 0.0 1.1 2.4 3.6 31.3 105
Calf mortality: Euthanized and deceased calves 5 % 7.9 0.0 2.4 5.1 11.7 31.3 105
1 Calculations were based on monthly milk recording data (n = 106). 2 Calculations of prevalences on farm‐level were based
on individual animal assessments during the farm visits in winter 2013/14. 3 Cow Comfort Index = number of cows ob‐
served lying in stalls/lying area divided by the total number either lying or standing in a stall/with at least two limbs on
the lying area; modified according to [22]. 4 The mortality rates are calculated as the average of the past three calendar
years (2012–2014) based on the “HIT”‐data (cattle register data in Germany) [37] (n = 105). 5 See 4. Calf mortality was
calculated from the 8th day of life, as the data entries for the first week of life in the HIT‐database are not reliable due to
the documentation requirements. [37] (n = 105).
Results of Welfare Quality® Assessment
In the “overall welfare score” according to the Welfare Quality® protocol [18], eight farms
(7%) were classified as “excellent”, 64 farms (56%) as “enhanced”, 42 farms (36%) as “accepta‐
ble” and one farm as “not classified” (Figure 2). For results of the twelve animal welfare criteria
as well as the aggregation into four animal welfare principles, see Table A1 in Appendix B.
1. 1% 8. 7%
42. 36%
64. 56%
Excellent Enhanced Acceptable Not classified
Figure 2. Results of the “overall welfare score”, according to the Welfare Quality® assessment pro‐
tocol, in the 115 project farms.Animals 2021, 11, 1570 9 of 20
3.2. Determination of Threshold Values and Measure Design
3.2.1. Defining Threshold Values for the Animal Welfare Indicators
The on‐farm survey provided indicator values for 115 farms. In Figure 3, the norma‐
tive threshold values of scientists and practitioners are contrasted with the on‐farm situa‐
tion. For the sake of clarity, not all project indicators, but a selection of six indicators, is
presented in a bar chart. The values of those indicators not depicted can be found in Ap‐
pendix B, Table A2.
The indicator results are structured into quartiles; the first quartile (Q1) represents
the best 25%, the second and third quartile (Q2, Q3) are aggregated into the group of the
“50% average farms” and the fourth quartile (Q4) represents the worst 25% farms (see
Table 3 and Table A2 in Appendix B).
1. Mastitis: Percentage of cows with SCC > 400,000 mL−1 in milk: The 25% best farms
(Q1, green bar) had 0–10.1%, the 25% worst farms (Q4, red bar) had 19–31.4% cows
with SCC > 400,000 mL−1. The scientists set their threshold values at 8% (in the green
bar), practitioners at 22% (in the red bar).
2. Ketosis: Percentage of cows with milk fat‐protein‐ratio ≥1.5 within 100 days p.p.
ranged from 0–8.6% in Q1 and from 17.4–45.0% in Q4. Here the scientists’ thresholds
were 14% and the practitioners’ thresholds 18%, both located in the yellow bar.
3. Cleanliness: Percentage of dirty cows: The 25% best farms had 0–3.3% dirty cows, the
25% worst farms had 29.7–97.5%. Again, the thresholds were located in the yellow
bar and amounted to 16% (scientists) and 17% (practitioners).
4. Body condition: Percentage of very lean cows: The 25% best farms had 0%, and the
25% worst farms had 6.7–46.3% very lean cows. This is the only indicator where the
two thresholds were located in the red bar (10% scientists; 20% practitioners).
5. Lameness: Prevalence of clinical lameness: The 25% best farms had 0–6.1%, the 25%
worst farms (red bar) had 20.8–68.8% lame cows. Again, the thresholds were located
in the yellow bar (13% scientists, 15% practitioners).
6. Integument alterations on limbs: Percentage of cows with severe swellings or lesions
on carpus or tarsus: the 25% best farms had 0% cows with integument alterations on
limbs, the 25% worst farms (red bar) had 9.8–72.5%. The scientist’s thresholds were
set at 10% and those of practitioners at 14% for this indicator and were in the yellow
and red bar, respectively.
Generally, the threshold values of the practitioners are higher than those of the sci‐
entists for all indicators (also the ones not depicted in the Figure 3 (see Table A2 in Ap‐
pendix B). For most of the indicators—if the normative thresholds were applied—farms
having average indicator results (yellow bar, 50% average farms) would be eligible for
support in an animal welfare measure.Animals 2021, 11, 1570 10 of 20
Figure 3. Normative versus status quo‐based threshold values: A comparison of the normative values of scientists (n = 12–
17) and practitioners (n = 8–9) with the results of the on‐farm survey (n = 115).
3.2.2. Remuneration Model
The remuneration model specifies which farms would be entitled to receive pay‐
ments from a results‐oriented animal welfare measure. As the normative approach to the
setting of threshold values proved to be unsuitable, status‐quo threshold values were used
for the development of a remuneration model, which is an adapted version of Spoolder’s
assessment method [29]. This approach was discussed and agreed upon in the “expert
workshop”.
In the remuneration model, for each individual indicator, a farm whose indicator
value corresponds to that …
achieved by the 25% best farms, indicating “good animal welfare”, would receive a
payment (per cow and year) in a results‐oriented animal welfare measure;
of the 50% average farms indicating “acceptable animal welfare”, would not receive
a payment for this indicator;
of the 25% worst farms, “unacceptable animal welfare”, would lead to exclusion from
the animal welfare measure.
In the expert workshop, the question was raised of whether one indicator in the cat‐
egory of “unacceptable animal welfare” (Q4) should be permissible. The participants
agreed that this option would generally be conceivable (i.e., for indicators such as cleanli‐
ness) but not for indicators which are of particularly high relevance for animal welfare
due to their painfulness for the animal. This criterion should be applied to the indicators
“Lameness: Prevalence of clinical lameness” and “Mastitis: Percentage of cows with SCC
>400,000 mL−1 in milk (%)”.Animals 2021, 11, 1570 11 of 20
Comparison of Results of Project Indicators and Welfare Quality® Assessment
The comparison of the project indicators (operationalised in the remuneration model)
with the Welfare Quality® protocol showed a limited degree of consistency between the
two systems. Farms receiving a poor overall rating in Welfare Quality® also scored poorly
based on the set of indicators selected in the project (Table 4). On the other hand, a large
number of farms which were classified as “enhanced” in Welfare Quality® (43 farms)
would not have been eligible for an animal welfare measure in the assessment based on
the project indicators. Furthermore, an important number (31) of farms, which only re‐
ceived the classification “acceptable” in the Welfare Quality® assessment, would have
been eligible for support in the assessment based on the project indicators.
Table 4. Welfare Quality® assessment in comparison to the qualification of farms to participate in
a results‐oriented support measure.
Item Project Indicator Assessment (Remuneration Model)
Eligible Not Eligible
Welfare Quality®
(max 1 Indicator in (>1 Indicator in the Total
Overall Assessment
the Lower Quartile) Lower Quartile)
Excellent 6/16% 2/3% 8/7%
Enhanced 21/55% 43/56% 64/56%
Acceptable 11/29% 31/40% 42/37%
Not classified 0/0% 1/1% 1/1%
4. Discussion
4.1. Identification of Suitable Indicators
The indicator selection was based on a literature review, a written Delphi survey with
scientists, a group discussion with stakeholders (“practitioner workshop”) and the on‐
farm trial of the pre‐selected indicators. The quality of the results of Delphi surveys de‐
pends crucially on the response rate, the selection of the experts involved and their qual‐
ifications [38]. Group discussions, on the other hand, can only provide robust results if all
relevant stakeholder groups are involved. If, for example, animal welfare NGOs, or the
extension service, were not invited to participate in the selection of suitable animal welfare
indicators, the results of such a discussion would be questionable.
The response rate of the Delphi study was 50% in the first round and 80% in the
second round. This is a common response rate for expert surveys (see, for example, [39]).
In the basic literature describing the procedures of Delphi surveys, [40] response rates of
30% in the first round and between 70–75% for the following round(s) are considered sat‐
isfactory. As the contacted researchers were selected because of their expertise in the on
farm animal welfare of dairy cows, we expect the quality of results of the Delphi study to
be robust. This applies also to the group discussions with the practitioners, as all relevant
stakeholder‐groups were invited and represented.
Scientists and practitioners were broadly in agreement (see Table 2) and, for a major‐
ity of indicators, the on‐farm trial demonstrated practicability. However, three of the ini‐
tially selected indicators were excluded from the final list:
1. “Lameness: Prevalence of severe lameness” because of multicollinearity with “Lame‐
ness: Prevalence of clinical lameness”.
2. “Lying behaviour/Cow Comfort Index: proportion of cows in stalls that are lying
down”. The Cow Comfort Index is an indicator of lying behaviour. It was primarily
designed for cubicle housed cows [22] and is not suitable for assessment of other
housing systems (e.g., deep litter), which are also common in dairy farming in Ger‐
many (mostly in organic farms). Furthermore, our results show large farm‐specific
differences (range 10.6–100%), which partly resulted from the difficulties of finding
a suitable time window.Animals 2021, 11, 1570 12 of 20
3. “Calf mortality: Percentage of euthanized and deceased calves”, because only incon‐
sistent data was available, resulting in a systematic underestimation of calf mortali‐
ties. The cattle register data, which allows for a reliable calculation of mortality of
adult cattle, is unsuitable for the calculation of calf mortality as data is not reliably
recorded in the first week of the calf’s life. This is due to the fact that entry into the
system is only mandatory from the eighth day of life onwards, leading to a situation
where some farms record calves that die in the first week while other farms do not.
Indicators were not only excluded from the list, some were also added to the list. In
the “practitioner workshop”, the participants advised to investigate in the on‐farm survey
if broken tails occur and to include this as a new indicator to the list, if this should be the
case. As broken tails have been ascertained on 5.6% of the cows on the 115 surveyed farms
with one fifth of farms exceeding 10% of cows with broken tails, and it is easy to assess,
this indicator was added to the list. Broken tails as welfare‐indicator is also included in
other indicator sets [41], because tail injuries or broken tails are extremely painful for the
affected cow; high prevalence can be caused by mechanical injuries from slurry‐scrapers
and brushes as well as rough cow handling by farm staff [41]. Furthermore, the indicator
“Percentage of cows with milk fat‐protein‐ratio < 1.0” has been suggested by the practi‐
tioners and was consequently included as it can indicate rumen fermentation disorders
[42]. These are often a result of a very starchy diet which is unsuitable for ruminants as it
can be a risk factor for rumenitis or subclinical ruminal acidosis and subsequently also
laminitis. This animal welfare problem was highlighted in the on‐farm survey (8.9% of the
cows had a milk fat‐protein‐ratio < 1.0), and the indicator can be generated from existing
data without additional effort.
The selected indicators show a high degree of concordance with other studies/pro‐
jects which focussed on animal‐based indicators. For example, nine of the above‐men‐
tioned project indicators are also included in the list of 15 indicators recommended for on‐
farm self‐monitoring [43,44] and eight of the project indicators can be found in the “As‐
sureWel”‐list of eleven indicators for organic farming control of the “Soil Association” [41].
The differences in the animal welfare assessment of the Welfare Quality® protocol
with the assessment based on the project indicators had several reasons. Here we focus
on the explanations as to why farms scored well on project indicators but performed
poorly in the Welfare Quality® assessment, as this could lead to a situation where farms
with poor animal welfare would receive premiums under an animal welfare support
measure. The reasons why farms that received a good rating based on the project indica‐
tors were classified as only “acceptable” in the Welfare Quality® assessment were defi‐
ciencies in water supply (principle “Good Feeding”), pain induced by management pro‐
cedures (disbudding) and weak points in the principle “Appropriate behaviour“, mainly
influenced by a resource/management‐based impact: access to pasture [45]. These aspects
are not part of the list of project indicators.
The selected indicator list does not cover all dimensions of animal welfare [15] as it
lacks indicators to assess animal behaviour. The ability to carry out normal behaviour
possibly was not seen as an important animal welfare problem of dairy cows by the sci‐
entists and practitioners involved in the selection process. Possibly the fact that the assess‐
ment of animal behaviour using animal‐based indicators requires a considerable amount
of time also played a role in the selection decisions. Emotional state and water supply are
also not part of the list, because no suitable animal‐based indicators (which are a precon‐
dition for results‐oriented measures) exist [18]. We address this issue, not by introducing
changes to the set of indicators selected by scientists and practitioners, but through meas‐
ure design (see Section 4.2).
Nearly all farms included in the study participated in the action‐oriented animal wel‐
fare support measure (M14). A high number of organic farms are among these supported
farms. This selection was based on the consideration that farms receiving support in such
a measure, as well as organic farms, would probably be willing to participate in a future
results‐oriented animal welfare measure.Animals 2021, 11, 1570 13 of 20
It is likely that the conventional farms participating in the animal welfare support
measure have above average results with respect to the surveyed animal welfare indica‐
tors. For organic farming, only a few reviews are available which compare and evaluate
the animal welfare situation with that on conventional farms. The current analysis found
no fundamental differences in the animal welfare situation of the two farming systems,
apart from parasitic diseases [46–48], udder health and antibiotic resistance [49].
In a general comparison of indicator results of the project farms (Table 3 and Figure 2)
with the literature, the project farms achieved better results for the “overall welfare score”
compared to Kirchner et al. [50] and Gratzer et al. [51]. This is due to higher scores for the
principles “Good Housing”, “Appropriate Behaviour” and “Good Health”. In contrast to
other Welfare Quality®‐assessments [52–56], in which no farm was rated “excellent”, this
was the case in 8 out of 115 farms (7 organic and 1 conventional). This finding can be
explained by the fact that most of the project farms participated in an action‐oriented an‐
imal welfare policy measure. Many of the farms in this support measure also managed
their holdings according to organic guidelines, resulting in a higher proportion of organic
farms in our sample compared to other studies. Compared to the results presented by
Heath et al., for 92 farms in England and Wales, the dairy farms in our study had better
results, especially with respect to the WQ® principle “Appropriate Behaviour”, which
could be explained by the higher share of organic farms and the respective requirements
(e.g., pasture).
Overall, our results of the WQ®‐principles and criteria (see Table A1 in Appendix B)
were comparable to Schulz et al., who assessed the WQ®‐protocol in 34 farms in Germany
(19 organic, 15 conventional farms) and also reported benefits in terms of a better welfare
in organic dairy farms compared to conventional farms [57].
The indicator results generated on the 115 project farms should nevertheless not be
regarded as representative for all German dairy farms. As the main task of the on‐farm
indicator survey was not to generate valid data on the animal welfare situation of dairy
cows, but to test the feasibility of the selected indicators, the question of representation
does not play an important role in the framework of this study.
4.2. Determination of Threshold Values and Measure Design
A comparison of the threshold values defined normatively by scientists and practi‐
tioners with the values recorded in the on‐farm survey showed that the normative ap‐
proach is associated with considerable difficulties (see Figure 2). On the one hand, value
differences between the two social groups (science and practice) become obvious. On the
other hand, the application of the normative threshold values can lead to a situation where
farms would receive an animal welfare payment even when they belong to the group of
the 25% worst farms with respect to one or several animal welfare indicator/s. For most of
the indicators—if the normative thresholds were applied—farms having average indica‐
tor results (yellow bar) would be eligible for support in an animal welfare measure. This
would lead to a measure that would reward average animal welfare—a situation which
cannot be considered an efficient use of public funds.
Therefore, when setting threshold values for animal welfare indicators, the status quo
on the farms should be considered. As no representative data is available for most relevant
animal welfare indicators, values from scientific studies with limited sample sizes have to
be used until a better database is available (e.g., with respect to lameness, an overview can
be found at https://www.cattle‐lameness.org.uk/research, accessed on 19 January 2021).
The use of threshold values derived from the status quo should not replace the discussion
about the socially desired level of animal welfare in livestock farming, but ensure that
support payments for an animal welfare measure are not disbursed to farms whose ani‐
mal welfare situation is only average or even in the lower quartile. This combination of
status quo and normative approaches has proven successful in projects which provide
reference values for the animal welfare self‐assessment according to the Animal Welfare
Act [58] in Germany [59,60].Animals 2021, 11, 1570 14 of 20
Because the indicators selected in the project cover only aspects of animal health, an
animal welfare support measure should contain action‐oriented requirements in order to
be able to consider the dimensions “behaviour” and “emotions” of animal welfare. In the
“expert workshop”, the following action‐oriented requirements were identified to be in‐
cluded in the animal welfare measure to enable the cows to carry out normal behaviour
and ensure access to water:
cow to cubicle ratio of max. 1:1;
sufficient number of functional drinkers;
animal to feeding place ratio of max. 1:1; access to pasture for all cows.
In order to include aspects of “emotional state”, the support measure requirements
should also prescribe the use of anaesthesia, sedatives and analgesia when disbudding.
With respect to the payments for the participation in a possible future results‐ori‐
ented measure, this should consist of two components: a base premium for compliance
with the action‐oriented requirements and payments for each indicator where the farm
has achieved the required result.
The remuneration model defined in the project with the ’25‐50‐25 split’, discussed
and agreed upon in the “expert workshop”, may seem arbitrary, and of course other mod‐
els (such as 33‐33‐33 or even 50‐25‐25) are conceivable as well. It should be seen as one
possible approach to address the challenge of a results‐oriented support measure, not as
the only solution.
With respect to the payment to the farm, the amount per cow would not necessarily
have to change from the one disbursed in the current system (50‐130 Euro per cow per
year, see Appendix A), but generally the “right” amount is often determined in a “trial
and error phase” at the beginning of the implementation of a new measure (if too many
farms apply for participation in the measure, the amount would be reduced, and vice‐
versa).
Even though the empirical research for our analysis was carried out in two federal
states of Germany and thus has very limited geographical coverage, the results are rele‐
vant in the EU‐context. As animal health—an important dimension of animal welfare—is
influenced far more by management than by requirements on the housing system, the
large number of the action‐oriented animal welfare measures implemented in the EU fail
to achieve animal welfare. With the inclusion of results‐oriented elements, the perfor‐
mance of these measures could be increased substantially.
5. Conclusions
With a combination of action‐oriented requirements and results‐oriented indicators,
all dimensions of animal welfare: health, behaviour and emotions (e.g., by avoiding fear
and pain when disbudding) can be covered in support measures for dairy cows. Due to
the higher complexity of such support compared to purely action‐oriented measures, a
scientifically accompanied trial phase with a limited number of farms is recommended.
With regard to the role that support measures can play in improving animal welfare
in livestock farming, it should be noted that voluntary support measures are not suitable
for preventing violations of animal welfare laws. They are also not adequate for the im‐
provement of the situation on farms which have severe animal welfare problems, as these
measures will be taken up primarily by farms that are interested in animal welfare and
consequently, on average, achieve a relatively good level of animal welfare. To improve
the situation on farms with relevant animal welfare problems, other approaches, such as
a tightening of animal welfare legislation, increased controls and more effective enforce‐
ment of animal welfare legislation, would be appropriate [61].
Author Contributions: A.B., S.M., and J.B. conceived and designed the study. J.B., K.W., S.M., and
A.B. performed the study. S.M., K.W., A.B., and J.B. analysed the data. S.M. and J.B. contributed
materials and analysis tools. A.B. wrote the paper. All authors have read and agreed to the pub‐
lished version of the manuscript.Animals 2021, 11, 1570 15 of 20
Funding: The project was supported by funds of the Federal Ministry of Food and Agriculture
(BMEL) based on a decision of the Parliament of the Federal Republic of Germany via the Federal
Office for Agriculture and Food (BLE) under the framework of the Federal Organic Farming Scheme
and other Forms of Sustainable Agriculture (BÖLN).
Institutional Review Board Statement: Ethical review and approval were waived for this study,
due the fact that no invasive measurements were carried out on farms, i.e., no laboratory animals
were used.
Informed Consent Statement: Informed consent was obtained from all subjects involved in the
study.
Data Availability Statement: None of the data were deposited in an official repository. The data
that support the study findings are available upon request.
Acknowledgments: We warmly thank all farmers of the study for their dedicated cooperation and
their great hospitality. The experts attending the Delphi survey and the workshops are gratefully
acknowledged for contributing to the results presented above. We would like to thank Christine
Renziehausen for her contribution to the performance of the study and Sonia Starosta and Maren
Osterbur for their support in data collection. We would also like to thank the BMEL and the BLE
who fund the research (project 11 NA 026) within the framework of the Federal Organic Farming
Scheme and other Forms of Sustainable Agriculture (BÖLN).
Conflicts of Interest: The authors declare no conflict of interest. The founding sponsors had no role
in the design of the study; in the collection, analyses, interpretation of data; in the writing of the
manuscript; or in the decision to publish the results.
Appendix A
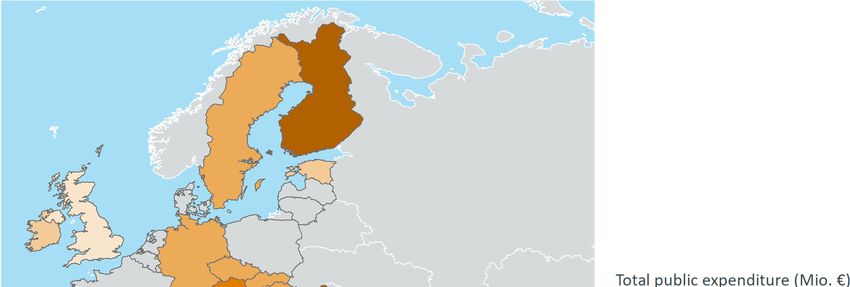
Figure A1. Total public expenditure for Measure M14—Animal Welfare in the EU Member states in 2014–2019; Source:
https://cohesiondata.ec.europa.eu/ (accessed on 19 January 2021). Data and Maps, esri (2021).Animals 2021, 11, 1570 16 of 20
Holdings LU
120,000 14,000,000
100,000 12,000,000
10,000,000
80,000
8,000,000
60,000
6,000,000
40,000
4,000,000
20,000 2,000,000
0 0
2014 2015 2016 2017 2018 2019
Holdings 7,212 46,200 63,996 99,950 101,099 99,062
LU 612,663 1,319,021 3,881,553 6,072,096 6,496,496 12,471,614
Figure A2. Number of supported Holdings and supported Livestock Units (LU) for Measure—Animal Welfare in the EU
Member states in 2014–2019.
The large increase in LU in 2019 is due to the introduction of M14 in Croatia as well
as very high numbers in Italy and Romania. It is generally difficult to validate the data,
and the most recent year especially (2019) should be treated with caution as it might still
be subject to correction.
Characteristics of the RDP Animal Welfare Support Measure (M14)
The most important requirements of Measure M14 “loose housing on straw” for
dairy cows in North‐Rhine, Westphalia (as an example for a typical action‐oriented sup‐
port measure) are: tie‐stalls are not eligible for support:
usable area of 5.5 m2 per animal;
lying area with a straw‐bed on solid floor on which all animals can lie down at the
same time;
animal to feeding space ratio of 1:1 or 1.2:1 in the case of continuous feeding.
For the farms participating in this measure, the payment is 80 Euro per cow per year.
For the measure “summer grazing”, the animals must have daily access to pasture
from 16th of May to 15th of October, and the available grazing area must be at least 0.2 ha
per LU.
The amount of the subsidy is 50 euros per LU per year or 40 euros for organic farms.
The two measures can be combined if all requirements are met, resulting in a pay‐
ment of 130 Euro per cow.
Source: Guidelines for the promotion of husbandry methods on straw and summer
grazing RdErl. d. Ministeriums für Klimaschutz, Umwelt, Landwirtschaft, Natur‐ und
Verbraucherschutz—II A 4‐62.71.10 v. 27.3.2015.Animals 2021, 11, 1570 17 of 20
Appendix B
Table A1. Overall assessment of the results of Welfare Quality® assessment in 115 project farms
presented as WQ® principles and criteria in mean values, range (min‐max).
WQ® Principles and Criteria All Farms (n = 115)
Good Feeding 49.0 (4.2–100)
1. Absence of prolonged hunger 74.5 (13.1–100)
2. Absence of prolonged thirst 51.7 (3.0–100)
Good Housing 66.7 (37.0–100)
3. Comfort around resting 47.2 (0.0–100)
4. Thermal comfort 100 (100–100)
5. Ease of movement 100 (100–100)
Good Health 49.3 (30.0–78.8)
6. Absence of injuries 62.4 (21.3–97.2)
7. Absence of disease 51.3 (30.2–86.0)
8. Absence of pain induced by management proce‐
63.1 (20.0–100)
dures
Appropriate Behaviour 57.7 (17.0–90.8)
9. Expression of social behaviour 83.4 (21.5–100)
10. Expression of other behaviour 51.8 (0.0–100)
11. Good human‐animal relationship 60.8 (27.4–95.4)
12. Positive emotional state 84.7 (0.7–100)
Table A2. Normative threshold values (mean) given by 21 and 17 scientists in the two rounds of the Delphi survey (n =
12–17 with naming of threshold values for the single indicators) and 20 practitioners (n = 8–9 with naming threshold
values) and their comparison with the results of the on‐farm survey (n = 115, Quartile 1 and 3; Q = Quartile). Indicators
excluded from the final list are green formatted. Indicators added to the final list are green formatted.
Indicator Scientists Practitioners Farm Survey (n = 115)
with Naming of Threshold Val‐
ues
n = 12–17 n = 8/9 Q1 Q3 n
Mastitis: Cows with SCC >400,000/mL in milk1 % 8.4 21.8 10.1 19.0 106
Ketosis: Cows with milk fat‐protein‐ratio ≥1.5 within 100
% 14.1 17.6 8.6 17.4 106
days p.p.1
Rumen fermentation disorders: Cows with milk fat‐pro‐
% * * 4.0 10.8 106
tein‐ratioAnimals 2021, 11, 1570 18 of 20
data (cattle register data in Germany) according to Pannwitz [37] (n = 105). 5 See 4. Calf mortality was calculated from the 8th day of
life, as the data entries for the first week of life in the HIT‐database are not reliable due to the documentation requirements [37] (n =
105). * As the threshold query was made before the final indicator selection, there are some normative values missing.
References
1. European Commission. Special Eurobarometer 442: Attitudes of Europeans towards Animal Welfare; European Commission: Brussels,
Belgium, 2016.
2. European Food Safety Authority. The risks associated with tail biting in pigs and possible means to reduce the need for tail
docking considering the different housing and husbandry systems: Scientific Opinion of the Panel on Animal Health and Wel‐
fare. EFSA J. 2007, doi:10.2903/j.efsa.2007.611.
3. European Food Safety Authority. Effects of Farming Systems on Dairy Cow Welfare and Disease; Report of the Panel on Animal
Health and Welfare 3686; European Food Safety Authority: Parma, Italy, 2009.
4. De Jong, I.; Berg, C.; Butterworth, A.; Estevéz, I. Scientific report updating the EFSA opinions on the welfare of broilers and
broiler breeders. EFSA Support. Publ. 2012, 9, 295E. Available online: www.efsa.europa.eu/publications (accessed on 11 January
2021).
5. Bennett, R. The Value of Farm Animal Welfare. J. Agric. Econ. 1995, 46, 46–60.
6. Lusk, J.L.; Norwood, F.B. Animal Welfare Economics. AEPP 2011, 33, 463–483.
7. Harvey, D.; Hubbard, C. Reconsidering the political economy of farm animal welfare: An anatomy of market failure. Food Policy
2013, 38, 105–114.
8. European Commission. The Common Agricultural Policy at a Glance. 2020. Available online: https://ec.europa.eu/info/food‐
farming‐fisheries/key‐policies/common‐agricultural‐policy/cap‐glance_en (accessed on 11 January 2021).
9. Regulation (EU) No 1305/2013 of the European Parliament and of the Council on Support for Rural Development by the Euro‐
pean Agricultural Fund for Rural Development (EAFRD) and Repealing Council Regulation (EC) No 1698/2005. Off. J. Eur.
Union 2013, L347, 487–548.
10. European Commission. ESI Funds Open Data Platform. Available online: https://cohesiondata.ec.europa.eu/ (accessed on 12
December 2019).
11. European Commission. List of Potential Agricultural Practices That Eco‐Schemes Could Support; European Commission: Brussels,
Belgium, 2021.
12. Bergschmidt, A.; Renziehausen, C.; Brinkmann, J.; March, S. Application of the Welfare Quality® protocols for the evaluation
of agricultural policies. In Proceedings of the 6th International Conference on the Assessment of Animal Welfare at the Farm
and Group Level: WAFL, Clermont‐Ferrand, France, 3–5 September 2014; Mounier, L., Veissier, I., Ed.; Wageningen Academic
Publications: Wageningen, Netherlands, 2014; Volume 201.
13. Burton, R.; Schwarz, G. Result‐oriented agri‐environmental schemes in Europe and their potential for promoting behavioural
change. Land Use Policy 2013, 30, 628–641.
14. Farm Animal Welfare Council. Farm Animal Welfare Council Press Statement; Farm Animal Welfare Council: London, UK, 1979.
15. Fraser, D. Understanding animal welfare. Acta Veterinaria Scandinavica. In Proceedings of the Role of the Veterinarian in An‐
imal Welfare, Animal Welfare: Too Much or Too Little? The 21st Symposium of the Nordic Committee for Veterinary Scientific
Cooperation, Værløse, Denmark, 24–25 September 2007.
16. OIE—World Organisation for Animal Health. Terrestrial Animal Health Code. Introduction to the Recommendations for Ani‐
mal Welfare. Article 7.1.1. 2019. Available online: https://www.oie.int/en/what‐we‐do/standards/codes‐and‐manuals/terres‐
trial‐code‐online‐access/?id=169&L=1&htmfile=chapitre_aw_introduction.htm (accessed on 30 April 2021).
17. Keeling, L. (Ed.) An Overview of the Development of the Welfare Quality® Project Assessment Systems; Cardiff University: Cardiff,
UK, 2009.
18. The Welfare Quality Consortium®. Welfare Quality® Assessment Protocol for Cattle; The Welfare Quality Consortium®: Lelystad,
The Netherlands, 2009.
19. European Food Safety Authority. Panel on Animal Health and Welfare. Panel on Animal Health and Welfare (AHAW) Scientific
Opinion on the use of animal‐based measures to assess welfare of dairy cows. EFSA J. 2012, 10, 2554, doi:10.2903/j.efsa.2012.2554.
Available online: www.efsa.europa.eu/efsajournal (accessed on 11 January 2021).
20. Buttchereit, N.; Stamer, E.; Junge, W.; Thaller, G. Evaluation of five lactation curve models fitted for fat:protein ratio of milk and
daily energy balance. J. Dairy Sci. 2010, 93, 1702–1712.
21. Heuer, C.; Van Straalen, W.; Schukken, Y.; Dirkzwager, A.; Noordhuizen, J. Prediction of energy balance in a high yielding
dairy herd in early lactation: Model development and precision. Livest. Prod. Sci. 2000, 65, 91–105.
22. Cook, N.B.; Bennett, T.B.; Nordlund, K.V. Monitoring indices of cow comfort in free‐stall‐housed dairy herds. J. Dairy Sci. 2005,
88, 3876–3885, doi:10.3168/jds.S0022‐0302(05)73073‐3.
23. Winckler, C.; Willen, S. Reliability and repeatability of a lameness scoring system which may be used as an indicator of welfare
in dairy cattle. Acta Agric. Scand. 2001, 51, 103–107.
24. Windschnurer, I.; Boivin, X.; Waiblinger. S. Reliability of an avoidance distance test for the assessment of animals’ responsive‐
ness to humans and a preliminary investigation of its association with farmers’ attitudes on bull fattening farms. Appl. Anim.
Behav. Sci. 2009, 117, 117–127, doi:10.1016/j.applanim.2008.12.013.You can also read