The Dynamics of Inattention in the (Baseball) Field - DISCUSSION PAPER SERIES - IZA ...
←
→
Page content transcription
If your browser does not render page correctly, please read the page content below
DISCUSSION PAPER SERIES

IZA DP No. 14440

The Dynamics of Inattention in the
(Baseball) Field

James Archsmith
Anthony Heyes
Matthew Neidell
Bhaven Sampat

JUNE 2021
DISCUSSION PAPER SERIES

IZA DP No. 14440

The Dynamics of Inattention in the
(Baseball) Field

James Archsmith Matthew Neidell
University of Maryland Columbia University, NBER and IZA
Anthony Heyes Bhaven Sampat
University of Ottawa and University of Columbia University and NBER
Exeter

JUNE 2021

Any opinions expressed in this paper are those of the author(s) and not those of IZA. Research published in this series may
include views on policy, but IZA takes no institutional policy positions. The IZA research network is committed to the IZA
Guiding Principles of Research Integrity.
The IZA Institute of Labor Economics is an independent economic research institute that conducts research in labor economics
and offers evidence-based policy advice on labor market issues. Supported by the Deutsche Post Foundation, IZA runs the
world’s largest network of economists, whose research aims to provide answers to the global labor market challenges of our
time. Our key objective is to build bridges between academic research, policymakers and society.
IZA Discussion Papers often represent preliminary work and are circulated to encourage discussion. Citation of such a paper
should account for its provisional character. A revised version may be available directly from the author.

 ISSN: 2365-9793

 IZA – Institute of Labor Economics
Schaumburg-Lippe-Straße 5–9 Phone: +49-228-3894-0
53113 Bonn, Germany Email: publications@iza.org www.iza.org
IZA DP No. 14440 JUNE 2021

 ABSTRACT
 The Dynamics of Inattention in the
 (Baseball) Field1
 Recent theoretical and empirical work characterizes attention as a limited resource that
 decision-makers strategically allocate. There has been less research on the dynamic
 interdependence of attention: how paying attention now may affect performance later. In
 this paper, we exploit high-frequency data on decision-making by Major League Baseball
 umpires to examine this. We find that umpires not only apply greater effort to higher-
 stakes decisions, but also that effort applied to earlier decisions increases errors later. These
 findings are consistent with the umpire having a depletable ‘budget’ of attention. There is
 no such dynamic interdependence after breaks during the game (at the end of each inning)
 suggesting that even short rest periods can replenish attention budgets. We also find that
 an expectation of higher stakes future decisions leads to reduced attention to current
 decisions, consistent with forward-looking behavior by umpires aware of attention scarcity.

 JEL Classification: D83, D91
 Keywords: rational inattention, dynamic decision-making, cognitive
 capital, decision fatigue, bounded rationality, behavioral
 economics

 Corresponding author:
 Matthew Neidell
 Department of Health Policy and Management
 Mailman School of Public Health
 Columbia University
 722 W. 168th St.
 New York NY 10032
 USA
 E-mail: mn2191@columbia.edu

 1
 We thank Stephen Coussens, Jonathan Guryan, Devin Pope and seminar participants at the University of
 Connecticut for comments on an earlier draft.
1. Introduction
 A growing body of evidence suggests that people don’t pay full attention to each of the
35,000 individual decisions they make daily.2 Instead, since attention requires costly effort,
people allocate it strategically to the more important decisions. Whereas evidence abounds to
support inattention in a static setting, much less exists about the dynamic allocation of attention,
particularly in a field setting.
 In this paper, we extend upon recent theoretical work on the dynamics of attention, which
typically focuses on lags in reacting to novel information (e.g. Gabaix 2019), to consider
attention as a depletable stock that may be rationally managed. That is, we consider the direct
impact from paying attention at one point in time on attention paid at other points in time. This
opens up questions about the intertemporal allocation of attention: How does application of
effort to one decision affect the quality of subsequent yet otherwise independent ones? Does a
hiatus from decision-making reset the stock of attention? How does the anticipation of the need
to make difficult decisions in the future affect the current allocation of attention?3
 We explore these dynamics of inattention in a data-rich, high-stakes, field environment by
focusing on the decisions of home plate umpires from Major League Baseball (MLB). The MLB
umpire setting is useful for examining these issues for several reasons. First, we can
operationalize attention through observing not just an umpire’s decision, but also a measure of
the quality of the decision. Data from camera-technology in MLB stadia provide information on
the objectively correct ruling for each decision. Under the (mild) assumption that the greater
attention devoted to a decision increases the probability of a correct outcome, we can infer how
umpires vary the effort applied to specific decisions. That is, when umpires make correct
decisions, we infer they paid more attention than if they called it incorrectly, all else equal.
 Second, the importance of decisions varies over time. We call the importance of each
decision “leverage,” defined as how pivotal any particular umpiring decision is in influencing the
game outcome.4 Leverage varies substantially across the course of a game, evolving as a function
of players’ actions and chance events. If the importance of a decision increases the value of

2
 The 35,000 figure is from Erwin (2019). The exact number of decisions is not important, but rather that it is a large
number. Thank you for deciding to read this footnote.
3
 Such anticipation may explain why individuals take forward-looking actions to conserve cognitive capital, e.g. why
Mark Zuckerberg and Barack Obama wear the same outfit every day (Baer, 2015).
4
 The term “leverage” is commonly used in statistical analysis of baseball to capture how important a particular
moment is to the outcome of the game.

 2
paying attention, and umpires were allocating attention strategically, we would expect umpires to
make more correct calls as leverage increases, all else equal.
 Third, in a typical game, a home-plate umpire makes around 120 distinct decisions in
approximately three hours. The number of decisions, along with the varying stakes associated
with each, allows us to explore the dynamic interdependence of attention. To test the idea of
attention as a depletable stock, we examine how umpires’ prior allocations of attention affect
contemporaneous expenditure. Moreover, we explore whether attention can be replenished after
short, externally-imposed periods of rest. To test for forward-looking behavior, we examine
whether umpires’ anticipation of future attention needs leads them to conserve it now.
 Finally, rich data are available. We exploit data on the more than 3 million decisions made by
127 home-plate umpires in 26,523 games between 2008 and 2018, enabling us to control for a
wide set of potential confounders. The large sample allows for precise estimates even from
econometric specifications that include game fixed effects that control for time-invariant
characteristics of the umpire, the teams involved in the game, and the date of the game. We
flexibly control for time elapsed, allowing us to separate the effects of decision fatigue from
physical fatigue associated purely with passage of time. In addition to decision accuracy, our
data includes an array of characteristics for each pitch thrown (pitch speed, type, location, and
movement) that allow us to control in detail for the complexity or difficulty an umpire faces at
any moment.
 Contrary to conventional models of decision-making that predict that errors are random and
therefore uncorrelated with leverage, our results reject the prediction that umpires exert equal
effort to all decisions. We find that umpires adjust the attention paid to a decision in response to
the importance of the decision; a one standard deviation increase in the leverage of a decision
increases the likelihood of a correct call by 0.61% -- equivalent to improving the accuracy of the
median umpire to that of the 73rd percentile umpire. This finding supports the concept of rational
inattention: umpires allocate more attention when the benefits from doing so increase.
 We also find that periods of higher leverage in the past lead to less contemporaneous
attention even with controls for current leverage. A one standard deviation increase in past
leverage reduces the probability of a correct decision by 0.32%. This is equivalent to reducing
the accuracy of the median umpire to that of the 45th percentile umpire. This finding is consistent
with a model of a depletable budget of decision resource, such that more attention devoted to one

 3
decision depletes availability for subsequent decisions, i.e., it increases the marginal cost of
subsequent attention.
 However, short respites in the decision series – which are provided by the break that the
structure of the game gives the umpire between each half-inning – reset the process.5 Higher
leverage in previous innings has no discernible effect on attention to current decisions. While it
is intuitive that rest would increase productivity in a physical work setting, for example because
of muscle fatigue, it is less obvious how the design of shift patterns and work breaks might
impact overall performance in cognitively-intensive workplaces. Our results suggest breaks
allow for replenishment of cognitive capital.
 Further, we provide evidence consistent with forward-looking behavior by umpires. A
rational expectation of having to deal with higher leverage (more important) decisions in the
future of the decision series leads to reduced attention to current decisions. More concretely, an
increase of one standard deviation in expected future leverage in the half-inning reduces the
probability of a correct decision by 0.49%; equivalent to reducing the accuracy of the median
umpire to that of the 39th percentile umpire. Just as an athlete in a physical endeavour might
conserve her energy for late in a game when she anticipates it might be particularly valuable, our
subjects conserve cognitive budget by relaxing on current calls when they expect higher stakes
decisions to come later.
 Taken together, these findings significantly extend existing evidence on rational inattention in
several ways. The central static prediction of rational inattention models is that agents allocate
more attention to more important decisions. Laboratory and field studies find that intensity of
attention is increasing in the importance or stakes associated with a decision across a range of
settings. Examples in the field include consumer purchases of durable goods (Allcott and Wozny,
2014; Levav et al, 2010), investor responses to earnings announcements (Dellavigna and Pollett,
2009), consumer reactions to tax rates (Chetty et al 2009), hiring decisions (Acharya and Wee,
2020) and information acquisition in the rental housing market (Bartos et al, 2016) to name a few.
The first of our results adds to this evidence in the context of an adjudicator whose decision directly

5
 In baseball an inning is the basic unit of play and a game typically comprises nine scheduled innings. Each inning
is divided into two half innings. In the “top” half the visiting team bats until three outs are made. In the “bottom”
half the home team bats until three outs are made. The umpire receives a scheduled break between each half inning
as the teams reset their positions.

 4
affects the outcomes of others: the attention that an umpire applies to any decision is increasing in
the leverage of that decision.
 Our results on the dynamics of attention are more novel. As already noted, an appealing
feature of the baseball setting is that we observe our subjects making a long sequence of
decisions within a contained period. This allows us to explore both backward- and forward-
looking responses in a field setting for the first time, to the best of our knowledge.6 Our results
generally support ‘budget-of-attention’ models (Dragone, 2019; Gabaix et al., 2006) in which
there is a linkage between decisions in a series through the (endogenous) evolution of the
remaining stock of attention. Effort exerted at one decision moment is expected to influence
optimal attention allocation in a subsequent decision, conditional on the importance of that later
decision. Broadly consistent with this framework, we find both prior high leverage decisions and
rationally-anticipated future high leverage reduce attention to current decisions.7 The latter is in
contrast to the experimental assumptions of, for example, Levav et al (2010), who interpret
consumer choices in the sequence of (mentally-taxing) decisions required to configure an
automobile under the assumption that “consumers are partially myopic in their allocation of
mental resources. Instead of distributing their mental effort efficiently across the configuration
process … (they) behave as if the current decision in a sequence is practically their last, despite
the fact that in our experiments it is obvious that subsequent decisions will follow.” (page 276).8

6
 The closest laboratory experimental evidence is that presented by Gabaix et al (2006). In their set-up subjects face
an open-ended series of choices between pairs of goods and given a fixed time budget (25 minutes). Collecting
information about a pair of goods (by clicking on boxes using the ‘Mouselab’ technology) allows for a better
decision in that round but depletes budget of time available to devote to future rounds. “Our experimental design
also allows us to evaluate how subjects allocate scarce search time between games …” (Gabaix et al, 2006: 1062).
They find that subjects devote more effort to higher value rounds, but also show increased propensity to stop
analyzing the current game as the remaining budget of decision time diminishes.
7
 If an umpire anticipates that paying high attention to one decision negatively impacts subsequent, perhaps more
important, decisions, he will optimally conserve attention by strategically ‘allowing’ more errors in the present. An
analogy would be a soccer player conserving physical effort early in a game to apply to possibly more important
game situations later. Most readers likely have no objection to the idea that a sportsperson would seek to allocate a
limited budget of physical energy across time, rather than working flat out at every moment. Our results suggest
umpires engage in the same sort of strategic allocation of cognitive effort.
8
 An important feature of our setting shared by Levav et al (2010) is that they have a proxy for decision complexity,
namely the number of options among which the consumer is required to choose at any stage of the customization
process. They show, contrary to predictions of conventional choice theory under unlimited attention, that the vehicle
ultimately configured by the consumer is sensitive to the (experimentally-manipulated) order in which decisions
over options are required. If complex decisions are posed early in the sequence, a consumer is more likely to revert
to reliance on heuristics, such as accepting the default, later. Apart from being a large-sample field setting, an
additional advantage of the environment that we study is that we have an exact measure of decision quality, whether
the ‘right’ decision is made, whereas the utility-maximising specification of vehicle is not observed.

 5
Our finding that prior decisions affect current ones is consistent with predictions and
evidence from the related “ego depletion” literature: the quality of decisions deteriorates with the
number of decisions made (Baumeister et al 1998). There are numerous studies on decision
fatigue from healthcare (Linder et al, 2014; Philpot et al 2018; Chan et al 2009; Kim et al 2015),9
financial forecasting (Hirshleifer et al, 2019), voting behavior (Augenblick and Nicholson,
2016), consumer science (Bruyneel et al, 2006)), manuscript evaluation (Kwan et al, 2016) and
air traffic control (Orasunu et al, 2012). However, our study goes beyond this by not only
showing fatigue arising as a function of the cumulative number of decisions made, but by
explicitly analyzing the importance of the decision, which we have already established impacts
the effort exerted, as contributing to fatigue. Our findings therefore point to the depletion of
attention capital stock as depending not only on the cumulative number of decisions made but
also their qualitative characteristics.
 Moreover, our forward-looking results point to the anticipation of ego depletion playing an
important role in the decision-making process. Subjects act in a way consistent with being aware
that their attentional capital is depletable, and attempt to conserve it for later decisions –
particularly where future decisions are rationally expected to be high stakes. This provides the
first evidence of a further level of rationality and sophistication with which agents manage their
expenditure of attention when faced with a series of mental tasks of varying challenge and
importance.
 We proceed as follows. In next section we provide basic background on MLB umpires,
including what they do during a game, the incentives they face, and how we measure
performance. In Section 3 we describe the basic dataset, provide basic summary statistics, and
motivate and describe how we operationalize “leverage,” our measure of decision importance.
Section 4 provides an overview of the basic econometric approach. In Section 5, we present our
main results, including a battery of robustness checks. Section 6 concludes.

2. Background
 Baseball umpiring is a skilled job, requiring sustained mental effort. We study professional
umpires operating at the highest level of the game, Major League Baseball. The ballparks where

9
 See however Zheng et al (2020) for evidence to the contrary.

 6
they work are dispersed across many of the major cities of the United States, plus Toronto. MLB
as an organization employs around 100 umpires in any given season, organized into “crews” of
four, with each serving as the home plate umpire every fourth game. Umpiring at this level is a
lucrative and competitive career, with an experienced umpire commanding a base salary of
$350,000 per season, which can be supplemented by post-season assignments and writing and
speaking engagements for the high performers.
 The most significant task that the home plate umpire faces in his working day is “calling” the
game: deciding which pitches are balls and which are strikes. A pitch should be called a strike if
any portion of the baseball passes through the strike zone (see Figure 1), and a ball otherwise.10
The accuracy of the adjudications is fundamental to the game. We use whether a call is correct as
our measure of decision quality.
 In an average game, an umpire makes calls on around 120 pitches. We observe the umpire’s
decision as well as the objectively correct call. We obtained the latter from a high-precision
pitch-tracking technology called PITCHf/x which has been in operation at every MLB ballpark
since 2008. The output of the PITCHf/x camera system will be familiar to baseball watchers
since it forms the basis for the real-time on-screen pitch location graphic used in television
broadcasts of games. Researchers have used the same data as a testbed for other hypotheses,
including racial discrimination (Parsons et al, 2011), the effect of status on evaluations and the
so-called “Matthew Effect” (Kim and King, 2014), the gambler’s fallacy (Chen et al, 2016), how
decision quality is affected by exposure to air pollution (Archsmith et al, 2018) and as a test of
models of strategic interaction (Bhattacharya and Howard, Forthcoming).
 Figure 1 presents a spatial scatterplot of the true locations of pitches upon which the umpire
had to make a call in one game, as generated by PITCHf/x. Correct and incorrect calls are the
hollow and solid black shapes, respectively. Umpires make both Type 1 and Type 2 errors. A
solid triangle in the plot denotes a pitch that passed outside the zone that an umpire erroneously
called a strike. A solid circle indicates that a pitch passed through the zone, but the umpire called
it a ball. Not surprisingly, only pitches close to the strike zone boundary are called incorrectly.
 [Figure 1 About Here]

10
 If the pitcher throws three strikes, the batter is considered out (a “strike out”). If the pitcher throws four balls, the
batter advances to first base (a “walk”, or “base on balls”).

 7
The incentive for umpires to make correct calls is substantial. MLB operates a stringent system
of monitoring and incentives for its umpires, called the Supervisor Umpire Review and Evaluation
(SURE) system. This system uses various sources, including evaluations and on-site supervisors,
to track the performance of umpires (Drellich, 2012). More generally, in the PITCHf/x era umpire
errors are easily observed by a wider audience. As such, an umpire’s reputation is plausibly highly
sensitive to how often he makes mistakes, especially at those important (high leverage) moments
in games when players, fans and the media are paying the most attention.

3. Data
 We compile data to reconstruct the decision environment and outcomes faced by MLB
umpires during professional baseball games. Our primary data are based on detailed information
from actual games. We augment these data with a calculation of decision leverage and the
outcomes of additional simulated games. Below, we describe each data source in detail.
3.1 MLB Pitch Data
 Following Archsmith et al (2018) we compile data on the details of every pitch in all MLB
games from 2008 to 2018 from the MLB website. These data are reported as part of MLB’s
PITCHf/x tracking system. Game-level data include variables for the home and away team,
venue, the umpires and their position on the field, starting time, starting weather conditions,
game attendance, and total runs scored by each team. Pitch-level data include identity of the
players on the field and their position (including the pitcher, batter and catcher), attributes of the
game situation (current runs by each team, inning, inning part, baserunner positions, outs, balls,
and strikes), attributes of the pitched ball, the location of the pitch as it crosses home plate, and
the result of the play after the pitch, including the umpire’s ball/strike call if one was made.
 Given that the ending of a baseball game is endogenous – a game can go into “extra innings”
if the score is tied at the end of “regular innings” – we choose to focus our samples on only the
pitches in the regular innings.
3.2 A measure of decision importance
 Our empirical analysis investigates whether MLB umpires expend more effort to make
correct decisions when the stakes of that decision are large. Doing so requires an objective
measure of the stakes of each decision. To this end, we adapt the concept of leverage (a term

 8
already used in baseball to refer to the importance of a game situation) to specific pitch-level
ball/strike decisions of MLB umpires.
 Leverage is a scalar metric that assigns large values to important or pivotal moments in
sporting events. For example, a decision or action that breaks a tie late in a game will have a
much larger impact on the probability of winning than breaking a tie early in the game because
the opposing team has fewer chances to equalize the score. We define leverage for a given pitch
as the absolute difference in the probability the home team wins in the situation where the
umpire calls a “ball” and the situation where the umpire calls a “strike”. 11 The stakes can change
substantially from pitch to pitch, and umpires can make independent decisions at each pitch over
the level of effort to expend on adjudicating it correctly.
 This leverage metric captures the umpire’s state of incomplete information at the time each
decision is made. The umpire knows the current situation of the game, but future events
impacting the outcome of the game (many beyond the umpire’s control) are unknown. Thus,
computing this leverage measure requires determining two expected probabilities: the probability
the batting team wins given a “strike” call and the probability they win given a “ball” call,
conditional on the current situation in the game. In each case, we assume events in a baseball
game follow a Markov process with state At encompassing the game situation at pitch t.
 We estimate leverage using probabilities derived from simulated MLB games. By simulating
the evolution of a large number of games, we can compute win probabilities for states that occur
infrequently in the available history of baseball games at the cost of additional assumptions over
the evolution of game states. There are four basic steps in the simulation (see the appendix for
details):
 1. We define the state of the game by the number of outs, baserunner positions, strikes, and
 balls.
 2. Using actual MLB data, we compute the probability of transitioning from given states to
 new states plus new runs scored. We compute these state transitions within each half-
 inning.

11
 Unlike many other sports, the rules of regular- and post-season MLB games prohibit games that end in draws.
Therefore, the probability the away team wins conditional on some game situation A is simply one minus the
probability the home team wins given that situation. Likewise, umpire decisions of “ball” versus “strike” are
mutually exclusive and collectively exhaustive when an umpire adjudicates a pitch. As such changing the team for
which we compute leverage or whether “ball” is subtracted from “strike” would result in an identical leverage
metric.

 9
3. Using these probabilities, we simulate 5 million MLB games from start to finish,
 collecting the states observed in each half-inning of a game and the eventual winner. This
 information is used to compute the probability the home team wins conditional on a given
 state.
 4. Using these win probabilities, we compute a leverage measure for each situation using
 the same method as the measure based on actual game data.
The appendix also examines robustness of our results to an alternative approach to calculating
leverage, using actual game outcomes.
3.3 Past and Future Leverage
 We also consider the impact of accumulated past and expected future leverage. Past leverage
is simply the sum of the leverage measure for all past pitches during the current inning. Expected
future leverage is computed from simulated baseball games.12 For each possible game situation
and across all simulated games, we compute the leverage for all future pitches in that inning.
Expected future leverage is the mean future leverage across all times that situation occurred.
3.4 Summary Statistics
 Table 1 shows game-level summary statistics. We have data on 26,536 games, with an
average of 291 pitches per game. Of these, about 120 pitches are “called,” meaning they are
subject to umpire discretion. This leaves about 3.2 million observations where the umpire makes
a call about a ball in flight. Table 2 shows summary statistics for these pitches on the full sample
(column 1), the final regression sample (column 2), and then further limits the latter to decisions
in the first inning (column 3) and ninth inning (column 4). On average, umpires call 84 percent
of pitches correctly.
 The main explanatory variable in our analyses is leverage. In theory, leverage ranges from 0
to 1, but the average leverage at any point in the game is low (0.014) because any single pitch
generally has a small effect on the outcome of the game. Note that columns 3 and 4 show that
average leverage increases throughout the game, as later decisions are more impactful on the
final outcome. However, even the 99th percentile value of leverage is small (.08). Past and future

12
 Here simulated games are essential since even situations which are overall unlikely –and not frequently observed
in the 11 years of available data – may have a relatively large probability of occurring conditional on the current
state and thus influence the umpire’s expectation over future leverage.

 10
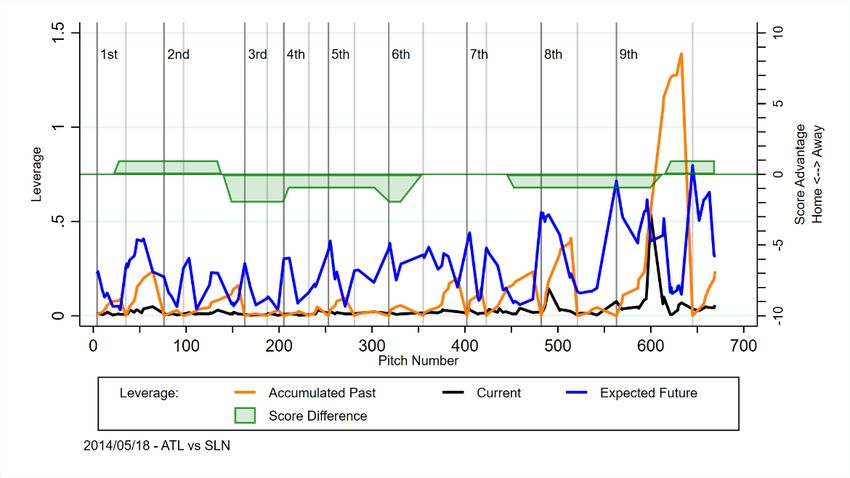
leverage are higher than current leverage because they capture the accumulation of leverage
within a half-inning.
 [Table 1 about here]
 [Table 2 about here]
 To illustrate our leverage measures, Table 3 provides specific examples of current and
future leverage. For example, the 50th percentile of current leverage, measured as .0097,
corresponds to a situation where there are 2 outs, 0 balls, 2 strikes, a runner on 3rd base, with the
home team leading by 3 runs in the bottom of the 6th inning. The value of .0097 is the difference
in the probability the home team wins if the umpire calls a “ball” as compared to when the
umpire calls a “strike.”
 [Table 3 about here]
 A potential concern with our measure of future leverage is that it lacks independent
variation from current leverage. That is, if current leverage reflects not only the current situation
but also future possibilities, then future leverage may be highly correlated with current. Figure 2,
which presents a scatter plot of the two, shows ample independent variation in the two measures
of leverage, suggesting multicollinearity will not be an issue for our analyses.
 [Figure 2 about here]
 Likewise, Figure 3 shows the evolution of the leverage metrics over time through one
particular MLB game. Current leverage is highest toward the ends of games with close scores,
particularly in crucial situations. Accumulated leverage is highest after these critical situations,
even if the current leverage is low. Expected future leverage generally increases over the course
of the game and tends to peak as the game approaches critical junctures.
 [Figure 3 about here]
4. Methods
 Our goal is to investigate the relationship between the effort an umpire expends on correctly
adjudicating a decision and the leverage of the decision. We estimate this relationship using a
linear regression for each pitch p in game g as follows:13
 −1 ∞

 ( ∗ = ) = ( ) + ∑ + [ ∑ ] + + + +

 =1 = +1

13
 We estimate these regressions using the reghdfe package from Correia (2014).

 11
Where ∗ is the decision of the umpire, is the correct call given the point at which the pitch
crossed home plate, ( ) is the leverage in the situation where pitch p is thrown, is a vector
of continuous (such as velocity or rate of spin) and discrete (such as an indicator for fastballs or
curveballs) controls for pitch attributes, is fixed effect for each inning, is a game fixed
effect, and is an idiosyncratic error potentially correlated within games.14 The parameters of
interest are , the coefficient on the current pitch leverage, the coefficient on accumulated
past leverage, and the coefficient on future leverage expected prior to adjudicating the current
pitch. Given our definition of leverage, we interpret β as the effect of a change in win probability
for the home team, conditional on the game situation, on the probability of the umpire making a
correct call.
 Our use of game fixed effects controls for many unobserved factors. Specifically, these
fixed effects control for all time invariant characteristics of the umpire, the teams that are
playing, the venue of the game, and the date and time of the game. This will control for features
like a game between two rivals, a venue more amenable to home runs, or a hot day. With game
fixed effects, we are exploiting how leverage within a game affects correct calling within the
same game. This enhances our ability to interpret βc, βp, and βf as causal parameters.
 Although this approach controls for many time invariant components, there may be
factors varying within the game that affect umpires’ focus, such as physical fatigue and player
changes. We include inning fixed-effects ( ) to control for physical fatigue as the game wears
on, enabling us to separately identify the effects of decision fatigue. Teams may change pitchers
in later innings as the starting pitcher tires or the situation calls for a particular pitcher. These
relief pitchers often have different pitching styles than the starter, and these different styles may
affect the umpires’ ability to make correct calls.15 To account for such factors, in some
specifications we control for various pitch attributes in the vector X. A potential concern with
this approach is that pitch attributes may be endogenous, or “bad controls” (Angrist and Pishke,

14
 Following Archsmith et al (2018) and Kim and King (2014) we control for all pitch attributes reported in
PITCHf/x using linear controls for continuous attributes and fixed effects for discrete attributes. Unlike previous
work, there is substantial within-game variation in our variable of interest and we can identify our parameters of
interest relying on only within-game variation using game fixed effects. However, variation in leverage is driven by
the game situation, so we do not control for game situation variables which define the state space for our leverage
metric.
15
 For example, relief pitchers are likely to throw more fastballs relative to breaking balls, and fastballs are easier for
an umpire to adjudicate.

 12
2008). Because of this, our preferred specification excludes controls for pitch attributes.
However, we report results of a specification including pitch controls in Section 5.3.
 For defining past and future leverage, we accumulate leverage measures within the same half
of an inning. For example, for a game in the top of the third inning, imagine we are at the 5th
pitch in the inning. Past leverage is the sum of the contemporaneous leverage from the first four
pitches in the inning. Future leverage is the expected sum of leverage for all remaining pitches in
the inning. As we move forward to the 6th pitch, past and future leverage update to include the 5th
pitch. Given that the effects from past leverage may extend beyond the current inning, we also
include past leverage from previous innings. The existence of a two minute break between
innings enables us to explore whether the umpires stock of attention is replenished by a short
respite.

5. Results
5.1 Main Results
 Our main results are shown in Table 4. The first column reports results from our estimating
equation in which our measure of past leverage is from the current inning only, with the next
column adding the lag of past leverage. We exclude data from the first inning to keep the sample
of pitches we explore fixed.16 All coefficients are multiplied by 100 to improve readability. In
general, we contemporaneous leverage increases umpires’ attention, while past and future
leverage decreases it.
 [Table 4 about here]
 Focusing on the effect of contemporaneous leverage on umpires’ attention, we find
estimates consistent with our hypothesis that higher leverage increases umpire attention. Our
estimate of 38.223 indicates that increasing leverage from 0 to 0.013, the mean leverage in our
sample, increases the probability that the umpires makes the correct call by .0051, a 0.61 percent
increase. This estimate is highly statistically significant, with a 95% confidence interval of
[0.55%,0.67%]. Adding additional lags of past leverage scarcely affects the coefficient on
contemporaneous leverage.

16
 The sample size changes slightly due to missing or inconsistent game situation data from PITCHf/x that affects
our ability to calculate leverage.

 13
Turning to the effect of past leverage, we find evidence consistent with a hypothesis of a
depleted attention budget. As umpires face more leverage earlier in the inning, this decreases
their attention on the current call. The estimate of -3.26 indicates that moving accumulated past
leverage from 0 to 0.064, the mean of past leverage, decreases current call accuracy by 0.209
percentage points, which is a 0.248 percent change. This estimate is also highly statistically
significant with a 95% confidence interval of [-0.289%,-0.207%].
 As we include lags of leverage to our specification, two patterns emerge. One, the
estimate on the past leverage of the current inning is unaffected. Two, the effect of past inning
leverage is very small, coming in several orders of magnitude smaller than the current inning,
and statistically insignificant. (These patterns hold true when we include additional lags of
leverage.) These results imply that umpires refocus their attention after a short respite,
suggesting that while our attention is scarce, our budget can replenish quickly.
 Next, we focus on future leverage. Our estimates are again in line with our theoretical
prediction: higher future leverage decreases current attention. Our estimate of -3.575 indicates
that changing future leverage from 0 to 0.167, the mean of future leverage, increases an umpires’
likelihood of a mistake by .060 percentage points, a 0.71 percent change. This estimate is also
insensitive to further controls for lagged leverage and highly statistically significant, with a 95%
confidence interval of [-0.792%,-0.628%].17
 The inning dummy variables, which at least partially control for physical fatigue over the
course of the game, also indicate an interesting pattern. Except for the last inning, we see fairly
modest changes in umpire performance as the game wears on. Changes in a correct call vary
between 0.05 to .1 percentage points compared to the second inning (the reference category),
though with no clear pattern of physical fatigue throughout the majority of the game.18 This
suggests umpires are fairly consistent in their performance over the course of the game.
However, in the last inning umpire performance drops by 0.39 percentage points. Since we
control for leverage, this drop at the end of the game does not reflect the erosion of the
importance of calls later in games.

17
 Estimating this and all other models excluding data from the ninth innings does not substantially disturb any of
our results.
18
 We omit inning 1 to allow inclusion of a lagged measure of past leverage.

 14
5.2 Additional Results
 In the next table, we explore how the effect of leverage varies within the game by estimating
the effects separately by inning.19 We find the same general pattern of results in every inning for
our three measures of leverage, but find some interesting trends within the game. We did not
derive specific hypotheses for these patterns, so we only speculate about potential explanations.
 [Table 5 about here]
 As the game wears on, the effect of current leverage on umpire attention steadily decreases,
though it always remains positive. By the 9th inning, the effect of contemporaneous leverage is
nearly 30% the size of the effect in the 3rd inning. The difference between these two estimates is
statistically significant; further, the general decrease in the coefficient suggests an important
trend. A possible explanation is that the umpire fatigues as the game goes on and is less able to
regain focus for an equally important call later in the game.
 In terms of the dynamics of leverage, we consistently find negative and statistically
significant effects for past and future leverage, with the effect size steadily diminishing over
time. While there are some trends across innings, in general the results by inning support our
main results.
5.3 Robustness
 In Table 6 we explore whether our results are robust to a range of alternative regression
controls. First, in column 1 we repeat our preferred specification. The difficulty of an umpire’s
decision may depend on characteristics of the pitch in flight, such as velocity, spin, or trajectory.
One concern is these attributes are a result of what type of pitch a pitcher decides to throw,
which is decided after leverage is determined for a given situation. Thus, pitch attributes are
effectively simultaneously determined with leverage, and could qualify as “bad controls”
(Angrist and Pishke, 2008). Despite this concern, when we add controls for all pitch
characteristics20 to our primary specification, shown in column 2, our estimates move only
slightly.

19
 We estimate leverage effects by inning within a joint regression framework over the full sample to constrain the
game fixed effects to be identical across innings.
20
 We use continuous, linear controls for all continuous pitch attributes and indicator variables for all discrete
attributes in the PITCHf/x data. Specifically, the continuous attributes are the position of the ball when released by
the pitcher (along horizontal, vertical, and distance from home-plate axes), the ball’s direction of spin, rate of spin,
angle of break and distance of break (measured in both horizontal and vertical axes) and the velocity of the ball
when it crosses home plate. The discrete attributes are indicators for the pitch type.

 15
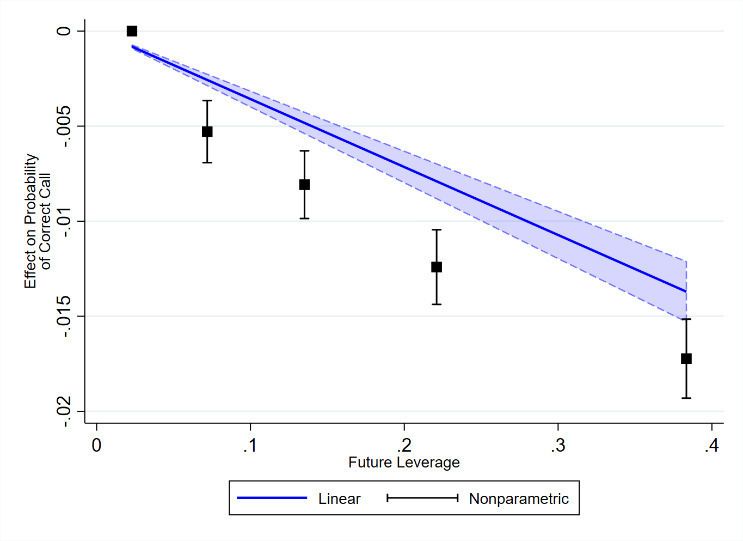
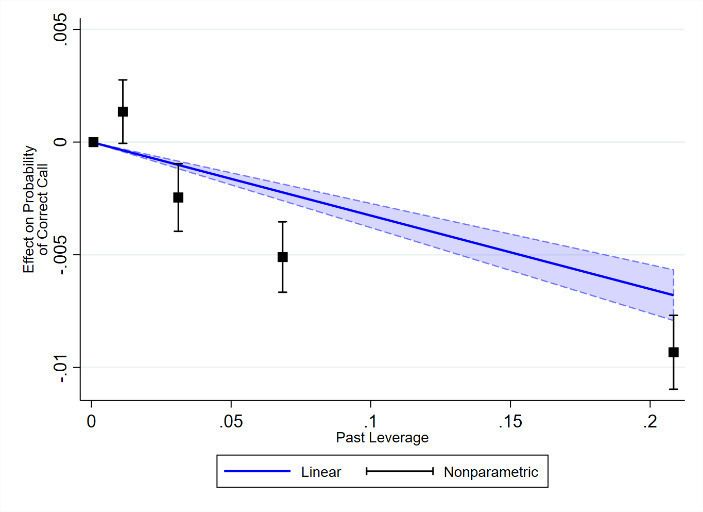
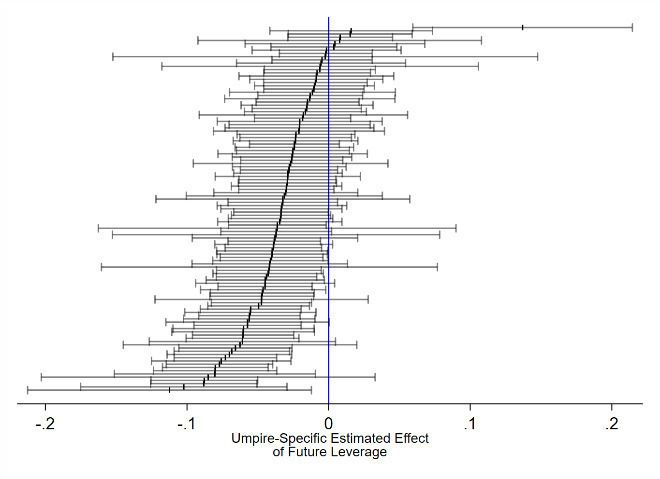
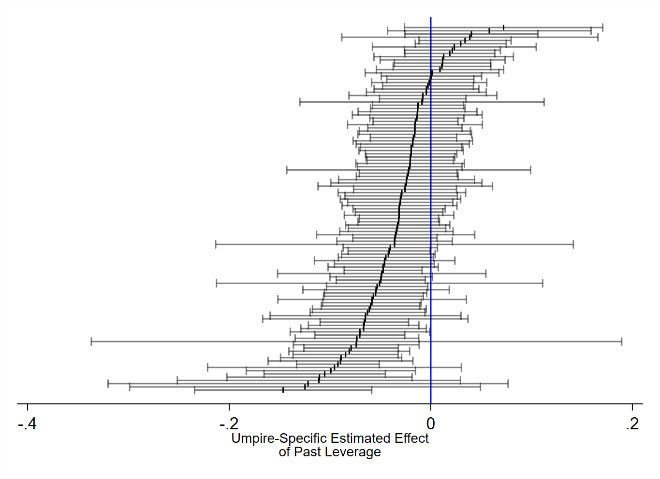
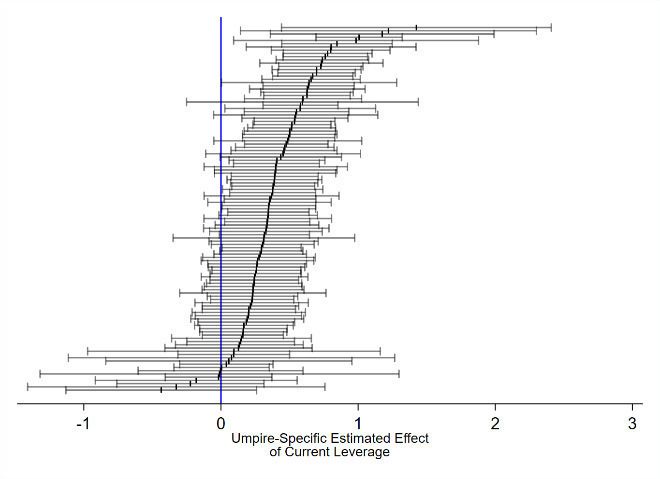
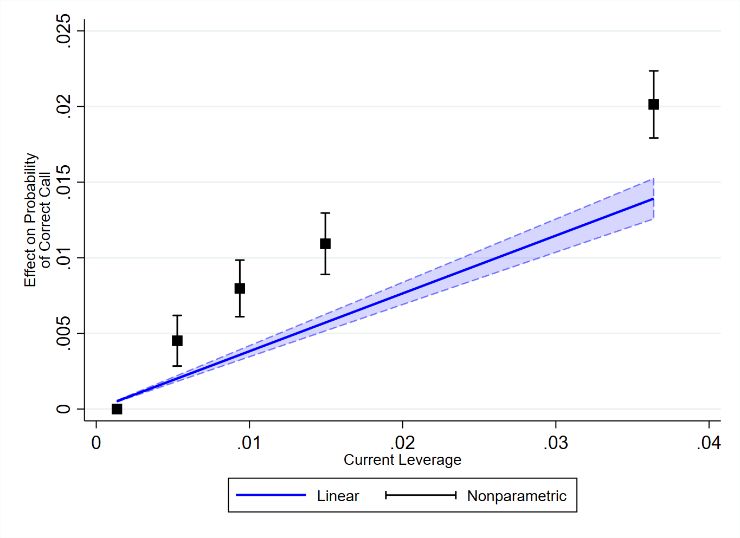
Our primary specification, by including game fixed effects, identifies the effect of leverage
on decision accuracy from within-game variation. In columns 3 and 4 of Table 5, we allow for
identification across games, while still accounting for potentially confounding heterogeneity, by
replacing game fixed effects with umpire, home team, away team, and date fixed effects (column
3) and umpire, home team, away team, year, month-of-year, and day of week fixed effects
(column 4). Estimated effects of leverage are essentially unchanged in this specification.
 Finally, it is possible individual players may be more likely to be included in high-leverage
situations and may take actions which increase the difficulty of an umpire’s decisions. In column
5 we add fixed effects for players in each of the three positions that directly participate in this
component of the game: the pitcher, the batter, and the catcher. Again, the empirical estimates
are very similar to those from our primary specification.
 [Table 6 about here]
 Our preferred specification assumes a linear relationship between each of our leverage
measures and its impact on the probability of a correct call. To relax this assumption, we
estimate a model that more flexibly controls for past, current, and future leverage. For each of
the leverage measures, we divide the observed values into quintiles of equal size and replace our
linear leverage measures with indicators for these quintiles.21 Results for each leverage measure
are shown in Figure 4. Results from this more flexible specification reveals an approximately
linear relationship with effect sizes that are similar, if not slightly larger in magnitude, to the
parametric specification from Table 4.22
 [Figure 4 about here]
5.4 Heterogeneous Effects
 We further explore heterogeneity in how individual umpires allocate effort by estimating
umpire-specific leverage effects. Extending the regression specification from Table 4 Column 1,
we interact each leverage measure with indicators for every umpire in a single regression.23 The
estimated effects for each umpire are shown in Figure 5. Panels (a) – (c) show the effects for
past, current, and future leverage, respectively. In each panel, umpire specific effects are ordered

21
 For each leverage measure we treat the first quintile as the omitted category.
22
 We observe similar results if we increase or decrease the number of quantiles used.
23
 To improve precision, we exclude umpires who are observed to serve as home plate umpire in fewer than 20
games during our sample. The median umpire served as home plate umpire in 240 games during this period. This
restriction removes 14 of the 127 umpires or 132 of the over 26,000 games from the sample.

 16
from largest at the top and smallest at the bottom. For nearly all umpires, the estimated treatment
effects are of the same sign as our main results, with a large portion being statistically significant
at the 95% level despite the large increase in model parameters. These results suggest that very
few, if any, umpires deviate from our main findings about dynamic inattention.
 Panel (d) of Figure 5 combines the past, current, and future leverage estimates for each
umpire into a single figure. Here, effects for a given umpire are aligned horizontally and ordered
by the that umpire’s estimated current leverage effect. For comparability, each leverage effect is
divided by its standard deviation across all umpires. Lines show the moving average of each
leverage effect across the 10 umpires above and below each observation. Umpire-specific effects
for past and future leverage are negatively correlated with the current leverage effect.24 Some
individuals are highly responsive to high-leverage situations, appearing to expend substantial
effort when decision stakes are high. These same individuals tend to exhibit larger decreases in
accuracy from accumulated past and expected future leverage. This result is broadly consistent
with umpires maintaining a budget for attention; umpires who expend more effort on high-
leverage decisions will need to conserve more effort in other situations to maintain their budget.
6. Conclusions
 Conventional economic models embody agents able to make perfect, optimising decisions.
An important strand of recent efforts to increase the behavioral realism of models has been to
acknowledge that attention is not costless---the effort required to attend to decisions and execute
them well can be costly and cognitively tiring---and incorporate that in models. Models of
“strategic inattention”, predicated on rational agents adjusting their behavior to account for
attention being either limited and/or costly, are increasingly mainstream (for examples Caplin
and Dean, 2015; Sims, 2003; Falkinger, 2011).
 While the idea of costly attention is intuitively appealing, rigorous evidence characterizing its
implications in real settings remains limited and primarily focuses on static effects in cross-
sectional data. This paper adds to and extends this evidence. Studying the quality of decisions
made by a panel of professional decision-makers with strong incentives to get these decisions
right, we show that MLB umpires systematically vary the effort they apply to individual
decisions: applying greater attention to those associated with higher stakes. This is consistent

24
 The correlations between an umpire’s past or future leverage effect and the current leverage effect are -0.401 and
-0.485, respectively. Both correlations are significant at the 1% level.

 17
with established theoretical models of strategic inattention. Our data-rich setting, in which the
same umpire is called upon to issue a long series of decisions, allows for careful study of the
dynamics of inattention and delivers our most novel results. First, high effort applied early in a
sequence of decisions reduces effort applied later in the series. Second, umpires act as if they
anticipate high stakes decisions to come later, and conserve cognitive effort. Both results fit
closely to the predictions from a model in which the umpire has a depletable stock of attention.
These dynamics render inter-dependent otherwise separable decision problems. The short and
exogenously mandated break that the umpire receives between half-innings appears sufficient to
replenish his stock of attention, since there is no evidence of inter-dependence across those
breaks. If repeated in other work settings such evidence could point to the utility of short breaks
built into the working day in many cognitively-demanding professions (Gino, 2006).25 The
results prove robust to an array of alternative specifications and robustness tests.
 This is not just a paper about baseball. The richness of the data in a field setting affords a
unique opportunity to explore the much broader issue of strategic inattention in novel ways.26
Moreover, although umpires work in the sports industry, our subjects are not professional
athletes, but rather professional decision-makers. Umpires attend specialized training schools,
acquire 7-10 years of experience prior to achieving MLB status, are highly paid, and their work
highly scrutinized, making their role much closer to a judge than an athlete. As with studies of
any industry or profession, there may be concerns about how generalizable the results are.
Examining whether similar dynamics of attention are seen in other settings is thus an important
next step.

25
 Sievertsen et al (2016) found that the performance of Danish children in standardized tests declined as the time of
the test became later in the day “… because over the course of a regular day, students’ mental resources get taxed.”
(p. 2621). They also found, however, that a twenty-minute break from mental work restored performance.
26
 Concerns over external validity from using sports data are more limited here than for some other influential
research that have used sports data, for example testing tournament theory using player choices in professional golf
tournaments (Ehrenberg and Bognanno, 1990).

 18
References

Acemoglu, D. and P. Restrepo (2019). “The Wrong Kind of AI? Artificial Intelligence and the
Future of Labor Demand.” NBER Working Paper 25682.

Acharya, S. and S. L. Wee (2020). “Rational Inattention in Hiring Decisions.” American Economic
Journal: Macroeconomics 12(1): 1-40.

Alaoui, L. and A. Penta (2016). “Endogenous Depth of Reasoning.” Review of Economic Studies
83(4): 1297-1333.

Allan, J. L., D. Johnston, D. Powell (2019). “Clinical Decisions and Time Since Rest Break: An
Analysis of Decision Fatigue in Nurses.” Health Psychology 38(4): 318-24.

Allcott, H. and N. Wozny (2014). “Gasoline Prices, Fuel Economy and the Energy Paradox.”
Review of Economics and Statistics 96(5): 779-95.

Angrist, J. D. and J.-S. Pischke (2008). Mostly Harmless Econometrics: An Empiricist's
Companion. Princeton University Press.

Archsmith, J., A. Heyes and S. Saberian (2018). “Air Quality and Error Quantity: Pollution and
Performance in a High-Skilled, Quality-Focussed Occupation.” Journal of the Association of
Environmental and Resource Economists 5(4): 827-63.

Augenblick, N. and S. Nicholson (2016). “Ballot Position, Choice Fatigue, and Voter Behavior.”
Review of Economic Studies 83(2): 460-80.

Baer, D. 2015. "The Scientific Reason why Barack Obama and Mark Zuckerberg wear the same
Outfit Every Day". Business Insider. (Retrieved 24 October 2018).

Bartos, V., M. Bauer, J. Chytilova and F. Metejka (2016). “Attention Discrimination: Theory and
Field Experiments with Monitoring Information Acquisition.” American Economic Review
106(6): 1437-75.

Bhattacharya, V. and Howard, G., 2020. Rational Inattention in the Infield. American Economic
Journal: Microeconomics. (Forthcomming)

Bruyneel, S. S. Dewitte and K. Vohs (2006). “Repeated Choosing Increases Susceptibility to
Affective Product Features.” International Journal of Research in Marketing 23(2): 215-25.

 19
Caplin, A. and M. Dean (2015). “Revealed Preference, Rational Inattention and Costly Information
Acquisition.” American Economic Review 105(7): 2183-2203.

Chan, M. Y., H. Cohen and B. Spiegel (2009). “Fewer Polyps Detected by Colonoscopy as the
Day Progresses.” Clinical Gastroenterology and Hepatology 7(11): 1217-23.

Chen, D. T. Moskovitz and K. Shue (2016). “Decision-making under the Gambler’s fallacy:
Evidence from Asylum Judges, Loan Officers, and baseball Umpires.” Quarterly Journal of
Economics 131(3): 1181-1242.

Chetty, R., A. Looney and K Kroft (2009). “Salience and Taxation: Theory and Evidence.”
American Economic Review 99(4): 1145-1177.

Correia, S., (2014) "REGHDFE: Stata module to perform linear or instrumental-variable
regression absorbing any number of high-dimensional fixed effects," Statistical Software
Components S457874, Boston College Department of Economics, revised 18 Nov 2019.

DellaVigna, S. and J. Pollett (2009). “Investor Inattention and Friday Earnings Announcements.”
Journal of Finance 64(2): 709-49.

Deming, D. (2021). “The Growing Importance of Decision-making on the Job.” Unpublished
Manuscript, Kennedy School of Public Policy, Harvard University.

Dragone, Davide (2009). “I Am Getting Tired: Effort and Fatigue in Intertemporal Decision-
making.” Journal of Economic Psychology 30(4): 552-62.

Drellich, E. (2012). Complex system in place to evaluate umpires. https://www.mlb.com/news

/c-37468304/print.

Ehrenberg, R. G. and M. Bognanno (1990). “Do Tournaments Have Incentive Effects?” Journal
of Political Economy 98(6): 1307-24.

Erwin, M. (2019). “6 Reasons We Make Bad Decisions, and What to Do About Them.” Harvard
Business Review.

Falkinger, J. (2011). “Limited Attention as a Scarce Resource in Information-Rich Economies.”
Economic Journal 118(3): 1596-1620.

 20
Gabaix, X. (2019). “Behavioral Inattention.” Chapter 4 in Eds. D. Bernheim, S. Dellavigna and D.
Laibson Behavioral Economics: Application and Foundations (Volume 1), Elsevier: North-
Holland.

Gabaix, X., D. Laibson, G. Moloche and S. Weinberg (2006). “Costly Information Acquisition:
Experimental Analysis of a Boundedly Rational Model.” American Economic Review 96(4):
1043-1068.

Gino, F. (2016). "Don’t Make Important Decisions Late in the Day." Harvard Business Review
23.

Hirshleifer, D. A., Y. Levi, B. Lourie and S. H. Teoh (2019). “Decision Fatigue and Heuristic
Analyst Forecasts.” Journal of Financial Economics 133(1): 83-98.

Kim, J. and B. King (2014). “Seeing Stars: Matthew Effects and Status Bias in Major League
Baseball Umpiring.” Management Science 60(11): 2381-2617.

Kim R. H., S. Day, D. Small C., Snider, C. Rareshide and M. Patel (2018). “Variations in Influenza
Vaccination by Clinic Appointment Time and an Active Choice Intervention in the Electronic
Health Record to Increase Influenza Vaccination.” JAMA Network Open 1(5).

Kwan, J., L. Stein et al (2016). “Does Decision Fatigue Impact Manuscript Acceptance? An
Analysis of Editorial Decisions by the American Journal of Gastroenterology.” American Journal
of Gastroenterology 111(11): 1511-12.

Levav, J., M. Heitmann, A. Herrmann and S. Iyengar (2010). “Order in Product Customization
Decisions: Evidence from Field Experiments.” Journal of Political Economy 118(3): 274-99.

Linder J. A., J. N. Doctor and A. W. Friedberg (2014). “Time of Day and the Decision to Prescribe
Antibiotics”. JAMA Internal Medicine 174(12): 2029 – 2031.

Orasunu, J. B. Parke, N. Kraft et al (2012). “Evaluating the Effectiveness of Schedule Changes for
Air Traffic Service (ATS) Providers: Controller Alertness and Fatigue Monitoring Study.”
Available at: https://trid.trb.org/view/1364660.

Parsons, C., J. Suleman, M. Yates and D. Hamermesh (2011). “Strike Three: Discrimination,
Incentives and Evaluation”. American Economic Review 101(4): 1410 – 35.

 21
Persson, E., K. Barrafrem, A. Menuier and G. Tinghog (2018). “The Effect of Decision Fatigue
on Surgeon’s Clinical Decision Making.” Health Economics 28(10): 1194-1203.

Philpot L, B. A. Khokhar, D. L. Roellinger, P Ramar and J. O. Ebbert (2018). “Time of Day is
Associated with Opioid Prescribing for Low Back Pain in Primary Care.” Journal of General
Internal Medicine 33(11): 1828-1830.

Pignatiello, G., R. Martin and R. Hickman (2020). “Decision Fatigue: A Conceptual Analysis.”
Journal of Health Psychology 25(1).

Sievertsen, H. H., F. Gino and M. Piovesan (2016). “Cognitive Fatigue Influences Student
Performance in Standardized Tests.” Proceedings of the National Academy of Sciences of the
United States of America (PNAS) 113(10): 2621-24.

Sims, C. (2003). “Implications of Rational Inattention”. Journal of Monetary Economics 50(3):
665-90.

Tierney, J. (2011) “Do You Suffer from Decision Fatigue?” New York Times (page 111)

Wadhwa, T. (2016). A Hedge Fund Wrote a Letter to Investors Explaining why they should Read
a Classic Book about Cognitive Biases Business Insider (http://www.businessinsider.com/voss-
capital-investor-letter-on-daniel-kahnemans-thinking-fast-and-slow-2016-11)

Zheng, B., E. Kwok, M. Taljaard (2020). “Decision Fatigue in the Emergency Department.” The
American Journal of Emergency Medicine 38(12): 2506-2510.

 22
Tables and Figures

 Figure 1 - Example Pitch Location and Umpire Decisions

 Visualization of pitch locations and umpire decisions from a typical MLB game between Arizona and Boston on
 August 4th, 2013. This game was selected because the number of total pitches and umpire error rate are close to the
 sample means. Circles denote pitches called balls and triangles denote called strikes. Filled shapes are incorrect
 decisions by the umpire. Pitch locations are normalized so boundary of the strike zone, shown as a rectangle, is
identical for each pitch. Pitches far from the strike zone (all of which the umpire adjudicated correctly) are excluded
 from this visualization

 23
You can also read