Roadshow Presentation - CTP - A Top 5 Vertically Integrated European Logistics Property Platform - Ctp.eu
←
→
Page content transcription
If your browser does not render page correctly, please read the page content below
Roadshow
                         Presentation
                         March 2021

             CTP - A Top 5 Vertically
             Integrated European
             Logistics Property
             Platform

Parkmakers

                                      CTPark Prague East
                                         Czech Republic
                                                1
Today’s Presenters

Remon Vos                                            Richard Wilkinson                                    Jan-Evert Post
Group CEO                                            Deputy CEO & Group CFO                               Head of Funding & Investor Relations
Founded CTP in 1998                                  Joined CTP in 2018                                   Joined CTP in 2019
➜ Remon is entrepreneurial, creative and driven      ➜ Richard is responsible for the financing of the    ➜ Jan Evert’s role is to manage relationships with
hard worker who established CTP together with two    entire group portfolio in CEE                        the banking sector and provide complete financing of
other investors in 1998 to develop full-service                                                           all CTP activities
                                                     ➜ Richard has worked with CTP since 2003 whilst at
business parks                                       Erste Group                                          ➜ Jan Evert worked with CTP for over 6 years
➜ 100% owner of CTP Group since 2019, Remon is       ➜ Prior to joining CTP in 2018, Richard led the      whilst at ING
personally involved at both the executive and        Commercial Real Estate business of Erste Group in    ➜ Prior to joining CTP in 2019, Jan- Evert was
operational levels                                   CEE for 14 years                                     Managing Director in charge of International Real
                                                                                                          Estate Finance at ING
➜ His 25 years of intensive work in CEE and
dynamic mindset has cemented CTP as the n.1 in the
region

                                                                                                                                                                 2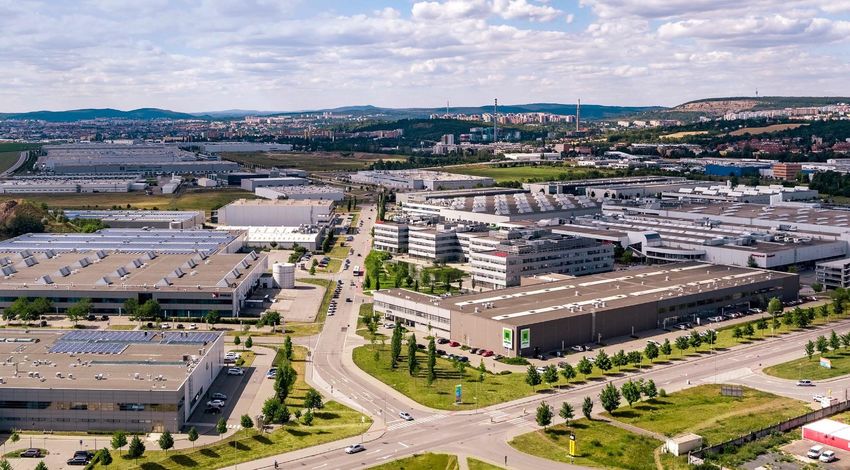
Risk Factors

  Investing in the shares in the share capital of the Company (the "Shares") involves certain risks. The list of risk set out below is a selection of key material risks and is not exhaustive. Before
  investing in the Shares, prospective investors should carefully consider all the risks and uncertainties described in the Prospectus, together with the other information contained or incorporated
  by reference in the Prospectus. The risk factors may also apply to aspects set out in this presentation. Investors should keep the risk factors in mind throughout the presentation

• CTP B.V. (the "Company") together with its subsidiaries (the "Group")                                  • The Group has significant investments and operations in less mature
  is exposed to general commercial and industrial property risks                                           markets, which tend to have higher volatility and be subject to greater
  including economic, demographic and market developments.                                                 legal, economic, fiscal and political risks.
• The recent global coronavirus pandemic has led to significant volatility                               • The Group’s substantial leverage and debt service obligations could
  in financial and other markets and could harm the Group’s business                                       adversely affect its business and prevent it from fulfilling its obligations
  and results of operations.                                                                               with respect to its indebtedness, and the Group may not be able to
                                                                                                           successfully renew or refinance such indebtedness as it matures, or
• The Group could experience a lower demand for its industrial and
                                                                                                           may only be able to renew or refinance its indebtedness on less
  logistics property and a significant decline in occupancy rates may
                                                                                                           favourable terms.
  have an adverse impact on the Group’s cash flows.
                                                                                                         • The Group is subject to various regulations in the countries in which it
• The Group is subject to the risk of tenants defaulting on their lease
                                                                                                           operates and is exposed to the risks resulting from changes to the
  obligation or failing to renew their leases.
                                                                                                           regulatory environment, or a failure to comply with applicable laws,
• The Group may not be able to successfully implement its key strategies                                   regulations, licensing requirements and codes of practice.
  or manage its growth.
                                                                                                         • The payment of future dividends will depend on the Group’s financial
• The Group’s strategy envisions potential additional selective property                                   condition and results of operations, as well as on the Group’s operating
  acquisitions, but the Group may be unable to acquire the properties on                                   subsidiaries’ distributions to the Company.
  acceptable terms, identify all potential liabilities associated with them or
                                                                                                         • Future issuances or sales of shares or debt or equity securities
  complete the acquisitions.
                                                                                                           convertible into Shares by the Company or future sales of Shares by
• The Group’s financial performance relies on its ability to attract and                                   the directors of the Company or Sole Shareholder may adversely affect
  retain tenants, which may suffer as a result of increased competition                                    the market price of the Shares, and any future issuance of Shares may
  from other property owners, operators and developers.                                                    dilute investors’ shareholdings.
• The Group is exposed to the risk of cost overruns, delays or other                                     • The Shares have not been publicly traded, and there is no guarantee
  difficulties in relation to its development activities.                                                  that an active and liquid market for the Shares will develop.
• The performance of the Group’s property portfolio is exposed to
  concentration risks.
• The Group is dependent on its chief executive officer, chief financial
  officer as well as other senior executives and other qualified personnel
  and may not be able to attract and retain them.

                                                                                                                                                                                                         3
Deal Terms                               CTP Story & Future                                        Key Investment Highlights

   Offering Summary

Issuer                • CTP B.V. (“CTP”)

Listing               • Euronext Amsterdam

                      • Primary offering of 61,017,000 shares at a price range of €13.50 - 16.00 equating to total primary proceeds of c.€824 - 976MM /
                        up to c.15.4% of the company
Offering Structure
                      • Secondary through greenshoe only
                      • Secondary greenshoe of up to 15% of total offer size

                      • Institutional offering via Reg S outside the US
Distribution          • Private placement to institutions elsewhere including to QIBs in the US under Rule 144A
                      • No retail offering

                      • 180-day for the company
Lock-up
                      • 360-day for Remon Vos as Director

                      • AFM approved prospectus (the "Prospectus") available free of charge on CTP's website: https://www.ctp.eu/investors/ipo-
Prospectus
                        documentation/

                                                                                                                                                          4
CTP – The Story and
1   the Future

    PRESENTED BY
    Remon Vos, Group CEO

                           5
Deal Terms                                      CTP Story & Future                               Key Investment Highlights

   CTP – Our DNA at a Glance (1/5)

   Mission: Build, Own, Operate High Quality and Most Sustainable Network of Business Parks in Europe

                                                                                    CTPark Bor                               CZ

             Scale Park Making Business with Market
    1        Leadership Positions

             End-to-End Business: We Build to Keep
    2        our Assets and Manage to Retain our
             Tenants

                                                                                    CTZip Bratislava City                    SK

             Uninterrupted 22-Year Track-Record of
    3
             Profitable Organic Growth

             Platform Set for Continued Growth in
    4
             Europe

                                                                                                                                  6
Deal Terms                                                                            CTP Story & Future                                                            Key Investment Highlights

      CTP – Our DNA at a Glance (2/5)

      Mission: Build, Own, and Operate High Quality and the Most Sustainable Network of Business Parks in Europe

                                     Top 5 European Logistics Property Company – #1 in Central Europe
        Top 5(1) European Logistics
                                                                                          Strong Leader in Our Markets(5)                                                              Gaining Market Share
            Property Company
 June 2020 GLA, MM sqm – Europe
      18.0           16.8                                                                                                                                                                          Take-Up                      In Place GLA
                                                      >10                                                                                                                                           Share(7)                          Share(8)

                                      8.1                                                                                                                                Q2
                                                                                                                                                                                                          29%          >                         22%
                                                      5.8                5.7                    CZ #1               RO #1                HU #1                           2020

                                                                                                                                                                         Q3
                                                                                                                                                                                                          30%          >                         22%
                                               (2)           (3)                                  ~85% of Portfolio adjacent to                                          2020
                                /
                     PELF                                                                            Capital/Major Cities(6)                                             Q4
                                                                                                                                                                                                          25%          >                         23%
        Owned (in-place GLA)                   Managed for         3rd   Party(4)                                                                                        2020

                       Scale Portfolio                                                               Construction Platform                                                            Strong Balance Sheet

         €5.9 Bn               5.9 MM sqm                   €344 MM
                                                                                                      1 MM Sqm Assets
                                                                                                                                                                                                                                  BBB-
                                                                                                     Under Construction
                                                                                                          (As of 1st March 2021)                                                                                                 (Stable)

                                                                                                       Largely Pre-Let /                                                                                                          Baa3
        GAV(9)                      Owned              Annualised                                   >€56 MM Rental Income                                                                                                        (Stable)
                                    GLA(10)          Rental Income(11)

Source: Company information, JLL
Notes:                                                                                                                7. Based on net take-up in CTP markets (ex Poland)
1. Among the top 5 largest logistics property companies in Europe and the largest in the CEE by GLA as of Jun-20A     8. CTP’s Gross Lettable Area as a percentage of total stock in CTP’s core markets (ex Poland)
2. SEGRO GLA is proportionally consolidated with 50% of SELP joint venture alongside fully owned assets               9. As of Dec-20A, Gross Asset Value defined as Investment Property, Investment Property Under Development, PP&E
3. CTP GLA includes total owned portfolio plus 390k sqm of the Deka portfolio under management                        10.As of Dec-20A, Gross Lettable Area (owned)                                                                                    7
4. 100% basis – Asset Under Management                                                                                11.As of Dec-20A, Rent roll including service charge income (Base rent + other rental income + extras for above standard
5. Based on trailing 12 Months take-up market share as of Sep-20A                                                        technical improvement + services – rent frees)
6. % of Portfolio GAV
Deal Terms CTP Story & Future Key Investment Highlights
CTP – Our DNA at a Glance (3/5)
Mission: Build, Own, and Operate High Quality and the Most Sustainable Network of Business Parks in Europe
End-to-End Business: We Build to Keep our Assets and Manage to Retain our Tenants
Full-Service Offering
Long-Term Owner DNA Customer-Centric Strategy
All Capabilities In-house
General contractor
Relationship
management
& leasing
Strong Focus on Development
Construction management Quality and
Sustainability
Driven by
Tenant Needs
Property Management
Fit-out
Ample Workforce ESG Front Runner Partnership Approach
With our Clients,
Communities,
100% Employees and
~400 Certification Investors
Employees
As of Dec-20A As of Jan-21A
8
Deal Terms                                                                               CTP Story & Future                                    Key Investment Highlights

      CTP – Our DNA at a Glance (4/5)

      Mission: Build, Own, and Operate High Quality and the Most Sustainable Network of Business Parks in Europe

                                       Uninterrupted 22-Year Track-Record of Profitable Organic Growth

           Entrepreneurial Mindset                                                                      Self-Generated Growth                                          100% Owned

                                     Innovation
                                                                                                                               via Demand-led                                by Founder-CEO
                                     + Controlled
                                                                                                                               Development                                   Remon L. Vos
                                     Risk-Taking

        ~15% Growth p.a. (in GLA)                                                                                                       Profitable Growth

                                                                                                                         €2.8 Bn                                   ~12%
                                    Self-financed                                                                         EPRA NTA(1)
                                    Growth                                                                                                               Development YoC(2)
                                                                                                                                                                   2016-2020
                                   2011-2020                                                                                c.17%                                   Average
                                   Annual Growth Rate                                                             2018-2020A CAGR

Notes:
1. Total equity attributable to owners of the Company excluding deferred tax in relation to net valuation result of investment
   property and investment property under development with intention to hold and not sell in the long run, excluding Fair value of                                                            9
   financial instruments and excluding intangibles
2. Calculated as rental value (signed in lease agreements) divided by development cost incl. land
Deal Terms                                                                         CTP Story & Future                                                Key Investment Highlights

     CTP – Our DNA at a Glance (5/5)

     Mission: Build, Own, and Operate High Quality and the Most Sustainable Network of Business Parks in Europe

                                                               Platform Set for Continued Growth in Europe

       Multiple Demand Tailwinds                                                                            >7.5 MM sqm                                                      >10 MM sqm

                 + Nearshoring                                                                                        Target Portfolio                                             Target Portfolio
                 + e-Commerce                                                                                         AuM GLA                                                      AuM GLA
             + Resilient Value Chains                                                                                 by end of 2021                                               by end of 2023

 12.6 MM sqm Controlled Land Bank (1)                                                Geographic Expansion Potential                                            Reduction in Cost of Debt

                                                                                                                                                             From 2.2% in Sep-20A to
                                                                                                                                                                    1.6% now
                                   5.4 MM sqm
                                   Buildable Area                                                                                                                      Potential for further
                                                                                                                                                                        reduction to 1.2%
                            As of Dec-20A
                                                                                            Core Existing             Near-term Growth   Prospective
                                                                                            Markets                   Markets            Markets

Note:
1. As of Dec-20A, 8.8 MM sqm owned + 3.8 MM sqm under exclusive option = 12.6 MM sqm land bank with c.43% buildable are ratio
                                                                                                                                                                                                      10
Deal Terms CTP Story & Future Key Investment Highlights
22-Year Track-Record of Entrepreneurial Success and More to Come
IPO to Accelerate Growth of the Business Including in Untapped New Markets
Where it all started… Growth Expansion IPO-fueled Growth Now… … and Into Future
2023 and beyond
New Energy /
Geographies Carbon
Neutral
2021-2023
2015-2020
Tech / CTZip Urban
2010-2015
26 70 Parks Science
Parks
Parks
IPO Structural
2000-2010 BBB- Tailwinds
(Stable) >>10
>95% >5.0
15 26 Parks Baa3 >95% >5.0
(Stable) >10
0 15 Parks >7.5
10
94% 6.0
95% 5.5
6.3
3.2 394
94% 5.9 3.2(2)
1.6 1.7 167
0.6 110
2010 2010 2010 2015 2015 2015 2020 2020 2020 2021 Target 2023 Target 2023+
AuM GLA (MM sqm) IFRS Equity(1) (€ Bn) Headcount Occupancy (%) WAULT(3) (years)
Notes:
1. Gross of deferred tax liabilities 11
2. Grossed up by €400MM exceptional dividend paid out in 2018
3. Weighted average unexpired lease termDeal Terms CTP Story & Future Key Investment Highlights
Near-Term Outlook: 1 MM sqm Under Construction(1), Combined with Selected
Acquisitions, Expected to Take AuM GLA from 6.3 to >7.5 MM sqm by Year-End
Minimum +1 MM sqm Additional GLA in 2021 from Mostly Pre-Let Developments + 20% of Total Annual Growth from Acquisitions
2021E AuM GLA Growth Build-up
GLA, MM sqm
Short-Term Pipeline under Construction >7.5
€344 MM (1MM sqm / 62% Pre-let / >10% YoC / >€56 MM Additional Rental Income)
~0.2
Annualised
Rental Income(2) 0.1 0.1
100% 0.2
0.3
93%
0.4
87%
6.3
79% 5.9
in Owned GLA
2020A CZ RO HU SK RS Acquisitions Other Projects to 2021E
start and complete
Development Projects Under Construction (100% Owned)
in 2021
Currently Under Construction Acquisitions in 2021 Dev. Completed in H1 2021 Dev. Completed in H2 2021
Pipeline Under Construction Overview
€MM unless otherwise stated
YoC(4) Additional Rental
GLA (ksqm) Pre-Let (%) Total Capex(3) Avg Cost / sqm (€) Residual Capex(3) (incl. land) Income
CZ 358 65% 209 585 120
RO 251 70% 96 382 80
HU 239 63% 105 440 60
SK 88 51% 38 430 27
RS 83 36% 36 437 25
Total 1,019 62% 484 475 312 >10% >56
Notes:
1. As of 1 March 2021
2. Dec-20A rent roll including service charge income (Base rent + other rental income + extras for above standard technical improvement + services – rent frees) 12
3. Construction capex only
4. Calculated as rental value (signed in lease agreements) divided by development cost including book value of landDeal Terms CTP Story & Future Key Investment Highlights
Medium-Term Outlook: >10MM Target by 2023
Steady Build-Out of Controlled Land Bank via Primarily Pre-let Projects, Complemented with Potential Disciplined Expansion in Adjacent Markets
Over Time
Illustrative Target GLA Split(1)(2) Medium-Term Yield on Cost Target
2020 GLA: 6.3 MM sqm 2%
2021 Target GLA: >7.5 MM sqm 7% 2% Medium-term Yield on Cost target of >10% on future
8% developments, supported by:
57% 1. Controlled land bank – Covering several years
24% of development / no exposure to land cost
inflation
2. Quality of location of our parks
3. Significant proportion of “captive” demand
2023 Target GLA: >10 MM sqm from tenants willing to grow on same site (more
~2% ~2% expensive to move)
~2-3%Deal Terms CTP Story & Future Key Investment Highlights
Key Success Factors in Place to Meet our Targets
1 Land and Parks 2 Product for Tenants
12.6 MM 65%
Sqm Adjacent to
Controlled Existing 2
(Owned + 1
Under Option) Parks Tenants
Land and
Parks
4 Financing 4 3 3 Platform / Team
Financing Platform / Department Resources Breakdown
€900 MM €1.55 Bn Team % of Total Headcount
IPO Bonds to Legal
At Mid-point of Price 8% Property
Range
Date Business
11% Management
34%
Organically
Finance
Generated 23%
Equity Construction
24%
14Deal Terms CTP Story & Future Key Investment Highlights
Land: Secured 12.6 MM sqm Land Bank Equivalent to ~5.4 MM sqm Buildable
GLA
Secured High-Quality Land Bank Supporting >10 MM sqm GLA Target by End of 2023; Only c.50% of Total Land Bank Required to Reach Target
Expanding in Successful Parks Land Bank Located in Rapidly Growing Cities
High Quality Land Bank Mainly Adjacent to Existing Sites Controlled Land Bank within Capital Cities(1)
% MM sqm unless otherwise stated
Represents 48% of total land bank(2)
New
2.6
Sites
35%
1.2
0.8
0.6 0.5
0.3
Adjacent to
Existing Bucharest Prague Bratislava Budapest Sofia Vienna
Parks
65%
Source: Company information Source: Company information
90% of Owned Land Bank is Already Zoned Rapidly Growing Countries Require Warehousing Space
As of Dec-20A %, Cumulative Real GDP Growth for 2020-24E
10.2
Optioned 8.8 8.4
30% 7.2
4.7
Owned & Owned & Romania Czech Republic Slovakia Hungary Western Europe (3)
to Be Zoned
Zoned 63%
7%
Source: Company information Source: JLL, Oxford Economics (December 2020)
Notes: 15
1. Data as of Dec-20A
2. Total land bank (Owned + Under Option)
3. Simple average of the Western European countries’ GDP growth rates. Western European countries include Spain, Netherland, Bel gium, UK, Germany, France and ItalyDeal Terms CTP Story & Future Key Investment Highlights
Parks: Premium Modern Asset Base, Grouped in Network of Multi-Use “CTParks”
“Parkmakers” – Strategic Focus on Development of Large Multi-Use Logistics/Business Parks; Top 10 CTParks Represent 58% of
Generating Synergies and Strong Barriers to Entry Versus Competition Total GLA
Bucharest West RO Brno CZ Bucharest RO Bor CZ Ostrava CZ
Built-up Area: 661 ksqm Built-up Area: 507 ksqm Built-up Area: 506 ksqm Built-up Area: 417 ksqm Built-up Area: 377 ksqm
GLA under Construction: 86 ksqm GLA under Construction: - GLA under Construction: 64 ksqm GLA under Construction: 128 ksqm GLA under Construction: 7 ksqm
Adjacent Land bank: 1,232 ksqm Adjacent Land bank: 71 ksqm Adjacent Land bank: 217 ksqm Adjacent Land bank: 118 ksqm Adjacent Land bank: 20 ksqm
Modřice CZ Budapest West HU Bratislava SK Pohořelice CZ Budapest East HU
Built-up Area: 205 ksqm Built-up Area: 201 ksqm Built-up Area: 117 ksqm Built-up Area: 115 ksqm Built-up Area: 104 ksqm
GLA under Construction: - GLA under Construction: 41 ksqm GLA under Construction: 8 GLA under Construction: - GLA under Construction: 82 ksqm
Adjacent Land bank: 27 ksqm Adjacent Land bank: 124 ksqm Adjacent Land bank: 21 ksqm Adjacent Land bank: - Adjacent Land bank: 140 ksqm
7 Parks with >200,000 sqm GLA
Source: Company data as of Dec-20A
16Deal Terms CTP Story & Future Key Investment Highlights
Product: Wide Asset Offering to Satisfy Bespoke Client Needs and Facilitate
Growth On Site Overtime
Overview of 5 Property Types Offered on CTPark Network
ctBox ctFlex ctSpace ctFit ctLab
From From From From From
500-800 m2 1,000-8,000 m2 3,000 m2 5,000 m2 195 m2
Clubhaus
Community
Source: Company data 17
Note:
1. According to BREEAMDeal Terms CTP Story & Future Key Investment Highlights
Tenants: Long Standing and Growing Tenant Relationships
700+ Blue Chip International and Domestic Clients Operating Across Broad Range of Industries as Key Partners to Grow the Business
3PLs Manufacturing
High Tech Automotive E-commerce, Retail, Wholesale &
Distribution
Source: Company information 18Deal Terms CTP Story & Future Key Investment Highlights
Platform: Vertically Integrated Business Model Delivering Organic Development-led
Growth and Secured Long-Term Income (1/2)
Full Control Over Entire Value Chain – Powerful Model for Organic Growth and Value Creation
Tenant-Led Development Platform
1 2 3
Client Location Design
Requirements Search
9 4
Client
Permits
Expansion
8 Upgrades Construction 5
7 6
Property Fit-out
Managment
CTPark Brno Líšeň
Low Risk / High Return Development Strategy Czech Republic
Source: Company information
19Deal Terms CTP Story & Future Key Investment Highlights
Platform: Vertically Integrated Business Model Delivering Organic Development-led
Growth and Secured Long-Term Income (2/2)
Comprehensive In-House Property Management Services Provide Tenants with Premium Services and Allow CTP to Maintain
Direct Client Relationship
Long-Term Owner / Manager
Income Producing Portfolio GAV (1)
€ Bn
6.6% 6.4% 6.2%
5.1
4.4
3.8
Service Desk
Dec-18A Dec-19A Dec-20A
EPRA Topped-up Net Initial Yield(2)
Stable Cash Flows Facility Management
Source: Company information
Notes:
1. Income producing portfolio defined as investment portfolio excluding land bank
20
2. Defined as annualised net rents including lease incentives divided by completed property valueDeal Terms CTP Story & Future Key Investment Highlights
Team: We are Parkmakers
21Deal Terms CTP Story & Future Key Investment Highlights
Team: ~400 Employee Full-Fledged Operating Platform, with Local Connectivity
and Entrepreneurial Mindset to Drive Growth
Human Capital and Infrastructure in Place to Support Continued Expansion of the Portfolio
• Local country teams with “boots Strategic partnership signed with CTP # of Employees
>450
CTP actively scaling-up local Poland-based MDC2 to deliver
on the ground” to source new team to accelerate growth >1.75 MM sqm GLA by end of
374
394
2025
business and deliver best-in-class Start of
Start of
international
client service international
expansion
expansion
247
• “CTP International:” hands-on 110
130
152
team of 35 most experienced staff PL
spearheading future growth NL
GER 6 2010 2012 2014 2016 2018 2020 2021
• Standardized processes in place Target
applied across the company CZ
236
30
• “Plug & play” back-office systems, SK
including Finance, IT, PM, Legal etc. 2
ready to accommodate new AT HU 70
geographies 42
RO
• Key decision making process/risk
control retained at HQ level under
RS
the supervision of the Management 5
Board 12 BG
Number of Employees Core Existing Markets Near-term Growth Markets Prospective Markets
Source: Company information
22Deal Terms CTP Story & Future Key Investment Highlights
Financing: CTP Well Positioned for Growth Through Multiple Funding Sources
Strong Balance Sheet €4.0 Bn EMTN Programme
Green Bond Financing Amount Raised
BBB- € MM
(Stable) 650
500
400
Baa3
(Stable)
5-Year 3-Year 6-Year
Maturity (Oct-25) (Nov-23) (Feb-27)
Organically-Generated Equity IPO
>10%
Development YoC
€900 MM
Primary Capital
Mid-term target At Mid-point of Price Range
Source: Company information
23Deal Terms CTP Story & Future Key Investment Highlights
Highly Competitive Double-Digit Annual Total Return Profile, Driven By 6.8% Asset
Yield and Market Leading >10% Yield on Development Costs
Secured Rental Yields and Significant Value Creation on Largely Pre-Let Development Projects Drive Base Case Total Return ;
Potential Further Upside From Yield Compression/Catch-up in CEE, Reduction in Cost of Debt and Like for Like Rental Growth
Income Producing • 6.3 MM sqm AuM GLA Income Producing Portfolio / €344 MM Annualized Rental Income(2)
Portfolio
6.8%(1) Asset Yield • >7.5 MM sqm under management by the end of year / >€400 MM Annualized Rental Income(3)
+
Development-Led
• 1 MM sqm Assets under Construction / 62% Already Pre-let / >€56 MM Rental Income(4)
Growth
>10% Yield on Cost • 12.6 MM sqm Land Bank (~5.4 MM sqm Buildable Capacity)(4)(5)
(incl. Land)
+
Potential for Yield Compression in CEE Markets Scope for Substantial Reduction in Cost of Debt
Last 10Y Logistics Yields(6) Bond Yields (%)
• ~€200 MM value creation if Romanian yields • Opportunity for early refinancing in 21’ of €1.8 Bn
compress by 150 bps 2.5
CZ facilities currently at ~1.9%
(BBB- Rated)
9% • CTP 5 and 6 year bonds yielding atDeal Terms CTP Story & Future Key Investment Highlights
Scalable Platform Positioned for Continued Growth, Targeting >10 MM sqm(1) GLA
by End of 2023
Steady Build-Out of Controlled Land Bank via Primarily Pre-let Projects, Complemented with Potential Disciplined Expansion in Adjacent Markets
Over Time
• Macro resilience in CEE
• Accelerating CEE e-commerce penetration
Structural Demand Drivers
• Strong nearshoring potential
• 2x logistics stock per capita in WE vs CEE
700+ • 700+ blue chip international and domestic clients
Tenants • New developments mainly realised with existing tenants
5.4 MM sqm
Buildable Capacity
• Secured 12.6 MM sqm land bank(2) equivalent to ~5.4 MM sqm buildable GLA
• ~400 employee operating platform with “boots on the ground”
Platform • “CTP International” : Team of 35 most experienced staff spearheading future
growth efforts
• IG ratings with S&P and Moody’s
Access to Capital • €4Bn EMTN program in place
• IPO to facilitate access to equity to fund growth
New Markets • Strategic partnership(3) to grow portfolio in Poland
(Austria, Poland, Bulgaria, Netherlands
• New Development projects around Vienna and Sofia
and others)
Notes:
1. Including 0.4 MM sqm portfolio under management for DEKA 25
2. Comprises 8.8MM sqm of owned land and 3.8MM sqm of land under exclusive option
3. Strategic partnership signed in 2021 with local developer MDC² in Poland, where CTP aims to build and own a portfolio of full-service high quality business parks totalling at least 1.75 million m² of GLA until the end of 2025CTP – Investment
2 Highlights
PRESENTED BY
Richard Wilkinson, Group CFO
Jan-Evert Post, Head of Funding
& Investor Relations
26Deal Terms CTP Story & Future Key Investment Highlights
Key Investment Highlights
1 Highly attractive outlook for logistics property globally, with multiple positive demand drivers accelerated by COVID-19
Top 5 European logistics owner-developer(1) with €5.9 Bn modern investment portfolio(2) primarily in capital cities,
2 high and stable occupancy levels and 22 years of entrepreneurial success
3 Leading and growing market share in 4 CEE countries, which benefit from favourable macro trends
Premium predominantly Class A and modern asset base grouped in network of 70 multi-use CTParks,(3)
4 serving over 700+ international tenants who generate highly resilient operating cash flows with annualised rent
roll of €344 MM(4)
Vertically integrated business model delivering organic development-led growth with a market leading 12.6
5 MM sqm land bank(5) (~5.4 MM sqm buildable GLA), 65% at existing parks, 82% around major cities
Industry frontrunner on ESG / Sustainability with best-in-class BREEAM credentials and carbon-neutral
6 operations by end-2021
Driven by hands-on, entrepreneurial senior management team led by visionary founder/owner/ CEO strongly
7 aligned with new investors and supervised by seasoned board of directors
Scalable platform positioned for continued growth, targeting >10 MM sqm GLA by end of 2023 via developments
8 and acquisitions plus potential for disciplined expansion into adjacent markets / segments
Highly competitive double-digit annual total return profile, driven by 6%+ rental yield of standing portfolio, market leading
9 >10% development yields, targeted acquisition opportunities and a strengthened balance sheet post IPO
Notes: 4. Dec-20A rent roll including service charge income (Base rent + other rental income + extras for above standard technical
1. CTP is among the top 5 largest logistics property companies in Europe and the largest in Central and Eastern Europe by improvement + services – rent frees)
GLA as of June 2020 5. As of Dec-20A, 8.8 MM sqm owned + 3.8 MM sqm under exclusive option = 12.6 MM sqm land bank with c.43% buildable
2. As of Dec-20A area ratio
3. Properties with development potential only 27Deal Terms CTP Story & Future Key Investment Highlights
Highly Attractive Outlook for Logistics Property Globally, with Multiple Positive
1
Demand Drivers Accelerated By COVID-19
Multiple Drivers Underpin the Structural Growth in Demand for More Logistics Space and Services
Growth in e-Commerce Supply & Manufacturing
Specialist 3PL Services(1) Penetration Accelerating Chains Reconfiguration
Online Distribution = 3x More Logistics
Specialist 3PL Services Required to Reorganisation Closer to
Space Required vs. Traditional Brick and
Move Goods Faster / More Efficiently End-Markets / “Nearshoring”
Mortar Retailing
>3x
Online Penetration (2020): Significant 45%
Growth Potential in Europe 31%
More Space Required to Store, More Resilience = More
13% 14%
Sort, and Distribute Goods Globally Inventories to Absorb Shocks
Western Europe USA UK China
Many European Countries on the
Global Trade Increased by x3 Cusp of Minimum Penetration Environmental Regulations Only
Since 2000 Threshold Required for Acceleration in Set to Strengthen
Omni-channel Strategy by Retailers
Powerful Demand Tailwinds Continued in 2020 YTD Through the Covid-19 Pandemic
European Logistics Take-Up
MM sqm
Demand for Space +3% Robust Occupier Demand
= +9% CAGR
Resilient Asset
x 2.5 over Last 10 23.5 24.1
Class Through Low Vacancy Rates Across Europe (~6%)
Years, Set to Grow Covid-19
10.1 High Rent Collection Rates (>98%)
Again in 2020E
(2)
2009A 2019A 2020E
Source: World Bank, CBRE, BNP Paribas Real Estate, Armstrong and Associates, eMarketer, Prologis Research, Savills
Notes:
1. “3PL” = third-party logistics services providers (e.g. DHL, DSV, Kuehne & Nagel)
2. September 2020A annualised (source CBRE) 28Deal Terms CTP Story & Future Key Investment Highlights
Top 5 European Logistics Owner-Developer with €5.9 Bn Modern Investment
2
Portfolio Primarily in Capital Cities, High and Stable Occupancy Levels
One of Only Small Number of European Logistics Companies with Scale, Internal Development Capabilities and Nearly Fully-owned Portfolio;
Set to Become the #1 Continental Euro Listed Player Upon IPO
June 2020 GLA, MM sqm – Europe
18.0 Targeting
16.8 >10 MM sqm by
end-2023
>10
8.1
5.8 5.7 5.2 5.1
4.3 3.9
3.0 ~3.0
(2) (3) (4) (5)
/
/
PELF GEP Logistics
Listed / Potential IPO Listed Listed
Listed Private
Private Private Private(1) in 2021 Private (Brussels) Private Private Private (London)
(London)
(Amsterdam)
Manager
Owner / JV
Partners & Inst’l & Inst’l Inst’l Investors & Inst’l & Inst’l
Investors Investors Investors Investors
Active
(6)
Developer
Owned (in-place GLA) Managed for 3rd Party (100% basis - Asset Under Management)
Source: Company information
Notes: 26% of 5.1MM sqm is owned directly by Goodman
1. Prologis (listed in on the NYSE) and Prologis European Logistics Partnership (“PELF”) – a private partnership 5. GLP GLA is reflective of its cross-European portfolio as Sept 2020. GLP actively co-invest alongside its LPs but does not
2. SEGRO GLA is proportionally consolidated with 50% of SELP joint venture alongside fully owned assets disclose exact amount of co-investments
3. CTP GLA includes total owned portfolio plus 390k sqm of the Deka portfolio under management 6. UK Development only
4. Goodman maintains a 26% average equity cornerstone position in its partnerships; 3.8MM sqm is 3rd party AuM assuming 29Deal Terms CTP Story & Future Key Investment Highlights
Largest Player in CEE Region, with Leading and Growing Market Share in 4
3
Countries
Operations Focused on Capital / Major Cities in Czech Republic and Romania, as Well as Hungary and Slovakia
#1 Logistics Property Company in CEE CZ RO
June 2020 GLA, MM sqm – CEE Only As of Dec-20A As of Dec-20A
37 3.2 MM sqm 15 1.5 MM sqm
5.8 Parks existing buildings(4) Parks existing buildings
4.3 4.0 3.9
RO
Prague Cluj-Napoca
2.4 Pilsen
Ostrava Brasov
Ploiesti
Brno Parks Constanta Parks
CZ >30,000 sqm Timisoara >30,000 sqm
Bucharest
only only
(1) (2) (3)
76% GLA 5.8 MM sqm 96% GLA 3.1 MM sqm
in key cities land bank(7) in key cities land bank(7)
Source: Company Data
CTP Continuing to Grow Market Share HU SK
As of Dec-20A As of Dec-20A
Market Shares
5 0.5 MM sqm 7 0.4 MM sqm
Parks existing buildings Parks existing buildings
Take-Up In Place GLA
Share(5) Share(6)
Q2 Zilina
29% > 22% Budapest
2020 SK
Parks Bratislava Parks
Q3 HU >30,000 sqm >30,000
30% > 22% only sqm only
2020
Q4 83% GLA 0.6 MM sqm 55% GLA 1.3 MM sqm
25% > 23%
2020
in key cities land bank(7) in key cities land bank(7)
Source: JLL Source: JLL
Notes: 4. Includes total owned portfolio
1. P3 Logistics Parks GLA as of Dec-19 5. Based on net take-up in CTP markets (ex Poland)
2. GLP GLA is reflective of its cross-European portfolio as Sept 2020 6. CTP’s Gross Lettable Area as a percentage of total stock in CTP’s core markets (ex Poland)
3. Panattoni GLA is reflective of its cross-European portfolio as of Mar 2019 7. Amount of total land bank owned and under option, totalling 12.6 MM across CTP’s whole portfolio
30Deal Terms CTP Story & Future Key Investment Highlights
3 CEE Markets In Which We Operate Exhibit Favourable Macroeconomic Trends
Strong Macro Backdrop in CEE, Expected to Significantly Outperform Western Europe
1 Average Real GDP Growth in 2015-19 (1)(2)
(%)
3.9%
CTP Markets in CEE Have 1.8%
Exhibited Historically High GDP
Growth…
CEE Western Europe
(avg) (avg)
Source: Oxford Economics
2 Gross Gov. Debt / GDP 2020F (1)(2)
(%)
AA- BBB- A- BBB A+ BB+ A AAA AA AA AAA AA BBB
… Combined with Healthy Public
Debt Levels Underpinning CEE Avg.: 57% W. Europe Avg.: 123%
Robust Sovereign Ratings 164% 173%
140% 135% 109%
55% 79% 60% 59% 72% 68%
41% 47%
CZ RO PL HU SK RS ES NL BE UK DE FR IT
Source: Oxford Economics S&P Sovereign Rating
3 Average Real GDP Growth in 2020F, 2021-2024F (1)(2)
(%)
3.7% 3.3%
CEE Expected to Have Shallower
Decline and Faster Growth
Following the (4.6%)
COVID-19 Pandemic
(8.3%)
CEE Western Europe
(avg) (avg)
Average Real GDP Growth 20F
Source: Oxford Economics Average Real GDP Growth 21F-24F
Notes:
1. Average statistics across the following CEE countries: Czech Republic, Romania, Poland, Hungary, Slovakia, Serbia
2. Average statistics across the following Western European countries: Spain, Netherlands, Belgium, UK, Germany, France and Ital y 31Deal Terms CTP Story & Future Key Investment Highlights
Demand for Industrial Space Driven By e-Commerce Penetration
3
and Deep Integration of Supply Chains with Western Europe
Sector Trends Favour Established Logistics Players
4 e-Commerce Sales 19-21E CAGR
(%)
Strong E-Commerce Growth and 23%
18%
Increasing Penetration 14% 13% 12% 10% 13%
CEE ES IT DE UK FR Western Europe
Source: eMarketer
5 Shipment of Robotics Units 19-21E CAGR
(%)
CEE Expected to Achieve the
22%
Highest Growth in High-Tech
11% 8% 9%
Manufacturing vs. Rest of Europe 5% 5% 3%
CEE
(1) ES FR DE IT UK Rest of Europe
Source: International Federation of Robotics
6 Vehicle Units Production 19-23E CAGR
(%)
Mobility concepts, Autonomous 10% 8% 6% 5%
driving, Digitalization drive high 1% 1% - -
investment
(2%) (3%) (6%)
SE HU RO SK CZ PL FR ES DE IT UK
Source: BMI Research
7 Doing Business Ranking, World Bank
May 2019
90 GR
Rank ing: Ease of
Doing Business
HU RO
Complex Development 60 POL
Regulations Favouring SP IT
SK
Estabilished Players 30 CZ
FR
UK GER
#1
0
0#1 50 100 150
Ranking: Ease of Construction Permits
Note:
1. CEE includes Czech Republic, Romania, Slovakia, Poland, Hungary, and Serbia 32Deal Terms CTP Story & Future Key Investment Highlights
3 Logistics Space Undersupplied in CEE vs. Western Europe
Poland is the Leading Country in CEE by Total Logistics Stock Amounting to 20.4 MM sqm
2x Logistics Stock in Western Europe vs CEE Logistics Stock in CEE(1) Logistics Stock in CEE (excl. Poland)
Logistics Stock per Capita, sqm per 1,000 population % of Total Logistics Stock in CEE % of Total Logistics Stock in CEE, excl. Poland
SK SK
7% CZ 15%
938 RO 23%
12%
RO CZ
HU 47%
26%
6%
475
422
PL
52% HU
12%
Total: 39.5 MM sqm Total: 19.1 MM sqm
(1) (2)
Western Europe CEE CEE
(avg) (avg) excl.PL
(avg) Source: JLL (data as of Q3 2020)
Source: JLL (data as of Q3 2020), Eurostat
Consistently Low Vacancy Rates Across CEE Logistics Markets Reverse Trends in Migration in Europe
Logistics Vacancy Rates – Q4 2020
• In 2020 Europe saw reverse migration: many Eastern Europeans
have returned back home
7% 17% 65% 8%
– ~1.3 MM Romanians went back to Romania – exceeding 3x
the population of its second-largest city
– ~500K Bulgarians returned to Bulgaria, a country with
Greater population of c. 7 MM
Budapest area
7.9%
6.2%
4.2%
2.0%
Slovakia Romania Czech Republic Hungary
Vacancy rate, % Country share in CTP’s GAV
Source: The Economist (Jan 30th 2021 edition)
Source: JLL (data as of Q4 2020)
Notes:
1. CEE includes Poland, Czech Republic, Slovakia, Hungary and Romania
2. Western Europe includes Belgium, the Netherlands, Germany, Spain, Italy, the UK, and France
33Deal Terms CTP Story & Future Key Investment Highlights
€5.9 Bn Portfolio on 6.2% Yield, ~85% Adjacent to Capital/Major Cities and with
4
Significant Development Potential
Portfolio of 70 Business Parks(1) Integrated within Main European Logistics Hubs and Transportation Corridors
Baltic Sea
North Sea
€5.9 Bn(2) 5.9 MM 6.2%
Gdansk
sqm
GAV Owned GLA EPRA Topped-up
(Dec-20) (Dec-20) Net Initial Yield(3) (Dec-20)
Hamburg
UK
PL Warsaw
NL 1 MM sqm €344(4) MM 28 Parks
Lodz
London
Amsterdam Berlin >50K sqm making up
Poznan Pipeline Under Annualized Rental
Magdebourg 75% of the portfolio
Rotterdam Construction Income (Dec-20)
(Dec-20)
Antwerp DE Wroclaw
Brussels Düsseldorf Dresden
94% 6 years 85%
Lille
Katowice
of Portfolio
Le Havre Kraków
Pilsen Prague Occupancy WAULT(5) Adjacent to
Frankfurt Ostrava Capital / Major Cities(6)
(Dec-20) (Dec-20)
(Jun-20)
Nuremberg Brno Zilina
Paris CZ
FR SK
% of Portfolio GAV (Dec-20) Bratislava
Vienna
Munich RO
Slovakia 7% Other 4%
Budapest
Hungary Cluj-Napoca
8% Zurich AT Brasov
HU
Romania Ploiesti
8% Geneva
Czech SL Black Sea
Lyon Zagreb Timisoara
Republic
Bordeaux Trieste Bucharest Constanta
65% Milan Venice
Turin Rijeka
HR Belgrade
Drive Time From CZ
Genoa Bologna RS
Dresden 1 hour
BU Varna
Vienna 1.5 hour
Marseille Adriatic Sofia
Munich 2.5 hours Sea
Berlin 2.5 hours Mediterranean Sea IT
Istanbul
Frankfurt 3.5 hours
Barcelona
Capital Cities Major Cities Main Ports Main Airports Country Border Highways Top 10 CTParks
Notes: 4. Dec-20A rent roll including service charge income (Base rent + other rental income + extras for above standard technical
1. Defined as equal to or more than 2 buildings in total improvement + services – rent frees)
2. Includes investment portfolio (c.€5.4 Bn), under development (c.€0.4 Bn), and PPE (c.€0.1 Bn) 5. Weighted average unexpired lease term
3. Defined as annualised net rents including lease incentives divided by completed property value 6. In terms of GAV 34Deal Terms CTP Story & Future Key Investment Highlights
4 CTPark Brno – The Tech and R&D Park
Technology Park Located in Czech Republic’s Innovation Hub 507 ksqm
110 ksqm
Development 52 Tenants (1)
and 2nd Largest City In-place GLA(1)
Opportunity(1)
Premier Logistics park launched by CTP in 2005; part of the high-tech cluster of the >50 tenants across Logistics / R&D and high-tech production
“Czech Republic Silicon Valley” 13 Universities in the region: highly skilled local workforce
From 47k sqm GLA in 2005 to ~500k sqm Top 10 Largest CTParks
DE PL Today k sqm (Dec-20A)
Wroclaw
Dresden
5 19 33 52 Park GLA Potential
Katowice Buchar. W RO 661 590
Kraków
CAGR Brno CZ 507 110
Prague 465 507
+17%
Pilsen Bucharest RO 506 87
Ostrava
Bor CZ 417 90
CTPark
Brno Brno 191 Ostrava CZ 377 8
Nuremberg Zilina
CZ Modřice CZ 205 11
47
SK Budap. W. HU 201 50
Bratislava Bratislava SK 117 8,5
Vienna 2005 2010 2015 2020
Munich (current) Pohořelice CZ 115 12
AT Budapest
GLA (k sqm) Tenants Budap. E HU 104 56
Located just 5 km from Brno city centre on the D1 motorway between Prague and Our Top 10 parks represent 58%
CTPark Brno is CTP’s 3rd largest park by GLA
Ostrava; Airport and train station only a few minute’s drive of our total GLA
Source: Company data
35Deal Terms CTP Story & Future Key Investment Highlights
CTPark Bor – Largest Logistics Park in Czech Republic, 15’ from German
4
Border
~417K sqm GLA CTPark with Direct Highway Connection to Key German Markets 417K sqm 111K sqm 90K sqm
In-place GLA(1)
Under Development 23 Tenants(2)
(Munich, Nuremberg) Development(1) Opportunity(1)
Nuremburg
Prague
Highly successful Logistics park launched by CTP in 2006; set to reach 600k >20 tenants across Logistics / Retail / Auto-supply manufacturing
sqm GLA in 2021E Extensive on-site amenities incl. service center, offices, medical center
From CTPark Bor
Poznan Developed in 2006: ~417K sqm in 2020
Magdebourg Berlin
Prague airport
Lodz 2 hours
POL Regensburg 2 hours 10 14 23
DE
Schwandorf 1 hour
Dresden Wroclaw 417
Düsseldorf Plzen 0.5 hours
D5 Katowice Kraków
345
Frankfurt Pilsen Prague
A3 Ostrava 264
CZ
E50 CTPark Zilina
Nuremberg
Bor Brno
A9
SK
2010 2015 2020
Bratislava
Vienna GLA (K sqm) Tenants
Munich AT HU
Located midway between Prague-Nuremberg on the D5/E50 motorway with One of the most successful business parks in CEE
great connectivity to Germany/Czech Republic Employing >3,000 staff on site with highly skilled local workforce
Source: Company data
Notes:
1. As of December 2020
2. As of September 2020 36Deal Terms CTP Story & Future Key Investment Highlights
4 CTPark Bucharest – Designed for Last Mile Logistics, 10’ from City Centre
~506K sqm GLA CTPark located in Bucharest’s Most Important Interchange 506K sqm 29K sqm 87K sqm
In-place GLA(1)
Under Development 79 Tenants(2)
Giving Access to the Entire City (30 min by Car) Development(1) Opportunity(1)
Last mile Logistics park launched by CTP in 2015, with fully customizable A- c.80 tenants across Logistics / Retail
class Premium units Extensive on-site amenities incl. site maintenance, 24/7 security
Ostrava From CTP Bucharest
From 129K sqm GLA in 2015 to ~506K sqm in 2020
CZ Brno City Centre 0.5 hour
Zilina
SK Constanta 2.5 hours 26 79
Bratislava
Vienna
CAGR 506
RO +31%
Budapest
AT Cluj-Napoca
Brasov
HU Ploiesti 129
CTPark
SL Timisoara Bucharest
Black Sea
Zagreb
Bucharest Constanta 2015 2020
GLA (K sqm) Tenants
HR Belgrade BU
RS
Premium location at Bucharest’s most important interchange giving access Size of the park has increased by ~4 times in the last 5 years
to the entire city, only 15-min ride to nearest metro station Employing >1,400 staff on site with highly skilled local workforce
Source: Company data
Notes:
1. As of December 2020
2. As of September 2020
37Deal Terms CTP Story & Future Key Investment Highlights
4 CTPark Bucharest West – The Western Gateway
~661 ksqm GLA CTPark with Direct Access to the A1 motorway – 661K sqm 86K sqm 590K sqm
In-place GLA(1)
Under Development 26 Tenants(2)
the Primary East-West Corridor Development(1) Opportunity(1)
Premier Logistics park acquired by CTP in 2015; expected to reach ~1 MM
>25 tenants mainly Logistics and e-Commerce operators
sqm GLA and become one of the largest industrial parks in the CEE region
Budapest From CTP Bucharest W.
Cluj-Napoca Acquired in 2015: ~661K sqm in 2020
A1 E60 Bucharest 0.5 hour
Brasov
A1 / E81
12 26
SL Constanta 3.0 hours
Ploiesti
HU CAGR
CTPark +37% 661
A1 / E81
Zagreb Timisoara Bucharest West
Bucharest Constanta
RO
Belgrade Black Sea 137
HR
RS
BU Varna
2015 2020
Sofia GLA (K sqm) Tenants
Adriatic
Sea
Located at 10 Km from Bucharest ring road, with direct access to A1 Size of the park has increased by ~5 times in the last 5 years
motorway connecting East and West Employing >1,700 staff on site with highly skilled local workforce
Source: Company data
Notes:
1. As of December 2020
2. As of September 2020
38Deal Terms CTP Story & Future Key Investment Highlights
700+ International and Highly Diversified Tenant Base, Generating Highly
4
Resilient Operating Cash Flows with €344MM(1) Annualised Rental Income
~85% of Portfolio Exposed to Warehousing Activities (2020)
Broad and Diversified Tenant Base Consisting of 700+ Tenants Overview of Top 20 Tenants
% of
Tenant Industry Breakdown Revenue by Building Use(3) Company
2020 GRI
(4) Total
Total GLA
(6) Industry
# of
% of Dec-20A GLA % of 2020 GRI(4) (€MM) (4) (k sqm) locations
GRI
Other (2) Other (5) 8.0 2.7% 177 Logistics 17
5% Office
Warehousing 13% 2% 5.9 2.0% 149 Logistics 9
3PL &
& Logistics Distribution 5.9 2.0% 70 Production 5
51% 20%
Manufacturing
5.3 1.8% 124 Logistics 7
19%
4.9 1.6% 93 Logistics 9
4.2 1.4% 65 Electronics 2
4.2 1.4% 23 IT 1
4.0 1.3% 49 Automotive 5
Automotive Manufacturing &
Logistics /
24% Warehousing 3.8 1.3% 72
Automotive
1
65%
3.6 1.2% 68 Automotive 6
Total Exposure to
Warehousing: 85% 3.5 1.1% 51 Logistics 5
3.4 1.1% 44 Automotive 7
Breakdown of Automotive Tenant Base Top Tenants 3.0 1.0% 65 Retail 1
% of Dec-20A GLA % of 2020 GRI(4)
GEFCO 3.0 1.0% 42 Logistics 11
Electric 2.0%
2.0%
9% 2.9 1.0% 54 IT 1
Body 2.8 0.9% 67 Automotive 3
10% Interior 2.7% 1.8%
Production /
& Exterior 2.8 0.9% 42
Logistics
3
48% 1.6%
2.7 0.9% 57 IT 2
Powertrain
15% 2.6 0.9% 56 Logistics 7
2.4 0.8% 30 Automotive 3
Chassis Total 1,398
17%
Top 5 Tenants = 9.9% of 2020 GRI
Source: Company Information
Notes:
1. Dec-20A rent roll including service charge income (Base rent + other rental income + extras for above standard technical 4. Cash-based. Includes service charge income
2. Other include hotels, parking, retail and other
3. Excluding hotels
5.
6.
Other includes retail, parking and other
As of Dec-20
39Deal Terms CTP Story & Future Key Investment Highlights
Proven Tenant-Led Development Strategy Generating Double Digit Yield on
5
Cost
Vertically Integrated Model Allows for Low Risk/High Return Development Strategy Primarily via Pre-let Build-to-suit Projects
Key Success Factors Solid Development Delivery Track-Record Target
Occupancy 98%
95% Rate(1) 95% 95% 94% 95%
Largely zoned land / bank(3)
1 5.4 MM sqm buildable area in
attractive locations Tenant
86% 86% 83% 92%
retention
Large client base + on the GLA
built (sqm) 394 617 320 585 >1,000
2 ground local teams to quickly
identify sources of demand 13.5%
Average YoC (incl. Land):
12.5% 12%
Yield on
cost 11.6% >10%
10.8%
In-house design team to deliver
3
bespoke client solutions
Extensive experience and local
4 relationships to navigate complex
permitting process in the region
In-house general contractor +
5 network of trusted suppliers to
deliver on-time and on-budget
2017A 2018A 2019A 2020A 2021 Already under
Construction
Yield on cost (incl. land)(2) (%) Development delivery (k sqm) Occupancy Rate (k sqm)
Source: Company data
Notes:
1. Based on area (sqm) – Owned land bank only
2. Yield on cost of the five largest assets developed each year, representing an average of 35% of total assets developed between 2016-2020. Calculated as rental value (signed in lease agreements) divided by development cost including land
3. 8.8 MM sqm owned + 3.8 MM sqm under exclusive option = 12.6 MM sqm land bank with c.43% buildable area ratio (As of 31 December 2020)
40Deal Terms CTP Story & Future Key Investment Highlights
6 Industry Frontrunner on Sustainability / ESG (1/2)
Focus on High Asset Quality and Sustainability Reflective of Our “Build to Long-Term Own” Strategy
CTP Mid-term Green Targets Selected Implemented Actions
Tree Planting Smart Metering
100% BREEAM certified
portfolio
Objective to be carbon
neutral in its operations
by end of 2021
CTP launched a forest restoration program to preserve 1 sqm of CTP installs smart meters in most properties combined with a
Reforest one square forest for each sqm of built portfolio building management system (‘BMS’) in newer buildings
metre of land mid-term
for each square metre of
Water Containment Facility Full Led Lighting
GLA
Complete the Zero Waste
Initiative launched in
2019
All of CTP’s new
buildings constructed
‘Solar Ready’ since 2010 CTP collects rainwater for use in sprinker systems and for CTP is maximising the use of LED lighting and recycled /
landscape irrigation recyclable materials
• €4 Bn EMTN programme set-up in September 2020: €650MM, €400MM, and €500MM already raised unsecured green bonds in October 2020, November 2020, and February 2021
• CTP currently intends to only issue green bonds in the future
• Full Greenbond framework completed in inaugural bond issuance and certified by Sustainalytics
Source: Company data
41Deal Terms CTP Story & Future Key Investment Highlights
6 Industry Frontrunner on Sustainability / ESG (2/2)
CTP Aims to Continue to Invest within Solar as a Key Sustainability Initiative
CTP’s Solar Vision Key Stats of CTP’s Solar Portfolio
Since 2010, all of CTP’s newly developed
buildings are ‘solar ready’(1): Successfully
8
implemented pilot 6MWp project
6.4 MWp
130 K
Current plans comprise building
installed capacity of 250 MWp with up to Installed
Solar Plants sqm of roof
installed capacity of 700 MWp Capacity space
covered
Asset Impressions
CTP targets to develop 20 MW of Ponavka Brno
electricity capacity in Czech Republic in
2021 alone
CTP plans to reinvest profits generated
in solar activities into further
environmental initiatives
CZ CZ
Source: Company data
Note:
1. Either the roofs are built to allow the creation of a PV solar power plant on each building by incorporating the necessary hook up technology, or the roofs are built with PV solar panels already installed
42Deal Terms CTP Story & Future Key Investment Highlights
Driven by Experienced, Entrepreneurial Senior Management Team Led by
7
Visionary Founder/Owner/CEO Strongly Aligned with New Investors
Hands-on Senior Management Team with Long Experience of Working Together; 394-Employee Platform Covering All Functions In-house;
Average 14 Years Real Estate Experience
COUNTRY MANAGEMENT
INVESTOR
BOARD
RELATIONS
CZECH REPUBLIC ROMANIA POLAND
Remon L. Vos, Frics Richard Wilkinson Jan-Evert Post David Chládek Ana Dumitrache Gijs Klomp Anna Piasecka
Founder & Group CEO Deputy CEO & Group CFO Head of Investor Relations Country Head Country Head Head of Business Dev. Deputy Country Manager
FINANCE LEGAL HUNGARY SLOVAKIA
Arno van Hummel Zdeněk Raus Kveta Vojtova David Huszlicska Veronika Lado Stanislav Pagáč Ivan Šimo
Financial Director Group Treasurer Head of Corporate / Legal Country Head CFO Country Head Construction Director
COMPLIANCE DESIGN RESEARCH SERBIA BULGARIA AUSTRIA
Rohia Hakimova Martin Vaidiš Bert Hesselink Vlatko Djuricek Dragana Djordjevic Vladimir Gurdjief Karl Brückner
AML / Compliance Officer Head of Design Research / Data Director Country Head CFO Country Manager Development Director
43Deal Terms CTP Story & Future Key Investment Highlights
7 Seasoned and Balanced Board of Directors
Qualified Board of Directors Covering All Key Competencies of CTP’s Business With 4 Non-Executive Directors
Executive Non-executive
Nationality
17%
33%
17%
Remon Vos Richard Wilkinson Barbara Knoflach Gerard van Kesteren Susanne Eickermann- Pavel Trenka 17% 16%
Riepe
Senior Independent Dutch British
Role in Board Member, CEO Member, CFO Member Member Member Austrian German
Director1
Slovak
Initially elected 2019 2020 2021 2021 2021 2021
End of term indefinite 20252 2024 2024 2024 2024
Chair of the Age
General
CTP CFO since Former global Board at ICG 4
2018 head of BNP Institute and
Co-founder of CTP
Former head of Paribas REIM, Former CFO of RICS Germany Former CEO of
Background CTP CEO since 1 1
commercial RE deputy CEO of Kuehne + Nagel Former partner HB Reavis Group
1999
business at Erste BNP Paribas and head of
Group Real Estate German Real 60
Estate at PwC
Real estate Gender
Logistics
Executive management
Finance 33%
Competence
Int. capital markets
67%
Strategy
Human capital
Legal
Risk management Male Female
Sustainability
Age 50 56 55 71 60 47 CTP expects its board
composition to comply with
Gender M M F M F M
independence
pending Dutch legislation
Diversity and
Nationality Dutch British Austrian Dutch German Slovak introducing a quota of at
Own shareholdings Yes No pre IPO No No No No least one-third of the non-
executive directors being
Disclosed in Disclosed in Disclosed in Disclosed in
Other mandates No No male and at least one-third
Prospectus Prospectus Prospectus Prospectus
being female
Source: Company data
Notes:
1. Senior Independent Director of the Board
2. 4-year term starts as of the Settlement Date in 2021 44Deal Terms CTP Story & Future Key Investment Highlights
Scalable Platform Positioned for Continued Growth, Targeting >10 MM sqm
8
GLA by End of 2023 (1/2)
Steady Build-Out of Controlled Land Bank via Primarily Pre-let Projects, Complemented with Potential Disciplined Expansion in Adjacent Markets
Over Time
New Markets
Structural 700+ 5.4 MM sqm (Austria, Poland,
Platform Access to Capital
Demand Drivers Tenants Buildable Capacity Bulgaria, Netherlands
and others)
GLA under Management (1) From 2021 target, >10
>10
62% already
pre-let
(~20% of
>7.5 annual growth)
6.3 (~20% of
annual growth)
1 MM sqm To be started Acquisitions Land Bank Acquisitions Land Bank Acquisitions
2020A 2021E 2022E 2023E 2023+
already under and delivered Build-out Build-out
construction in 2020
Notes:
1. Including 0.4 MM sqm portfolio under management for DEKA
2. Strategic partnership signed in 2021 with local developer MDC² in Poland, where CTP aims to build and own a portfolio of full-service high quality business parks totalling at least 1.75 million m² of GLA until the end of 2025
45Deal Terms CTP Story & Future Key Investment Highlights
Highly Competitive Double-Digit Total Return Profile, Driven By 6.8% Asset
9
Yield Market Leading >10% YoC, Targeted Acquisitions & Strong Balance Sheet
Targeting Mid Double-Digit Annual Total Return Through Secured Rental Yields and Significant Value Creation on Largely Pre-Let Development
Projects, and Before Potential Further Upside From Yield Compression in CEE
Mid Double-Digit Annual Total Return Profile
Base Case Drivers Additional Upsides
• Low funding cost
• 300 bps prime • Untapped
and refinancing
logistics yields adjacent
• 1 MM sqm GLA upside: current
under construction / spread between markets
WACD 1.6% incl.
Largely pre-let CEE (~7%) and • Platform for
€1.8 Bn Czech
• 12.6 MM sqm land facility at ~1.9%
Western Europe consolidation
• Contractual bank(3) for largely pre- (~4%)(4)
versus CTP 5 and 6
indexation at let projects
• Income producing • >10% development year bonds yielding
~1.5% 0.70% & 0.89%;
portfolio yield
• +1.75% average
• 6.8% Asset • Recurring potential ratings
LfL rental growth investment in land upside post IPO
Yield(1)
since 2017(2) bank
• ~95% occupancy
Income Producing LfL Development Funding Cost Scope for Yield External
Portfolio + Growth + Capacity + + Convergence + Growth
Source: JLL Research, Dec 2020
Notes:
1. As of Dec-20A. Annualized rental income of €344MM divided by standing portfolio GAV of €5.1Bn
2. Like-for-Like rental income growth is based on the rental income generated by contracts active during the comparable periods. Contracts starting, expiring or renegotiated during compared periods are excluded
3. 8.8 MM sqm owned + 3.8 MM sqm under exclusive option = 12.6 MM sqm land bank with c.43% buildable area ratio
4. Source: JLL, values as of Q3 2020
46Deal Terms CTP Story & Future Key Investment Highlights
9 2021 and Medium Term Targets
CTP’s Vertically Integrated Business Model to Continue to Deliver Double-Digit, Self-Generated Growth…
Income and Growth
• €344 MM annualised rental income(1) for owned GLA as of Dec-20A
‒ 2021 LfL rental growth consistent with historical levels
‒ 2021 NRI margin broadly stable at historical levels
• Target >7.5 MM sqm AuM GLA by end of 2021:
‒ 6.3 MM sqm in place AuM GLA at Dec-20A (5.9 MM sqm owned GLA)
‒ 1 MM sqm of projects already under construction (100% owned GLA), 62% pre-let, >€56 MM additional rental income
2021 Targets ‒ 20% of annual growth from selected acquisitions
• Stable ~95% occupancy
• Cost of debt
‒ Average cost of funding now down to 1.6% vs. 2.2% before 1st bond issued in Sep-2020
‒ Opportunity for early refinancing in 2021 of €1.8 Bn Czech facilities currently at ~1.9%
‒ CTP 5 and 6 year bonds yielding 0.70% & 0.89%; potential ratings upside post IPO
• No material negative change in impact of Covid-19
• On track to reach AuM GLA of >10 MM sqm by end of 2023
‒ 100% of growth coming from wholly-owned projects
Medium Term – Primarily build-out of controlled land bank completed with targeted strategic acquisitions accounting for 20% of GLA growth
Targets • Medium term pipeline development economics:
‒ Target to maintain Yield-on-Cost (including land): >10% (including potential dilution effect of entering new markets)
• Land bank: targeting an annual spend of €100-150 MM with recurring replenishment
• Target 70-80% dividend pay-out ratio (Based on Company Specific Adjusted Earnings(2))
Dividend
Policy
• 100% scrip dividend option
• First interim dividend payable in September 2021 corresponding to H1 2021
Notes:
1. Dec-20A rent roll including service charge income (Base rent + other rental income + extras for above standard technical improvement + services – rent frees)
2. EPRA Earnings restated for company specific adjustments
47You can also read