COVID-19 Pandemic Uncertainty Shock Impact on Macroeconomic Stability in Ethiopia
←
→
Page content transcription
If your browser does not render page correctly, please read the page content below
Munich Personal RePEc Archive

COVID-19 Pandemic Uncertainty Shock
Impact on Macroeconomic Stability in
Ethiopia

Demiessie, Habtamu

Jigjiga University, Ethiopia

20 August 2020

Online at https://mpra.ub.uni-muenchen.de/102625/
MPRA Paper No. 102625, posted 01 Sep 2020 01:28 UTC
COVID-19 Pandemic Uncertainty Shock Impact on Macroeconomic Stability
                                in Ethiopia

                               By: Habtamu Girma Demiessie1

                                                                                             August 2020

1
 Assistant Professor of Economic Policy Analysis at Jigjiga University (JJU), Ethiopia. He can be reached at
Email: ruhe215@gmail.com or hab200517@yahoo.com

1|Page
Abstract This study investigated the impact of COVID-19 pandemic uncertainty shock on the macroeconomic stability in Ethiopia in the short run period. The World Pandemic Uncertainty Index (WPUI) was used a proxy variable to measure COVID-19 Uncertainty shock effect. The pandemic effect on core macroeconomic variables like investment, employment, prices (both food & non-food prices), import, export and fiscal policy indicators was estimated and forecasted using Dynamic Stochastic General Equilibrium (DSGE) Model. The role of fiscal policy in mitigating the shock effect of coronavirus pandemic on macroeconomic stability is also investigated. The finding of the study reveals that the COVID-19 impact lasts at least three years to shake the economy of Ethiopia. Given that the Ethiopian economy heavily relies on import to supply the bulk of its consumption and investment goods, COVID-19 uncertainty effect starts as supply chain shock, whose effect transmitted into the domestic economy via international trade channel. The pandemic uncertainty shock effect is also expected to quickly transcend to destabilize the economy via aggregate demand, food & non-food prices, investment, employment and export shocks. The overall impact of COVID-19 pandemic uncertainty shock impact is interpreted into the economy by resulting under consumption at least in the next three years since 2020. Therefore, the government is expected to enact incentives/policy directions which can boost business confidence. A managed expansionary fiscal policy is found to be key to promote investment, employment and to stabilize food & non-food prices. A particular role of fiscal policy was identified to stabilizing food, transport and communication prices. More importantly, price stabilization policies of the government can have spillover effects in boosting aggregate demand by spurring investments (and widening employment opportunities) in transport/logistics, hotel & restaurant, culture & tourism and export sectors in particular. 2|Page
Acknowledgment

The author would like to extend his sincere regard to Jigjiga University Vice President Office for
Research and Community Service (JJU-VPRCS) for financing this study. A special gratitude goes to my
colleagues at JJU-VPRCS: Dr. Tesfu Mengistu, Dr. Elyas Abdulahi, Mr. Muyhedin Mohammed, Dr.
Solomon Yared and Dr. Binyam Bogale for their amenable managerial services from the very start of the
study. I also owe my friend Mr. Miler Teshome, whose encouragement was a positive energy in the
process of undertaking the research.

3|Page
1. Background & Justification

Quiet unprecedented in the world history in memory, all corners of the globe is living at a
standstill following the outbreak of coronavirus pandemic. A highly contagious viral disease,
Cvid-19 (the scientific name of the disease) has stopped virtually every human activity at global
scale, as people`s movement curbed;; by way of controlling the spread of the pandemic (Fetzer,
T. et al, March 2020, Politico, March 19/2020).

Expertise commentaries on Covid-19 dub the disease an economic pandemic, to signify counting
the cost of the cure is getting dear than the problem itself. The size of the shock will be
determined mostly by the measures taken to avoid large scale contagion and to limit the area of
spread. Thus, the containment measures – the disruption to work processes, the limitations on
meetings and travel – will be a larger negative supply shock than the number of deaths, even if
the latter could still turn out to be large. Full or partial lockdown, like in China, is one of the
most extreme measures and can bring production and consumption almost to a standstill. Such
extreme measures are likely to remain restricted to certain areas and will be difficult to maintain
for a long time (Baldwin, R. and Weder di Mauro, B., 2020).

Ethiopia announced the first case of coronavirus on March 13 2020. Since then Coronavirus has
taken the single most topic grabbing the dialogue among the Ethiopian society. The government
of Ethiopia has also considered the issue a number one national agenda, where a number of
measures and actions taken to fight the spread of the disease. (Africa News, REUTERS)

In a bid to curb the spread of the disease thereby limiting the movement of people, the
government announced for schools & universities to shut-down; also large portion of personnel
in the public service were set to stay home.

While much of public and private businesses are almost in their shutdown, counting the cost of
the pandemic has been undertaken by think thank groups and professional institutions working in
Ethiopia. In this regard, the policy researches by Ethiopian Economics Association and Policy
Institute has produced two policy papers on COVID-19 economic wide impact on Ethiopia. A
study by EEA2, titled, The economy wide impact of the COVID-19 in Ethiopia: Policy and
Recovery options’, investigated the short, medium and long term impacts of COVID-19 on the
Ethiopian economy. Using a dynamic Computable Equilibrium (CGE) model, the study captured
the impact of the pandemic on productivity growth of labor and capital the impacts on Foreign
Direct Investments and Remittances, export demand, import supply, transaction costs and the
anticipated government interventions. The study reported the pandemic effect under mild and
severe case scenario. Accordingly, under amplified (or severe) pandemic scenario, the total loss

2
    Tadele Ferede, Getachew Diriba and Lulit Mitik Beyene. 2020

4|Page
on the economy as a result of COVID-19 shock is estimated at 310 billion birr in FY 2020/21, whose effect downgraded the forecast estimate on economic growth in 2020/21 to 0.6%3. A study by FDRE Policy Institute (PI) aimed at identifying key policy alternatives to tackle the social and economic impacts of CIVID-19 on Ethiopia. An exploratory study investigated determinant factors on effectiveness and implications of public health measures aimed at mitigating the effect of COVID-19. Accordingly, factors related to demographic, economic and social settings are important in determining the economic damages associated with the public health measures to contain or suppress the virus. The study recommended targeted and combined social and economic policy measures to overcome COVID – 19 effects on the economy4. Another policy research, which was authored by Alemayehu Geda5, investigated the dynamic impact of the pandemic on the Ethiopian economy. Using auto-regressive distribution lag model (ADL) model, the study focused on the COVID-19 effect on the service sector of Ethiopia. Finding from this study reveal that a ten percent increase in confirmed weekly cases in Ethiopia is found to lead to a 1.1 and 6.8 percent reduction in demand for hotels in the long and short run, respectively This reduction becomes 8.5% and 3.7 % for restaurants and air travel services in the short run. The study further estimated that demand for services in the tourism sector to decline by about 15 to 17 percent for a ten percent increase in confirmed weekly cases in the short run. In the other hand, the estimation from the study indicated COVID-19 shock results in an increase in the demand for communication services, where a 10% increase in weekly cases estimated to increase the demand for Zoom software demand (a proxy variable to communication service) by 5.6 percent both in the short run and the long run. Empirical evidences so far on the effect of COVID-19 on Ethiopian economy did not address the dynamic impact through the channel of uncertainty impact of the pandemic on macroeconomic stability. Therefore, this study tries to fill this gap. As such, analysis and inferences were made on COVID-19 uncertainty shock effect on the pillars of macroeconomic stability: Investment, Employment, Export expenditure, Import demand, Price Indices (both food and Non-Food prices) and Government Expenditures. Moreover, the role of fiscal policy to mitigate the effect of the pandemic in the short run period is also investigated. 3 The pre-pandemic growth projection for Ethiopian economy was 9% in the year 2020/21. 4 Alebel Bayrau Weldesilassie and Tassew Woldehanna. 2020. 5 Alemayehu Geda. 2020 5|Page
2. Methodology of Analysis and Inference
As the study encompasses both qualitative and quantitative elements, the data used to draw
inferences were based on qualitative and quantitative data sources.
i. Primary Data
The primary sources will be expert analytics given for media outlets (both local & international)
on the impact of Covid-19 on Ethiopian and the African economy. The author is also looking for
in-depth interviews from senior economists at the helms of economic research and economic
policy on Ethiopia.
ii. Secondary Data Sources
The quantitative data relies from secondary data sources. The secondary sources of study are
latest reports on Ethiopian economy from broader local and international sources: Like National
Bank of Ethiopia (NBE), Ethiopian Development Research Institute, Ethiopian economics
Association, Ministry of Finance and Economic Cooperation (MoFEC), Ethiopian Planning
Commission, among others.
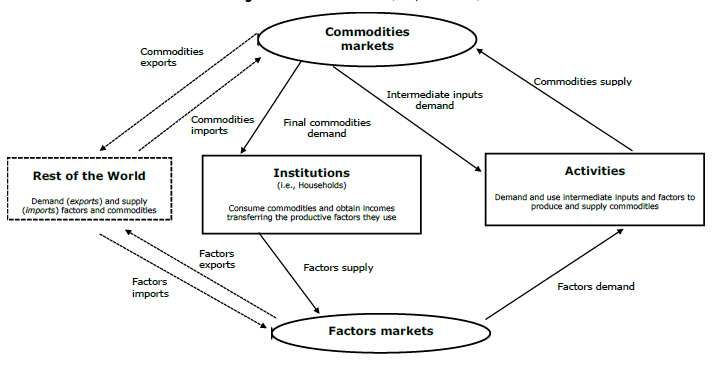
2.1. Conceptual Framework and Techniques of Analysis and Inferences
The study integrates both qualitative and quantitative techniques to analyze the data and make
inferences. The whole set of analysis and inference made in this study relies on circular flow of
economy. For this study, linkage in economic sectors/factors of productions/agents is based on
framework of World Bank Group that was used to construct the latest Input-output Matrix or
SAM matrix for Ethiopia (Andualem et al, 2020)
Figure 1: The Transmission Mechanism of COVID-19 Uncertainty shock
6|PageThe study employs both descriptive and econometrics techniques to analyze the data. The study
relies on the essentials of macroeconomic policy approach to draw of inferences to best address
the core objectives outlined. As such, narratives integrate positive and normative approach while
making analysis and inferences. Positive approach of making analysis involves making a
diagnostic look on the scale of damage of COVID-19 uncertainty shock on Ethiopian economy.
The normative aspect of analysis is meant to propose a viable policy options to mitigate the
macroeconomic instabilities as result of the pandemic shock effect.
By way of organizing and reporting the results of data analysis, the study adopted a framework
proposed by UNCTAD (2020) and UN-ECA (2020) (UNCTD, 202). Accordingly, narratives on
impact of COVID-19 on the Ethiopian economy are analyzed on three dimensions: The Domestic
Sector, The Foreign Sector and the policy circle.
2.2. Econometrics Analysis
To estimate on the seize and dimensions of effect of COVID-19 shock on macroeconomic
stability, the study relied on Dynamic stochastic general equilibrium models (DSGE) or
Bayesian Vector Auto-regressions (BVAR).
Bayesian Vector Auto-regressions (VARs) are linear multivariate time-series models able to
capture the joint dynamics of multiple time series (Miranda-Agrippin, S. and Ricco, G.; 2018)
The earliest studies employing Bayesian VARs (BVARs) to macroeconomic forecasting are
found in Letterman (1979) and Doan et al. (1984) Since then, VARs and BVARs have been a
standard macro-econometric tool routinely used by scholars and policy makers for structural
analysis, forecasting and scenario analysis in an ever growing number of applications.
Empirical evidences on the uncertainty shock effect of COVID-19 on macroeconomic stability
increasingly suggest Dynamic stochastic general equilibrium models (DSGE) or BVAR produces
produce sound results (For instance see Leduc and Liu (2020); Watanabe (2020); Ozili (2020)
and PINSHI (2020); Alemayehu G. (2020); Kiku, Oscar (2020)
The BVAR model to be estimated in this study is defined as follows:
∑( )
Where:
= Vector of Macroeconomic & Fiscal Policy Indicators and World Pandemic Uncertainty
Index (WPUI)
= Vector of residuals of reduced form at time t.
2.3. Definition of Model Variables
7|PageThe COVID-19 first time shock and uncertainty shock is estimated and forecasted using data on
core macroeconomic variables defined in the preceding section. Time series data set consists 46
quarters (Qs), where data on macroeconomic variables gathered spanning in the period between
2008/09 Q1 and 2019/20 Q2 was considered. In time series regressions, high frequency data set
is preferred over low frequency data set is preferred because to remove seasonality of variables
and to reduce the impact of high frequency measurement errors (Baker, Scott R. et al, 2020)
The BVAR model is structured by variables indicating all aspects of the economy: the aggregate
demand, aggregate supply, Genera Price Level, current account balance, policy and economic
uncertainty indicators.
Aggregate Demand Indicators: Aggregate Investment Expenditure (domestic and
foreign direct investments).
Aggregate Supply Indicators: Employment
General Price Level Indicators: Food Price Index (CPIF), Non-food Price indices
(Transport Prices, Education Prices, Hotel & Restaurant Prices, Health Prices,
Communication Price Indices)
Current Account Indicators: Export earnings and Import demand (import expenditure)
Fiscal Policy Indicator: Government Expenditure (sum total of recurrent & capital
expenditures)
COVID-19 Uncertainty Shock Indicator: the uncertainty impact of COVID-19 is tapped
by the World Pandemic Uncertainty Index on Ethiopia (WPUI) as a proxy variable. The
data on WPUI is accessed from www.worlduncertainityindex.com.
8|PageTable 1: Definition of Model Variables:
S/No Variable Definition Measurement Time Period Number of
(In Ethiopian Fiscal Year) Observations
1 World Pandemic A Proxy Measure of CIVID-19 The index is constructed by 2008/09 Q1- Uncertainty is associated to total count of five
Uncertainty Index (WPUI) Uncertainty Shock Impact counting the number of times 2019/20 Q2 pandemics namely: SARS, Avian Flu, Swine
a word related to pandemics is Flu, MERS, Bird Flu, Ebola and Coronavirus
mentioned in the Economist between 1996Q1 to 2020Q2
Intelligence Unit country
reports. Specifically, the index
is the percent of the words
related to pandemic episodes
in EIU country reports,
multiplied by 1,000. A higher
number means higher
discussion about pandemics
and vice versa.
2 Import Quarterly Value of Imports, by Major In Million Birr 2008/09 Q1-
Commodity Groups 2019/20 Q2
3 Non-Food Price Indices Quarterly National data on selected Indexed 2008/09 Q1- In Ethiopian context, non-food price index is
(COMMUNICATION;TRA Non-Food price indices (selected non- 2019/20 Q2 computed on average price index for the
NSPORT; EDUCATION; food prices in this study are: Transport, following list of products:
HEALTH, HOTELREST) communication, education, health, hotel Communication, Transport, Education,
& restaurant price indices Health, Hotel & Restaurant, recreation
& culture; Alcoholic Beverages and
Tobacco; Clothing & Foot-wear;
Housing, Water, Electricity/Gas and
Other Fuels; Furnishings, Household
Equipment and Routine Maintenance of
the House; Miscellaneous Goods
4 Food Price Index (CPIF) Quarterly National Food Consumer Indexed 2008/09 Q1- In Ethiopian context, food price index is
Price Index, 2019/20 Q2 computed on average price index for the
following list of products:
Bread and Cereals; Meat; Fish & Sea
Food; Milk, Cheese & Egg; Oils &
Fats; Fruits; Vegetables; Sugar, Jam,
Honey, Chocolate & Confectionery;
Food Products; Non-Alcoholic
Beverages
5 Investment (INVST) Investment Capital of Domestic and In Million Birr 2008/09 Q1-
Foreign Projects Approved by 2019/20 Q2
agriculture, industry, and service
Sectors in the quarter
6 Export Quarterly Value of Exports, by Major In Million Birr 2008/09 Q1-
Commodity Groups 2019/20 Q2
7 Employment Number of Employment (Permanent In number 2008/09 Q1-
(EMPLOYPG) and Temporary) opportunities Created 2019/20 Q2
by Approved Domestic and Foreign
Investment Projects with more than
250,000 birr registered capital in the
quarter
9 Government Expenditure Quarterly Government expenditure (on In Millions of Birr 2008/09 Q1-
(GOVTEXPEND) recurrent & capital expenditures and 2019/20 Q2
regional transfers)
9|PageHarmonizing the Data Set All quarterly dataset but World Pandemic Uncertainty Index (WPUI) was secured from the local sources. In Ethiopian context, there is difference between fiscal year and calendar year. The fiscal year starts in the month of July (HAMLE 1, in Ethiopian Calendar), while calendar year begins in month of September (MESKEREM 1). For obvious reason, fiscal year is considered in the time series dataset. The four quarters of the Ethiopian fiscal year are: Quarter One: July, August and September; Quarter Two: October, November and December; Quarter Three: January, February and March; Quarter Four: April, May and June Quarterly data on WPUI is secured from foreign sources, based on Gregorian calendar. The months/quarters of the fiscal year as in Gregorian calendar are as follows: Quarter One: January, February and March; Quarter Two: April, May and June; Quarter Three: July, August and September; and Quarter Four: October, November and December. Hence, the first and last quarters of all data sets on WPUI was customized to Ethiopian fiscal year. As such, in the data used for regression on WPUI variable, observation in the third quarter of 2008 in the Gregorian calendar was taken to hold the first quarter (first observation) of start year for time series data i.e.2008/09. The data on WPUI from the source as i.e.2020 Q1 was taken as the last observation in the data set i.e. 2019/20 Q2 in Ethiopian fiscal year. All observations on model variables except World Pandemic Uncertainty Index (WPUI) were transformed into logarithmic value before regression was made. BVAR Statistical Tests Before undertaking VAR estimation and prediction, each model variables were subjected to seasonality and Unit Root Tests. Seasonality Test When a time series data is measured for high frequency series, like monthly or quarterly, they may contain pronounced seasonal variations. The seasonal component in time series refers to patterns that are repeated over a period and that average out in the long run. The patterns that do not average out are included in the constant and the trend components of the model; whereas the trend is of importance in the long term forecasting, the seasonal component is very important in short term forecasting as it is the main source of short run fluctuations.. In this study, all model variables are seasonally adjusted before estimation in VAR was made. Unit Root Test Spurious regression problem is common in time series regressions. Hence, setting the right order of integration of each time series data has to be made before VAR regression. The unit root test 10 | P a g e
helps to set the order of selection, hence to detect and avoid spurious regression problem. To that
end, the order of integration of each time series variable was made.

There are different Unit Root Test criteria. The most widely used selection criteria is Augmented
Dickey-Fuller (ADF) test. Summary of Unit Root Test for model variables is depicted under
table below

                                 Table 2: Summary of Unit Root Test for Model Variables

S/No     Variable                      Variable (Seasonally               ADF, I(1)             1%                5%              10%
                                       Adjusted and Log                                  (Critical Values) (Critical Values)    (Critical
                                       Transformed)                                                                              Values)

1        Import                        LNIMPORT*                          -7.973821          -3.5889          -2.9303          -2.6030

2        Export                        LNEXPORT**                         -7.530118          -3.5930          -2.9320          -2.6039

3        Food Price Index              LNCPIF*                            -3.634257          -3.5889          -2.9303          -2.6030

4        Communication Price Index     LNCOMMUNICATION*                  --6.224109          -3.5889          -2.9303          -2.6030

5        Education Price Index         LNEDUCATION*                       -3.617568          -3.5889          -2.9303          -2.6030

6        Employment                    LNEMPLOYG*                         -6.375550          -3.5889          -2.9303          -2.6030

7        Government Expenditure        LNGOVTEXPEND*                      -4.967246          -3.5889          -2.9303          -2.6030

8        Health Price Index            LNHEALTH*                          -5.328321          -3.5889          -2.9303          -2.6030

9        Transport Price Index         LNTRANSPORT*                       -4.741770          -3.5889          -2.9303          -2.6030

10       Hotel & Restaurant Price LNHOTELREST**                           -5.839783          -3.5930          -2.9320          -2.6039
         Index

11       Investment                    LNINVST*                           -5.396353          -3.5889          -2.9303          -2.6030

12       World Pandemic Uncertainty WPUI***                               -2.701929          -3.5850          -2.9286          -2.6021
         Index

         *Variable Qualify for Regression with first Order of Integration, I(1) with 1% level of significance
         **Variable Qualify for Regression with second Order of Integration, I(1) with 1% level of significance
         ***Variable Qualify for Regression at level Order, I(0) with 10% level of significance

The ADF test shows that the order of integration for all model variables except World Pandemic
Uncertainty Index (WPUI) is one i.e. I (1). The result on ADF Test shows that all variables
qualifies for regression at order one I(1); and the WPUI qualifies at level i.e. I (0).

Ordering of Model Variables

11 | P a g e
A Cholesky decomposition requires the variables to be ordered in a particular fashion, where variables placed higher in the ordering have contemporaneous impact on the variables which are lower in the ordering, but the variables lower in the ordering do not have contemporaneous impact on the variables those are higher in the ordering. In essence, ordering of variables in VAR model estimation dictated by theoretical and/or empirical evidences on the subject of analysis. Contextual factors are also key aspect of ordering of model variables. In this study, both theoretical/empirical and contextual factors pertaining the COVID-19 shock and particular feature of Ethiopian economy were integrated to conceptualize the ordering of model variables. As a matter of fact, COVID-19 uncertainty shook is an exogenous variable, and its effect on the economy, at least in the short run, is interpreted in its effect on macroeconomic stability. In essence, COVID-19 shock direct and immediate effect on the economy is via distorting the supply chain. Supply chain distortion effect in return spills over in to the domestic economy by distorting import sector. Distortions in import quickly transmitted into the economy by affecting transport/logistics sectors. As Ethiopian domestic supply chain is largely dependent on importable for consumption and investment goods, COVID-19 impact on macroeconomic stability of Ethiopia is felt at the earliest via import and transport/logistics shocks. The effect of the pandemic via supply chain shocks is quickly transmitted into disturbing the aggregate demand. As such, both aspects of aggregate demand i.e. consumption and investment demands (expenditures) affected by supply chain distortions. In this regard, while prices on basic consumption items (like food and medical/pharmaceuticals) are expected to sky rocketed as people rush to hold for uncertain future. On the other hand, demand for investment goods is expected to decline, whose effect would be in dwindling down prices on investment goods. Supply chain distortions also have upward pressures on the cost of doing businesses by soaring key inputs (soft and hard inputs) in investment undertakings. While supply chain shock effect is translated into demand side shocks via consumption & investment expenditures price volatilities is expected in the process. As Ethiopian investment sector is growing to be export oriented, the effect of the pandemic on investment is quickly translated into affecting export earnings (performance of export sector). The combined effects of supply chain and demand distortions takes its toll into the economy by affecting real variables mainly the employment creation capacity of the economy. To mitigate the COVID-19 pandemic shock effect on the pillars of the economy, government interventions in the economy is expected to grow. Indeed, one of the legacies of COVID-19, as depicted in many studies so far, is reminding for the crucial role of government sector. In 12 | P a g e
Ethiopian context too, as depicted in COVID-19 recovery package, the government is set to
intervene to mitigate the effect of virus by indulging in massive fiscal stimulus plan.

In lieu of the illustrations made in the previous paragraphs, the order of variables in the VAR
estimation in this study assumes the following:

WPUI   IMPORT  TRANSPORT    FOOD & NON-FOOD PRICES                           INVESTMENT         EXPORT
EMPLOYMENT  GOVERNMENT EXPENDITURE (FISCAL POLICY)

Predicting COVID-19 Shock Impact Using BVAR Model: Impulse Response Function (IRF)
Impulse response functions can be used to produce the time path of the dependent variables in
the VAR, to shocks from all the explanatory variables. If the system of equations is stable any
shock should decline to zero, an unstable system would produce an explosive time path.

In this study, COVID-19 uncertainty shock impact is estimated instrumenting World Pandemic
Uncertainty Index on Ethiopia (WPUI) over macroeconomic indicators integrated in BVAR
model. Hence, the Impulse Response Function (IRF) is generated from BVAR estimation. The
result on Impulse Response Function (IRF) of each endogenous variables of the model in
response to one standard deviations of WPUI is presented in graphs.

The span of prediction period is set to be 14 quarters or Three years and two months since
January 2020 (or MEGABIT, 2012 E.C)

The COVID-19 Shock Transmission Mechanism into the Economy Using BVAR

To depict on the transmission mechanism of the pandemic uncertainty shock, the BVAR
Variance Decomposition was estimated. Variance Decomposition is an alternative method to the
impulse response functions for examining the effects of shocks to the dependent variables. This technique
determines how much of the forecast error variance for any variable in a system, is explained by
innovations to each explanatory variable, over a series of time horizons. Usually own series shocks
explain most of the error variance, although the shock will also affect other variables in the system.

In this study, the result of Variance Decomposition on each endogenous variables of the model in
response to one standard deviations of WPUI is made is presented in tables.

Investigating the Role of Fiscal Policy for Macroeconomic Stability
In this study, the role of fiscal policy to mitigate COVID-19 driven macroeconomic instability on
Ethiopian economy is examined by instrumenting fiscal policy shocks against key
macroeconomic variables integrated in VAR model used. Expansionary fiscal policy instruments
examined in this study are increasing government expenditure and reducing import tariffs. By
way of illustration, impulse response of key macroeconomic stability indicators to COVID-19
shock (the disturbance factor) and the expansionary fiscal policy shocks (counter disturbance
factors) is presented

13 | P a g e
3. Ethiopia`s Preparedness to withstand COVID-19 Shock

This next sub-topic tries to shade light to readers on the overall picture of Ethiopia, with an aim
to emphasize on state of nature of the economic, demographic and socioeconomic contexts of the
country. The intent is to evoke readers imagine the breadth and depth of COVID-19 impacts on
Ethiopians across the board, from the life of an average citizen to private businesses to the
government sector in general.
   i. Political Context

For the past more than 15 years, Ethiopia has been on growth trajectory, where the annual
economic growth rate averaged at 10%. This fast economic growth enabled a reduction in
poverty level from 305 in 2010/11 to 24% in the year 2015/16. Pertaining to its achievements in
those regards, the country has been praised a growth model in the realm of developing world.

Despite the step forward in the economic arena, the case in the political development has been
otherwise. The government of Ethiopia has been widely condemned for its suppressions of
opposition voices, the media and civil society groups.

A dominant feature of Ethiopian political system is polarized interests on the stream, giving
political shocks key variables determining the performance of the economy. In the decade
preceding the outbreak of COVID-19, the EPRDF led government has been trying to contain
those political shocks not to ‗disrupt‘ the economic progress. The containment, however, faded
away starting the year 2015, when political unrest began raging Ethiopia. Consequent public
rallies gave EPRDF led government undertake massive political reforms, where Abiy Ahmed
(PhD came to the apex of state leadership. As package of reforms was widening the political
space.

Given polarized interests featuring the political spectrum of the country, the newer development
has given political shocks to reappear again to twist and turn the whole fabrics of Ethiopian
society, including the economy.

The economic outlook in the pre-COVID-19 years is a showcase how political shocks
downplayed the economic performance of the country. Since the political upheaval began in
2015, investment massively affected; youth unemployment in its spike;‘ foreign debt made the
economy a headache; staggering decline of remittance flows; decline in export.

According to International Monetary Fund (IMF) report in 2018, political factors coupled with
external shocks6 explains the slowdown of the economy from the normal trend of double digit
growth for years to slow down to 7.7 percent in 2017/18 due to political headwinds and external
shocks (IMF, 2018)

6
 Decline in commodity prices in international markets for which Ethiopian economy is highly dependent in export
earnings

14 | P a g e
It is amidst those political contexts and consequent shocks posing economic uncertainty that
COVID-19 shock appeared to affect the economy in the years ahead.

 ii. Macroeconomic Context

Though the past decade featured by a fast ride in the economic growth in Ethiopia, the economy
has been poorly managed. Consequently, the country remained in difficulties to interpreting the
its fast growing economy a blessing to majority of its people. The showcases in this regard
involves the followings: rising national debt; mounting current account deficit; poor performance
of export sector; rising prices, youth unemployment; unfair income distribution; geographic
imbalances in terms of distribution of economic infrastructures/investments, among others.

Structural Problem: The Ethiopian economy is often dubbed a subsistence economy, for it is
highly dependent on agriculture which depends on vagaries of nature. Agriculture accounts an
average of 35% of the share of the country`s GDP in the years from 2015/16 to 2018/19. The
sector is a mainstay for about 85% of Ethiopians. A bulk of foreign exchange Ethiopia earns
from international trade comes from agriculture. For instance, the top five foreign exchange
earnings of the country are from agriculture.

Though the share of agriculture is declining steadily in the past decade, since the last four years
onwards, its place is grabbed by the incompetent & inefficient service sector. That even added to
the structural problem the economy has been suffering from as the service sector is weakly
interlinked with the industry and the agriculture sectors. The value addition of service sector to
Ethiopian economy in terms of employment, foreign exchange earnings and technology transfer
is subjected to quests by many economic analysts. As a matter of fact, the service sector rather
has a huge connection with the foreign sector, dominated by importable merchandise trade,
having negative impact on the current account balance of Ethiopia.

The industry sector on the other hand, though its share is rising, is still bottlenecked with a lot of
hurdles. Frequent Power outages, limiting industrial & trade policy of Ethiopia coupled with lack
of trained & disciplined labor forces is often raised as the limitations of the industrial sector.

15 | P a g e
Sectorial Share (as %
                                                                  of GDP) between
                                                                  2015/16-2018/19
                                                                  Agriculture

                                                                  Industry

                                                                  Service

                           Figure 2: Sectorial Share of GDP (2015/16-2018/19)

As of recent years in particular, the Ethiopia economy experienced volatilities. That was
pertaining to a number of shocks, which can be categorized as natural and human made. Natural
shocks, which appeals to the agriculture sector, were drought in past three years in the country
affecting agriculture yields.

As agriculture in Ethiopia is highly a rain fed, the sector is already exposed to natural shocks,
where seasons of droughts almost comes and go roughly every five years. Those challenges were
added up by a locust swarm affecting large tract of cultivations on the field as of last years and
continuing this year too.

Recent Developments in Macroeconomic Management: Home Grown Economic Reform Plan.

The growth episode of Ethiopia is largely explained by massive public investment in
infrastructural development. The state-led development model of the country though cannot be
totally discredited, had a number of flaws. For one, servicing public investments was entirely on
foreign debt. While the stock of the external debt growing fast, poor project execution along with
disappointing export performance prompted the IMF and World Bank to rate Ethiopia‘s external
debt burden as a high risk of distress. That greatly undermined the country‘s credit standing and
borrowing ability.

Though the economy has been on a rise in the last decade, it was far less inclusive in a sense that
the role of domestic private sector where crowd-out effect of public investment on the scene.
The public sector failure is characterized by growing caps on the scope of economic growth
where the public sector, the major driver of the economy, faced up with required financial and
institutional/bureaucratic fallouts.

16 | P a g e
As a reflection of the aforementioned macroeconomic distortions, sovereign debt rose to an estimated 58% of GDP; government budget deficit of 3.7% of GDP; trade deficit of 12.4% of GDP and a current account deficit of 4.5% of GDP in 2018. In light of addressing those macroeconomic problems, a new leadership installed in 2018, which is led by Abiy Ahmed Ali (PhD) enacted stringent fiscal and/or financial measures, where the monetary policy tightened and public sector credit policies were introduced. According to IMF (2018), those tight macroeconomic policy directions and reforms being made to open up the economy by Ethiopian government may have slowing down effect on the growth of the economy, but enables to control inflation, enhance the optimal usage of foreign currency. Those policy reforms of the newer government in Ethiopia were complemented by a recently introduced Home Grown Economic Reform Plan. The home grown economic reform plan is set to tackle the cumulated problems of Ethiopian economy in the past plus decade years. A three years plan commencing 2019, this reform plan costs the country 10 billion USD. According to IMF (2018), those recent policy developments in Ethiopian economy sustains the economy by helping fix key structural bottlenecks that hamper the economic growth in the medium to long term period.by spurring private investment and productivity gains and reduce external and domestic vulnerabilities. In addition, the proposed policies would substantially reduce the risk of sudden financial and real economic disruptions— hence fostering domestic private sector development and FDI (IMF, 2018) However, the COVID-19 appeared at this critical time where Ethiopia has started implementing those hosts of policy reforms aimed at healing the cumulated fractures of the economy in the past decade or so. Indeed, the COVID-19 pandemic inevitably poses bleak future, even adding to the woes of Ethiopian economy, let alone realizing the reform plan iii. Socio-economic Context The immediate requirements to endure in times of COVID-19 are worryingly low in Ethiopia. The larger segment of the population lives on a daily starving income level. A sizable portion of the population struggles with limited access to food, water and housing provisions. 58% of the population lack access to clean water, 89% live without safe toilets, and 55.7% survive without electricity and 48 million people live further than 2Km from all-weather road. Moreover, the country`s health care system is too primitive and fragile to cope up the preventive methods prescribed by the World Health Organization (WHO). The per capita hospital bed is 3150. The nurse to population ratio is 1 to 1624. 17 | P a g e
Worse of all, the major segment of the population to the pandemic, the urbanites, are very ill
prepared to fight the virus. In urban areas, provisions on basic amenities to prevent the disease
like water is even below the national average.

With the existing poor socio-economic status of the people, it would be far-fetched for Ethiopia
to withstand tremendous shocks posed by COVID-19. .

                            Table 3: Major Indicators on Socio-economic Status of Ethiopians
                  Socio-economic Indicator                                                  2011 E.C
                  Health Indicators
                  People : Hospital Beds                                                   3150:1
                  People : Nurse 1                                                         1624:1
                  Access to Safe Drinking Water
                  Country level (in %)                                                     76
                  Urban population                                                           66
                  Rural Population                                                           79
                  Access to Housing
                  Number of Rooms Per National Average Households size 7                        0.88
                                  Based on NBE (2019) and CSA (2016)

    iv. Demographic Context

Ethiopia is the second largest country in Africa, with population size estimated 120 million in the
year 2020. Ethiopia can be regarded as a country of youths. The fertility rate in the country is
about 3.45 children per woman (mother). And the natural rate of population increase8 in 2018/19
was 2.07 per cent. The age structure shows that nearly 60% of Ethiopians are within the working
age bracket, necessitating the country to look for absorbing this large section of society into
productive means like provision of access to education and/or provide job.

Though Ethiopian society is much rural (with percentage of rural population to urban population
is 79: 21), the urban population is fast growing pertaining to pushing and pulling factors which
speed up the rural-urban migration. The influx of people into the urban centers is largely driven
by pushing factors in the rural areas

In this regard, the major pushing factor is limited scope of rural economies to diversified
livelihoods beyond farming/animal husbandry, leaving the ever rising youth without farm land.
As a result, the rural youth is forced to destine to towns and cities in search of employment
opportunities. Worse for rural migrants in cities is a dire working conditions is not just far below
their expectations but also below the standards. Industrial employments are with a starving wage,
and the working condition is too unsafe and undignified. That in turn pushes the rural-urban

7
    Average National Household Size in Ethiopia
8
    Natural Rate of Population Increase is computed as crude death rate less crude birth rate

18 | P a g e
migrants to look for crossing borders of Ethiopia, often eying their destinations to be Arab states
in the Gulf and the European countries.
The pain and stress of Ethiopian migrants to Arab countries has been reported by international
and local agencies. Many youth remained sunken in seas and oceans. For those who crossed
dangerous sea/ desert voyages and reached the host countries, life is far below their expectations.
The tragic reality is that the working condition and payments for those crossed borders is next to
slavery. This particularly appeals to Ethiopian economic migrants destined to Middle Eastern
Arab countries.
A recent showcase on that is the grief of Ethiopians in Yemen, Saudi Arabia, Qatar, United Arab
Emirates (UAE) and Lebanon. In connection to COVID-19 pandemic, Ethiopian migrants in
those countries, many of them dubbed ‗illegal, have been left helpless on streets in bad days,
while they have been exploited in good days (pre-corona days). Too many of them were set to
live and get deported in this pandemic days, where too many of them were forced to survive in
dangerous conditions that would exposed to COVID-19. This is a recent memory grabbing the
international media to the disgrace of the country, Ethiopia.
Those tragic showcases of massive unemployment and youth migration are the tragedy of
mismanaged socio-economic and political governance in Ethiopia in the past decades or so.
Circumstantial evidences from the profile of the country in the past five years are boldly telling
the price of those mismanagements. The youth movement that forced the incumbent EPRDF to
undertake reforms, but it seems too little too late.
At this juncture at least, unresolved youth quests cannot be underestimated as socio-economic or
political problems, but goes beyond risking the national security of the Ethiopia. For a country
which is already trapped in economic and political woes, COVID-19 pandemic is only added on
those complexities.
Table 4: Major Demographic Indicators on Ethiopia
Demographic Indicator 2011 E.C
Population (In Millions) 97.6
Working age Population
Urban 10.1
Rural 49.8
Total 59.9
Age Dependency Ratio 69
Natural Rate of Population Increase (in %) 2.07
Total Fertility Rate 3.45 Chil:W
Average Household Size 6.07
Based on NBE (2019) Chil: W refers an average children a mother gives
birth
19 | P a g eThe intent of such analysis is not motivated by a blind judgment or pessimistic mindset of the author, but triggered by a pragmatic concern to investigate the breadth and width of the problem sparked by COVID-19 pandemic in Ethiopia. 20 | P a g e
4. Findings and Discussion
4.1.COVID-19 Uncertainty Shock Effect on Import Demand in Ethiopia (2013-2015 E.C)

The VAR estimate indicates that COVID-19 uncertainty shock results a massive rise in import in
the second half of 2019/20 Ethiopian Fiscal Year (E.F.Y) or (2019/20 Q3 and Q4). In the period
between months of January-June 2020 (TIR-SENE 2012 E.C), import demand is expected to
grow by 4.17 billion birr. The finding in this regard is expected, as the pandemic triggers
massive demand in food and pharmaceuticals, for which Ethiopia is import dependent on both
items.

The magnitude & direction of COVID-19 shock effect on import demand in the last two quarters
of 2019/20 E.F.Y is not the same. In the months from TIR-MEGABIT 2012 E.C. (i.e. the third
quarter of 2019/20 E.F.Y) import demand will decline by 1.71 billion birr. This reduction is
expectedly due to immediate restrictive measures taken by countries worldwide (including
countries where Ethiopia depends for its imports) after World Health Organization declared
COVID-19 outbreak a Public Health Emergency of International Concern on 30 January 2020.

However, the decline in import in the period TIR-MEGABIT 2012 E.C is expected to be off-
settled by a massive increase in the next quarter i.e. MIAZIA-SENE 2020 E.C), where forecast
estimate puts an increase of import demand by 5.89 billion birr in this period.

This overwhelming in import demand between the months of MIAZIA- SENE/ 2012 E.C may be
attributed to two interrelated factors: the momentum effect and the inelasticity nature of
Ethiopian import items.

                                             Res pons e of Import
                                        to One S .D. W P UI Innovation
                          0.3

                          0.2

                          0.1

                          0.0

                         -0.1

                         -0.2

                         -0.3
                                1   2   3   4   5   6   7   8   9   10 11 12 13 14

                   Figure 3: Dynamic Response of Import to COVID-Uncertainty Shock

The momentum effect captures the pressure of a reduction of import in the first quarter puts on
import in the second quarter. COVID-19 triggered major import partner countries of Ethiopia to
remain in shut down for over three months so. And a halt in import in the first quarter is
expected to have momentum effect on the second quarter. On top of that, Ethiopia is net
importer on two basic commodities required to deal with coronavirus pandemic days:

21 | P a g e
pharmaceuticals and food items. That explains why import shows a rise in the second quarter of
forecast period.
6000
4000
2000 Estimated Effect
of COVID-19
0 Unceretainty
Shock on Import
-2000
(Millions of Birr)
-4000
-6000
Figure 4: Estimated Effect of COVID-19 Uncertainty Shock on Import (Millions of Birr)
(Author`s Computation based on VAR Forecast via Impulse Response Function)
In the year 2013 E.C, as a result of COVID-19 uncertainty effect, import declines by 2.68 billion
birr. Decline in import continues in 2014 E.C too, with an estimated decline in import values by
2.06 billion birr. A decline in imports in the successive years (2013-2014 E.C) is explained by
expected decline in consumption & investment expenditures, which are highly import dependent
in the Ethiopian context, as result of the virus effect.
However, the decline in import ceases in 2015, where the pandemic uncertainty effect results an
increase in import by 133 million. This marks s recovery of the economic recovery from
COVID-19 tolls.
However, the decline in import ceases in 2015, where the pandemic uncertainty effect results an
increase in import by 133 million. That perhaps signals recovery of Ethiopian economy from
COVID-19 tolls.
COVID-19 Uncertainty Shock Transmission Mechanism on Import Volatility (2013-2015 E.C)
In the first four quarters ahead, the impact of COVID-19 uncertainty shock on import is
transmitted to the economy via food prices. A rise in food prices in the immediate aftermaths of
the pandemic is expected as Ethiopia is net importer of food and food supplements.
Since the fifth quarter of forecast period, COVID-19 triggered import volatility is much
explained by volatilities in non-food prices. In this regard, education, hotel & restaurant and
transport sectors would be the major channels through which the uncertainty shock transmitted
into the economy.
22 | P a g e3.1.Forecasting COVID-19 Uncertainty Shock Effect on Export Earnings (2013-2015)
The uncertainty impact of COVID-19 on export is another focus of inquiry of this study. The
dynamic time path of forecast effect of COVID-19 on export earnings of Ethiopia is depicted in
Impulse Response Graph below.
Res pons e of Export
to One S .D. W PUI Innovati on
5
0
-5
-10
-15
-20
-25
-30
1 2 3 4 5 6 7 8 9 10 11 12 13 14
Figure 5: Dynamic Response of Export Earnings to COVID-Uncertainty Shock
As we learn from IRF graph, export thoroughly declines in all forecast periods. The loss in
export earning is massive three months starting TIR- MEGABIT 2012 E.C, where export
earnings declines by 5.85 Billion birr.
2022/23 Q4
2022/23 Q2
Forecast
2021/22 Q4 Effect of
2021/22 Q2 COVID-19
on Export
2020/21 Q4 Earning
2020/21 Q2 (Millions of
Birr)
2019/20 Q4
-8000 -6000 -4000 -2000 0 2000
Figure 6: Forecast Effect of COVID-19 on Export Earning (Millions of Birr)
(Author`s Computation based on VAR Forecast via Impulse Response Function)
In the first six months since January 2020 (TIR/2012), an estimated 6.5 billion birr will be lost as
a result of COVID-19 uncertainty shock effect. The study forecasts export to decline by 597.7
million birr April-June 2020 (MIAZIA-SENE 2012 E.C). This finding fits (only with forecast
error of 3.5%) the forecast estimate made by Ministry of Finance of Ethiopia in April 2020,.
According to Ministry of Finance of Ethiopia, export earnings are expected to fall by 30% (576
23 | P a g emillion birr) between March and June 2020 compared to earnings from exports in the same
period in 2019 (which was 19.2 billion birr) (FDRE Ministry of Finance, 2020)
The decline in export keeps between July and September 2020 (HAMLE 2012-MESKEREM
2013 E.C).
In the year 2013, export loss due to COVID-19 shock is estimated to reach 4.8 billion birrs. The
total loss in export in the first six months of 2013 E.C will be 3.5 billion birr. In next half year
following, the predicted loss in export earnings in estimated at 1.34 billion birr. The impact of
the pandemic on export earnings of Ethiopia shows a progressive decline in 2014 E.C. The total
loss as a result of pandemic shock effect in 2014 E.C. is forecasted to reach 709.71 million birr.
In the year 2015, the damage cost of COVID-19 on export earnings of Ethiopia is estimated at
557 million birr.
The pandemic uncertainty effect on export, though shows a steep decline, remains to be felt up
until 2017 E.C.
3.1.1. COVID-19 Uncertainty Shock Transmission Mechanism on Export Expenditure
Volatility (2013-2015 E.C)
The pandemic effect on export earnings of Ethiopia, at least in the coming three years, is largely
explained by the duration of the pandemic period itself. As such, pandemic shock explains an
average of 65.66% of variation (decline) in export earnings. A result from variance
decomposition result also reveals that transport and investment shocks another mechanisms
COVID-19 uncertainty effect transmitted into the export sector between the years 2012-2015
E.C.
24 | P a g e4.2.Forecasting COVID-19 Uncertainty Shock Effect on Investment Expenditure
One of the impacts of COVID-19 is its toll in downsizing key components of aggregate demand,
consumption and investment expenditures. In uncertain times like our days, both households and
firms prefer to withhold their cash. Households would set aside cash in their hands for food and
basic amenities. Firms too, refrain from spending to build-up their capital stock. Overall, both
consumption and investment demands are expected to slump in the pandemic period.
In this study, the impacts of COVID-19 on the aggregate demand in Ethiopian economy is
investigated through the pandemic`s effect on investment expenditure, one component of The
study found out that COVID-19 driven investment volatility lasts three years. To examine on
investment expenditure dynamics between TIR/2012 and SENE 2015, changes to Investment
expenditure to one standard deviation of World Pandemic Uncertainty Index is generated using
VAR Impulse Response Function (IRF).
Res pons e of Inves tment
to One S.D. W PUI Innovation
1
0
-1
-2
-3
-4
-5
1 2 3 4 5 6 7 8 9 10 11 12 13 14
Figure 8: Dynamic Response of Employment to COVID-Uncertainty Shock
According to forecast estimate made, the total damage on investment expenditures from TIR
2012- SENE 2015 will be 1.9 billion birr (63.95 Million USD). The finding further reveals that,
in the coming three years at least, investment performance is largely determined by the length of
the pandemic period (pandemic uncertainty effect), explaining on average 56% of loss in
investment expenditure. The result is in compatible with investment theories and empirics, where
uncertainty what so ever is the major shock variable affecting investment. Next to pandemic
uncertainty factor, transport and export sectors are also the major shock variables in 2012-2014
E.C. In 2015, investment is largely affected by hotel & restaurant prices and government
expenditure shocks.
The size of investment expenditure losses and the dynamic impacts of major determinants of
investment performances vary across different quarters/years in the prediction period (in the next
three years). Investment expenditure steeply declines in the upcoming two years since TIR 2013.
The biggest loss forecasted to hold between months of January (TIR) and (MEGABIT) 2012
25 | P a g eE.C., where an estimated 443.82 million birr worth of investment expenditure decline is
expected.
Overall, in the six months of 2012 E.C, COIVID-19 pandemic uncertainty shock results half a
billion birr (512 Million birr). In this period, investment decline is largely attributed to Pandemic
uncertainty shock (82.83%). Other than pandemic uncertainty, transport and export shocks takes
a respective shares of 9.9% and 6.49% for a decline in investment in the period between TIR and
NEHASE 2012.
0
2019/20 Q3
2019/20 Q4
2020/21 Q1
2020/21 Q2
2020/21 Q3
2020/21 Q4
2021/22 Q1
2021/22 Q2
2021/22 Q3
2021/22 Q4
2022/23 Q1
2022/23 Q2
2022/23 Q3
2022/23 Q4
-100
-200
-300
Estimated Forecast
-400 Effect of COVID-19
on Investment
-500 Expenditure (Million
Birr)
-600
-700
-800
`
Figure 8: Forecast Estimate of Effect of COVID-19 Pandemic Uncertainty on Investment Expenditure in the Three
years
(Author`s Computation based on VAR Forecast via Impulse Response Function)
In 2013 E.C too, the effect of the virus keeps on its damage on investment climate in Ethiopia. In
this regard, the total cost of pandemic uncertainty is estimated to be 391.77 million birr. Though
the pandemic uncertainty shock effect shows a progressive decline, it still remains the major
factor determining the performance of investment sector in 2013, contributing on average for
62.32% of investment volatility. In the mentioned period, transport and export shocks remain on
top spot of affecting investment performance, with respective the average shares in explaining
investment expenditure is predicted to be 8.39% and 4.87%.
The effect of the pandemic on investment shows a relative decline in 2014 E.C, whose estimated
effect on loss in the investment expenditure predicted at 68.7 Million birr. This is largely
attributed to a decline in pandemic uncertainty shock, whose effect declines to 49.12%.
Transport prices and export shocks remain major variables in 2014 where COVID-19 uncertainty
shock effect takes its toll on investment performance in Ethiopia. The finding from VAR
estimation shows transport price shocks are forecasted to explain 8.63% of volatilities in
26 | P a g einvestment expenditure. In 2013 E.C the role of export performance in explaining investment volatilities is averaged at 4.12%. In the year 2015 E.C, the damage of the pandemic on investment expenditure will be and 84.2 Million birr respectively. In this period, the relative importance of pandemic uncertainty, transport and export shocks progressively declines in affecting investment expenditures. In this regard, the share of each shock in affecting investment stability is predicted to be 43.1%, 7.96% and 3.79% respectively. On the other hand, the importance of hotel & restaurant and government expenditure shocks appeared on the scene to shake investment sector. The Impulse Response results from VAR estimation predicts that hotel & restaurant prices & government spending explain on average 7.14% and 6.01% of changes in investment expenditures respectively. 4.3. Forecasting COVID-19 Uncertainty Shock Effect on Price Stability (2013-2015 E.C) The impact of COVID-19 on macroeconomic stability can be gauged by its effect on price volatility. Theoretical and empirical evidences tell price stability a signal about the health of the economy. For one, it can be rough gauge on the gap between the aggregate demand and supply. Moreover, price volatilities also implicate the shock level in the economy. The importance of looking the impact of COVID-19 is key from the two broader aspects of linkages between macroeconomic stability and price volatility. 4.3.1. Forecasting the Effect of COVID-9 on Food Prices The VAR model result predicts that COVID-19 pandemic shock to have an upward pressure on food price index9. As shown from IRF graph below, food prices are predicted to show a rise in most of the forecast Two explanation can be given why food prices surge in the pandemic period. One, health preventive measures would give food market disruptions mainly creating transport & logistics service barriers, among other factors. Two, the pandemic uncertainty effect would raise households` precautionary demand for food, whose effects interpreted in pushing food prices up.. 9 The basket of goods/services in the estimation on food price index in Ethiopia involves the following items: bread and Cereals; Meat; Fish & Sea Food; Milk, Cheese & Egg; Oils & Fats; Fruits; Vegetables; Sugar, Jam, Honey, Chocolate & Confectionery; Food Products; Non-Alcoholic Beverages. 27 | P a g e
Response of Food Prices
                                               to One S.D. WPUI Innovation
                          0. 006

                          0. 004

                          0. 002

                          0. 000

                         -0. 002

                         -0. 004
                                   1   2   3   4   5   6   7   8   9   10   11   12   13   14

                    Figure 9: Dynamic Response of Food Prices to COVID-Uncertainty Shock

To infer on the channels through which food price volatility to be transmitted into the economy,
variance decomposition of food prices shock was made. Accordingly, transport shock is
forecasted to be the main channel through which COVID-19 uncertainty effect is impact is
transmitted into food prices. On average 16.3 % of variances in price of food-price is explained
by transport prices in the whole periods of forecast. As food inputs are highly reliant on transport
& logistics services, it is natural that food prices to vary with transport prices.

Education price is another channel where COVID-19 uncertainty shock impact is transmitted to
food price volatility in Ethiopia in the upcoming three years, whose shock effect on food price
volatility is averaged at 14.9% in the prediction period. In a country like Ethiopia, where there
are 26 million students attending classes as of 2020 or 2012 E.C10, it is highly likely that
education sector to affect food prices via effects on hotel & restaurant businesses. Indeed, a stay
at home health measures affect hotels and restaurants drawing substantial customer base from
getting services. That inevitably put downward pressure on food prices through the line of
demand shortfalls. That may explain why the impact of education prices is expected to spill over
into food prices.

Apart from education, the impact of COVID-19 on food prices are expected to pass through
communication prices, particularly since the first four quarters of prediction period.

4.3.2. Forecasting the Effect of COVID-19 on Non-Food Prices11

To see the dynamic response of non-food prices to COVID-19 uncertainty shock, the study
consider major items in non-food price indexing in Ethiopia. Hence, the dynamic response of
10
  Report by Planning Commission of Ethiopia, July 2020
11
  In Ethiopian context, non-food price index is computed on average price index for the following list of products:
Transport, Communication, Education, Health, Hotel & Restaurant, recreation & culture; Alcoholic Beverages and
Tobacco; Clothing & Foot-wear; Housing, Water, Electricity/Gas and Other Fuels; Furnishings, Household
Equipment and Routine Maintenance of the House; Miscellaneous Goods

28 | P a g e
You can also read