Characterization, Communication, and Management of Uncertainty in Tuna Fisheries - MDPI
←
→
Page content transcription
If your browser does not render page correctly, please read the page content below
sustainability

Review
Characterization, Communication, and Management
of Uncertainty in Tuna Fisheries
Gorka Merino 1, *, Hilario Murua 2 , Josu Santiago 1 , Haritz Arrizabalaga 1 and Victor Restrepo 2
 1    AZTI, Marine Research, Basque Research and Technology Alliance (BRTA), Herrera Kaia, Portualdea z/g,
      20110 Pasaia, Spain; jsantiago@azti.es (J.S.); harri@azti.es (H.A.)
 2    International Seafood Sustainability Foundation, Washington, DC 20005, USA;
      hmurua@iss-foundation.org (H.M.); vrestrepo@iss-foundation.org (V.R.)
 *    Correspondence: gmerino@azti.es; Tel.: +34-667-174-456

 Received: 31 August 2020; Accepted: 3 October 2020; Published: 7 October 2020

 Abstract: Tunas sustain important fisheries that face sustainability challenges worldwide,
 including the uncertainty inherent to natural systems. The Kobe process aims at harmonizing
 the scientific advice and management recommendations in tuna regional fisheries management
 organizations (RFMOs) toward supporting the sustainable exploitation of tunas globally. In this
 context, we review the similarities and differences among tuna RFMOs, focusing on stock assessment
 methodologies, use of information, characterization of uncertainty and communication of advice. Also,
 under the Kobe process, tuna RFMOs have committed to a path of adopting harvest strategies (HSs),
 also known as management procedures (MPs), which are the series of actions undertaken to monitor
 the stock, make management decisions, and implement the management measures. The adoption of
 HSs for tuna stocks is supported by Management Strategy Evaluation (MSE), which is considered the
 most appropriate way to assess the consequences of uncertainty for achieving fisheries management
 goals. Overall, notable progress has been made in achieving some of the Kobe objectives, but there
 are still some aspects that are inconsistent and need to be agreed upon, due to their management
 implications. First, not all RFMOs report on stock status based on maximum sustainable yield
 (MSY) as a reference. Instead, some use depletion level to represent the available fish biomass.
 Also, the definition of overexploited is not common in all oceans. Finally, very few stock assessments
 characterize all major sources of uncertainty inherent to fisheries. With regards to HSs, two different
 approaches are being followed: One is designed to adopt an automatic decision rule once the stock
 status and management quantities have been agreed upon (harvest control rules (HCRs), not strictly
 an HS) and the other aims at adopting all the components of HSs (data, use of information and
 decision rule).

 Keywords: fisheries management; uncertainty; management strategy evaluation; tunas; RFMO;
 scientific advice; stock assessment

1. Introduction
     Tunas sustain some the of world’s most valuable fisheries and dominate marine ecosystems
worldwide [1]. Tuna and tuna-like fish catch amounted 7.5 M tons in 2016 (9% of the global marine
fisheries production) [2], which are worth more than EUR 32.54 billion to the annual global economy [3].
The seven most important tuna commercial species (albacore, ALB-Thunnus alalunga; Atlantic bluefin,
BFT-Thunnus thynnus; Pacific bluefin, PBT-Thunnus orientalis; southern bluefin, SBT-Thunnus maccoyii;
bigeye, BET-Thunnus obesus; yellowfin, YFT-Thunnus albacares; and skipjack, SKJ-Katsuwonus pelamis)
account for 4.9 M tons and their 23 stocks sustain important industrial and artisanal fisheries [4].
Five regional fisheries management organizations (RFMOs) are responsible for the management of tuna

Sustainability 2020, 12, 8245; doi:10.3390/su12198245                      www.mdpi.com/journal/sustainability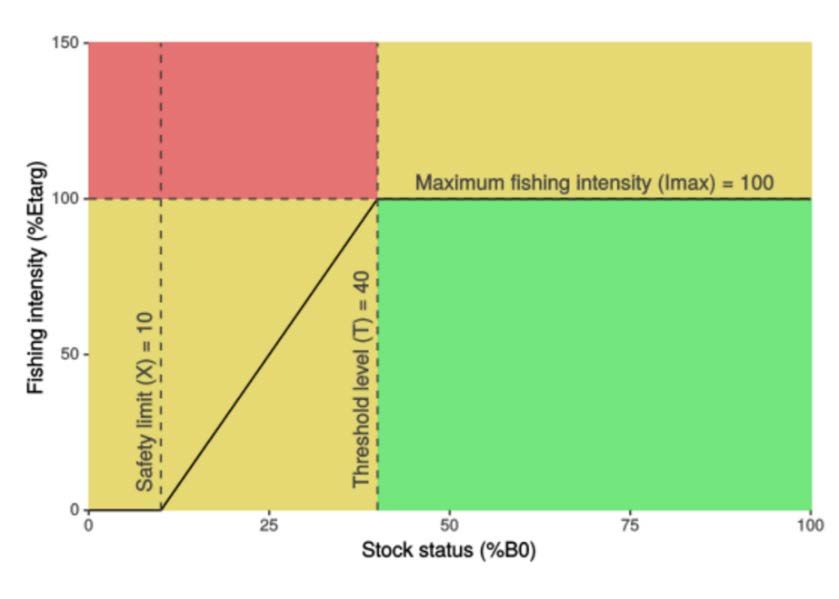
Sustainability 2020, 12, 8245                                                                         2 of 22

stocks: The Commission for the Conservation of Southern Bluefin Tuna (CCSBT), the Inter-American
Tropical Tuna Commission (IATTC), the International Commission for the Conservation of Atlantic
Tunas (ICCAT), the Indian Ocean Tuna Commission (IOTC), and the Western Central Pacific Fisheries
Commission (WCPFC). Guided by their own conventions and consistent with the principles of the
United Nations (UN) Fish Stocks Agreement [5] and the Food and Agriculture Organization (FAO)
Code of Conduct for Responsible Fisheries [6], all five RFMOs are responsible for maintaining tuna
stocks at sustainable levels. Over the last decades, tuna fisheries have intensified and expanded
worldwide and global catch has steadily grown [7], which has placed all tuna RFMOs facing similar
sustainability challenges [8].
      The sustainability of fisheries is determined by the balance between the amount of biomass
harvested and the resilience of fish stocks to harvesting. Tuna RFMOs generally aim at achieving the
maximum sustainable yield (MSY), an equilibrium point at which the capacity of fish stocks to replace
the removed biomass is maximized, and therefore, fisheries’ long-term average catch is maximized
too. The levels of catch and fishing mortality that can be sustained by fish stocks and their historical
exploitation levels are estimated through stock assessment. Stock assessment is the process of collecting
and analyzing stocks’ biological and statistical information from fisheries to determine the changes in
the abundance of fishery stocks in response to fishing, and, to the extent possible, to predict future
trends in stock abundance (FAO Glossary of Terms). Fisheries stock assessments consist of fitting the
available fishery and biological information into fish population dynamics equations using specifically
tailored models and computer software.
      A model can never describe a system with certainty [9], and thus, fish stock assessments are
subject to uncertainty. In general, uncertainty can be classified into (i) systemic or structural uncertainty
and (ii) aleatoric or statistical uncertainty [10]. Systemic or structural uncertainty is attributed to
things that could potentially be known but they are not known in practice. This may be because a
measurement is not accurate enough (observation error) or because models neglect certain effects
(model error). Statistical uncertainty is representative of unknowns that differ each time we run the
same experiment (process error), and it is acknowledged will not be possible to determine sufficiently
to eliminate deviations from predicted values. Uncertainty quantification and characterization tries to
determine how likely certain outcomes are if some aspects of the system are not exactly known [11,12].
Also, uncertainty quantification intends to work toward reducing the systemic uncertainties to
statistical uncertainties, which can be narrowed down with statistical methods and characterized
using probabilistic distributions [10,12,13]. In other words, uncertainty characterization aims to
reducing bias and produce outputs that normally (or log-normally) fluctuate around a central tendency.
Characterizing uncertainty in fisheries models is important because it helps provide a measure of the
precision of the system dynamics, which is linked to the risk of adopting alternative management
measures. In this sense, the higher uncertainty means a lower precision and a larger risk of not
achieving sustainability.
      A number of authors have categorized the errors that cause uncertainty and risk in fisheries [14–16].
In brief, three major sources of error are responsible for the uncertainty inherent to fisheries stock
assessments [16]: (i) observation errors, directly linked to the quality and quantity of data used;
(ii) model errors, due to the limited ability of models to reproduce population dynamic patterns;
and (iii) process errors, due to the lack of understanding of the biological processes underlying fish
stock dynamics. In this work, we review how each of the systemic and statistical uncertainties is
characterized and quantified in tuna stock assessments with emphasis on similarities and differences
across tuna RFMOs.
      Stock assessments, including the characterization of uncertainty, are the cornerstone of the advice
communicated by scientific committees at RFMOs. Initiatives like the Kobe framework [17] have aimed
at providing consistency of advice across tuna RFMOs. However, the way that these are communicated
to management bodies is still not homogenous. In this study, we review how the scientific advice is
provided in the five tuna RFMOs with a focus on how uncertainty is communicated and its implications
for management.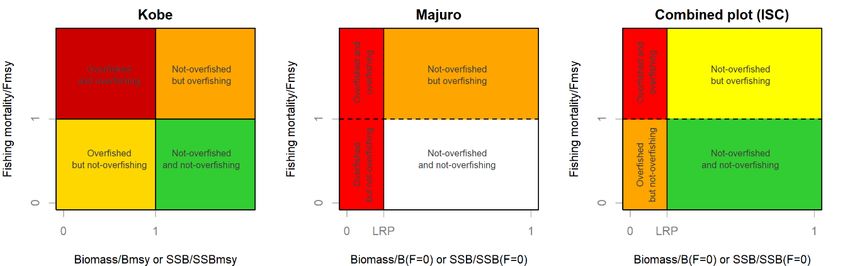
Sustainability 2020, 12, 8245                                                                      3 of 22

      The uncertainty in fisheries and scientific advice, together with two international agreements—the
UN Fish Stocks Agreement [5], and the FAO Code of Conduct for Responsible Fisheries [6]—provide
the foundations of the precautionary approach (PA) to fisheries management, which aims at improving
the management of fish resources by exercising prudent foresight to avoid unacceptable or undesirable
situations, taking into account that changes in fisheries systems are not well understood and are only
slowly reversible [18]. The PA seeks to protect fish stocks from fishing practices that may put their
long-term viability in jeopardy despite the many unknowns on stocks biology, response to fishing,
or exact state of exploitation [19]. Also, the PA requires that undesirable outcomes be anticipated and
measures taken to reduce the probability of them occurring [20].
      The PA calls fisheries management institutions to address uncertainty by determining the status
of fish stocks relative to target, threshold, and limit reference points (RPs), to predict the outcomes
of management alternatives for reaching the targets and avoiding the limits, and to characterize
the uncertainty in both cases. Limit reference points (LRPs) are benchmarks that should be avoided
with substantial probability, according to a given set of management objectives. They indicate the
limit beyond which the state of a fishery and/or a resource is not considered desirable, and remedial
management action is required to allow recovery. In contrast, a target reference point (TRP) is a
benchmark that should be achieved on average, according to a given set of management objectives.
It corresponds to a state of a fishery and/or resource that is considered desirable [21]. The PA also
recommends that LRPs and TRPs are used in combination with precautionary or threshold RPs to
determine what actions to be taken to avoid reaching the LRPs. A trigger or threshold is a level of
biomass or fishing mortality rate between the LRP and TRP that can serve as a “red flag” and may
trigger specific management actions designed to reduce fishing mortality.
      One way to address the uncertainty in fisheries is the adoption of harvest strategies (HSs), also
known as management procedures (MPs), that aim at both achieving a low probability of breaching
safe biological limits (LRPs) and providing high average long-term catch and fisheries performance [22].
HSs are the systematic series of agreed human actions undertaken to monitor the stock, assess its state,
make management decisions, and implement the management advice. A HS can be designed to specify
changes to the total allowable catch (TAC), or any other measure, based on updated monitoring data
and methods of analysis. Adopting an HS requires specifying the management objectives (probabilities,
time frames and risk), reference points (TRPs and LRPs), performance indicators to monitor how
effective the management measure is, the data and methods of analysis to determine the current state
of the resource, and a decision rule (or harvest control rule, HCR) based upon the estimated state of the
stock (including fishery indicators).
      Management strategy evaluation (MSE) is considered the most appropriate way to assess the
consequences of uncertainty for achieving fisheries management goals [23], and it is contributing to
the increased robustness of tuna assessment and to supporting the adoption of HSs across RFMOs.
MSE can be used to quantify the impacts of the uncertainty associated with current management
systems and to identify “realizable” performance, which can be achieved given the quality of the data
available and the types of uncertainties that are inherent to each fishery [23]. The five tuna RFMOs have
carried out some type of MSE work, including consultation on management objectives, characterization
of uncertainty of stocks’ dynamics and observation, and evaluation of HCR and HS [22]. In the last
section of this manuscript we review the state of play of the MSE process and the prospects for adopting
HSs and HCRs for the key tuna stocks.
      In summary, in this work we review the methods used in tuna stock assessments with emphasis
on how uncertainty is characterized and communicated to management bodies. We also discuss how
RFMOs are managing the uncertainty inherent to fisheries, with specific focus on the MSE processes
and the adoption and evaluation of HSs for the most important tuna stocks. We do this with the aim of
contributing to a harmonized global stock assessment and management framework for tuna stocks.
We note that this review includes stock assessments carried out until 31 August 2020.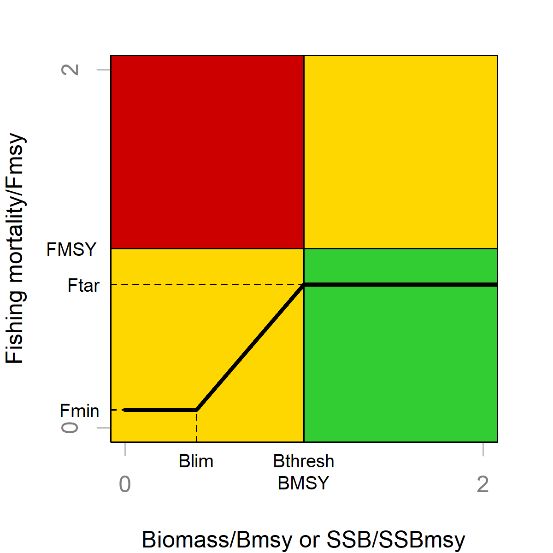
Sustainability 2020, 12, 8245                                                                                               4 of 22

2. Characterization of Uncertainty in Tuna Stock Assessments
     When making predictions with computer models as done in stock assessments, two types of
uncertainties are encountered: systemic or structural and aleatoric or statistical [10].
     1. Systemic or structural uncertainty is the result of model uncertainty and input uncertainty.
     Model uncertainty: A model is said to display uncertainty when we are uncertain about the
true relationship between inputs and outputs within a model [9]. One strategy to characterize this
uncertainty is to use alternative stock assessment methods to add contrast to model estimates. The stock
assessment models currently in use in tuna RFMOs range from the relatively simple catch-based
models to more sophisticated age-/size-structured and fully integrated and flexible model platforms
(Table 1, see Appendix A for a short description of models). However, it is only in ICCAT where the
results of structurally different models are combined to provide scientific advice. While in the IATTC,
CCSBT, WCPFC, and IOTC one fully integrated stock assessment model is used to provide scientific
advice (Stock Synthesis [24], Multifan-CL [25], or one ad hoc model for Southern bluefin); in ICCAT,
the results of fully integrated models are combined with simpler biomass production or age-structured
models. For example, the stock status for Atlantic yellowfin was estimated averaging the results of
three stock assessment models (Stock Synthesis, Just Another Bayesian Biomass Assessment (JABBA),
a Bayesian biomass dynamic model [26], and mpb, a biomass-based stock assessment model [27]).
In the case of west Atlantic bluefin, the results of a virtual population analysis (VPA/ADAPT [28]) and
stock synthesis were combined. To sum up, model uncertainty is only characterized in two Atlantic
stocks from the 23 most important tuna stocks.

      Table 1. Models used in the latest assessments of the 23 most commercially relevant tuna stocks classified
      in relation to regional fisheries management organization (RFMO), stock name, year of the assessment,
      and method. A brief summary of each model is provided in Appendix A. ASPIC (A Surplus-Production
      model Incorporating Covariates), mpb (Biomass production model), JABBA (Just Another Bayesian
      Biomass Assessment), ASPM (Age Structured Production Model), VPA (Virtual Population Analysis),
      MFCL (Multifan-CL), SS (Stock Synthesis), SBT (Southern Bluefin Tuna model).

                                                           Catch     Biomass Production      Age/Size-Based   Fully Integrated
                                              Indicators

                                                                                     JABBA

                                                                                                              MFCL
                                                                     ASPIC

   RFMO            Stockname           Year                Martell
                                                                             mpb

                                                                                                  VPA

                                                                                                                            SBT
                                                                                                                     SS
                                                            and
                                                           Froese
               Atlantic yellowfin      2019                                  •        •                              •
                 Atlantic bigeye       2018                                                                          •
              East Atlantic skipjack   2014   •              •
              West Atlantic skipjack   2014                          •
     ICCAT

             North Atlantic albacore   2020                                  •
             South Atlantic albacore   2020                                           •
             Mediterranean albacore    2017                                           •
              East Atlantic bluefin    2020                                                        •
              West Atlantic bluefin    2020                                                        •                 •
              Indian Ocean albacore    2019                                                                          •
     IOTC

               Indian Ocean bigeye     2019                                                                          •
             Indian Ocean yellowfin    2018                                                                          •
              Indian Ocean skipjack    2017                                                                          •
     CCSBT

                Southern bluefin       2017                                                                                  •

              East Pacific yellowfin   2020                                                                          •
     IATTC

               East Pacific bigeye     2020                                                                          •
              East Pacific skipjack    2019   •
                 Pacific bigeye        2018                                                                   •
     WCPFC

               Pacific yellowfin       2017                                                                   •
             South Pacific albacore    2018                                                                   •
                Pacific skipjack       2019                                                                   •
                Pacific bluefin        2018                                                                          •
     ISC

             North Pacific albacore    2020                                                                          •
Sustainability 2020, 12, 8245 5 of 22
Input uncertainty: This arises when there is no certainty about the input parameters or the quality
of the information. In fisheries science, it is attributed to the lack of biological knowledge about key
processes and to inaccurate or incomplete data sources. This uncertainty is often characterized by
developing model configurations using different model inputs (parameters and data) to characterize
the potential impact on model estimates from knowledge gaps in key biological and fishery processes.
These alternative configurations are often combined in factorial designs, which are known as uncertainty
grids of models (Table 2). One way to characterize uncertainty of biological (or other) processes is to
build model configurations with a range of fixed values, so that it is likely that the “true” value of the
parameter is within the chosen range. For example, in fisheries one of the most difficult parameters to
estimate is the steepness of the stock recruitment relationship, which is the fraction of recruitment
from an unexploited population obtained when the spawning stock biomass (SSB) is at 20% of its
unexploited level [29]. Therefore, it is not unexpected that steepness is used as a factor of uncertainty
grids in tuna stock assessments [30] (Table 2), generally using fixed values between 0.65 and 1.
Other processes that are characterized as factors of uncertainty are natural mortality, growth,
shape of selectivity curve, tag mortality, tag mixing period, selectivity, maturity, tag data overdispersion,
and fecundity (included in the Psi parameter in the Southern bluefin tuna assessments).
Another source of input uncertainty is attributed to inaccurate or incomplete data. Generally,
four types of data streams are used in stock assessments: catch, catch per unit of effort (CPUE)
or other abundance indices, size frequency data, and tagging data. In some cases, data can follow
opposing trends and inform the model in contradictory ways [31]. Often, different data sets are used
to characterize the uncertainty in the data sources (Table 2). For example, in the West and Central
Pacific stocks size information is downweighed with three options to modulate their influence. In the
Indian Ocean stocks tagging information is considered uncertain, and therefore, two or three options
for tagging data are used (weighted, downweighed, or omitted). With regards to the CPUE (or other
abundance indices), the information of different indices is combined by weighting, adding, or omitting
indices within the uncertainty grid.
In summary, all tuna RFMOs characterize input uncertainty using uncertainty grids with different
factors as options for parameters and influence of data. Note that the IATTC grids are not exactly
factorial grids but a combination of scenarios [32,33]. The largest grid is explored in the CCSBT where
432 models are used to characterize structural uncertainty. Also note that the stock assessments of
Pacific bluefin (IATTC-ISC) and North Pacific albacore (WCPFC-ISC) do not use the uncertainty grid
approach to evaluate stock status, and therefore, they are not included in Table 2.
In addition to the model grids, uncertainty is also explored through sensitivity runs, which are not
included in the management advice but allow exploring the influence of the modeling choices made and
the potential outcome of the assessment should these have been different. In general, sensitivity runs
are used to support or complement the outcome of the assessment, but these results are not used to
calculate the stock status or reference points for scientific advice.
2. Statistical uncertainty: This is mostly attributed to unpredictable variability in the abundance
indices and recruitment deviations from model fits (process error). Statistical uncertainty can be
characterized using statistical techniques such as the variance–covariance matrix, bootstrapping,
delta or Monte Carlo methods, or others that assume that the deviations from a central tendency of the
model outputs follow a probabilistic distribution.Sustainability 2020, 12, 8245 6 of 22
Table 2. Number of options considered for each factor in the systemic uncertainty grids when using fully integrated stock assessment models. Sources: [34–42].
ICCAT IOTC CCSBT WCPFC IATTC
Model Inputs
WA-BFT A-BET A-YFT IO-BET IO-YFT IO-SKJ SBT P-BET P-YFT SP-ALB EPO-BET EPO-YFT
Steepness 1 3 0 3 3 3 3 3 3 3 4 4
Growth 1 1 1 1 1 1 1 2 1 2 2 2
sigmaR 1 3 1 1 1 1 1 1 1 1 1 1
Natural mortality 1 2 1 1 1 2 12 ‡ 1 1 2 2 1
Parameters
Maturity 2 1 1 1 1 1 1 1 1 1 1 1
tag mortality 1 1 1 1 2 2 1 1 1 1 1 1
tag mixing period 1 1 1 1 1 2 1 1 2 1 1 1
Fecundity (Psi) † 1 1 1 1 1 1 3 1 1 1 1 1
Selectivity 1 1 1 1 1 1 1 1 1 1 2 2
Recruitment regime 1 1 1 1 1 1 1 1 1 1 2 1
Catchability 1 1 1 1 1 1 1 1 1 1 1 3
tag data
1 1 1 1 1 1 1 2 2 1 1 1
overdispersion
weight size data 1 1 1 1 1 1 1 3 3 3 2 1
weight tagging 1 1 1 2 2 2§ 1 1 1 1 1 1
Data
weight CPUE 1 1 2 1 2 1 4 1 1 2 2 1
regional structure 1 1 1 1 1 1 1 2 2 1 1 1
Total 2 18 2 6 24 48 432 72 72 72 44 48
(†) Psi is the power parameter on fecundity for the allometric relationship between fecundity and reproductive success. (‡) Four options for M at age 0, and three options for M at age 10.
(§) Two tagging program options. Note that East Pacific Ocean assessments are not factorial grids. Also note that this table only contains the scenarios considered to provide scientific
advice and excludes the scenarios used as sensitivity runs. WA stands for Western Atlantic, A for Atlantic, IO for Indian Ocean, P for Pacific, SP for Southern Pacific and EPO for Eastern
Pacific Ocean.Sustainability 2020, 12, 8245 7 of 22
The statistical uncertainty in model outputs is addressed by computing their confidence intervals.
In general, variability is associated with data inputs such as abundance indices and deviations from the
estimated recruitment. In the diagnostics of stock assessment fits, it is checked that deviations from fits
to input data (abundance indices, length–frequency, tags, and catch data) and recruitment deviates can
be characterized as probabilistic distributions, generally normal or log-normal. Once this is confirmed,
confidence intervals of the output parameters are estimated using statistical techniques such as the delta
method, likelihood profiles, bootstrapping, or alike. In the less computationally demanding models
(biomass dynamic production) the bootstrapping is preferred [43]. First, a coefficient of variation is
assigned to the abundance indices and the time series are replicated using random mean-square error,
which are fitted in the same model configuration. Bootstrapping allows producing model outputs
in the form of posterior distributions from which summary statistics can be obtained (e.g., mean,
median, standard deviation, and confidence intervals). This is the common practice in the Atlantic
stocks’ assessments that use simpler models.
When the fully integrated models are used, it is often implausible to produce bootstraps due to
time constrains within the assessment sessions (especially when systemic uncertainty is characterized
using uncertainty grids). In these cases, the Hessian matrix can be computed from a base or reference
case model to obtain estimates of the variance–covariance matrices, which are used in combination
with the delta method [44] to estimate confidence intervals without needing to replicate the model fits.
This method has been used to estimate statistics of model output parameters in the case of Indian Ocean
albacore and all tuna stocks in the Pacific (IATTC and WCPFC). Since 2018, in the ICCAT and IOTC a
delta–multivariate log-normal estimator [45,46] has been used to characterize statistical uncertainty
from the model options of structural uncertainty grids. This method infers within-model uncertainty
from maximum likelihood estimates, standard errors, and the correlation of model estimates [45],
and it has the advantage of calculating probability coefficients in a few seconds of model computation,
which makes it a promising method when dealing with large uncertainty grids run in time-limited
stock assessment sessions.
One of the tasks of stock assessment is to predict future trends in stock abundance for alternative
management measures. This is done in different ways across tuna RFMOs: In ICCAT and IOTC,
the preferred option is to project the agreed upon stock assessment model or grid of models for a
relatively wide range of catch levels, including the most recent catch. The projections for West Pacific
stocks are set up to project current levels of fishing mortality (or catch). In the case of Eastern Pacific,
projections are configured with the fishing mortality relative to MSY. In general, the projection period
should be consistent with the lifespan of fish stocks. For most tunas species, 10–15-year projections are
preferred, which allow for illustrating the impacts on fish abundance for the mid/long term. In the
case of the latest assessment of Atlantic bluefin stocks, because of the large uncertainty in model
estimates only a short-term projection was produced [47]. In the case of Southern bluefin, the long-term
recovery is pursued, and projections are made for 25 years, but this is a special case due to the long life
expectancy of bluefin tuna species compared to other tunas.
3. Communication of Uncertainty in Tuna RFMOs
The scientific advice provided to tuna RFMOs is based on the output of stock assessments.
The Joint Meeting of Tuna RFMOs [17] agreed to harmonize the presentation of stock assessment
results in order to improve the mutual understanding of scientists and managers in relation to the
stock status determination, management advice, and the uncertainties inherent to both. The agreed
upon presentation of stock assessment results was the Kobe plot (Figure 1a), a four-quadrant plot
that frames the status of fish stocks in two dimensions: fishing mortality and biomass (or SSB),
both relative to their MSY values. This allows reporting of stock status in four categories: (1) Green:
Not overfished (B > BMSY ) and not undergoing overfishing (F < FMSY ); (2) Orange (or upper-right
yellow) area: Not overfished (B > BMSY ) but undergoing overfishing (F > FMSY ); (3) Yellow (lower-left):
Overfished (B < BMSY ) but not undergoing overfishing (F < FMSY ); and (4) Red: Overfished (B < BMSY )considered overfished. In the WCPFC, the idea behind establishing the Majuro diagram is to take
appropriate action to avoid the stock being in an undesirable state or outside biological limits. When
a stock is subject to overfishing (F > FMSY), a prompt action will ensure that the stock does not breach
the biological LRP, and that, ideally, stock fluctuates around the TRP [48]. In this sense, FMSY is used
as a limit to fishing mortality. In other words, the fishing mortality will be lower than FMSY with high
Sustainability 2020, 12, 8245 8 of 22
probability, and, therefore, there will be a very low probability of the stock breaching the LRP, i.e.,
the undesirable state will be avoided with high probability. There are different criteria to establish
biological
and undergoing LRPs,overfishing
which generally
(F > FMSYrequire
). Theprecise
Kobe plotknowledge of the stock–recruitment
was formulated on the basis that tuna relationship
RFMO
(SRR). However,
conventions specifythethatmost commonly
the desired applied
objective is the 20%
for fishery of the estimated
management valuestocks
is to maintain for the unexploited
at abundance
stockthat
levels (LRP can= provide
20% BF=0MSY. or LRP
Since= the
20%adoption
SSBF=0) [49],
of thesince
Kobesuch a precise two
plot standard, knowledge
RFMOs of the SRR
(ICCAT andis
uncommon.
IOTC) adoptedThe Kobemanagement
fishery diagram also aims atwith
policies avoiding an undesirable
the objective situation,
of rebuilding but
and/or in this casestocks
maintaining falling
inbelow BMSY area
the green is considered
of the Kobe to be thewith
plot overfished state.
high probability. More recently, an alternative to the Kobe
plot wasIn addition,
proposedthe in International
the WCPFC, Scientific
the Majuro Committee for Tuna
plot (Figure 1b). Inand Tuna-like
this Species
framework, stockin the North
status is
Pacific Ocean
represented (ISC), of
in terms which is responsible
the spawning for providing
potential’s depletion the(relative
scientific
to advice for North
virgin stock (BF=0Pacific
or SSBstocks
F=0 ))
to the WCPFC and IATTC, uses a figure that combines the color scale of the Kobe
and fishing mortality (relative to FMSY ). The red zone represents spawning potential levels lower than plot with the stock
status
the agreeddefinition
upon LRP, of the Majuro
a point framework
at which (Figurefailures
recruitment 1c). Theare difference
thought to of become
this combined plot islikely.
increasingly that it
splits
The theisoverfished
stock considered (B overfished
< LRP) category
whenbetween
abundance those forbelow
falls which thefishing
LRP.mortality
The orange has region
been reduced
is for
below mortality
fishing FMSY (orange) and than
greater thoseFfor
MSYwhich fishing mortality
but biomass above theremains
LRP. Thisabove FMSY.area
orange Moreover,
is definedin this
as case,
not
all the area
overfished above
but the LRPoverfishing.
undergoing and below FMSY is colored in green.
(a) (b) (c)
Figure1.1.(a)
Figure (a)Kobe
Kobeplot,
plot,(b)
(b)Majuro
Majuroplot,
plot,and
and(c)
(c)diagram
diagramused
usedininthe
theInternational
InternationalScientific
ScientificCommittee
Committee
forTuna
for Tuna and
and Tuna-like
Tuna-like Species
Species in in
thethe North
North Pacific
Pacific Ocean
Ocean (ISC).
(ISC). SSBSSB is Spawning
is Spawning Stock
Stock Biomass
Biomass andand
F
isFfishing
is fishing mortality. MSY is Maximum Sustainable Yield.
mortality. MSY is Maximum Sustainable Yield.
Themain
The uncertainty
differencecharacterized
between the intwotuna stock
plots stemsassessments is communicated
from the definition of when a through probability
stock is considered
estimates of
overfished. Instock status and
the WCPFC, theoutcomes
idea behind of alternative
establishingmanagement
the Majuro actions.
diagramThis
is toistake
because different
appropriate
structural and statistical assumptions are made in stock assessments, which unfold in uncertainty
action to avoid the stock being in an undesirable state or outside biological limits. When a stock
isgrids to overfishing (F >
(see previous section). InMSY
subject F general, central tendency values of model estimates (particularly stock
), a prompt action will ensure that the stock does not breach the
status and
biological RPs)
LRP, andarethat,
provided with
ideally, deviates.
stock The around
fluctuates categorization
the TRPof[48].
stockInstatus in Kobe
this sense, andisMajuro
FMSY used
as a limit to fishing mortality. In other words, the fishing mortality will be lower than FMSY with
high probability, and, therefore, there will be a very low probability of the stock breaching the LRP,
i.e., the undesirable state will be avoided with high probability. There are different criteria to establish
biological LRPs, which generally require precise knowledge of the stock–recruitment relationship
(SRR). However, the most commonly applied is the 20% of the estimated value for the unexploited stock
(LRP = 20% BF=0 or LRP = 20% SSBF=0 ) [49], since such a precise knowledge of the SRR is uncommon.
The Kobe diagram also aims at avoiding an undesirable situation, but in this case falling below BMSY is
considered to be the overfished state.
In addition, the International Scientific Committee for Tuna and Tuna-like Species in the North
Pacific Ocean (ISC), which is responsible for providing the scientific advice for North Pacific stocks to
the WCPFC and IATTC, uses a figure that combines the color scale of the Kobe plot with the stock
status definition of the Majuro framework (Figure 1c). The difference of this combined plot is that it
splits the overfished (B < LRP) category between those for which fishing mortality has been reduced
below FMSY (orange) and those for which fishing mortality remains above FMSY . Moreover, in this case,
all the area above the LRP and below FMSY is colored in green.
The uncertainty characterized in tuna stock assessments is communicated through probability
estimates of stock status and outcomes of alternative management actions. This is because differentSustainability 2020, 12, 8245 9 of 22
structural and statistical assumptions are made in stock assessments, which unfold in uncertainty
grids (see previous section). In general, central tendency values of model estimates (particularly stock
status and RPs) are provided with deviates. The categorization of stock status in Kobe and Majuro
frameworks is done using medians and in some cases a probability of each stock status option is
provided (IOTC and ICCAT).
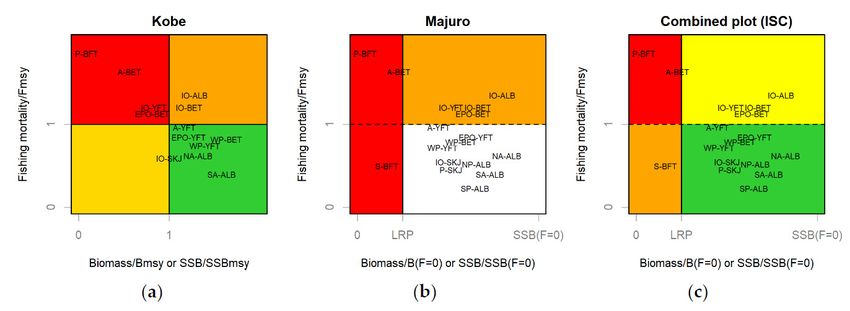
Figure 2 shows the median status of the most important tuna stocks using a common format
(Kobe plot (Figure 2a), Majuro plot (Figure 2b), and the plot used in the ISC (Figure 2c)). For these
figures we have used the LRP adopted by each RFMO and, when undefined, the LRP = 20% SSBF=0 as
a proxy.
Figure 2. State of the most important tuna stocks using a Kobe plot (a), Majuro plot (b), and the diagram
used in the ISC (c).
The Joint Tuna RFMO meeting, named the Kobe process, recommended the Kobe II Strategy
Matrices (K2SMs) as a way to report on the probability of breaching RPs (e.g., biomass falling below or
fishing mortality going over an RP) under alternative management scenarios [21]. K2SMs show the
probability that stocks will remain at or above BMSY and at or below FMSY with a different probability
for different catches or fishing mortality levels at different time frames.
4. Management of Uncertainty in Tuna RFMOs
Considering the scientific advice on stock status and management options, and, noting their own
management objectives framework and existing uncertainties, RFMOs modulate the fishing activity by
setting limits to the fishing effort, catch, or other type of measures. One way to manage uncertainty on
fisheries under the PA is through MSE and the adoption of HSs. The five tuna RFMOs have carried
out some type of MSE work, including consultation on management objectives, characterization of
uncertainty of stocks’ dynamics and observation, and evaluation of HSs [22]. The CCSBT has pioneered
the adoption of HSs for tunas: From 2002 to 2011, the CCSBT conducted extensive work to develop an
HS known as the “Bali procedure” that was adopted to help rebuild Southern bluefin by setting catch
limits periodically [50]. The development of this work was initiated by a technical group of experts
through specific workshops. These were scheduled to develop a work plan to focus on the specification
of operating models (OMs), that represent alternative biological and fishery dynamics [23] and the
evaluation of simple HS. The OMs developed in the CCSBT are the same models used to monitor the
recovery of the stock (see Table 2). The HS of the CCSBT is tuned to achieve a management objective
of rebuilding the stock to the interim rebuilding target point of 20% of the original spawning stock
biomass by 2035 with 70% probability. The Bali procedure consists of the application of two HSs and
setting catch limits from the average of the two. These are based on the trends of juvenile and adult
fish indicators (CPUE and aerial survey) and the estimates of a biomass random effects model [51].
The ICCAT and IOTC have adopted HCRs for North Atlantic albacore and Indian Ocean skipjack,
respectively [52,53]. The main difference with the CCSBT is that both RFMOs have adopted HCRs andSustainability 2020, 12, 8245 10 of 22
not the entire HS, which includes the specifications on the data and the stock assessment methods to
Sustainability 2020, 12, x FOR PEER REVIEW 10 of 22
be used. In both cases the adoption of the HCRs represents a first step toward adopting fully specified
MPs shortly.
The MSE process is also developing fast for many other tuna stocks in the ICCAT, IOTC,
The MSE process is also developing fast for many other tuna stocks in the ICCAT, IOTC, WCPFC,
WCPFC, and IATTC: The IOTC Scientific Committee started a work plan to evaluate HSs using MSE
and IATTC: The IOTC Scientific Committee started a work plan to evaluate HSs using MSE for
for albacore, bigeye, yellowfin, and skipjack in 2012 (and swordfish in 2018). Since then, a small ad
albacore, bigeye, yellowfin, and skipjack in 2012 (and swordfish in 2018). Since then, a small ad
hoc working group has been tasked to develop MSE works and to report to the IOTC through the
hoc working group has been tasked to develop MSE works and to report to the IOTC through
Technical Committee on Management Procedures (TCMP) organized directly before the IOTC
the Technical Committee on Management Procedures (TCMP) organized directly before the IOTC
Annual Commission meetings. The TCMP is the formal communication forum between science and
Annual Commission meetings. The TCMP is the formal communication forum between science and
management to enhance the decision-making response of the commission in relation to the adoption
management to enhance the decision-making response of the commission in relation to the adoption of
of HSs [54]. The IOTC’s Resolution 15-10 “On target and limit reference points and a decision framework”
HSs [54]. The IOTC’s Resolution 15-10 “On target and limit reference points and a decision framework” defines
defines a series of interim target and limit RPs for albacore, bigeye, yellowfin, skipjack, and swordfish
a series of interim target and limit RPs for albacore, bigeye, yellowfin, skipjack, and swordfish [55].
[55]. Note that these resolutions are explicitly based on IOTC’s Resolution 12-01 “On the
Note that these resolutions are explicitly based on IOTC’s Resolution 12-01 “On the implementation of
implementation of the precautionary approach.” Also, it is important to note that currently, despite some
the precautionary approach.” Also, it is important to note that currently, despite some agreement on the
agreement on the management objectives, there is no time frame or probability levels agreed upon
management objectives, there is no time frame or probability levels agreed upon for any of these stocks.
for any of these stocks. Along these lines, the IOTC called the TCMP to define the overarching
Along these lines, the IOTC called the TCMP to define the overarching management objectives to
management objectives to guide the development of management procedures (or HSs) for the IOTC
guide the development of management procedures (or HSs) for the IOTC fisheries [56]. With regards
fisheries [56]. With regards to albacore, bigeye, and yellowfin, the MSE frameworks are at very
to albacore, bigeye, and yellowfin, the MSE frameworks are at very advanced stages and will be in a
advanced stages and will be in a position to evaluate HSs in the coming years [57]. The uncertainty
position to evaluate HSs in the coming years [57]. The uncertainty for these stocks is characterized
for these stocks is characterized through OM grids conditioned from the latest stock assessments with
through OM grids conditioned from the latest stock assessments with alternatives for natural mortality,
alternatives for natural mortality, steepness, selectivity, and dynamic catchability.
steepness, selectivity, and dynamic catchability.
With regards to the adopted HCR for Indian Ocean SKJ, the IOTC’s Resolution 16-02 indicates
With regards to the adopted HCR for Indian Ocean SKJ, the IOTC’s Resolution 16-02 indicates the
the procedure to be followed to establish the catch limits in three-year periods directly from stock
procedure to be followed to establish the catch limits in three-year periods directly from stock status
status estimated through a stock assessment endorsed by the Scientific Committee. Resolution 16-02
estimated through a stock assessment endorsed by the Scientific Committee. Resolution 16-02 specifies
specifies a relationship between stock status (spawning biomass relative to unfished levels) and
a relationship between stock status (spawning biomass relative to unfished levels) and fishing intensity
fishing intensity (exploitation rate relative to target exploitation rate, Figure 3). This resolution also
(exploitation rate relative to target exploitation rate, Figure 3). This resolution also defines the target
defines the target reference point for skipjack as SSBTAR = 40% SSB0 and the limit reference point at
reference point for skipjack as SSB = 40% SSB and the limit reference point at SSBLIM = 20% SSB0 .
SSBLIM = 20% SSB0. Note that the TAR LRP (20% SSB00) is different from the “safety level” of 10% SSB0
Note that the LRP (20% SSB0 ) is different from the “safety level” of 10% SSB0 defined in the HCR.
defined in the HCR. Note also that the biological TRP is the threshold of the HCR, the point below
Note also that the biological TRP is the threshold of the HCR, the point below which the fishing
which the fishing mortality used to establish catch limits starts to decrease.
mortality used to establish catch limits starts to decrease.
Figure 3. Harvest control rule adopted for Indian Ocean skipjack (IOTC, Resolution 16-02).
Figure 3. Harvest control rule adopted for Indian Ocean skipjack (IOTC, Resolution 16-02).
In ICCAT, the Standing Committee for Research and Statistics (SCRS) has fostered the development
In under
of MSE ICCAT,
thethe Standing
principles Committee
of the PA for tunafor Research
stocks and Statistics
in the Atlantic (SCRS)
since 2010 [58]. has
This fostered the
development
development of MSE
has been followed byunder the principles
successive of evaluate
requests to the PA for tunaconsistent
HCRs stocks in the
withAtlantic
ICCATsince 2010 [58].
objectives and
This developmentprinciples
decision-making has been [59].
followed by successive
To date, an MSE hasrequests to evaluate
mostly been HCRs
developed for consistent withalbacore
North Atlantic ICCAT
objectives and decision-making principles [59]. To date, an MSE has mostly been developed for North
Atlantic albacore and Atlantic bluefin tuna. With regards to the North Atlantic albacore MSE, this
was specifically developed to support the adoption of a HCR in 2017 [52]. The MSE developed
includes an HS that is similar to the latest assessment of this stock, i.e., simulating the catch data and
CPUE series used for the 2016 stock assessment, together with the same model and modelSustainability 2020, 12, 8245 11 of 22
and Atlantic bluefin tuna. With regards to the North Atlantic albacore MSE, this was specifically
Sustainability
developed to2020, 12, x FOR
support thePEER REVIEW
adoption of a HCR in 2017 [52]. The MSE developed includes an HS that 11 of
is22
similar to the latest assessment of this stock, i.e., simulating the catch data and CPUE series used for the
specifications
2016 (shape,together
stock assessment, initial biomass,
with the andsamerange
model ofand
parameters). This work (shape,
model specifications coveredinitial
the uncertainty
biomass,
inherent
and range of toparameters).
this fisheryThis through a range the
work covered of uncertainty
options forinherent
natural to mortality,
this fisherysteepness,
through adynamic
range
ofcatchability, and available
options for natural information
mortality, steepness,[60–63].
dynamic Recently, anotherand
catchability, study used the
available MSE framework
information for
[60–63].
North Atlantic
Recently, anotheralbacore
study used to show
the MSEthe benefits
framework of HCRs to mitigate
for North Atlanticthe impactstoofshow
albacore climate
the change
benefits[64].
of
HCRs to Based uponthe
mitigate theimpacts
results of of the HCRchange
climate evaluation
[64]. for North Atlantic albacore, the ICCAT adopted a
model-based
Based upon HCR for thisof
the results stock (Figure
the HCR 4), whichfor
evaluation was usedAtlantic
North in 2017albacore,
to fix catch
thelimits
ICCAT foradopted
the period
a
2018–2020 and
model-based HCR in for
2020 to stock
this recommend(Figurecatch limitswas
4), which for used
the period
in 20172021–2023.
to fix catchThe PA for
limits is embedded
the periodin
this recommendation
2018–2020 and in 2020 to as it specifies
recommend a target
catch limitsfishing mortality
for the period of FTAR The
2021–2023. = 80%PA FisMSY and it has
embedded been
in this
evaluated to achieve
recommendation the management
as it specifies objective
a target fishing of maintaining
mortality of FTAR = the
80%stock
FMSYinand
theitgreen quadrant
has been of the
evaluated
toKobe
achieveplottheat management
least with 60% probability.
objective The biomass
of maintaining the limit
stockreference
in the greenpoint is set asofLRP
quadrant = 40%plot
the Kobe BMSY
atand
leastthe threshold
with reference point
60% probability. of the HCR
The biomass limitisreference
BMSY. Thispoint
HCRisalsoset considers
as LRP = one40%FB MIN of and
MSY 10%the FMSY
to ensure
threshold a level of
reference catch
point offor
thescientific
HCR is Bmonitoring
MSY . This HCR[52].
also considers one FMIN of 10% F MSY to ensure
a level of catch for scientific monitoring [52].
Figure
Figure 4. 4. Harvest
Harvest control
control rule
rule adopted
adopted forfor North
North Atlantic
Atlantic albacore.
albacore.
For
For Atlantic
Atlantic bluefin
bluefin tuna,tuna, noting
noting the high
the high priority
priority placed placed
by theby the commission
commission on the completion
on the completion of the
of the
MSE work MSE work program
program and the development
and the development of new
of new and/or and/or improved
improved assessment assessment
methods, the methods,
Atlantic the
Atlantic
Wide Wide Programme
Research Research Programmefor Bluefin for Tuna
Bluefin Tuna (GBYP)
(GBYP) Modelling Modelling
and MSE andGroup
MSE Group was created
was created in
in 2014
2014 [65].[65].
ThisThis
groupgroup
has has structured
structured a work
a work planplan in five
in five components:
components: 1. 1. Data
Data collation,
collation, management
management
andsynthesis;
and synthesis;2.2.Review
Reviewand andselection
selection of of alternative
alternative stock
stock assessment
assessmentmodels;models;3.3.Development
Development ofof
the
MSE
the MSE modeling
modeling platform;
platform; 4. Capacity
4. Capacity building in harvest
building strategies,
in harvest reference
strategies, points,
reference and MSE;
points, and 5.
and MSE;
Consultation
and 5. Consultationand and
engagement
engagement in design
in design andandevaluation
evaluation of of
harvest
harvest strategies.
strategies.An Animportant
importantstepstepof
ofthe
theAtlantic
Atlanticbluefin
bluefintuna
tunaMSE MSEisisthat
thatit it
allows
allowsforfor
mixing
mixing of of
stocks
stocks over several
over areas,
several in contrast
areas, with
in contrast
the the
with current assumption
current assumption of two separate
of two separate stocks.
stocks.
TheScientific
The ScientificAdvisory
AdvisoryCommittee
Committee (SAC) (SAC) hashas led
ledthetheMSE
MSEprocess
process inin
thethe
IATTC,
IATTC, andand
it has been
it has
responsible
been responsiblefor the
fortechnical
the technicalwork work
that has guided
that the adoption
has guided of targetofand
the adoption limitand
target RPslimit
as well
RPsasasthe
stock
well as assessments. In 2003, SAC
the stock assessments. organized
In 2003, SAC aorganized
workshopa with the aim
workshop of describing
with the aim of the management
describing the
objectives for
management the stocks
objectives for theunder its under
stocks mandate and defining
its mandate appropriate
and defining reference
appropriate pointspoints
reference [66]. [66].
After
consultations,
After consultations,in 2014 thethe
in 2014 IATTC
IATTC adopted
adoptedananinterim
interimtarget
target and
and limited
limited RPsRPsfor
fortropical
tropicaltuna
tunastocks
stocks
(bigeye,
(bigeye, yellowfin,
yellowfin, andand skipjack).
skipjack). The
The TRPs
TRPs are
are thethe biomass
biomass andand fishing
fishing mortality
mortality rate
rate corresponding
corresponding
toto MSY
MSY (B(B andFF
MSYand
MSY MSY,, respectively),
MSY respectively),which whichhave havebeen
beenthetheunofficial
unofficialTRPsTRPsusedusedininmanaging
managingtuna tuna inin
the
the Eastern
Eastern Pacific
Pacific OceanOcean through
through a pseudo-HCR.
a pseudo-HCR. The LRPsTheare LRPs
thoseare those associated
associated with a 50%with a 50%
reduction
inreduction
recruitment in under
recruitment under aassumption
a conservative conservative assumption
of the of the stock–recruitment
stock–recruitment relationship, which relationship,
is based
onwhich is based
biological on biological
grounds to protect grounds
a stock tofromprotect a stock
serious, from
slowly serious, slowly
reversible, reversible,
or irreversible or irreversible
fishing impacts.
fishing impacts. This approach has led to the LRP of 7.7% of SSB0. In general, this is interpreted as
ensuring that recruitment is not substantially impacted. Following the adoption of the target and
limit RPs, SAC has developed MSE frameworks for evaluating more elaborated HCRs for tropical
and other tunas, and this work is expected to lead to the adoption of formal HSs in the near future
[67–72].Sustainability 2020, 12, 8245 12 of 22
This approach has led to the LRP of 7.7% of SSB0 . In general, this is interpreted as ensuring that
recruitment is not substantially impacted. Following the adoption of the target and limit RPs, SAC has
developed MSE frameworks for evaluating more elaborated HCRs for tropical and other tunas, and this
work is expected to lead to the adoption of formal HSs in the near future [67–72].
The WCPFC has also developed a work plan toward adopting HSs. The technical work has been
focused on estimating the impact of different management objectives (including specific time frames,
levels of risks, and probabilities of overexploited stocks) on fishery performance and has included
economic principles of fisheries like the maximum economic yield as a RP and historical catch rates for
South Pacific albacore, bigeye, skipjack, yellowfin, and Pacific bluefin tuna [73–80]. For that, alternative
parameter sets are used to condition OM grids along similar lines to the uncertainty grids covered
in the WCPFC stock assessments [80]. The technical work has been communicated through specific
Management Objective Workshops (2012–2016), where assistance has been provided to the commission
to understand the purpose and implications of management objectives; to understand both the role of
appropriate RPs and the process of evaluating potential management measures in the achievement
of management objectives; and to develop a list of recommended management objectives to guide
the management of fisheries by the WCPFC [81–83]. These workshops have allowed identifying
and refining potential TRPs and proposing conservation and management measures (CMMs) for
establishing HSs for key tuna stocks. With regards to how the PA is dealt with in the WCPFC, overall,
the proposed TRPs correspond to depletion levels well above the estimated MSY with the aim of
improving the economic performance of fisheries and minimizing the probability of breaching LRPs.
5. Discussion and Recommendations
Uncertainty is inherent to fisheries and needs to be analyzed carefully. Overlooking the uncertainty
in key biological processes and fishery dynamics can have a large impact on achieving fisheries
management objectives [84] and can potentially lead to management failure [16]. In this document,
we review the different ways that the RFMOs in charge of maintaining tuna stocks at sustainable levels
treat uncertainty. Our work aligns with the Joint Tuna RFMOs initiative and the Kobe process [17] in
the aim of standardizing stock assessment methods and communication formats toward a scientifically
sound and harmonized sustainable management of tuna stocks [85,86]. For this, we have reviewed
the similarities and differences between the characterization, communication, and management of
uncertainty and provided suggestions for harmonizing practices.
In general, tuna stock assessment has evolved toward highly parameterized, integrated statistical
modeling frameworks [87]. The use of simple models such as catch-based or biomass dynamic models
can often produce an accurate diagnostic of stock status but cannot account for fishery particularities
such as fishery dynamics of catch at size/age, the seasonal/spatial distribution of stocks, key biological
processes, and technological development. Today, only Atlantic stocks are evaluated using catch-based
or biomass dynamic models. In one case biomass dynamic models are used in combination with fully
integrated models (Atlantic yellowfin). In the case of Western Atlantic bluefin, the complement to
the integrated model is a size-based model. Thus, in only two of the most important tuna stocks the
uncertain relationship between model inputs and outputs (model uncertainty) is characterized [9].
Simple models are often used by other RFMOs but only for exploratory purposes, and scientific advice
is not built upon their results.
Best practice for characterizing structural uncertainty in stock assessments is through a “grid
approach” that includes uncertainty related to model specification with options for key biological
parameters and data streams [87]. Since 2020 this approach has been followed by all tuna RFMOs.
The key biological processes of fish are reproduction, growth, and natural mortality, and thus, it is
important to quantify the impact of the lack of knowledge about these processes for a better fisheries
management [16]. Ranges of parameters or alternative values for these processes are used in the
structural uncertainty grids for most tuna stocks. One of the most uncertain aspects of fish biology is
the relationship between the available spawning stock and the following recruitment, the so-calledSustainability 2020, 12, 8245 13 of 22
stock–recruitment relationship, which can have a large impact on the outcome of stock assessments.
In stock assessment models, the amount of spawning biomass determines the expected recruitment
in the following year through a functional relationship. The key parameter of the stock–recruitment
models is steepness h, and it is considered as one of the most difficult parameters to estimate [21],
thus it is a common factor in most tuna uncertainty grids. Since 2020, in all RFMOs the values have
ranged between 0.65 and 1. Meta-analytical studies recommend using h = 0.8 as a default for tuna
stocks [30]. In some RFMOs, the range of steepness values does not differ among species. For example,
in the IOTC and WCPFC, the three tropical tuna stocks are characterized with the same range of values
(0.7–0.9 in the IOTC and 0.65–0.95 in the WCPFC). There is evidence that values below 0.8 may be
implausible for skipjack [34], and even for yellowfin, which are considered more productive than
bigeye [88]. It seems insightful to harmonize the use of steepness values for stocks globally rather
than using the same range for the different species within an RFMO—in other words, using the same
species-specific range of values in all RFMOs. It seems reasonable that the values of steepness for
albacore, bluefin, and bigeye can be lower those for skipjack and yellowfin.
Input uncertainty is also explored using alternative data and weighting. The data used
in stock assessments consist of catch, abundance indices, size frequency data, and sometimes
fishery-independent indices such as surveys or tagging programs. The model configurations used in
the most important tuna stocks reflect that uncertainty is characterized for CPUE, tagging, and size
data across tuna RFMOs. Catch is assumed known in all stock assessments that use the grid approach.
However, in some cases, scenarios of catch reporting are used to characterize uncertainty. This is the
case of East Atlantic bluefin tuna, where “inflated” and “reported” catch scenarios are developed as
alternative views of the history of the fishery but not in a grid to be averaged across [47]. One exploratory
analysis [89] finds that potential problems with catch reporting in the Indian Ocean do not have a large
impact on yellowfin’s stock status estimates but may be important for reference points such as the
estimated MSY.
With regards to the “grid approach,” it is recommended that all individual model configurations
should be biologically plausible and satisfy model diagnostics of fit [87]. Because of time constraints,
model diagnostics are often applied to one preferred “reference case” from the grid. Extending the
plausibility and statistical tests to all model configurations is something to pursue by tuna RFMOs,
for which methodologies will need to be developed. This was done in the IATTC in the latest bigeye
and yellowfin stock assessments, where diagnostics of fits were used to validate or discard individual
model runs from the uncertainty grids [32,33].
Statistical uncertainty is characterized in all tuna RFMOs. Until recently, exploring this uncertainty
was difficult due to the time required to run highly parameterized models with stochasticity. The method
applied in the recent assessments of the ICCAT and IOTC [45] is a promising way to characterize
statistical uncertainty once models like SS3 or Multifan-CL are run in deterministic mode, which is
significantly faster than computing the Hessian, which is normally done for a “reference case” of the
grid only.
It is also important to reduce, to the greatest possible extent, the major uncertainties that undermine
scientific advice in fisheries by improving knowledge in biological processes and the interaction between
fishing gears and fish stocks [16]. For this, tuna RFMOs are currently undergoing important initiatives.
For example, the Pacific Tuna Tagging Programme, the Regional Tagging Program in the Eastern
Pacific Ocean, the CCSBT Tagging Program, and the Indian Ocean Tuna Tagging Programme have
increased knowledge on movements of the most important tuna stocks and improved the scientific
basis for estimation of abundance, exploitation rates, selectivity, and key biological processes like
growth and natural mortality [90–93]. This information is already being used in all but Atlantic stock
assessments. In ICCAT, the Atlantic-Wide Research Programme for Bluefin Tuna and the Atlantic
Ocean Tropical Tuna Tagging Programme are producing large quantities of data that are expected to
reduce uncertainties in the dynamics of Atlantic stocks.You can also read