Continuous Monitoring of the Thermoregulatory Response in Endurance Horses and Trotter Horses During Field Exercise: Baselining for Future Hot ...
←
→
Page content transcription
If your browser does not render page correctly, please read the page content below
ORIGINAL RESEARCH
                                                                                                                                                published: 26 August 2021
                                                                                                                                          doi: 10.3389/fphys.2021.708737

                                                Continuous Monitoring of the
                                                Thermoregulatory Response in
                                                Endurance Horses and Trotter
                                                Horses During Field Exercise:
                                                Baselining for Future Hot Weather
                                                Studies
                                                Elisabeth-Lidwien J. M. M. Verdegaal 1,2,3* , Gordon S. Howarth 2 , Todd J. McWhorter 2 ,
                                                Berit Boshuizen 3 , Samantha H. Franklin 1,2 , Carmen Vidal Moreno de Vega 3 ,
                                                Stacey E. Jonas 2 , Louise E. Folwell 2 and Catherine J. G. Delesalle 3
                                                1
                                                 Equine Health and Performance Centre, University of Adelaide, Adelaide, SA, Australia, 2 School of Animal and Veterinary
                                                Sciences, Roseworthy Campus, University of Adelaide, Adelaide, SA, Australia, 3 Research Group of Comparative
                                                Physiology, Department of Virology, Parasitology and Immunology, Faculty of Veterinary Medicine, Ghent University, Ghent,
                                                Belgium
                          Edited by:
            James (Jim) David Cotter,
    University of Otago, New Zealand            Establishing proper policies regarding the recognition and prevention of equine heat
                        Reviewed by:            stress becomes increasingly important, especially in the face of global warming. To
                        Jane Williams,          assist this, a detailed view of the variability of equine thermoregulation during field
     Hartpury University and Hartpury
            College, United Kingdom
                                                exercise and recovery is essential. 13 endurance horses and 12 trotter horses were
                      Duncan Mitchell,          equipped with continuous monitoring devices [gastrointestinal (GI) pill, heartrate (HR)
      University of the Witwatersrand,
                                                monitor, and global positioning system] and monitored under cool weather conditions
                          South Africa
                                                during four endurance rides over a total of 80 km (40 km loops) and intense trotter
                  *Correspondence:
            Elisabeth-Lidwien J. M. M.          track-based exercise over 1,540 m. Recordings included GI temperature (Tc ), speed,
                            Verdegaal           HR and pre- and post-exercise blood values. A temperature time profile curve of Tc
   lidwien.verdegaal@adelaide.edu.au
                                                was constructed, and a net area under the curve was calculated using the trapezoidal
                   Specialty section:           method. Metabolic heat production and oxygen cost of transport were also calculated
         This article was submitted to          in endurance horses. Maximum Tc was compared using an independent samples t-test.
                   Exercise Physiology,
               a section of the journal
                                                Endurance horses (mean speed 14.1 ± 1.7 km h−1 ) reached mean maximum Tc
               Frontiers in Physiology          (39.0 ± 0.4◦ C; 2 × 40 km in 8 horses) during exercise at 75% of completion of Tc
            Received: 12 May 2021               exercise and Tc returned to baseline within 60 min into recovery. However, the mean
            Accepted: 29 July 2021
                                                Tc was still 38.8 ± 0.4◦ C at a HR of 60 bpm which currently governs “fit to continue”
          Published: 26 August 2021
                                                competition decisions. Trotters (40.0 ± 2.9 km h−1 ) reached a comparable mean max
                             Citation:
    Verdegaal E-LJMM, Howarth GS,               Tc (38.8 ± 0.5◦ C; 12 horses) always during recovery. In 30% of trotters, Tc was still
         McWhorter TJ, Boshuizen B,             >39◦ C at the end of recovery (40 ± 32 min). The study shows that horses are individuals
Franklin SH, Vidal Moreno de Vega C,
             Jonas SE, Folwell LE and
                                                and thermoregulation monitoring should reflect this, no matter what type of exercise is
    Delesalle CJG (2021) Continuous             performed. Caution is advised when using HR cut-off values to monitor thermal welfare
  Monitoring of the Thermoregulatory
                                                in horses since we have demonstrated how Tc can peak quite some time after finishing
      Response in Endurance Horses
       and Trotter Horses During Field          exercise. These findings have implications for training and management of performance
   Exercise: Baselining for Future Hot          horses to safeguard equine welfare and to maximize performance.
                     Weather Studies.
           Front. Physiol. 12:708737.           Keywords: thermoregulation, hyperthermia, gastrointestinal pill, endurance, trotters, metabolic heat (H),
    doi: 10.3389/fphys.2021.708737              recovery, exercise

Frontiers in Physiology | www.frontiersin.org                                          1                                         August 2021 | Volume 12 | Article 708737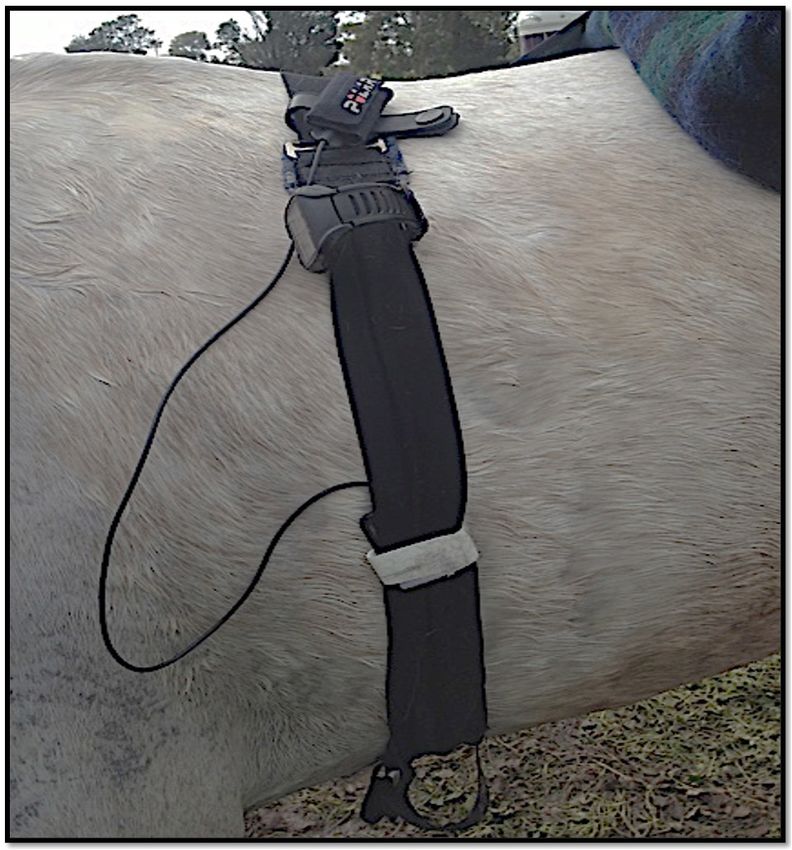
Verdegaal et al.                                                                           Thermoregulatory Response in Endurance and Trotter Horses

INTRODUCTION                                                              range of mean winning speeds at FEI 100–120 km endurance
                                                                          rides around the world varies between 14.1 and 24.8 km h−1
Exertional heat illness (EHI) in horses is characterized by               while reported maximum winning speeds range from 17.2 to
severe central nervous system dysfunction, such as physical               26.2 km h−1 (Nagy et al., 2010). After each exercise loop, a
collapse, and has been described in detail (Brownlow et al.,              recovery rest period is imposed to allow the HR to return to
2016; Brownlow and Mizzi, 2020). Recently, a Japanese study               below values of 60 bpm under the regulations of the Australian
identified a wet-bulb globe temperature (WBGT) index above                Endurance Riding Association or 64 bpm as per FEI regulations
28◦ C to be responsible for a 28.5% higher risk for development           (Nagy et al., 2012; FEI, 2018; AERA, 2020). Once this is achieved,
of EHI when compared to the index below 20◦ C (Takahashi                  a follow-up inspection including metabolic and gait assessment is
and Takahashi, 2020). A progressive increase in the prevalence            performed by the certified endurance veterinarian to determine
of human EHI casualties is anticipated due to global warming              whether the horse is deemed fit to continue with the next
(Raymond et al., 2020) and a similar effect can be anticipated            exercise loop or qualifies for completion of the competition.
for animals in general. In continents with warm climates and              Clinical assessment during endurance rides is essential to ensure
established horseracing industries, a WBGT above 28◦ C is                 sufficient recovery in all horses since a high elimination rate
often recorded during approximately 2–3 months annually.                  (nearly 50%) is reported, and more specifically, the elimination
These regions include the southern part of North America                  rate due to metabolic disorders in endurance exercise varies
and Europe, Oceania, parts of Africa, South America, and                  between 4.2 and 15% (Barnes et al., 2010; Nagy et al., 2010,
Asia (Raymond et al., 2020). It is a common misconception                 2014; Fielding et al., 2011, 2017; Younes et al., 2015; Bennet
that EHI affects horses in only very hot and humid weather                and Parkin, 2018; Legg et al., 2019). Common debilitating
conditions, however, EHI casualties are also reported to occur on         metabolic disorders include abdominal discomfort, dehydration,
warmer pre-season days. To date, EHI has been underreported               and exertional rhabdomyolysis (Fielding et al., 2009; Verdegaal
most probably because only the more severe and overt                      et al., 2018; Misheff, 2020).
clinical cases are being recognized, leaving many mild cases                  At present, little is known about the core body temperature
unnoticed with possibly deleterious effects (Brownlow et al., 2016;       evolvement in real time during different types of exercise
Brownlow and Mizzi, 2021).                                                performed by racehorses and endurance horses under field
    Consequently, there is great need to further fine-tune early          conditions. The vast majority of thermoregulatory studies have
detection of hyperthermia and to obtain a detailed view of                been conducted under indoor laboratory conditions using
the flexibility of equine thermoregulation in the field under             a treadmill and subjecting the horses to performance of
different exercise and climatic conditions. Such knowledge will           specific standardized exercise tests. To this end, monitoring
allow for identification of predisposing factors that may lead            of arterial pulmonary blood temperature has proven to be
to the formulation of evidence-based hot weather policies and             “the gold standard” (Hodgson et al., 1993; Marlin et al.,
recommendations for the post-exercise and recovery period to              1996; Courouce-Malblanc, 2013; Hodgson, 2014). However, this
prevent hyperthermia, EHI and EHS (Hosokawa et al., 2019;                 approach is generally not feasible and too invasive under field
MOOC heat illness, 2021). Another critical aspect that needs              conditions; only one study reported similar invasive methods
to be clarified is the optimal rest and recovery period that is           in three horses during free field exercise using thermistors
required before “return to exercise” is allowed after an EHI              to measure blood and brain temperature (Mitchell et al.,
event. For example, human athletes who have experienced an                2006). A few studies are available that focus on continuous
EHI episode are required to rest and rehabilitate for a certain           monitoring of equine thermoregulation during exercise and
period, varying from 3 to 6 weeks to a year (Adams and                    recovery in the field (Smith et al., 2006; Verdegaal et al.,
Jardine, 2020). Similarly, various regulations govern eliminated          2017). Smith et al. (2006) used intra-uterine temperature loggers
endurance horses who are given rest periods to recover following          as a non-surgical, minimally invasive method to measure
a competition (AERA, 2020; FEI, 2021).                                    evolvement of intra-uterine temperature during field exercise.
    The way the thermoregulatory system is challenged greatly             This method has the advantage of collecting data over several
depends on the speed and distance that are realized by the                competitions, however, it does not monitor real-time core body
exercising horse (Hodgson et al., 1994). Additionally, important          temperature as data were downloaded after removal of the
breed differences are to be expected (Fielding et al., 2011). For         logger. Obviously, the intra-uterine method is only applicable
example, trotter horses are bred for harness racing over distances        in mares. No data are available on the long-term effect of
ranging from 1,540 m (short distance races), 2,140 m (medium              these loggers on uterine function. In contrast, our telemetric
distance races), 2,640 m (long distance races), and rarely to             recording method is able to provide real-time results and does
3,140 m (ultra-long-distance races), with average race speeds             not require subsequent time-critical analysis. This could be
of 47.3–48.6 km h−1 (Bertuglia et al., 2014). In comparison,              undertaken at any time after completion of the exercise period
endurance horses compete over distances of 80–160 km divided              (Verdegaal et al., 2017).
over exercise loops (sections) of 30–40 km under the regulations              It is important to note that most existing field studies compare
of either the National Endurance Riding Associations or the               rectal temperature (Tre ) before and after exercise (Kohn and
Fédération Équestre Internationale (FEI, 2018; FEI, 2021). The            Hinchcliff, 1995; Kohn et al., 1995; Hargreaves et al., 1999; Jeffcott
                                                                          et al., 2009; Wallsten et al., 2012). However, Tre is reported to
Abbreviations: GI, Gastrointestinal; COT, Cost of transfer.               significantly lag behind the core body temperature both during

Frontiers in Physiology | www.frontiersin.org                         2                                      August 2021 | Volume 12 | Article 708737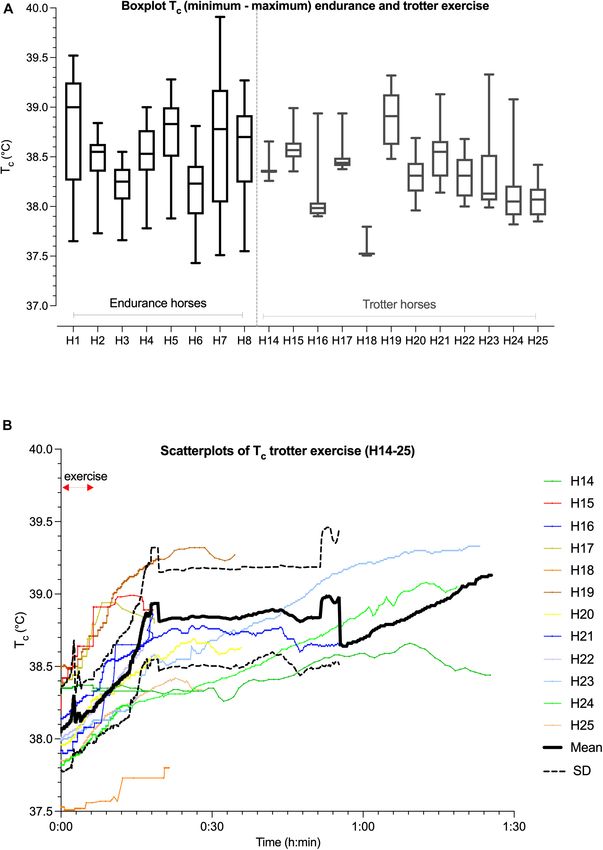
Verdegaal et al.                                                                                       Thermoregulatory Response in Endurance and Trotter Horses

  FIGURE 1 | Flow chart of study design describing two types of exercise and distance; km, kilometers; m, meters; n, number of horses; min, minutes; endurance
  exercise; moderate trotter warm-up exercise; and fast trotter exercise.

and after exercise (Hodgson et al., 1993; Geor et al., 1995;                         calculating the energy expenditure of the horses, the estimated
Verdegaal et al., 2017). This means that the heating of the core                     mass of the rider was considered (Pagan and Hintz, 1986)
of the body is always reflected in the Tre at a much later stage                     based on “rider riding division criteria” determined in the
and at a lower temperature. Recently, we reported and validated                      AERA rules (AERA, 2020). These criteria encompass: (1) HM
a novel real-time temperature monitoring method namely a                             division—heavy mass rider of 91 kg or greater, estimated
gastrointestinal (GI) pill that allows for accurate continuous                       average 103 kg; (2) MM division—middle mass of 73 kg or
recording of the GI temperature in exercising horses in the                          greater, estimated average 83 kg; (3) LM division—low mass,
field (Verdegaal et al., 2017). The GI pill proved to be a more                      no minimum mass, estimated average 63 kg. The trotter horses
accurate and precise tool to monitor thermal response than                           were weighed on a mass scale (Ruddweigh 700 , Gallagher Group
                                                                                                                                            R

serial Tre measurements. Importantly, the GI temperature (Tc )                       Limited, New Zealand).
was consistently and significantly higher than the Tre (mean                            All 13 endurance horses (Horses 1–13, Table 1) were sourced
difference 0.3◦ C, with a range of 0.2–0.3◦ C) and Tc increased                      on a voluntary basis through the South Australian Endurance
earlier than Tre on all occasions (Verdegaal et al., 2017).                          Riders Association (SAERA) at a maximum of four horses per
    The aim of the current study was to continuously monitor                         event. All horse owners signed a written consent form before
and compare the time profile of the dynamic thermoregulatory                         enrolment. The horses remained under the care of their owners
response of endurance horses in real-time competitions and                           for the duration of the events and owners could withdraw their
trotter horses in the field. The GI temperature profiles were                        horse at any time during the study. Before competition, all horses
established during exercise and recovery under cool weather                          were subjected to a health inspection conducted by endurance
conditions to create a baseline thermal response profile for future                  veterinarians according to AERA riding rules (AERA, 2020).
field studies performed under hot and humid weather conditions.                         The second study group consisting of 12 unconditioned trotter
For this purpose, trotter and endurance horses were equipped                         horses (Standardbreds; Horses 14–26, Table 1) was randomly
with several non-invasive monitoring devices [GI pill (Tc ),                         selected from a university-based teaching herd at a maximum
heartrate (HR) monitor, and global positioning system (GPS)                          of four horses per event. Trotters were kept in large paddocks
monitor] to continuously monitor their physiologic responses                         without additional exercise or training. Before enrolment, trotters
to field exercise.                                                                   were subjected to a standard clinical health check. The present
                                                                                     study was approved by the University of Adelaide Animal Ethics
                                                                                     Committee (project number S-2011-224), which conformed to
                                                                                     the Australian Code of Practice for the care and use of animals
MATERIALS AND METHODS                                                                for scientific purposes, Canberra, Australia, 2004.
Horses
In the first study group, 13 trained endurance horses (Horses                        Study Design
1–13) were enrolled, competing at either 40, 80, or 100 km                           The study design is illustrated in Figure 1. Endurance horses
distances. The study design is presented in a flowchart in                           (Table 1) were competing at distances of either 40 km (n = 2)
Figure 1. The characteristics of the horses such as breed,                           or 80 km (n = 11) and two of those horses continued to cover
age, sex, body mass, coat color, together with competition                           100 km. Data collection for endurance horses was performed
distance are presented in Table 1. The body mass of endurance                        during four endurance events during the cooler South Australian
horses was determined using an equine mass tape (Horse                               winter months (May, June, and July) and event locations varied
and pony weight tape ; Wagner and Tyler, 2011). When
                                R
                                                                                     from −34◦ 280 5.7000 S to −34◦ 320 3.0800 S. The horses exercised

Frontiers in Physiology | www.frontiersin.org                                    3                                         August 2021 | Volume 12 | Article 708737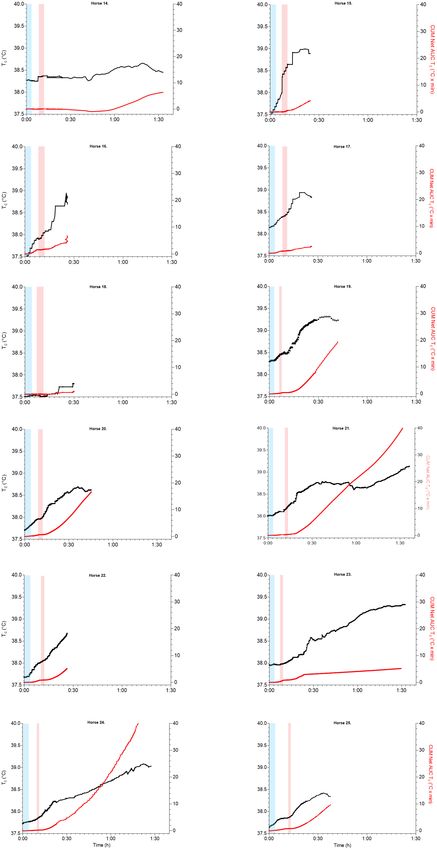
Frontiers in Physiology | www.frontiersin.org
Verdegaal et al.
TABLE 1 | Study population characteristics and its monitoring devices.
Horse Sex Age (y) Breed Body Total mass Coat Distance Horse Age start GI Pill GPS/HR BOM (◦ C; PCV (Hct), Blood Biochemistry Hematology
number mass (kg) incl rider color (km) experience (years) Y/N Y/N Ta ), min – lactate, gas (electrolytes,
(years) max TS, pH Y/N glucose) Y/N
Y/N
1 G 11 Arab 669 752 Gr 80 6 4 Y Y 13−26 Y Y Y N
2 G 9 Arab 484 587 B 80 2 7 Y Y 13−26 Y Y Y N
3 M 13 Arab 426 489 C 80 3 10 Y Y 6−19 Y Y Y N
4 M 7 QH × TB 470 573 C 100 1 6 Y Y 6−19 Y Y Y N
5 M 11 Arab 450 533 C 80 2 9 Y Y 6−19 Y Y Y N
6 M 8 Arab 370 453 Gr 100 4 4 Y Y 6−19 Y Y Y N
7 M 9 Arab 450 523 C 80 2 7 Y Nˆ 3−22 Y N Y** Y
8 G 11 Arab 470 553 Gr 80 1 9 Y Y 3−22 Y N Y** Y
9 G 7 QH 490 573 C 80 1 6 N Y 7−13 Y Y Y N
10 G 10 Arab × TB 484 587 C 80 5 5 N Y 7−13 Y Y Y N
11 G 5 Arab 458 541 B 40 0 5 N Y 7−13 Y Y Y N
12 G 7 Arab 525 608 B 80 NK NK N Y 3−22 Y N Y** Y
13 M 15 Arab 480 563 Gr 40 NK NK N Nˆˆ 3−22 Y N Y** Y
4
14 G 10 SB 484 − B 1.54 − − Y Y 5−13 Y N N N
15 G 5 SB 610 − B 1.54 − − Y Y 5−13 Y N N N
16 G 17 SB 482 − B 1.54 − − Y Y 5−13 Y N N N
17 G 5 SB 604 − B 1.54 − − Y Y 5−13 Y N N N
18 G 7 SB 554 − B 1.54 − − Y Y 3−18 Y N N N
19 G 11 SB 482 − B 1.54 − − Y Y 6−14 Y N N N
Thermoregulatory Response in Endurance and Trotter Horses
20 G 18 SB 480 − B 1.54 − − Y Y 6−14 Y N N N
21 G 6 SB 602 − B 1.54 − − Y Y 6−14 Y N N N
22 M 4 SB 508 − B 1.54 − − Y Y 14−20 Y N N N
23 G 11 SB 482 − B 1.54 − − Y Y 14−20 Y N N N
24 G 18 SB 480 − B 1.54 − − Y Y 14−20 Y N N N
August 2021 | Volume 12 | Article 708737
25 G 6 SB 602 − B 1.54 − − Y Y 14−20 Y N N N
Horse 1–13: 13 endurance horses: G (n = 7), M (n = 6). Arab include part Arabian horses, QH, quarterhorse; TB, thoroughbred, endurance exercise; Horse 14–25: 12 untrained trotters, all Standardbred (SB): G
(n = 12), fast trot exercise; G, gelding; M, mare. Gr, gray; C, chestnut; B, bay; The riders’ and horses’ performance history includes: age start, indicates age (years) when horse started competing; horse experience,
indicates number of years in competition (40 km or more); GI pill, gastrointestinal pill; GPS, global positioning system; HR, heartrate monitor (Polar); BOM (2020); Bureau of Meteorology, local stations closest to location
of exercise at varying km distance from the actual event in total 4 endurance locations and 1 trotter racetrack, distance ranged from 5.3 to 53 km; BOM stations were: Roseworthy 27.9 km distance from ride at Sandy
Creek; Rosedale station 5.3 km from ride at Tarlee; Meningie station 53 km from ride at Coorong; Nuriootpa station 28.8 km from ride at Sedan; Roseworthy station at 2.2 km from trotter racetrack; N, no; Y, yes; NK, not
known; ∧ indicates HR only; ∧∧ indicates second 40 km only; blood gas analysis included pH, pCO2 , pO2 , HCO3 − , base excess and lactate levels; **indicates biochemistry by VETSCAN (utilizes dry and liquid reagents);
TS, total solids; TP, total protein; AST, Aspartate amino transferase; CK, creatinine kinase.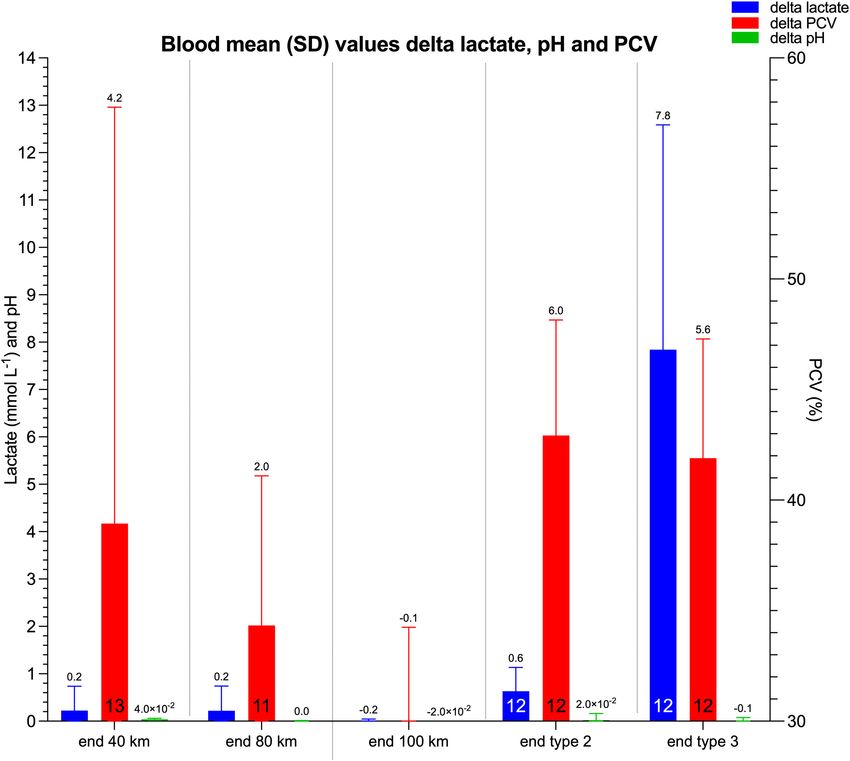
Verdegaal et al.                                                                                                Thermoregulatory Response in Endurance and Trotter Horses

                                                                                          Continuous Monitoring of GI
                                                                                          Temperature Over Time
                                                                                          All horses were equipped with monitoring equipment
                                                                                          (Table 1). The GI Tc representing the core temperature
                                                                                          was recorded continuously during exercise and recovery
                                                                                          using the ingestible telemetric GI pill (Jonah pill ; Phillips,    R

                                                                                          United States. The night before undertaking exercise, GI pills
                                                                                          were successfully administered to eight endurance horses and
                                                                                          12 trotters using nasogastric intubation as previously described
                                                                                          (Verdegaal et al., 2017). The timing of the GI pill administration
                                                                                          was random, unrelated to the horses’ feeding regime.
                                                                                             Temperature was recorded by an external receiver, Equivital                     R

                                                                                          Sensor Electronics Module (SEM, EQ02 Equivital data Logger ,                   R

                                                                                          Hidalgo, United Kingdom. The receiver was positioned in a
                                                                                          pocket of the Equivital Sensor Belt . This system was modified
                                                                                                                                       R

                                                                                          to accommodate a sturdy strap fitted closely around each horse’s
                                                                                          saddle girth (Figure 2). Equivital Tc data were recorded every
                                                                                          15 seconds and were uploaded from the SEM to the Equivital
                                                                                          Software Manager for data processing.
                                                                                                                   R

                                                                                          Monitoring of Distance, Speed,
                                                                                          Inclination, and Heartrate Over Time
  FIGURE 2 | Monitoring equipment: A modified Equivital belt for use on horses            Traveled distance, speed, and inclination of the course were
  with the external receiver device (Sensor Electronics Module) located inside of         recorded every second using a GPS monitor (Garmin Forerunner
  the belt at of the ventral part of the thorax to monitor the Tc by GI pill, while       910XT GPS watch ; Garmin Ltd., Schaffhausen, Switzerland)
                                                                                                                       R

  the Garmin GPS watch and the Polar heartrate electrodes were attached at                attached to the gullet of the saddle. The HR was continuously
  the upper part of the belt.
                                                                                          monitored telemetrically by the Garmin watch using Polar
                                                                                          electrodes (Polar Electro , Kempele, Finland) and recorded every
                                                                                                                               R

                                                                                          second (Parker et al., 2009). The GPS and HR data were uploaded
under solar radiation through farming land of varying terrain                             from the Garmin watch to the Garmin Connect and Garmin
with altitudes ranging from 4 to 462 m.                                                   Training Centre1 .
   Following each exercise loop of 40 km, endurance horses
were required to rest for 60 min according to AERA                                        Ambient Environment
riding rules (AERA, 2020) and were subsequently inspected                                 On each data collection day, ambient temperature (Ta ) was
by independent endurance veterinarians before competition                                 recorded continuously in a shaded area of the rest area (post-
could be continued. Following every exercise loop, blood                                  exercise) using a data logger device (Onset HOBO Pro V2
samples were collected. Subsequently, horses were cooled by                               logger temp U23-00 , Onset Computer Corporation, Bourne,
                                                                                                                           R

pouring buckets of water over their bodies and then scraping                              ME, United States). In addition, Ta data were obtained from the
it off. Horses were allowed to drink water and eat hay                                    Bureau of Meteorology as presented in Table 1.
ad libitum.
   The trotters were harnessed to a jogger and exercised under                            Blood Sampling and Analysis
full sunlight over a 770 m sand training track in South Australia                         Blood samples from endurance horses were analyzed using
(−34◦ 320 3.0800 S) during Australian winter months (June, July).                         portable equipment in the field and data are presented in Table 1.
The racetrack was harrowed and watered on a regular basis to                              Venous blood was collected (by SJ, E-LV, or LF) from the left
keep the track conditions as constant as possible. Trotters were                          jugular vein by needle and divided in two separate syringes within
subjected to three consecutive phases of exercise: slow warm-                             3 min after exercise. The first blood sample was collected in a
up phase (770 m at 25 km h−1 , not included in data analysis);                            3 ml syringe containing heparin and closed with an airtight seal
moderate warm-up phase: 1,540 m at a speed of 35 km h−1                                   for venous blood gas analysis using a portable blood gas analyzer
(9.7 m s−1 ); and the more intense fast trotter exercise: 1,540 m                         (EPOC, Epocal ; Ottawa, Canada; Averay et al., 2014; Kirsch
                                                                                                               R

at a speed of 42–50 km h−1 (11.7–13.9 m s−1 ; Figure 1). During                           et al., 2019). The second venous blood sample was collected in
the last phase, trotters were encouraged to exercise at their                             a 20 ml syringe and distributed into a lithium heparin blood tube
individual maximum speed. Post-exercise, blood samples were                               and a plain blood tube and stored on ice before samples were
collected followed by cooling with a water hose for approximately                         centrifuged at 3,000 g for 10 min (Hematocrit centrifuge 200 ;                 R

10 min and horses were allowed to drink water ad libitum. The                             Hettich Lab, Tuttlinger, Germany). In trotters, venous blood
Tc recovery period varied from 32 to 83 min depending on the
duration of the individual Tc recovery.                                                   1
                                                                                              https://connect.garmin.com/

Frontiers in Physiology | www.frontiersin.org                                         5                                            August 2021 | Volume 12 | Article 708737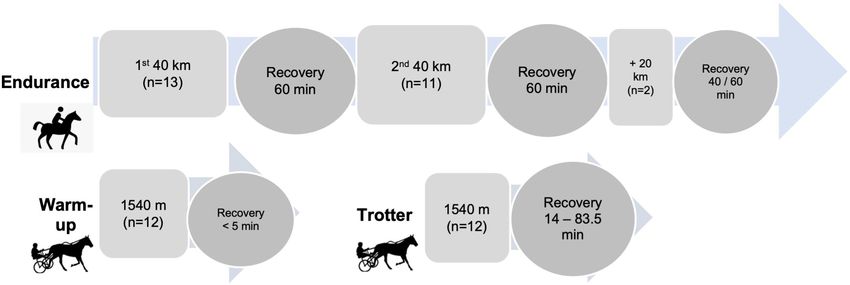
Verdegaal et al. Thermoregulatory Response in Endurance and Trotter Horses
TABLE 2 | Overall variables during exercise and recovery of endurance and trotter exercise.
Type exercise Endurance (n = 16 40 km) Trotter 2nd warm-up Trotter (n = 12 1,540 m)
(n = 12 1,540 m)
Duration (min) exercise 198 ± 63 (83–247; 40 km, 3.7 ± 0.4 2.9 ± 1.4. (1.5–6.1)
n = 25); Tc only: 191 ± 43
(n = 16)
Duration (min) recovery 60 4.9 ± 1.4 (2.6–7) 40.2 ± 30.2 (11.5–83)
Tc (◦ C) 38.5 ± 0.3 (38.2–39.0) 37.9 ± 0.3 (37.5–38.3) 38.1 ± 0.3 (37.5–38.5)
Max Tc (◦ C; during exercise or recovery) 39.0 ± 0.4 (38.5–39.9**) 38.0 ± 0.3** 38.8 ± 0.5 (37.6–39.3)**
Time to max Tc (min) 143 ± 60 (54 – 245, n = 15) NA** 34.3 ± 28.4 (6.5–79)**
Exercise distance (km) to max Tc 29.5 ± 11.6 (11–40, n = 15) NA NA
Max Tc ≥ 39◦ C 8/16 0 4/12
Max Tc ≥ 38.5◦ C All 0 5/12
Speed at max Tc (km h−1 ) 16.1 ± 4.3 (4.7–21) 22.5 ± 8.3 337.7 ± 10.0 (18.6–51.9)
HR at max Tc (bpm) 105 ± 29 (63–152) 135.1 ± 39.0 145 ± 36 (80–204)
Return Tc to 38.5◦ C 15/16 6/12 1/12 (and 1 Tc never above
38)
Time max Tc to 38.5◦ C (min) 21.2 ± 22.9 (0–80) NA NA
Return Tc to 38.3◦ C 13/16 2/12 1/12 (and 1 Tc never above
38)
Time max Tc to 38.3◦ C (min) 31 ± 24.6 (0 ->77; NA NA
n = 13/16)
Return Tc to 38.0◦ C 10/16 8/12 8/12 (1 Tc never above 38)
Time max Tc to 38.0◦ C (min) 39.6 ± 14 (n = 8/16) 0 (6//12; 2 Tc never above NA
38)
Return to base Tc (Y/N) 4/16 8/12 1//12 (and 1 Tc never
above 38)
Time max Tc to baseline (min) 52 ± 37 (n = 4/16) 0 (4/12); (1 Tc never above NA
baseline)
Net AUC Tc exercise (endurance: 2nd 7,116 ± 1,997 7.9 ± 11 4.8 ± 8.5
40 km from base Tc ) (7,203 ± 3,125)
Net AUC Tc exercise 1st 40 km 77,421 ± 1,940 NA NA
Net AUC Tc exercise 2nd 40 km 6,811 ± 2,138 NA NA
Net AUC Tc recovery −1,516 ± 1,326 (n = 15) 5.4 ± 6.8 1,821.3 ± 4,434.0
(−14.3–15,769)
Net AUC Tc recovery 1st 40 km −1,979 ± 1,555 (n = 7) NA NA
Net AUC Tc recovery 2nd 40 km −1,169 ± 1,102 (n = 8) NA NA
Delta Tc first 10 min recovery (◦ C) −0.24 ± 0.34 (−0.24–0.15, NA + 0.36 ± 0.16 (0–0.58;
n = 15) n = 11)
Net AUC min−1 (◦ C min−1 ) exercise 37.3 ± 9.9 2 ± 2.7 1.9 ± 3.7
Delta Tc end exercise to end recovery −0.71 ± 0.4 (−1.16–0.23) 0.1 ± 0.1 (0–0.2) 0.6 ± 0.4 (0–1.3)
Delta Tc end exercise to end recovery −0.01 ± 0.01 (−0.02–0.02) 0.02 0.04 ± 0.02 (0–0.06)
min−1
Time to HR ≤ 60 bpm (min) 6.3 ± 6.5 (0–24) 2.3 ± 1.2 (0.5–4) 23.1 ± 20.9 (5–51) 4/12
Tc > 39◦ C at end recovery 1/16 (39.13 after 90 min) NA 4/12
Net AUC min−1 (◦ C min−1 ) recovery −23.7 ± 20.4 (−55–13.8) 2.9 ± 3.3 54.5 ± 143.6
Speed (km h−1 ) 14.1 ± 1.7 (10.5 −17.4; 34.1 ± 3.5 (30.4–38.0; 38.2 ± 0.3 (38.0–38.8;
n = 22, without horse 7) n = 7) n = 7)
Max speed (km h−1 ) 23.4 ± 2.8 (19.2–30; 34.1 ± 7.3 (25.0–42.3; 49.7 ± 3.9 (42–52.7; n = 7)
n = 22) n = 7)
HR (bpm) 114 ± 13 (89 −143; n = 24) 130 ± 32 (75–177; n = 8) 151 ± 17 (130–169; n = 8)
H (kJ) total 80 km exercise# 71,000 ± 12,000 – –
(52,000–94,000; n = 22)
COT (ml O2 kg−1 m−1 )# 0.13 ± 0.01 (0.11–0.15; – –
n = 22)
V̇O2 (LO2 min−1 ) # 15.0 ± 2.3 (11.2–20.5; – –
n = 22)
Data are presented as overall mean ± SD. Tc , GI pill temperature; n, number identified only if different to 16 or 12 exercise periods; max Tc , maximum Tc ; AUC, area
under the curve; # indicates calculated; HR, heartrate; H, metabolic heat production; COT, cost of transfer; V̇O2 L min−1 , oxygen consumption in liters per min; *indicates
during exercise; **indicates during recovery; NA, not applicable; –indicates not available.
Frontiers in Physiology | www.frontiersin.org 6 August 2021 | Volume 12 | Article 708737Verdegaal et al. Thermoregulatory Response in Endurance and Trotter Horses
FIGURE 3 | Box and whisker plots demonstrating median (solid line), interquartile range (identified by rectangular area), and minimum to maximum (max) ranges of
data (whiskers or error bars) of boxplots of Tc (◦ C) in horses (H; horse number) in endurance (H1–H8) and trotter (H14–H25) exercise (A). Scatterplots with Tc (◦ C;
left y-axis) over time [duration of exercise in hours (h) and minutes (min)] (x-axis) in trotter horses (H14–25) and its mean (thick black line) ± SD (dotted black line,
calculated when n > 3 horses) during high intensity trotter exercise over time (B).
samples were collected from the left jugular vein by a vacutainer was measured using approximately 2 ml of blood and a pH
technique in lithium heparin tubes (presented in Table 1). meter (pH Cube ; TPS Pty Ltd, Brendale, Australia) with a
R
Hematocrit was determined with the microhematocrit pH calibration prior to every measurement by a voltage plot
method and plasma total solids via a refractometry meter against the specified pH value of the buffer solution followed by
[Refractometer, RHC-200 (ATC) ]. Plasma lactate concentration
R
introduction of the probe into the blood for approximately 30 s
was analyzed with a hand-held lactate analyzer (Accutrend to read the pH. The biochemistry profiles were analyzed using
Plus , Roche, United States). Blood pH recording in trotters
R
a blood gas analyzer EPOC [n = 9; sodium (Na+ ), potassium
R
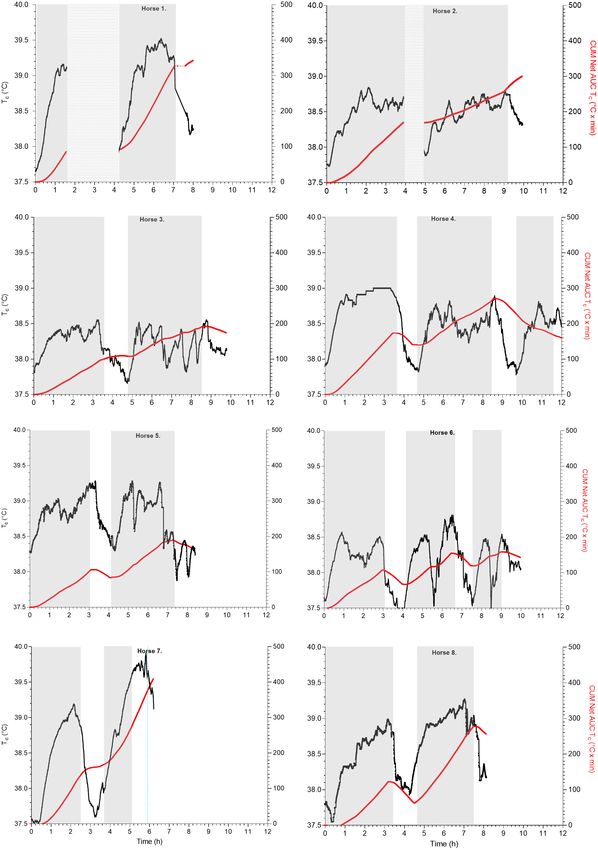
Frontiers in Physiology | www.frontiersin.org 7 August 2021 | Volume 12 | Article 708737Verdegaal et al. Thermoregulatory Response in Endurance and Trotter Horses FIGURE 4 | Scatterplots of Tc (◦ C; left y-axis, black line) and cumulated net AUC (Tc ◦ C × min; right y-axis, red line) over time (hours, h) during Tc exercise periods (identified as gray blocks) and recovery in endurance horses H1–8; H1 data loss at end of leg 1 and H1, H2 without Tc recording during the first recovery (identified as spotted blocks); H4, H6 continued to 100 km total. Frontiers in Physiology | www.frontiersin.org 8 August 2021 | Volume 12 | Article 708737
Verdegaal et al.                                                                                               Thermoregulatory Response in Endurance and Trotter Horses

  FIGURE 5 | Scatterplots of Tc (◦ C; left y-axis, black line) and cumulated net AUC (Tc , ◦ C × min; right y-axis, red line) over time (hours, h) during exercise and
  recovery in trotter horses H14–25, warm-up exercise (moderate intensity, identified as blue blocks), and trotter exercise (high intensity, identified as light-red blocks).

Frontiers in Physiology | www.frontiersin.org                                          9                                            August 2021 | Volume 12 | Article 708737
Verdegaal et al.                                                                                          Thermoregulatory Response in Endurance and Trotter Horses

  FIGURE 6 | Boxplot of the dynamic thermal response presented by net AUC Tc (◦ C × min) during Tc exercise period of endurance and trotter exercises (presented
  with mean net AUC on top bar). The 1st 40 km of endurance exercise was not significantly different to the 2nd 40 km. Net AUC Tc of exercise and recovery from full
  speed trotter exercise over 1,540 m was minor during exercise while Tc increased post-exercise as represented by positive net AUC Tc .

(K+ ), calcium (Ca2+ ), glucose] or a dry biochemistry analyzer                        baseline Tc and number of horses with hyperthermia. In addition,
(Vetscan VS2 ; Chemistry Analyzer, Abaxis, United States;
                   R
                                                                                       the delta Tc (◦ C change post-exercise) and the recovery time from
n = 4; Na+ , K+ , Ca2+ , glucose, creatinine, urea, aspartate amino                    max Tc to a HR of 60 bpm were calculated as per Australian
transferase, creatinine kinase). Hematology tests were performed                       regulations (AERA, 2020).
in four horses (VETSCAN HM5 Hematology Analyzer , Abaxis,            R
                                                                                           To quantify the Tc response, the net area under the Tc curve
United States). An overview of the blood analysis performed in                         (net AUC) was calculated for Tc and summated for the total
individual horses is presented in Table 1.                                             Tc exercise period and the total Tc recovery period (Horswill
                                                                                       et al., 2008; Datta et al., 2021). The net AUC (baseline set
                                                                                       at rest Tc ) was calculated using the trapezoidal method of Tc
Data Processing                                                                        over time (min) expressed as ◦ C × min. In this study, the
Each exercise period of 40 km (endurance) or 1,540 m (trotter)                         net AUC is summated to present the cumulative Tc – time
will be referred to throughout the study as the Tc exercise                            distribution (Datta et al., 2021). The net AUC provides an
period. Each recovery period (post-exercise) following 40 km                           estimate of the dynamic thermal response to thermal load.
(endurance) or 1,540 m (trotters) will be referred to as Tc recovery                   The thermal load takes into account exercise intensity, Ta
period. Recordings performed during each Tc period included                            including solar radiation, and environmental evaporative power
GI temperature (Tc ), speed, HR and post-exercise blood values.                        during exercise and recovery (IUPS Thermal Commission, 2001).
Hyperthermia was defined as Tc above 39◦ C based upon the                              Further processing of the recorded data included calculation
results of our previous study (Verdegaal et al., 2017) in which the                    of the metabolic heat production (H, kJ min−1 ; IUPS Thermal
mean maximum Tc was 38.9◦ C (95% CI, 38.8–38.9◦ C) at 6 min                            Commission, 2001) and the oxygen cost of transport (COT—the
post-exercise. A Tc time profile curve of the individual horse                         oxygen consumption necessary to travel 1 m) for each endurance
was constructed from the endurance exercise, warm-up exercise                          horse (Schroter and Marlin, 2002). Calculation of both H and
(trotters) and (fast) trotter exercise. This included assessment of                    COT provides a multi-perspective view on thermoregulatory
the value and time point of the maximum Tc (max Tc ) during the                        challenges represented by different types of exercise. The
Tc exercise or recovery period (40 km, total 80 km, or 1,540 m),                       following formula was used:
the HR and speed at max Tc , recovery time (min) from max Tc
to a Tc of 38.5, 38.3, and 38.0◦ C, respectively, and recovery to the                               H = V̇O2 × k × duration of exercise

Frontiers in Physiology | www.frontiersin.org                                     10                                         August 2021 | Volume 12 | Article 708737
Verdegaal et al. Thermoregulatory Response in Endurance and Trotter Horses
— in which V̇O2 represents the oxygen consumption rate activation of the GI pill in 5 of the 13 endurance horses. The
expressed in liters per min, k stands for heat liberated per GPS data were not recorded (only the HR) in 1 endurance
liter of oxygen consumed (5 kcal; 21 kJ; Hodgson et al., horse (horse 7) and in 1 trotter (horse 19) while HR was not
1993; McCutcheon and Geor, 2008) and duration of exercise is recorded in horse 21 (Table 1). Unphysiological and unrealistic
expressed in min. The rate at which oxygen is consumed in an values (artifacts) for Tc , GPS and HR (below 10 bpm and above
exercising horse provides a direct indication of its metabolic rate 220 bpm) were removed prior to analysis. The endurance horse
and subsequent heat production (Hodgson et al., 1993). In the group encompassed five mares and seven geldings of different
current study, V̇O2 was estimated by calculating the COT, speed breeds (although mainly Arabians) with an age of 9.5 ± 2.8 years
and body mass as follows: and body mass of 479 ± 68 kg (Table 1). The mean age of starting
endurance competitions was 6.1 ± 2.1 years with a mean of
V̇O2 = COT × speed × body mass 2.5 ± 1.9 years of experience in endurance ride competitions.
The Tc was recorded in eight horses over a total of 80 km
— in which COT is the oxygen cost of transport in ml oxygen Tc exercise separated in loops of 40 km and associated Tc
per kg body mass per m (ml O2 kg−1 m−1 ), speed is expressed in recovery periods of 60 min. The Equivital belt became dislodged
m min−1 and body mass in kg. in horse 1 during the first loop causing data loss at the end
The COT is calculated based on an incline, decline, or flat of a 40 km loop. As a result, the belt underwent additional
terrain using the following equation (Schroter and Marlin, 2002): modification for the subsequent recordings by fitting sturdy
straps sandwiched into the belt to stabilize the girth position.
Uphill incline and flat terrain : The Tc was not recorded during recovery following the first loop
COT = 0.123 + 1.561 gradient in horses 1 and 2 due to premature removal of the belt by the
Downhill terrain decline : owners. The group of 12 trotter horses included 1 mare and
11 geldings with an age of 9.8 ± 5.3 years and body mass of
COT = 0.123 + 1.591 gradient +
2 3 537 ± 60 kg (Table 1).
9.762 gradient + 14.0 gradient .
The gradient of the terrain was recorded as meters incline or Ambient Environment
decline indicated by the GPS device. The overall H per 40 km On all occasions, the Ta was relatively cool: mean minimum
Tc exercise period was calculated by cumulating the H and 6.7 ± 0.4◦ C, mean maximum 18.4 ± 2.9◦ C (Table 1). More
presented as cumulated H. specifically, the Ta on the four separate days of endurance
exercise showed a minimum Ta of 13.4, 6.3, 2.8, 6.6◦ C, and
Statistical Analysis maximum Ta of 26.3, 19.0, 22.0, 18.8◦ C, respectively (HOBO
All data are presented as mean ± SD (range). Comparison and data). The Ta recorded by Bureau of Meteorology stations
correlation analyses were performed using IBM SPSS Statistics at varying distances from the event location are presented in
26.0 software or using GraphPad Prism version 9.1.2 for MacOS, Table 1.
GraphPad Software, San Diego, CA, United States2 . The net
AUC (◦ C × min) and max Tc (◦ C) between the first and
second 40 km exercise loops were compared using a paired
Individual GI Temperature, Heartrate and
t-test and a general linear model ANOVA approach which Speed Data During Endurance and
included horse ID as a random variable. The mean max Tc was Trotter Exercise Over Time
than compared between endurance and trotter exercise using The individual Tc parameters and descriptive analysis of Tc
an independent samples t-test. The correlation between time to are presented in Supplementary Tables 1, 3. The descriptive
HR ≤ 60 bpm (dependent) and the Tc (◦ C) at end of exercise analysis of speed, HR, H, and COT (endurance only) and
(independent) was assessed by a scatterplot and analyzed using a duration of exercise of individual horses is presented in
regression model. Blood values were compared using a one-way Supplementary Table 2.
ANOVA post hoc Tukey’s test. Statistical significance was set at
α < 0.05.
Overall Tc Profiles During Endurance
Exercise
RESULTS The overall mean speed of endurance horses was
14.0 ± 1.4 km h−1 over the first 40 km (n = 11) and
All horses completed their exercise trial without any adverse 14.2 ± 2.1 km h−1 over the second 40 km (n = 11) with a
events. No horses were withdrawn by owners. The owner of mean HR of 114 ± 13 bpm (Supplementary Tables 1, 2). There
horse 13 erroneously removed the GPS equipment during the was no significant correlation between end Tc of the first 40 km
first 40 km. The GI pills were administered successfully to all endurance exercise loop and recovery time to HR ≤ 60 bpm
horses resulting in complete Tc recordings. Unfortunately, an and (p = 0.646) but the end Tc at the second 40 km showed
exceptional event of a malfunctioning batch of GI pills prevented a significant correlation with HR recovery (p = 0.045). The
cumulated H of the total 80 km was 120,000 ± 18,000 kJ. The
2
www.graphpad.com Tc profiles of endurance horses during exercise and recovery
Frontiers in Physiology | www.frontiersin.org 11 August 2021 | Volume 12 | Article 708737Verdegaal et al. Thermoregulatory Response in Endurance and Trotter Horses
FIGURE 7 | Bar graph of blood parameters: lactate and pH on the y-axis presented as mmol L−1 and the number, respectively, and the PCV (Hct) on the right y-axis
presented as %. The type of exercise is presented on the x-axis as pre-, and post-ride in endurance and trotter exercises. The mean value is presented on top of the
bar while sample size at the bottom in column.
are presented in Table 2, Figures 3A, 4, and Supplementary Overall Tc Profiles During Endurance
Tables 1, 2. Recovery
The mean max Tc , absolute max Tc , and net AUC of the first
Post-exercise, only 25% of all Tc recovery periods returned to
40 km exercise were not significantly different from the second their base Tc while 50% decreased to or lower than 38◦ C within
40 km exercise [F 1 ,7 = 2.436, p = 0.163 (for max Tc ), p = 0.66 39.6 ± 14 min. The time that Tc returned to 38.5◦ C varied
(for max absolute Tc ), and p = 0.56 (for net AUC), respectively; between 0 and 57 min (14/15 Tc recovery periods). Horse 7
Figures 3A, 6]. Mean duration of all 40 km Tc endurance exercise showed a different exercise Tc time profile with an end of
was 191 ± 43 min. The mean max Tc during exercise was exercise Tc of 39.4◦ C while the max Tc (39.9◦ C) occurred at
39.0 ± 0.4◦ C and time to max Tc was 143 ± 60 min at a mean 57 min post-exercise (Figure 4). The dynamic thermal response
distance of 29.5 ± 11.6 km. Hyperthermia was recorded in 50% during Tc recovery period demonstrated a heat loss by a negative
of the Tc exercise periods. The total dynamic thermal response value (−18.1 ± 25.9◦ C × min) and a large variation amongst
(net AUC, Tc ◦ C × min) was 106.4 ± 44.3◦ C × min per 40 km individuals (range 23.7–59.7◦ C × min) with a net AUC min−1
and was approximately 0.5◦ C per min (Figure 6). −0.3 ± 0.4◦ C.
Frontiers in Physiology | www.frontiersin.org 12 August 2021 | Volume 12 | Article 708737Verdegaal et al. Thermoregulatory Response in Endurance and Trotter Horses
Overall Tc Profiles During Moderate An ANOVA revealed a significant difference in post-exercise
Warm-Up Trotter Exercise and Recovery delta lactate value between endurance (1.2 ± 0.6 mmol L−1 )
and trotter (9.4 ± 4.0 mmol L−1 ) as well as between warm-
The Tc profiles of trotter horses during exercise and recovery are
up trotter (1.6 ± 1.0 mmol L−1 ) and fast trotter exercise with
presented in Table 2, Figures 3, 5, Supplementary Tables 1, 2.
a higher lactate value in the last exercise [F (2 ,38) = 37.63,
The mean speed of the trotters during 1,540 m distance trotter
p < 0.0001]. No significant difference was identified between
exercise was 27.3 ± 5.3 km h−1 with a mean HR of 140 ± 24 bpm
first and second 40 km endurance exercise (p = 0.984), however,
(Supplementary Table 2). The Tc profile of trotter moderate
comparing both first and second 40 km endurance horses to
exercise revealed a minor Tc increase and a minor dynamic
trotter horses separately confirmed a highly significant difference
thermal response during exercise and during recovery.
(p < 0.001). In addition, mean delta lactate in the 40 km
endurance exercise was significantly different to trotter exercise
Overall Tc Profiles During Trotter using an independent samples t-test (p < 0.001).
Exercise The delta Hct and delta pH values did not reveal significant
The mean speed of the trotters during 1,540 m distance trotter differences between endurance and trotter exercise (p = 0.60 and
exercise was 40.0 ± 2.9 km h−1 with a mean HR of 147 ± 17 bpm p = 0.26, respectively).
(Supplementary Table 2).
Overall Tc Profiles During Trotter DISCUSSION
Recovery
Post-exercise, HR recovered to 60 bpm in 5 of the 12 trotters and This is the first study to be conducted using a telemetric GI pill
was coupled with a Tc lower than 39.0◦ C in all those trotters. The in field competitions to compare the equine thermoregulatory
Tc profile of trotters reached their mean max Tc of 38.8 ± 0.5◦ C response to different types of exercise under normal weather
during recovery within a mean time of 40.2 ± 30.2 min. conditions during the cooler South Australian months. For this
The overall increase in mean Tc (delta) varied (0.5 ± 0.5◦ C). purpose, a large dataset of Tc recordings and other physiological
Hyperthermia occurred in more than 40% of the trotters. Indeed, responses was analyzed and compared between two types of
four trotters still had a Tc higher than 39◦ C at the end of recovery, exercise that differed greatly in duration and intensity (endurance
mean time of 68.6 ± 24.6 min duration. Only one Tc returned to compared with trotter exercise). As a result, an integrative real
38◦ C baseline during recovery. The Tc profiles of trotter horses time view was obtained on how the equine body copes with heat
during exercise and recovery are presented in Table 2, Figures 3, load production during different types of exercise in the field.
5, and Supplementary Table 1. The dynamic thermal response The GI pill proved to be a reliable tool to continuously monitor
was low during trotter exercise with a mean of 0.2 ± 0.4◦ C. individual thermoregulatory well-being in sport horses.
However, thermoregulation in trotters occurred during recovery There was an important difference in the time profile of
with a mean dynamic thermal response of 18.6 ± 22.1◦ C × min the thermoregulatory response between endurance and trotter
with a wide range (Figure 6) and 0.5 ± 0.3◦ C net AUC min−1 horses. Endurance horses reached their mean max Tc during
duration of recovery (Supplementary Table 3). exercise toward the end of each leg of 40 km (after ± 30 km)
and almost all returned to a Tc lower than 38.5◦ C during
Comparison of the Tc Profiles During 60 min into recovery. Trotter horses, however, always reached
their mean max Tc post-exercise at least 30 min into recovery.
Endurance and Trotter Exercise Moreover, in a third of the trotters, Tc was still higher
The mean overall values of all data during the two different types than 39◦ C and HR was higher than 60 bpm at the end
of exercise are presented in Supplementary Table 1. The max of recovery. When HR is at 60 bpm, horses may still have
Tc in endurance exercise did not significantly differ from max a high Tc (38.8 ± 0.4◦ C, range 38.0–39.7◦ C). Continuous
Tc in trotter exercise (p = 0.19). In addition, the max Tc and monitoring of Tc by a telemetric temperature-sensitive pill
absolute max Tc of the first 40 km and second 40 km endurance that passes through the GI tract has been evaluated in
exercise loops did not significantly differ from trotter exercise horses previously during rest and 158 km transport using
when analyzed separately using an independent sample t-test the CorTemp system (Green et al., 2005, 2008). While the
R
(p = 0.49 and p = 0.26, respectively). Equivital system was validated in our previous study similarly
After 60 min recovery, hyperthermia persisted in only one during rest periods (Verdegaal et al., 2017), we applied this
endurance horse performing endurance exercise. This is in monitoring method in equine athletes specifically for the first
contrast to trotter exercise during which hyperthermia occurred time during field exercise.
during recovery in 5 of the 12 trotters. The current study showed that the dynamic thermal response
calculated by the net AUC proved to be a more useful
Blood Analysis Data in Endurance and presentation of the metabolic response rate than the calculated
Trotter Exercise H (based on calculated values). Despite the individual variation
Blood results and the delta of lactate, pH, and Hct values of of the max Tc in endurance and trotter horses, it is of interest that
all horses (endurance and trotter exercise) are presented in the overall max Tc in endurance horses (39.0 ± 0.4◦ C; range 38.5–
Figure 7, Supplementary Table 3, and Supplementary Figure 1. 39.9◦ C) was not significantly different to the max Tc in trotters
Frontiers in Physiology | www.frontiersin.org 13 August 2021 | Volume 12 | Article 708737Verdegaal et al. Thermoregulatory Response in Endurance and Trotter Horses
(38.8 ± 0.5◦ C; range 37.6–39.3◦ C). Another important finding Comparison of the Tc Profiles During
was that persisting hyperthermia was recorded in four trotters Endurance and Trotter Exercise
after a mean of 69 min post-exercise while only one endurance
The results of the current study are important for formulation of
horse recorded 39.9◦ C after 60 min of recovery.
future competition and hot weather policies (MOOC endurance,
Most importantly, the current study has demonstrated
2021; MOOC heat illness, 2021). The study results show that
that horses show important individual differences in their
both endurance and trotter horses reached comparable max Tc ,
thermoregulatory response to different types of exercise. This
although at different time points. Endurance horses reached their
result was obtained due to the continuous monitoring of
mean max Tc (39.0 ± 0.3◦ C, 38.5–39.5◦ C) during endurance
the Tc instead of performing serial measurements of Tre .
exercise toward the end of each leg of 40 km (after ± 30 km)
For example, there was a large variation (range 11–40 km)
and almost all Tc returned to lower than 38.5◦ C during 60 min
between endurance horses with respect to the distance at which
into recovery. In contrast, after the completion of trotter exercise,
max Tc was reached. It is noted that while the moment-
trotter horses reached their max Tc (38.8 ± 0.5◦ C, 37.6–39.3◦ C)
to-moment location of the GI pill is unknown, based on a
at an average of 34 min post-exercise with a mean Tc increase
previously performed study we can state that Tc changes are
of 0.6 ± 0.4◦ C (0–1.3◦ C). Moreover, in a third of the trotters,
mainly attributed to exercise and less likely to the movement
Tc was still higher than 39◦ C and HR was higher than 60 bpm
of the GI pill along the GI tract (Verdegaal et al., 2017).
at the end of recovery. We found that within the 60-min
Both the individual variation in max Tc and dynamic thermal
rest time, all endurance horses achieved an overall recovery
response underline that individual continuous Tc monitoring
to 38.5◦ C in 15 out of 16 Tc 40 km exercise periods, and
is essential for reliable oversight. This reliability is especially
50% of these horses reached lower than 38◦ C. This supports
important since many horse-specific factors contribute to the
the mandatory rest periods of 60 min as determined in the
thermoregulatory response, such as the genetic make-up of a
AERA and FEI endurance regulations when exercising in a cool
horse, its temperament and its basic performance capacity level.
environment (FEI, 2018; AERA, 2020). The present study was
However, for endurance horses, their performance capacity levels
not able to demonstrate a correlation between the end Tc first
should have been quite similar for all studied horses, keeping in
40 km and recovery time to HR of 60 bpm but the end Tc
mind their similar competition experience levels for the 80 km
second 40 km was related to HR recovery. According to the
distance (Table 1).
AERA competition regulations, horses with a HR of 60 bpm at
the end of their recovery period would meet all criteria to be
Continuous Individual Monitoring labeled as “fit to continue” the competition while interestingly,
Studies of the Thermoregulatory we found the mean overall 40 km Tc was still higher than
normal (38.8 ± 0.4◦ C; range 38.0–39.7◦ C). This means that at
Response to Date the time that the HR recovered to 60 bpm, most horses were
Based on recent equine and human studies, it is important
still actively coping with increased core body temperature. FEI
to review different tools that allow for continuous reliable
regulations are stricter than AERA rules regarding the duration
monitoring of the thermoregulatory response to exercise in the
of the HR recovery time and require the HR to return below
field with a minimal data loss. In that respect, the GI pill has
64 bpm within 15 min post-exercise (FEI, 2021). Our study
proven to be a practical, accurate, and precise tool to monitor
demonstrated that in the majority of Tc periods (20 out of 22,
thermal response during field exercise both in human and equine
Tc 40 km exercise periods) the HR recovered to below 64 bpm
athletes (Edwards and Clark, 2006; Verdegaal et al., 2017; Olcina
within 15 min but again, the mean Tc was still 38.7 ± 0.4◦ C
et al., 2019).
(range 38.0–39.6◦ C; FEI, 2021). The HR recovery regulations in
A recent alternative method is the use of intra-muscular
endurance horses are based on studies demonstrating that not
microchips embedded in different locations to continuously
only increased speed and distance but also a longer than 11–
record muscle temperature (Kang et al., 2020). Although
13 min cardiac recovery time is associated with higher risk of
the study was performed under laboratory conditions, this
metabolic elimination after endurance exercise, more specifically
technique could eventually be employed in the field. There
with a 70% probability of elimination at the next veterinary
was a positive correlation between muscle temperature and
check (Nagy et al., 2010; Younes et al., 2015; Bennet and Parkin,
central venous temperature (CVT) only when combining all
2018). More field research is needed to investigate when heat
exercise phases including recovery. Interestingly during the
accumulation in such horses can become problematic during
recovery phase, the muscle temperature continued increasing
follow-up exercise. The difference in thermoregulatory responses
and lagged behind the CVT. This non-alignment is in
between endurance exercise and racing exercise is well-known
accordance with previous studies reporting on the lack of direct
and the current study provides exercise-specific core thermal
correlation between muscle temperature and core temperature
response features which need to be addressed when formulating
(Byrd et al., 1989; McCutcheon et al., 1992; Hodgson et al.,
future equine competition and hot weather policies.
1994). Therefore, more research is needed to obtain a better
understanding of the associations between muscle temperature
and core body temperature. One possible disadvantage of Hyperthermia Post-exercise
the technique is the requirement of invasive surgery to Overall, 50% of the endurance horses developed hyperthermia
place the microchip. during the standardized exercise loops, which underlines the
Frontiers in Physiology | www.frontiersin.org 14 August 2021 | Volume 12 | Article 708737Verdegaal et al. Thermoregulatory Response in Endurance and Trotter Horses
importance of an effective Tc recovery period of sufficient and Mizzi, 2020, 2021). The current findings also underline that
duration. The persistence of hyperthermia in exercising the habit of withholding water prior to racing events is not
endurance horses is one of the several factors causing metabolic an ideal practice. Indeed, several studies involving endurance
disorders and fatigue due to the decreased supply of blood or trotter horses report that dehydration and electrolyte loss
and fuel to the exercising muscles, brain and GI tract, and are significant predictors for early elimination due to metabolic
increased muscle and brain temperature (McCutcheon et al., reasons (Barton et al., 2003; Fielding et al., 2009; Barnes
1992; Hodgson et al., 1993; Jones and Carlson, 1995; Geor and et al., 2010; Munoz et al., 2010; Trigo et al., 2010; Waller and
McCutcheon, 1998; Gonzalez-Alonso et al., 1999; McConaghy Lindinger, 2010). Likewise, a recent meta-analysis in human
et al., 2002; Gerard et al., 2013; Brownlow et al., 2016; Brownlow athletes demonstrated the importance of fluid ingestion to
and Mizzi, 2021). counteract hyperthermia and to improve performance capacity
While hyperthermia and heat stress are more commonly (Alhadad et al., 2019). In our study, no fluid intake restrictions
associated with prolonged exercise, we have demonstrated that were applied and blood values showed that the studied horses
horses performing short bouts of strenuous exercise in the field were not dehydrated.
may suffer increasing from hyperthermia during recovery (1/3 of As in endurance horses, the recovery for trotters to HR
the trotters, Figures 3B, 5 and Supplementary Table 1). 60 bpm was not associated with a recovered Tc . This is important
Hyperthermia in racehorses post-exercise can be explained knowledge for the monitoring of trotters during recovery when
by the greater amount of metabolic heat generated by their using HR as guidance. At a HR of 60 bpm point in time, the mean
larger muscle mass (compared to endurance horses) during Tc was still 38.7 ± 0.5◦ C (range 38.0–39.3◦ C) while 8/12 trotters
their shorter exercise duration but higher intensity exercise still measured a Tc higher than 38.5◦ C. A post-exercise peak Tre
(Hodgson et al., 1994; Geor et al., 1995; Jones and Carlson, was earlier reported in a few other studies (Hodgson et al., 1993;
1995; Schott et al., 1999). In addition, the high intensity Kohn and Hinchcliff, 1995; Marlin et al., 1996, 1998; Kohn et al.,
trotter exercise represents a short but acutely pronounced 1999; Foreman et al., 2006; Verdegaal et al., 2017) and supports
challenge to a multitude of organ systems at the same time the conclusion that it is necessary to continue monitoring
such as the respiratory, cardiovascular, musculoskeletal and racehorses during recovery. Based on our findings and coupled
sympathetic nervous systems, of which the latter may be one with those reported by previous studies, continuous monitoring
of the driving forces behind the hyperthermia (Hetem et al., of racehorses and sport horses for hyperthermia using the GI pill
2013). The “acuteness” may also explain the hyperthermia or Tre during a period of rest for at least 60 min post-exercise is
that was encountered in more trotter horses compared to highly recommended.
endurance horses as well as the more significant interindividual
variation seen at the level of the thermoregulatory response
in trotter horses. Finally, the current study results underline The Dynamic Thermal Response (Net
the importance for formulating guidelines for the management AUC Tc )
and welfare of all equine sports disciplines. These physiological The continuous Tc monitoring allowed for the construction
factors, coupled with environmental factors in the field, can of detailed temperature-time profiles and the subsequent
overwhelm the capacity of the heat loss mechanisms of sport application of the AUC approach. The present study measured
horses. It is important to point out that there is no scientific net AUC Tc to assess the dynamic thermal response to the
evidence to date suggesting that horses experience heat injury metabolic thermal load, a product of the thermoregulatory
when their Tc reaches and is sustained at 39◦ C. However, it mechanisms that increase temperature over time (Hodgson et al.,
should be kept in mind that if horses, and especially trotters, 1993; Schroter and Marlin, 1995; Schott et al., 1999; Hodgson,
engage in a subsequent exercise bout too soon, their core body 2014). As expected, our study demonstrated that the mean
temperatures would be starting at an elevated level. dynamic thermal response was much higher during endurance
In most trotters (7/12), the first signs toward lowering exercise compared to trotters due to higher H over time. The
and normalizing core body temperature became visible after a core thermal response during recovery in endurance horses
minimum of 20 min into the recovery. Problems may arise when was negative due to metabolic heat dissipation. Alternatively
the hyperthermia in racehorses (with or without clinical signs) in trotters, both heat load and heat loss mechanisms were in
is not recognized. The delayed onset of hyperthermia may go place during recovery, represented by a relatively high dynamic
unnoticed when trotters are transported shortly after completion thermal response compared to the short duration of the exercise.
of the race. Hyperthermia coupled with transport during hot The thermal response index using area under the fever curve
weather is likely to increase heat loading. The identification of has been applied in several mammal studies comparing the fever
ongoing hyperthermia during recovery is essential information response over time (Feng and Lipton, 1987; Murakami and Ono,
with respect to equine welfare and emphasizes the need for 1987). Only a few equine research groups report the use of
extended continuous monitoring post-exercise. Our findings may AUC to assess temperature response over time. One equine study
explain personal anecdotal evidence expressed by trotter trainers used AUC to demonstrate changes in muscle and tendon tissue
noticing that some horses show discomfort the day after an temperature over time during therapeutic ultrasound treatments
otherwise uneventful competition day (Courouce et al., 2002; at different tissue depths (Montgomery et al., 2013). Studies
Richard et al., 2010; Bertuglia et al., 2014) due to unrecognized involving human athletes have used AUC to compare AUC
post-racing hyperthermia (McConaghy et al., 2002; Brownlow temperature response in two study groups. One study used AUC
Frontiers in Physiology | www.frontiersin.org 15 August 2021 | Volume 12 | Article 708737You can also read