Megafaunal Ecology of the Western Clarion Clipperton Zone
←
→
Page content transcription
If your browser does not render page correctly, please read the page content below
ORIGINAL RESEARCH
                                                                                                                                               published: 01 July 2021
                                                                                                                                     doi: 10.3389/fmars.2021.671062

                                            Megafaunal Ecology of the Western
                                            Clarion Clipperton Zone
                                            Jennifer M. Durden 1,2* , Meagan Putts 2 , Sarah Bingo 2 , Astrid B. Leitner 2,3 ,
                                            Jeffrey C. Drazen 2 , Andrew J. Gooday 1,4 , Daniel O. B. Jones 1 , Andrew K. Sweetman 5 ,
                                            Travis W. Washburn 2 and Craig R. Smith 2
                                            1
                                              National Oceanography Centre, Southampton, United Kingdom, 2 Department of Oceanography, University of Hawai‘i
                                            at Mānoa, Honolulu, HI, United States, 3 Monterey Bay Aquarium Research Institute, Moss Landing, CA, United States, 4 Life
                                            Science Department, Natural History Museum, London, United Kingdom, 5 The Lyell Centre for Earth and Marine Science,
                                            Heriot-Watt University, Edinburgh, United Kingdom

                                            The Clarion Clipperton Zone (CCZ) is a vast area of the central Pacific Ocean where
                                            the abyssal seabed is a focus for future polymetallic nodule mining. Broad-scale
                                            environmental gradients occur east-to-west across the CCZ seabed, including organic
                                            matter supply and nodule abundance, factors that influence benthic faunal community
                                            structure and function. A network of protected areas across the CCZ, called Areas of
                                            Particular Environmental Interest (APEIs), has been designated to cover this variation.
                           Edited by:
                                            Most previous studies of the benthic environment and megafaunal communities have
                      Pedro A. Ribeiro,     focussed on the eastern CCZ, leaving the impact of these large-scale gradients
         University of Bergen, Norway
                                            unexamined and the network design untested. Seamounts are a further source of
                         Reviewed by:
                                            heterogeneity in the region. We examined the benthic megafaunal ecology of three
                        Lenaick Menot,
  Institut Français de Recherche pour       APEIs in the western CCZ, spanning a range of environmental conditions. We used
   l’Exploitation de la Mer (IFREMER),      a combination of seabed photography and direct sampling to assess the environment
                                France
              Akkur Vasudevan Raman,
                                            and megafauna on the soft sediment habitats on the abyssal plain in three APEIs, and
                Andhra University, India    seamounts in two of those APEIs. We found that environmental conditions on abyssal
                  *Correspondence:          plains differed between the three APEIs in terms of water depth, nodule abundance
                   Jennifer M. Durden
                                            and coverage, sediment particle size distribution, and estimated organic matter flux.
     jennifer.durden@noc.soton.ac.uk
                                            Megafauna were low density and high diversity, with few common morphotypes
                 Specialty section:         between sites and many morphotypes being observed only once. Xenophyophores
       This article was submitted to
                                            dominated the assemblages. The density and diversity of invertebrates were greater at
Deep-Sea Environments and Ecology,
             a section of the journal       the sites with lower organic matter inputs and greater nodule abundance. Seamounts
         Frontiers in Marine Science        in the same APEIs were nodule-free and had coarser sediments than on the plain.
        Received: 22 February 2021          Invertebrate megafaunal diversity was lower on the seamounts than on the plains,
           Accepted: 24 May 2021
           Published: 01 July 2021
                                            and most morphotypes recorded on the seamounts were only found on seamounts.
                             Citation:
                                            Low morphotype overlap also suggests little connectivity between APEIs, and between
       Durden JM, Putts M, Bingo S,         seamounts and adjacent abyssal plains. Our results provide the first evaluation of the
  Leitner AB, Drazen JC, Gooday AJ,
                                            seabed habitats and megafaunal ecology in the western CCZ, highlighting environmental
          Jones DOB, Sweetman AK,
  Washburn TW and Smith CR (2021)           gradients that influence benthic communities, and are important for evaluating the
  Megafaunal Ecology of the Western         design of the network of protected areas.
             Clarion Clipperton Zone.
           Front. Mar. Sci. 8:671062.       Keywords: seamount, beta-diversity, polymetallic nodule, seabed mining, abyssal plain, Area of Particular
    doi: 10.3389/fmars.2021.671062          Environmental Interest, Marine Protected Area, regional environmental management

Frontiers in Marine Science | www.frontiersin.org                                  1                                              July 2021 | Volume 8 | Article 671062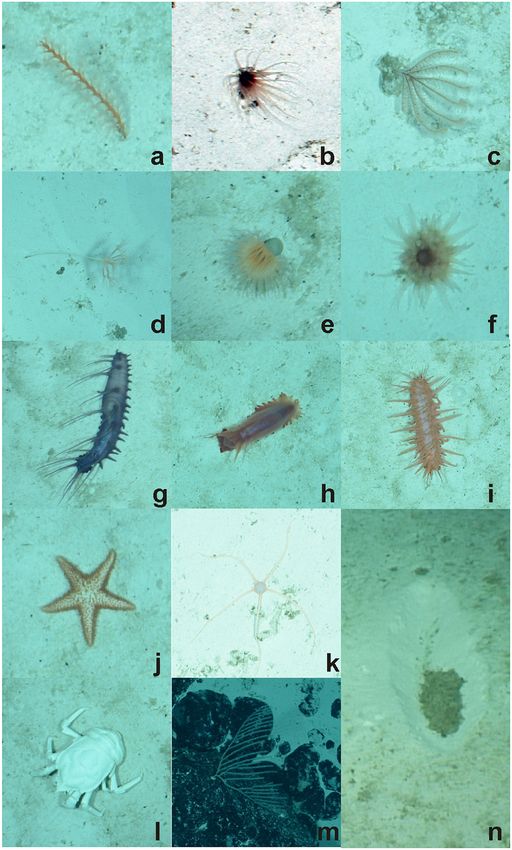
Durden et al.                                                                                            Western Clarion Clipperton Zone Megafauna

INTRODUCTION                                                                fine material and exposing hard substrate. Most studies on
                                                                            the megafauna of seamounts in relation to substrate focus on
The abyssal seabed of the Clarion Clipperton Zone (CCZ) covers              the availability of hard substrate, with little examination of
6 million km2 of the central Pacific Ocean and has become a focus           soft sediment habitats. However, studies of smaller elevated
for future deep-sea polymetallic nodule mining (Lodge et al.,               features, such as knolls and abyssal hills, show that even subtle
2014). Large-scale gradients of environmental conditions occur              differences in elevation produce changes in soft sediments that
across the CCZ, in east-to-west and north-to-south directions               have a large influence on megafaunal community diversity,
(Smith and Demopoulos, 2003; Wedding et al., 2013; Washburn                 standing stocks and assemblage composition (Durden et al.,
et al., 2021a). These environmental conditions include the seabed           2015, 2020b; Turnewitsch et al., 2015; Milligan et al., 2016;
substrate and the organic matter supply to the benthos, factors             Leitner et al., 2017).
that influence the abundance, diversity, community composition                 The governance of future polymetallic nodule mining by
and ecosystem function of deep-sea benthic faunal communities               the International Seabed Authority (ISA) has included the
(Smith et al., 1997, 2008, 2009; Ruhl and Smith, 2004; Ruhl et al.,         development of a spatial environmental management plan (the
2008; Lacharité and Metaxas, 2017; Simon-Lledó et al., 2020).               “Regional Environmental Management Plain”) for the CCZ,
Across the CCZ, polymetallic nodule abundance and organic                   which designated areas to be protected from seabed mining.
matter flux are generally higher in the east than in the west,              A network of these “Areas of Particular Environmental Interest”
and the abyssal seabed is deeper to the west (Wedding et al.,               (APEIs) was designed to represent the environmental gradients
2013; Washburn et al., 2021a). The majority of studies of the               across the CCZ (Wedding et al., 2013; Lodge et al., 2014).
CCZ, particularly in the last decade, have focused on the eastern           In addition, the APEIs were originally intended (Wedding
portion. Several of these studies highlight the high diversity              et al., 2013) to represent similar habitats to those found
of benthic megafauna, a faunal group important to ecosystem                 in areas designated for mining. However, there has been
function (Smith et al., 2008), of the eastern CCZ (e.g., Amon               very limited study of seafloor communities within APEIs;
et al., 2016, 2017; Vanreusel et al., 2016; Gooday et al., 2017a,b,c,       only small portions of some APEIs have been studied,
2018a; Leitner et al., 2017; Simon-Lledó et al., 2019a; Cuvelier            leaving in question the extent to which this objective has
et al., 2020; Harbour et al., 2020; Jones et al., in review). The           been met. The APEIs in the western CCZ were located
influence of substrate locally on the benthos in areas of the               to span areas of high to low predicted nodule abundance,
eastern CCZ was evident in these studies, particularly that of              and moderate to low seabed organic matter supply. Recent
soft sediment texture, and nodule presence and size (Vanreusel              studies have investigated APEIs in the eastern CCZ (Vanreusel
et al., 2016; Simon-Lledó et al., 2019b). However, peer-reviewed            et al., 2016; Simon-Lledó et al., 2019a; Jones et al., in
studies on the benthic megafauna to the west remain few, even               review), but none have yet been conducted in the APEIs in
when those conducted outside the CCZ are included (e.g., Smith              the western CCZ.
et al., 1997; Simon-Lledó et al., 2019c), or are focused on a                  Here, we report on the benthic megafaunal ecology of
single taxonomic or functional group (e.g., Leitner et al., 2017,           the abyssal plains in three APEIs in the western CCZ and
2020a; Gooday et al., 2020a,b). Thus, our understanding of the              examine the results in a regional context. We hypothesise
roles of environmental conditions in influencing megafaunal                 that environmental conditions differ in the three abyssal plain
community structure and function, and their variation across the            areas, in terms of physical habitat (bathymetry, sediment
CCZ, is incomplete.                                                         conditions and nodule characteristics), in addition to
    Bathymetric features are a source of heterogeneity in the               known differences in resource (organic matter) inputs.
seabed environment. Features providing positive elevation above             We aim to determine whether standing stocks, diversity
the seabed, such as seamounts, are common on abyssal plains                 and assemblage structure of the invertebrate megafauna
and specifically in the far western and eastern areas of the                and highly mobile scavengers/predators differ across the
CCZ (Yesson et al., 2011; Wedding et al., 2013; Harris et al.,              region in response to these environmental gradients. We
2014; Washburn et al., 2021a). Large variations in seabed                   compare soft sedimented habitats on seamounts adjacent
environmental conditions found on seamounts, particularly                   to these abyssal sites, and examine differences from the
those related to substrate and organic matter availability,                 abyssal plain in both the sedimentary environment and
influence the benthic communities present (Fock et al., 2002;               faunal assemblages. We test these hypotheses using seabed
Piepenburg and Muller, 2004; Samadi et al., 2007; Clark et al.,             photography and direct sampling of the sedimentary
2009; McClain et al., 2009; Bo et al., 2011; Williams et al.,               environment. We then use these data to comment on potential
2011, 2015; Boschen et al., 2015; Rogers, 2018; Morgan et al.,              relationships between habitat heterogeneity and megafaunal
2019; Cuvelier et al., 2020; Jones et al., in review). Current              assemblages in terms of regional variation (beta-diversity)
speeds are enhanced and directions altered around seamounts                 across the western CCZ, and the potential for connectivity
(Genin et al., 1986), resulting in enhancements to suspended                within and between habitats. Finally, we set these data in
particle flux and locally deposited organic matter (Kiriakoulakis           the contexts of regional variation across the whole CCZ,
et al., 2009; Vilas et al., 2009). Because seamount summits are             and conditions in nearby mining exploration areas, and
shallower than the surrounding abyssal plain, the POC flux                  comment on the suitability of these APEIs as part of regional
to the seabed may also be higher (Lutz et al., 2007). The                   environmental management of polymetallic nodule mining and
enhanced currents can also alter the substrate texture, winnowing           conservation in the CCZ.

Frontiers in Marine Science | www.frontiersin.org                       2                                      July 2021 | Volume 8 | Article 671062
Durden et al.                                                                                           Western Clarion Clipperton Zone Megafauna

MATERIALS AND METHODS                                                    shutter. Parallel lasers at a separation of 350 mm were used for
                                                                         scaling in the imagery.
Field Site Selection                                                        Seafloor photos were examined if they met the following
Field operations in the western CCZ were conducted from the              criteria: captured at camera altitudes up to 3 m above the
RV Kilo Moana between May 14 and June 16, 2018, as part of the           seabed; ROV pitch and roll between −5 and 5 degrees; no
DeepCCZ project, which included assessment of the benthic and            overlap between photos; no obscuration (e.g., by large shadows
benthopelagic environments and communities across an range               or suspended sediment). The selected photos were cropped
of size classes from microbes to megafauna as well as ecosystem          to 3,000 × 6,000 pixels to remove obscuration from ROV
function (Drazen et al., 2019). Operations for this study were           equipment in the image, and colour-corrected to approximate
conducted using the remotely operated vehicle (ROV) Lu’ukai.             true-to-life colour in a well-lit environment. Annotations of
   Field sites were selected in each of the three APEIs in the           photos was completed using the Monterey Bay Aquarium
western CCZ (APEIs 1, 4, and 7), and included a location                 Research Institute’s Video and Annotation Referencing System
on the abyssal plain in each, and a location on a proximate              (Schlining and Stout, 2006).
seamount in APEIs 4 and 7 (Figure 1). Practical constraints
precluded the examination of a seamount in APEI-1 for this               Assessment of Environmental
study. Similar site locations were selected across the APEIs based       Characteristics
on several criteria: (1) Site locations were selected to be within       Four aspects of the benthic environment were examined: seabed
the CCZ. (2) Central location within the APEI was preferred,             bathymetry, estimated organic matter flux at the seabed, nodule
with locations in the APEI perimeter “buffer zone” (as described         abundance and sediment particle size. Seabed bathymetry was
by Wedding et al., 2013) avoided, if possible. In order to meet          measured using a ship-borne multibeam echosounder (12 kHz
the other criteria in APEI 1, the study site was located in the          Simrad EM120, Kongsberg Maritime), with a swath width of
southern buffer zone. (3) Predicted high nodule abundance on             12–14 km. Measured bathymetry was processed onboard using
the abyssal plain based on geological modelling (International           Qimera software (Quality Positioning Services), gridded at 100
Seabed Authority, 2010; Wedding et al., 2013) was preferred, so          m, with a correction for the sound velocity profile applied.
that abyssal plain sites would be comparable to those in areas           Organic matter flux to the abyssal seabed was estimated as
to be mined. (4) The presence of a suitable seamount with an             particulate organic matter (POC) flux for the study sites by
area of abyssal plain outside the presumed zone of seamount              Leitner et al. (2020a) based on a model by Lutz et al. (2007).
influence was required. The zone of influence was estimated              POC flux to the seamount summits was not estimated because
to extend outwards from the seamount base for 15 km, based               the coarse bathymetric model used by Lutz et al. (2007)
on a maximum influence of 30 km from the summit for very                 to estimate of seafloor POC flux does not reliably capture
large seamounts with shallow summit depths (Gove et al., 2016).          seamount summit depth.
(5) Suitable seamounts each had a summit rising a minimum                    The density, seabed cover, and individual sizes of nodules
of 1,000 m above the abyssal plain estimated from satellite              were assessed in a randomly selected subset of 1090 seabed
bathymetry (SRMT30+), with a “flat” area likely containing               photographs (Table 1). A single annotator enumerated and
soft sediment near the top. Similar summit water depths and              measured all nodules in the central portion of each image in the
geomorphologies between seamounts were preferred, confirmed              subset (2,000 × 1,500 pixels; representing ∼0.92 m2 seabed), a
with shipboard multibeam.                                                size selected for the practicality of annotating images with high
                                                                         densities of nodules.
Photo Capture and Processing                                                 Sediment was collected in pushcores (70 mm internal
Seabed images were captured for the assessment of both the               diameter) deployed by the ROV at locations near the seabed
seabed environment and the megafaunal community (Table 1).               photograph transects (Table 1). Particle size distributions were
ROV transects were undertaken at a randomly selected heading             determined by laser diffraction using a Malvern Mastersizer
within the range of headings allowed by environmental                    on the refrigerated collected sediment (0–50 mm horizon)
conditions (surface winds and currents, bottom currents) and             suspended in reverse osmosis water (i.e., without digestion),
topography, with the aim of minimising suspended sediment                following the removal of any nodules. Particle size distributions
from obscuring collected imagery and facilitating reasonable ship        were divided into three size ranges for analysis, to divide the
movement. Seabed transects at each location were planned to be           major modes in the distributions: fine particles (174 µ m).
altitude of 2.62 m above bottom. Still images were captured at
10-s intervals with a downward-facing Ocean Imaging Systems              Megafaunal Community Assessment
DSC 24000 digital camera system mounted to the front of the              Megafauna (generally > 10 mm in dimension, sensu Grassle
Lu’ukai ROV (Nikon 7100 camera set to aperture F8, shutter               et al., 1975) were enumerated in the photos and classified
speed 1/60, focal distance 8.5 feet, images 4,000 × 6,000 pixels).       to the most detailed taxonomic level possible based on
Dedicated lighting was provided by two Ocean Imaging Systems             previously published studies of megafauna in the CCZ
300 W-S remote head strobes synchronised to the camera                   (Figures 2, 3; Simon-Lledó et al., 2019a,b,c; Cuvelier et al., 2020;

Frontiers in Marine Science | www.frontiersin.org                    3                                        July 2021 | Volume 8 | Article 671062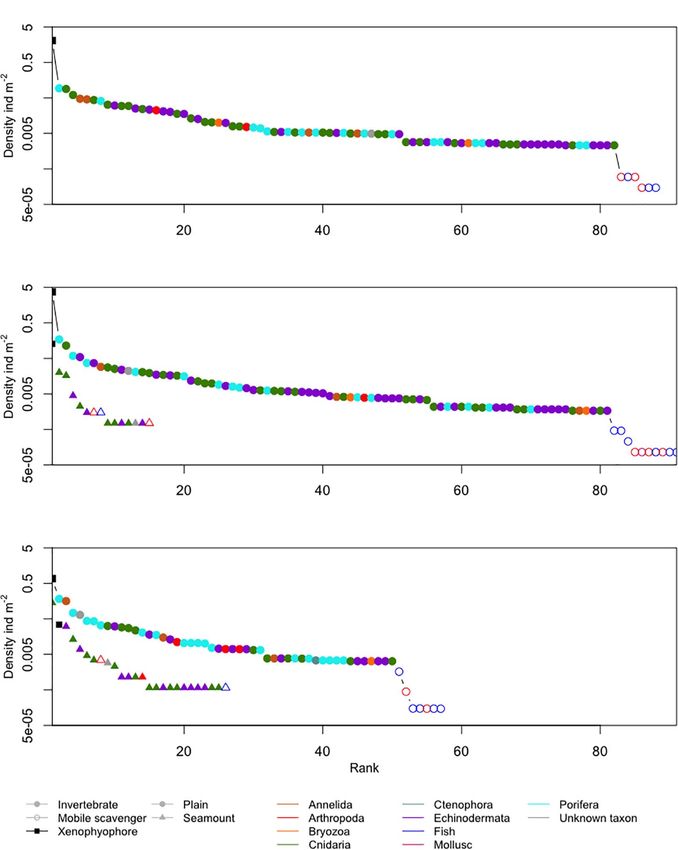
Durden et al.                                                                                            Western Clarion Clipperton Zone Megafauna

  FIGURE 1 | Maps of the region (A), and of the study areas in (B) APEI-1, (C) APEI-4, and (D) APEI-7.

Frontiers in Marine Science | www.frontiersin.org                                 4                            July 2021 | Volume 8 | Article 671062
Durden et al.                                                                                                            Western Clarion Clipperton Zone Megafauna

TABLE 1 | Sediment coring and photographic transect information for the study sites in the western CCZ. Four sample units were created of 73 photos for nodule
coverage and 312 photos for megafauna on the abyssal plain; on the seamounts, those sample unit sizes could not be achieved (indicated by *).

                                                                                       Abyssal plain                                          Seamount

Location                                                              APEI-1               APEI-4               APEI-7               APEI-4               APEI-7

Centre latitude (◦ )                                                  11.252                6.994                5.058                7.267                4.889
Centre longitude (◦ )                                               −153.604             −149.935             −141.827             −149.777              −141.753
Water depth (m)                                                    5,198–5,251          4,999–5,039          4,855–4,873          3,538–3,570          3,095–3,247
Seabed photos for megafaunal assessment                                1,250                1,706                1,347                 233                  325
Seabed area photographed for megafaunal assessment (m2 )               6,767                9,529                7,277                1,341                1,739
Seabed photos for nodule assessment                                     310                  368                  295                  51                   66
No. photo sample units                                                   4                    5                    4                   1*                   1*
No. nodules measured                                                  10,117                2,862                  0                    0                    0
Sediment cores                                                           3                    4                    3                    1                    1

Kahn et al., 2020). A six-digit alphanumeric code was assigned                       in seabed images (Gooday et al., 2020a), and new genera
to each morphotype. Highly mobile scavengers and predators,                          and species have been identified from specimens collected at
and monothalamous Foraminifera (Xenophyophoroidea)                                   these sites (Gooday et al., 2020b). The maximum diameter
were treated separately from the remaining “invertebrate                             of a subset of 8750 specimens were measured in randomly
megafauna” (see below), and additional investigations were                           selected images.
made of key taxonomic groups (i.e., echinoderms, porifera                                Highly mobile scavengers and predators of interest consisted
and cnidarians).                                                                     of highly mobile benthopelagic morphotypes, including all
    Prepared seabed photos (3,000 × 6,000 pixels) were randomly                      fishes, shrimp-like arthropods and octopus. Individuals of
assigned to two experts for megafaunal annotation. In addition                       these morphotypes were enumerated in seabed photographs
to randomising the collections and order of images annotated                         (as described above), and classified based on (Drazen et al.,
by each expert, the following steps were taken to reduce                             in review). These morphotypes were treated separately to
annotator bias: (1) Prior to annotation of the main photo set,                       facilitate comparisons with other studies, since many megafaunal
a subset of images was annotated by both experts, and their                          assessments omit these taxa, while studies using bait, including
detections and classifications of megafauna in this “training”                       those from the wider DeepCCZ project, focus on them (Leitner
image set were discussed. These annotation data were removed                         et al., 2020a; Drazen et al., in review).
and the images returned to the image pool. (2) Subsets of
photos were randomly selected for repeated annotation for
assessment and reduction of both inter- and intra-annotator                          Statistical Comparisons Between APEIs
bias in detection and classification of specimens. (3) Following                     Statistical comparisons of conditions on the abyssal plain
annotation, all identified specimens were reviewed by a single                       were made between APEIs by creating sample units from
expert on a morphotype basis, and reclassified where necessary                       the set of pooled photos across all transects in an APEI.
to ensure consistency. Annotated counts are provided in                              For statistical comparisons of nodule parameters, annotation
Supplementary Material 1.                                                            data from the abyssal plain locations were aggregated into
    Individual body size (mm) was measured in each specimen in                       a minimum of four sample units of 73 randomly selected
the images. Taxon-specific measurements (Durden et al., 2016a)                       photographs each, the maximum sample unit size for the
were made for morphotypes with at least four individuals at                          smallest nodule image set per APEI (Table 1; 295 photographs
each of a minimum of two sites. Fresh wet weight biomass                             for nodule assessment at APEI-7). Mean fine, medium and
was estimated for echinoderms (Holothuroidea, Crinoidea,                             coarse sediment content was computed across cores collected
Ophiuroidea, Asteroidea, and Echinoidea) from these measured                         from a site. For statistical comparisons of density, diversity,
dimensions in the seabed photographs and established length-to-                      echinoderm biomass, and community composition, annotation
wet weight relationships (Durden et al., 2016a). In the case of                      data from the abyssal plain locations were aggregated into
echinoids, fresh wet weight was estimated based on a spherical                       a minimum of four sample units of 312 randomly selected
test volume of measured diameter, with an estimated tissue                           photographs, the maximum sample unit size for the smallest
volume of 25% of test volume (Ebert, 2013) converted to fresh                        image set per APEI (Table 1; 1250 seabed photos for megafaunal
mass, assuming a density of 1 g cm−3 , a method similar to that                      assessment at APEI-1). Comparisons of individual body size
employed by Durden et al. (2019).                                                    were conducted on a specimen basis. Although the limited
    Megafaunal xenophyophores were enumerated in the seabed                          photography and sampling on seamounts precluded statistical
photographs (as described above), with identification based on                       comparisons, all photographs captured at each seamount were
published literature on xenophyophores from the CCZ (Gooday                          aggregated into a single unit to facilitate computation of
et al., 2017a,b,c, 2018a,b). New morphotypes have been observed                      ecological metrics.

Frontiers in Marine Science | www.frontiersin.org                                5                                             July 2021 | Volume 8 | Article 671062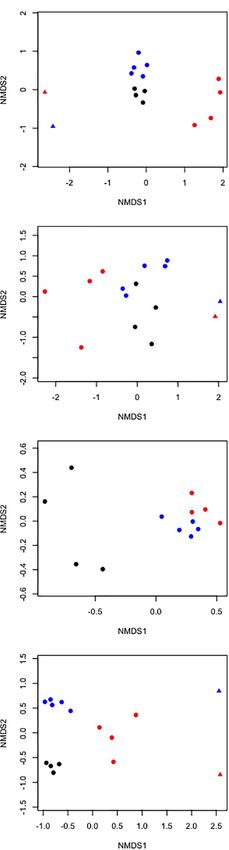
Durden et al. Western Clarion Clipperton Zone Megafauna
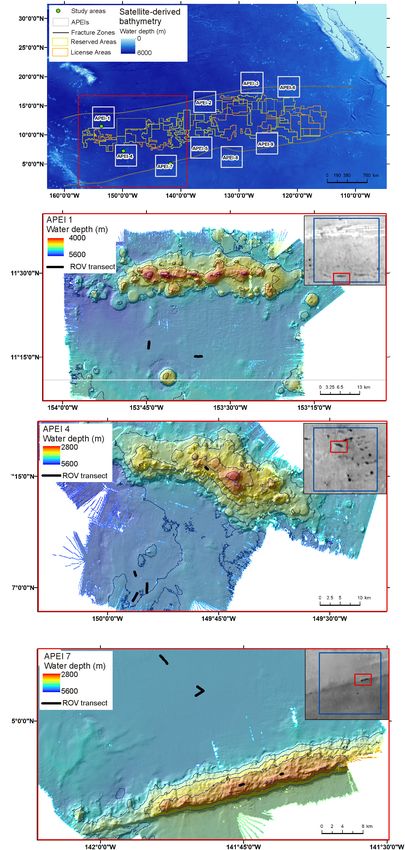
FIGURE 2 | Continued
(f) Hyalonema sp. POR030 with Actiniaria ACT042, (g) Caulophacus sp.
HEX027 and nodules, (h) Acanthascus sp. HEX029, (i) Euplectella sp.
HEX019 with Isopoda, (j) Placopegma sp. HEX005, (k) Cladorhizidae
DES012, (l) Docosaccus sp. HEX015, (m) Euplectellinae sp. HEX011,
(n) Chondrocladia (Symmetrocladia) cf. lyra DES014; Holothuroidea
(o) Galatheathuria sp. HOL038, (p) Benthodytes sp. HOL042,
(r) Psychropotes cf dyscrita HOL047, (s) Synallactidae HOL007; Asteroidea
(t) Dytaster sp. AST005, (u) Brisingida AST001; (v) Pentametrocrinidae
CRI002; Echinoidea (w) Kamptosoma sp. URC013; (x) Ophiuroidea OPH010.
Image attribution: JM Durden & CR Smith, University of Hawai‘i.
Nodule and faunal abundance, and echinoderm biomass were
standardised to unit seabed area. Univariate Hill’s diversity
indices (Nq), morphotype richness (q = 0), exponential of
the Shannon index (q = 1), and the inverse of the Simpson’s
index (q = 2; Magurran, 2013) were computed along with
the rarefied number of morphotypes (Hurlbert, 1971) at the
minimum number of individuals in any sampling unit (65).
Environmental and univariate ecological metrics on the abyssal
plains were compared between APEIs using ANOVA, with
significance reported at α = 0.05 and post hoc testing using
Tukey’s honest significant difference. Normality was tested by
visual inspection of normal quantile plots, and the Shapiro-Wilk
normality test. Percentage data were arcsine transformed before
assessment. Accumulation curves were computed for median
values of density and diversity indices over aggregated images,
repeated 500 times.
Differences in apparent assemblage composition were assessed
using multivariate statistics (Bray-Curtis dissimilarity measure
and 2-dimensional non-metric multidimensional scaling
ordination), with the sample unit-like groupings of photographic
data on the seamounts included in multidimensional analyses for
illustration. Statistical comparisons between the community data
on the abyssal plains were tested using ANOSIM and SIMPER
routines (Clarke, 1993). All ecological metrics were calculated
using the vegan package in R (Oksanen et al., 2012).
RESULTS
Environmental Characteristics
Abyssal Plains
The study sites were located in the three westernmost APEIs in
the CCZ (Figure 1), with APEI-1 being the most northerly and
westerly, and APEI-7 being the most easterly and southerly of the
three. In APEI-1, the study site was located in the centre-south
portion of the APEI, in a position between an elongated (“ridge-
like”) seamount to the north and a conical seamount to the south.
In APEI-4, the study site was in centre-north portion of the APEI,
and in APEI-7, the study site was in the northeast portion of the
FIGURE 2 | Select invertebrate megafaunal specimens photographed on the
APEI. Seabed water depth across the region increased from east
abyssal plain in study areas of the western CCZ, with identifications and to west (Table 2), though the bathymetry between the APEI study
morphotype codes: (a) Umbellula sp. PEN003, (b) Isididae ALC005, (c) sites is largely unknown, as these were the first seabed mapping
actiniarian ACT022 with large xenophyophore and Paleodictyon trace to top exercises in these APEIs and large deviations from satellite-
right; (d) Bryozoa BRY002; Ctenophora (e) Lyrocteis sp. CTE010; Porifera
derived bathymetry were observed (e.g., presence or absence
(Continued)
of large seamounts in contrast to anticipated bathymetry). The
Frontiers in Marine Science | www.frontiersin.org 6 July 2021 | Volume 8 | Article 671062Durden et al. Western Clarion Clipperton Zone Megafauna
different in the areas studied in each APEI [F(2, 10) = 187.3,
p < 0.001], and significantly higher in APEI-1 than in APEI-
4 study sites. Mean nodule size (plan area; mm2 ) measured in
seabed photographs was significantly larger in the study sites
in APEI-1 than in APEI-4 [F(1, 12977) = 734.4, p < 0.0001].
The observed nodule occurrence was patchy, with areas without
nodules observed at APEIs 1 and 4, and nodule densities ranging
over two orders of magnitude at APEI-1 (Figure 4).
Sediments (excluding nodules) were dark brown in colour
(Figure 2 and Supplementary Material 2) from the sediment
surface to the full depth collected (∼150–200 mm), except in
some cores collected at APEI-4, where a colour change to lighter-
brown sediment was observed at approximately 100 mm core
depth (Supplementary Material 2). Particle size distributions
had two main peaks (Figure 4), the greatest at 80 µm (in the
intermediate size range) and a lesser peak at 8 µm (in the fine
size range). The fraction of fine sediments on the plain differed
between the APEIs [Table 2; F(2, 7) = 16.8, p < 0.01], as was the
fraction of intermediate-sized particles [F(2, 7) = 12.4, p < 0.01],
and the coarse sediments [F(2, 7) = 14.1, p < 0.01]. Sediments
at APEI-1 had the highest fine particle content and the smallest
fraction of intermediate-sized particles, those at APEI-4 had the
greatest proportion of intermediate-sized particles, and those at
APEI-7 had the least fine particle content (Figure 4).
In summary, a gradient of environmental conditions was
observed across the three locations. At the most northwesterly
location (APEI-1), the water depth of the abyssal plain was
deepest, estimated POC flux was lowest, nodule density and
cover were highest, nodules were largest, and sediment grains
were finest. APEI-4 exhibited intermediate conditions, including
lower nodule density and cover, and smaller nodules. In APEI-7,
the seabed water depth was shallowest, estimated POC flux was
greatest, nodules were absent, and sediment grains were coarsest.
Seamounts
FIGURE 3 | Select invertebrate megafaunal specimens photographed on the Both seamounts were ridge features with similar
seamount study areas in the western CCZ: Cnidaria (a) Protoptilum sp.
PEN017, (b) Cerianthidae CER001, (c) Heteropathes cf. americana ALC021,
geomorphologies (Figure 1), in contrast to conical features
(d) Umbellula sp. PEN012 with ripples in sediment, (e) Actiniaria ACT043, also found in the APEIs. The seamount summit in APEI-4
(f) Actiniaria ACT012; Holothuroidea: (g) Laetmogone sp. HOL030, was at 2,800 m water depth, and was deeper at the seamount
(h) Peniagone sp. HOL064, (i) Deimatidae HOL060; (j) Asteroidea AST024; in APEI-7, at 2,936 m (1,452 and 1,744 m above the abyssal
(k) Ophiuroidea OPH012; (l) Galatheoidea DEC007, (m) Actiniaria ACT011 on
plain, respectively).
basalt-type hard substrate, (n) large depression in soft sediment (∼0.5 × 1.5
m). Image attribution: JM Durden and CR Smith, University of Hawai‘i.
The benthic environments at the seamount sites differed
substantially from those of the plain. Both were in areas of soft
sediment near the ridge of the seamount, with areas of basalt-
like hard substrate nearby. No nodules were present. Seamount
seabed on the abyssal plain observed during seabed transects was sediments were a globigerina ooze of white calcareous planktonic
“flattest” at APEI-7 (elevation difference of 18 m), while elevation foraminifera (Supplementary Material 3), with ripples evident.
differences at least double that (40 and 53 m) were found at APEIs Particle size distributions on the seamounts were different
4 and 1, respectively (Table 1). Estimated POC flux at the abyssal from those on the plain. They were dominated by very coarse
seabed decreased from southeast to northwest across the western particles, with a peak at 480 µm in both APEIs (Table 2 and
CCZ (Table 2). Figure 4). Lesser peaks in particle size distributions occurred at
Sedimentary conditions differed between the areas studied in approximately 120 and 11 µ m.
the APEIs (Table 2 and Figure 4). Nodule density (number m−2 ) The environments at the two seamount sites also differed from
was significantly different between the APEI study sites [ANOVA one another. The site on the seamount at APEI-4 was 439 m
F(2, 10) = 141.9, p < 0.001]. The nodule density observed in deeper than the site on the seamount at APEI-7 (Table 2). The
APEI-1 was four times that in APEI-4, while no nodules were former was relatively flat (32 m elevation difference; Table 1),
observed in APEI-7. Seabed cover by nodules was significantly while the latter was sloping (152 m elevation difference), with
Frontiers in Marine Science | www.frontiersin.org 7 July 2021 | Volume 8 | Article 671062Durden et al. Western Clarion Clipperton Zone Megafauna
TABLE 2 | Environmental characteristics of the study areas by APEI and habitat type.
Abyssal plain Seamount
Location APEI-1 APEI-4 APEI-7 APEI-4 APEI-7
Mean seabed water depth (m) 5,222 5,013 4,866 3,561 3,122
Estimated seafloor POC flux* (gCorg m−2 y−1 ) 1.1 1.4 1.8 Not estimated Not estimated
Mean [95% confidence interval] fine (174 µm) sediment content (%) 0.7 [0.4, 1.1] 1.3 [1.0, 1.6] 2.5 [1.8, 3.2] 45.8 44.6
Median nodule size (plan area; mm2 ) 744 226 NA NA NA
Mean [95% confidence interval] nodule density (counts m−2 ) 34.6 [30.0, 39.1] 8.2 [5.8, 10.5] 0 0 0
Mean [95% confidence interval] seabed nodule cover (%) 3.3 [2.9, 3.8] 0.4 [0.3, 0.5] 0 0 0
*Estimated particulate organic matter flux from Leitner et al. (2020a) and Washburn et al. (2021a) based on Lutz et al. (2007). The numbers and sizes of photo sample
units or cores are given in Table 1.
clumps of phytodetritus visible, and large depressions in the The metazoan invertebrate composition by density was
sediment (Figure 3). Sediments on the seamount in APEI-4 significantly different between the APEI study areas (Figure 7;
were somewhat coarser than those on the seamount in APEI- ANOSIM R = 1, p < 0.001). Morphotypes contributing most
7 (Table 2). to the dissimilarity between APEIs 1 and 4 were Umbellula
sp. (PEN003) (8%) and unclassifiable Porifera (POR000) (6%),
Abyssal Plain between APEIs 4 and 7 were Umbellula sp. (PEN003) (11%) and
Metazoan Invertebrates Echiura (ANN020) (8%) and, and between APEIs 1 and 7 were
Density Echiura (ANN020) (6%) and an actiniarian (ACT022) (5%).
Total invertebrate megafaunal density was significantly different
Individual Body Size
between the areas studied in the APEIs [ANOVA F(2, 10) = 13.7,
Individual body size of a sponge, Docosaccus sp. (HEX015), was
p < 0.01; Table 3]. These differences were driven by significantly
significantly different between APEIs [ANOVA F(2, 18) = 5.9,
lower density at APEI-7 than at APEIs-1 and 4 (both
p < 0.05; Supplementary Material 4]. TukeyHSD post hoc test
p < 0.01; Tukey’s HSD).
indicated that body size was significantly greater at APEI-1 than
Diversity 7. Individual body size of an antipatharian, Abyssopathes lyra
A total of 126 morphotypes were detected at the abyssal plain (ANT002), was significantly greater at APEI-1 than at APEI-4
sites. Similar numbers of morphotypes were found at APEIs 1 [F(1, 16) = 6.8, p < 0.05]. The individual body sizes of other
and 4 (81 and 80, respectively), while only 49 were found at morphotypes were not significantly different between sites.
APEI-7. Only about one sixth of all morphotypes (22) were
found in all study areas (Figure 5). Many taxa were rare, with Echinoderms
34 morphotypes were only detected once. These morphotypes The density of echinoderms was significantly different between
were spread across many taxonomic groups (e.g., Porifera, the APEI study areas [ANOVA F(2, 10) = 21.9, p < 0.001;
Holothuroidea, Asteroidea). APEIs 1 and 4 shared more than 3 Table 3], with the density at APEI-7 study site significantly lower
times as many morphotypes as APEIs 4 and 7. Morphotypes from than at APEIs 1 and 4 (both p < 0.01; TukeyHSD). Echinoderm
across all taxonomic groups were identified that were only found biomass was not significantly different between APEIs, but mean
at each APEI study area. echinoderm biomass at APEI-4 was approximately twice that of
Diversity as represented by the Hill numbers was significantly the other APEIs.
different between APEIs [N0 : ANOVA F(2, 10) = 12.1, p < 0.01; A total of 47 echinoderm morphotypes were observed on
N1 : F(2, 10) = 22.1, p < 0.001; N2 : F(2, 10) = 27.5, p < 0.0001; the abyssal plain. The number of morphotypes observed was
Table 3]. For all Hill numbers, APEI-7 was significantly lower significantly different between APEIs [ANOVA F(2, 10) = 11.48,
than APEIs-1 and 4 (all p < 0.05; Tukey’s HSD). Rarefied p < 0.01], with the number at APEI-7 being significantly
morphotype richness (EM65 ) was also significantly different lower from the other APEIs (both p < 0.01; TukeyHSD).
between APEIs [F(2, 10) = 9.6, p < 0.01], driven by significantly Two echinoderm morphotypes were shared between all APEIs
higher richness in the areas studied at APEI-1 than at APEI-7 (Galatheathuria sp. HOL038 and Unclassified holothurians
(p < 0.01; Tukey’s HSD). HOL000), while 8 were unique to APEI-1, 13 were unique to
APEI-4, and 5 were unique to APEI-7. Holothurians dominated
Assemblage Composition the echinoderms observed at the abyssal plain sites (Figure 6
The metazoan invertebrate assemblage was dominated by and Table 4), contributing 39% to echinoderm density, across 21
cnidarians (42% of individuals) and echinoderms (22%) in the morphotypes, approximately double the density of the next most
study area at APEI-1 (Figure 6 and Table 4), and by poriferans common group (echinoids).
(35% and 50% of individuals) at APEIs 4 and 7, with the next The echinoderm assemblage composition by density was
phylum being cnidarians (32%) and annelids (13%), respectively. significantly different between the APEIs (ANOSIM R = 0.84,
Frontiers in Marine Science | www.frontiersin.org 8 July 2021 | Volume 8 | Article 671062Durden et al. Western Clarion Clipperton Zone Megafauna
was also significantly different between the APEIs (ANOSIM
R = 0.43, p < 0.01). Morphotypes contributing most to this
dissimilarity between the APEIs were all large holothurians,
with Galatheathuria sp. HOL 038 contributing significantly in
all comparisons. Differences in assemblage by biomass between
APEIs 1 and 4 were principally driven by Psychropotes cf dyscrita
HOL 047 (SIMPER 37%) and Galatheathuria sp. HOL 038 (15%),
differences between APEIs 4 and 7 driven by P. dyscrita HOL 047
(34%) and Galatheathuria sp. HOL 038 (26%), and differences
between APEIs 1 and 7 driven by Galatheathuria sp. HOL 038
(26%) and Benthodytes sp. HOL 042 (21%).
Porifera
The density of sponges was significantly different between APEIs
[ANOVA F(2, 10) = 26.9, p < 0.0001]. The lowest density of
sponges was observed at APEI-1, where it was less than half the
densities observed at APEIs 4 and 7.
The number of sponge morphotypes observed was
significantly different between APEIs [F(2, 10) = 4.2, p < 0.05],
with the highest number observed at APEI-7. A total of 29 sponge
morphotypes were observed at the abyssal plain sites, with 9
morphotypes being common to all three APEIs (Cladorhiza
sp. DES010, Hyalonema sp. HEX002, Hyalonema sp. HEX003,
Placopegma sp. HEX005, Euplectellinae HEX014, Docosaccus
sp. HEX015, Euplectella sp. HEX019, Acanthascus sp. HEX029,
Unclassified poriferans POR000). Six unique morphotypes were
observed at APEI-1, one at APEI-4 and 7 at APEI-7.
The sponge assemblage composition by density differed
significantly between APEIs (ANOSIM R = 0.65, p < 0.001;
Figure 7). Morphotypes contribution most to dissimilarity
between APEIS 1 and 4 were Unclassified poriferans POR000
(SIMPER 24%) and Hyalonema sp. POR002 (SIMPER 18%),
between APEIs 4 and 7 were Unclassified poriferans POR000
(13%) and Docosaccus sp. HEX015 (13%), and between APEIs
1 and 7 were Unclassified poriferans POR000 (20%) and
Hyalonema sp. POR002 (16%).
Cnidaria
The density of cnidarians was significantly different between
APEIs [ANOVA F(2, 10) = 42.3, p < 0.0001], and was highest
in APEI-1 and lowest in APEI-7.
A total of 37 cnidarian morphotypes were observed on the
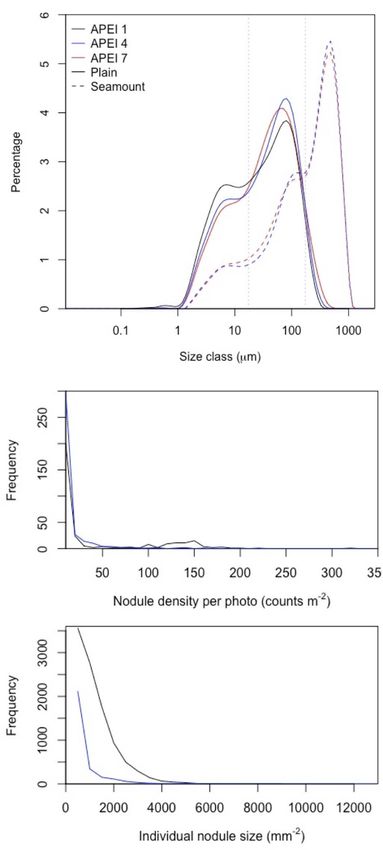
FIGURE 4 | Distributions of particle and nodule parameters at the study sites abyssal plain, with only 6 morphotypes observed at all three sites
in the three APEIs in the western CCZ. (A) Particle size distributions in
(Actiniaria ACT009; Actiniaria ACT022; Ceriantharia CER002;
sediments collected in cores (0–5 cm horizon) on the plain and seamounts.
Grey dotted lines indicate size divisions between fine, intermediate and coarse Ceriantharia CER005; Umbellula sp. PEN003; and Unclassified
particles (17.5 and 174 µm). (B,C) Distribution of nodule density (per image) actiniarians ACT000). Ten morphotypes were unique to APEI-
and nodule size in APEIs 1 and 4. 1, five to APEI-4 and one to APEI-7. The number of cnidarian
morphotypes observed was significantly different between APEIs
[ANOVA F(2, 10) = 65.8, p < 0.0001], with the number of
p < 0.001; Figure 7). Morphotypes contributing most to the morphotypes at APEI-7 significantly lower than at the other
dissimilarity between APEIs 1 and 4 were Kamptosoma sp. two APEIs (both p < 0.0001) by about threefold, and a
URC013 (14%) and Unclassified holothurians HOL000 (8%), significant increase in the number of morphotypes at APEI-
between APEIs 4 and 7 were Kamptosoma sp. URC013 (17%) 1 from APEI-4 (p < 0.05). Actiniairians comprised 45%
and Synallactidae HOL007 (9%), and between APEIs 1 and of cnidarian abundance at the sites on the abyssal plain,
7 were Asteroid AST004 (10%) and Synallactidae HOL007 across 13 morphotypes, more than double the abundance of
(8%). The echinoderm assemblage composition by biomass the other groups.
Frontiers in Marine Science | www.frontiersin.org 9 July 2021 | Volume 8 | Article 671062Durden et al. Western Clarion Clipperton Zone Megafauna
Seamounts
Metazoan Invertebrates
Density
Invertebrate megafaunal densities were substantially different
between the two seamounts (Table 3). At APEI-4, the density
on the seamount was within the range of densities found
on the abyssal plain sites generally but less than on the
plain in APEI-4. The density on the seamount at APEI-7
was approximately 4 times that observed on the seamount at
APEI-4.
Diversity
The diversity of invertebrate megafauna in the study areas
on the seamounts was generally lower than in those on
the abyssal plain (Table 3). The number of morphotypes
on the seamount at APEI-7 was double that found on the
FIGURE 5 | Shared megafaunal morphotypes between APEIs on the abyssal seamount at APEI-4, and more similar to the lowest value
plain for both invertebrates (plain font) and highly mobile scavengers and found on the plain (also at APEI-7). The Hill numbers
predators (italics). and rarefied number of morphotypes were both substantially
smaller on the seamounts than on the plain, and were
slightly higher at the APEI-4 seamount than at the APEI-
The cnidarian assemblage composition by density differed 7 seamount.
significantly between APEIs (ANOSIM R = 0.93, p < 0.001; A total of 28 morphotypes of invertebrate megafauna were
Figure 7). Morphotypes contributing most to the dissimilarity observed on the seamounts (Figure 3). Of these, 61% were only
between APEIs 1 and 4 were Umbellula sp. PEN003 (SIMPER found on the seamounts, while 11 were also found on the plain.
19%) and Actiniarian ACT022 (13%), between APEIs 4 and A total of 6 were common to both seamounts. Each seamount
7 were Umbellula sp. PEN003 (31%) and Abyssopathes lyra shared four morphotypes with the adjacent abyssal plain. Only
ANT002 (8%), and between APEIs 1 and 7 were Actiniarian two morphotypes were common to both seamounts and all
ACT022 (13%) and Unclassified Alcyonaria ALC000 (10%). abyssal plain sites. The metazoan invertebrate assemblage on the
seamounts were dominated by cnidarians (83% of individuals at
Xenophyophores APEI-4 and 78% at APEI-7; Figure 6), with echinoderms being
Xenophyophores dominated the benthic megafaunal assemblage; the second largest major taxonomic group (15% of individuals at
densities of xenophyophores on the abyssal plains were two APEI-4 and 20% at APEI-7).
orders of magnitude greater than the densities of invertebrate Individual Body Size
megafauna (Table 3 and Figure 6). Densities of xenophyophores
Individual body size of a cerianthid CER001, was significantly
were significantly different between APEIs [F(2, 10) = 1876.3,
larger at the seamount at APEI-7 than at APEI-4 [ANOVA F(1,
p < 0.001]. The magnitude of difference between APEIs
28) = 6.8, p < 0.05; Supplementary Material 4]. The individual
was much greater than in the densities of invertebrate
body sizes of other morphotypes were not significantly different
megafauna; densities of xenophyophores at APEI-4 were 1.8
between seamounts.
times those at APEI-1 and 5.5 times those at APEI-7. The
size of xenophyophore tests (“specimens”) on the abyssal Echinoderms
plain was significantly different between the APEIs [F(2, The density of echinoderms on the seamount at APEI-4 was
2889) = 10.1, p < 0.001), driven by specimens at APEI- within the range found at the abyssal plain sites, though half
4 being larger than specimens at the other two APEIs that found on the abyssal plain at APEI-4 (Table 3). However,
(p < 0.05). the density of echinoderms on the seamount at APEI-7 was very
high, about six times that found at the seamount at APEI-4
Highly Mobile Scavengers and Predators and an order of magnitude higher than on the adjacent plain.
The total density of highly mobile scavengers/predators differed Echinoderm biomass at APEI-4 was within the range found at
significantly between the APEIs [F(2, 10) = 6.0, p < 0.05; the abyssal plain sites, but lower than the biomass found on
Table 3], driven by 50% lower densities at APEI-1 than at APEI-7 the abyssal plain at APEI-4. By contrast, echinoderm biomass at
(TukeyHSD p < 0.05). The density at APEI-4 was an intermediate APEI-7 was approximately 5 times that found on the adjacent
value, and not significantly different from those at APEIs 1 or 7. abyssal plain, and more than double the maximum echinoderm
Diversity was not significantly different between APEIs (ANOVA biomass found at the plain sites.
for all Hill numbers p > 0.05). A total of 14 morphotypes were The number of echinoderm morphotypes found on the
found across the abyssal plain sites, with only two morphotypes seamounts was within the range of numbers of morphotypes
(Aristeidae sp. DEC003 and unclassified fish OST000) common found on the abyssal plain. At APEI-4, the number of echinoderm
to all APEIs (Figure 5). morphotypes found on the seamount was less than one third
Frontiers in Marine Science | www.frontiersin.org 10 July 2021 | Volume 8 | Article 671062Durden et al. Western Clarion Clipperton Zone Megafauna
TABLE 3 | Megafaunal community metrics by APEI and habitat type expressed as means [95% confidence interval of the mean] determined in photographic sample
units: density, univariate diversity metrics (Hill numbers N0 [number of morphotypes], N1 [Shannon index] and N2 [Simpson’s index]; expected number of morphotypes
rarefied to 65 specimens, EM65 ), fresh wet weight biomass of echinoderms.
Abyssal plain Seamount
Location APEI-1 APEI-4 APEI-7 APEI-4 APEI-7
Seabed area (m2 ) 1,689 [1,682, 1,696] 1,743 [1,733, 1,754] 1,686 [1,677, 1,695] 1,341 1,739
Metazoan invertebrates
Density (ind m−2 ) 0.058 [0.053, 0.063] 0.059 [0.053, 0.065] 0.042 [0.038, 0.046] 0.049 0.216
N0 43.0 [40.9, 45.1] 38.6 [33.0, 44.3] 26.3 [21.4, 31.1] 11 23
N1 30.6 [29.3, 31.9] 24.4 [21.5, 27.3] 16.8 [13.3, 20.3] 4.8 3.9
N2 22.3 [20.5, 24.0] 15.3 [13.6, 17.1] 11.4 [8.9, 13.8] 3.4 2.2
EM65 33.8 [32.8, 34.7] 29.9 [27.1, 32.7] 24.9 [21.3, 28.5] 10.9 9.7
Echinoderms
Density (ind m−2 ) 0.013 [0.011, 0.014] 0.015 [0.013, 0.017] 0.004 [0.001, 0.007] 0.007 0.043
N0 12.8 [11.3, 14.2] 13.2 [10.1, 16.3] 4.8 [1.9, 7.6] 4 9
Biomass (gwet m−2 ) 0.87 [0.41, 1.34] 2.04 [0.55, 3.53] 0.99 [0.23, 1.75] 1.79 4.90
Porifera
Density (ind m−2 ) 0.012 [0.011, 0.013] 0.021 [0.017, 0.024] 0.021 [0.017, 0.025] 0 0
N0 7.3 [5.1, 9.4] 8.0 [6.9, 9.1] 11.5 [8.5, 14.5] 0 0
Cnidaria
Density (ind m−2 ) 0.025 [0.023, 0.027] 0.019 [0.017, 0.022] 0.006 [0.002, 0.009] 0.041 0.170
N0 17.0 [17.0, 17.0] 14.0 [12.4, 15.6] 5.0 [3.2, 6.8] 6 12
Xenophyophores
Density (ind m−2 ) 2.065 [1.967, 2.163] 3.734 [3.644, 3.824] 0.680 [0.655, 0.706] 0.128 0.034
Highly mobile scavengers and predators
Density (ind m−2 ) 0.0013 [0.0010, 0.0016] 0.0020 [0.0015, 0.0024] 0.0028 [0.0019, 0.0037] 0.0037 0.0040
N0 2.3 [1.8, 2.7] 3.0 [2.1, 3.9] 3.0 [1.6, 4.4] 3.0 2.0
The numbers and sizes of photographic sample units are given in Table 1.
of the number found on the abyssal plain, while at APEI-7, the Cnidaria
number of morphotypes observed on the seamount was almost The density of cnidarians on the seamounts was greater
double that found on the adjacent abyssal plain. In contrast to than on the respective adjacent abyssal plain; at APEI-
the abyssal plain sites, holothurians contributed only 25% to 4 the density on the seamount was double that on the
echinoderm density at the seamount sites, in 4 morphotypes, plain, while at APEI-7 it was 28 times that observed on
while ophiuroids contributed 67% to density, almost entirely in the plain. The density of cnidarians was much greater than
a single morphotype (OPH 012). that of echinoderms on the seamounts, while only slightly
Ophiuroidea OPH012 and Laetmogone sp. HOL030 were the greater on the plains.
two morphotypes found in the highest densities at both seamount The number of cnidarian morphotypes found at each of
sites (Figure 6). The density of Ophiuroid 012 at the seamount the two seamount sites was within the range found at the
at APEI-7 was particularly high (0.030 ind m−2 ), 4.4 times the sites on the abyssal plain (Table 3). The observed morphotype
density of the second-ranked Laetmogone sp. (0.007 ind m−2 ); richness at the APEI-7 seamount site was double the number
the most common morphotype at the APEI-4 seamount occurred found at the APEI-4 seamount site. A total of 15 cnidarian
at lower densities than these (0.004 ind m−2 ). Laetmogone morphotypes were found on the seamounts, with seven also
sp. was the highest-ranked morphotype in terms of biomass found on the abyssal plain. Only three cnidarian morphotypes
at both seamounts, contributing 99% of biomass at APEI-4 were common to both seamounts. At APEI-4, three morphotypes
and 53% at APEI-7. were found on both the seamount and abyssal plain, while 8
The echinoderm assemblage structures (by density and were common to both habitats in APEI-7. In contrast to the
biomass) on the seamounts appear to be more similar abyssal plain, where the dominant actinians were accompanied
to each other than to the corresponding adjacent abyssal by much smaller densities of alcyonacea and antipatharia, one
plain (Figure 7). seamount assemblage was dominated by alcyonaceans and
at the other cerianthids contributed highly to cnidarian and
Porifera invertebrate density.
No porifera were observed in the soft sedimented environment As found for echinoderms, the cnidarian assemblage
on the seamounts. structures by density on the seamounts appear to be more similar
Frontiers in Marine Science | www.frontiersin.org 11 July 2021 | Volume 8 | Article 671062Durden et al. Western Clarion Clipperton Zone Megafauna
FIGURE 6 | Ranked densities of all seabed megafaunal morphotypes (metazoan invertebrates, highly mobile scavengers/predators, and xenophyophores) observed
at (A) APEI-1, (B) APEI-4, and (C) APEI-7. Note the log scale in the y-axis.
to each other than to the corresponding adjacent abyssal plain were lower at APEI-4 than APEI-7. Echinoderm density, diversity
(Figure 7). and biomass, and cnidarian density and diversity were greater on
the seamount at APEI-7.
Summary
Megafaunal communities in the soft sedimented environments
on the seamounts were different from those on the abyssal plain. Xenophyophores
Invertebrate megafaunal densities were comparable or higher, The density of xenophyophores was substantially lower on the
and diversity was lower on the seamounts than on the plains, seamounts than on the abyssal plain, 29 times smaller at APEI-
and most morphotypes found on the seamounts were unique to 4 and 22 times smaller at APEI-7 (Table 3). There was also
that environment. The density of cnidarians was higher on the substantial difference between the seamounts, with the density
seamounts than on the plains; in contrast, no porifera were found of xenophyophores on the seamount at APEI-4 being 3.7 times
on the seamounts. that at APEI-7. However, xenophyophores were still important
The megafaunal communities on the two seamounts differed to the megabenthic assemblages on the seamounts (Figure 6).
from one another. Invertebrate megafaunal density and diversity At APEI-4, the density of xenophyophores was greater than
Frontiers in Marine Science | www.frontiersin.org 12 July 2021 | Volume 8 | Article 671062Durden et al. Western Clarion Clipperton Zone Megafauna
TABLE 4 | Contributions of major taxonomic groups to the metazoan invertebrate assemblage at the study sites: mean percentage of metazoan invertebrate density (%)
and morphotype richness (N0 ) over all sample units.
Phylum Class or order Abyssal plain Seamount
APEI-1 APEI-4 APEI-7 APEI-4 APEI-7
% N0 % N0 % N0 % N0 % N0
Echinodermata Asteroidea 1 4 1 2 5 4 0 0 1 3
Crinoidea 3 4 6 9 0 0 0 0 0.2 1
Echinoidea 5 4 6 4 0 0 2 1 0 0
Holothuroidea 8 10 9 15 5 6 9 1 4 4
Ophiuroidea 5 5 3 4 0.3 1 5 2 14 1
Total 22 27 25 34 10 11 16 4 19 9
Cnidaria Actiniaria 26 11 7 7 9 5 45 2 8 3
Alcyonacea 12 8 4 7 0 0 2 1 66 2
Antipatharia 2 3 6 6 0.3 1 0 0 0 0
Ceriantharia 1 3 1 2 3 3 35 2 4 5
Corallimorpharia 0.2 1 2 1 0 0 0 0 0 0
Pennatulacea 0.8 1 12 3 0.3 1 2 1 0.5 2
Total 42 27 32 26 13 10 82 6 79 12
Porifera Desmospongiae 2 4 1 2 0.3 1 0 0 0 0
Hexactinellida 8 11 10 9 20 12 0 0 0 0
Unclassified porifera 9 2 24 5 30 7 0 0 0 0
Total 19 17 35 16 50 20 0 0 0 0
that of invertebrate megafauna (2.6 times), while at APEI-7, to be lower. These environmental factors (nodule abundance,
xenophyophores were the second ranked morphotype in terms sediment texture, POC flux) are likely to have impacted
of density (Figure 6). Test sizes were significantly smaller on the the observed megafaunal density, diversity and assemblage
seamounts than on the plain [F(1, 78) = 6.3, p < 0.05], but were composition, both directly and in combination.
not different between seamounts.
Highly Mobile Scavengers and Predators Nodule Occurrence and Sediment
Highly mobile scavengers and predators were observed in Characteristics as Drivers of Metazoan
greater densities on the seamounts than on the plain. Only the Megafaunal Assemblages
morphotype unclassified Arthropoda (ART000) was common to Nodules are an important source of habitat heterogeneity on
both seamounts and the abyssal plain. abyssal plains, and exert a major influence on megafaunal
assemblages across the CCZ. At the western CCZ study sites,
there was a 40% increase in density and an increase of 30
DISCUSSION
morphotypes at the study sites with nodules compared to
the site without (Table 3). At a local scale, nodule presence
Environmental Drivers of Megafaunal has been observed to increase densities twofold, with nodules
Assemblages on the Abyssal Plains of harbouring specific megafauna, such as antipatharians and
the Western CCZ alcyonaceans, while some fauna have been observed only
We found low density, high diversity benthic megafaunal in nodule-free areas (Amon et al., 2016; Vanreusel et al.,
communities on the abyssal plains of the western CCZ, with 2016; Simon-Lledó et al., 2019b). Metazoan and foraminiferal
significant differences between the study areas in the three densities have been observed to increase substantially, and
APEIs in both the megafaunal communities and habitat. These metazoan assemblage composition to vary, with nodule cover
community differences were observed in terms of density, at low nodule coverage (∼1–3%; Simon-Lledó et al., 2019b).
diversity and assemblage composition, with few common Similarly, metazoan diversity was higher at lower nodule
morphotypes between sites and many rare morphotypes observed densities (Durden et al. Western Clarion Clipperton Zone Megafauna
patchy at these two study sites (Figure 3), the megafauna
observed likely include a combination of morphotypes suited
to both nodules and nodule-free areas. These habitat niches
are favoured by different taxa, leading to switches in major
groups dominant in areas with contrasting nodule presence. For
example, while densities of holothurians and (largely nodule-
attaching) actiniarians at the high nodule density APEI-1 site
were double and triple those observed at the nodule-free
APEI-7 study site, densities of (largely non-nodule attaching)
hexactinellids and sponges of indeterminate class were halved
(Table 4). Docossacus sp., a plate-shaped glass sponge that is
supported on soft sediments by spicules (Kahn et al., 2020),
contributed significantly to the high density of hexactinellids
at APEI-7. The preference of some taxa for the presence or
absence of nodules (latter for hexactinellids) at these sites were
confirmed through the analysis of environmental DNA (Laroche
et al., 2020). Thus, the habitat heterogeneity provided by the
patchy abundance of nodules at APEIs 1 and 4 is likely a
substantial driver of variation in the megafaunal communities in
the western CCZ.
Nodule-related seabed heterogeneity is accompanied by
differences in the soft sediment particle size, which likely
also influences the megabenthic assemblage. Taxa that interact
with the sediment, such as deposit feeding and burrowing
fauna, are sensitive to its granulometric characteristics (Hudson
et al., 2005). Nodule-free areas were observed at all three
APEIs (Figure 3), and few soft-sediment interacting taxa
were common to all sites (though the lack of overlapping
morphotypes may be related to the small sample size).
However, these contributed only a small proportion of all
morphotypes observed at the nodule-free APEI-7 study site.
Morphotypes that interact with soft sediments (e.g., holothurians,
annelids, some asteroids) were observed at all abyssal plain
study sites, but the morphotypes present and their densities
both varied. Densities of echiurans (ANN020), deposit feeding
burrowing annelids that leave large feeding traces on the
sediment surface (Bett and Rice, 1993), were highest at APEI-
7, with 3.5- and 5.4-fold higher densities than in APEIs
1 and 4, respectively. Differences in densities and observed
morphotypes may be related to differences in sediment particle
size distributions between the sites (Figure 3), with the
APEI-7 having the coarsest sediment. Similar relationships
between soft-sediment adapted megafaunal morphotypes and
sediment texture have been observed with small changes
to sediment texture at the nodule-free abyssal Porcupine
Abyssal Plain in the Atlantic Ocean (Durden et al., 2020b).
Other sediment conditions not measured at these sites,
such as porosity and biogeochemical parameters (e.g., Volz
et al., 2018), may also influence the assemblage in areas of
soft sediments. Finally, the observed sediment particle size
distribution is related to other environmental factors important
to the faunal assemblage, including the near surface current
regime, and deposition and bioturbation of organic material
FIGURE 7 | Two-dimensional non-metric multidimensional scaling ordination (Turnewitsch et al., 2015), which are influenced by seabed
plots of community composition similarity for echinoderm (A) density and (B) bathymetry. Even small changes in seabed water depth (12.5
biomass (fresh wet weight), (C) poriferan density, and (D) cnidarian density on
m), smaller than those in the study areas (18–50 m), can
the abyssal plain (circles) and seamounts (triangles) in the APEIs (1 = black,
4 = blue, 7 = red symbols). result in changes in sediment particle size, with corresponding
alterations to megafaunal assemblage related to deposit feeders
Frontiers in Marine Science | www.frontiersin.org 14 July 2021 | Volume 8 | Article 671062You can also read