Coupling a gas chromatograph simultaneously to a flame ionization detector and chemical ionization mass spectrometer for isomer-resolved ...
←
→
Page content transcription
If your browser does not render page correctly, please read the page content below
Atmos. Meas. Tech., 14, 3895–3907, 2021
https://doi.org/10.5194/amt-14-3895-2021
© Author(s) 2021. This work is distributed under
the Creative Commons Attribution 4.0 License.

Coupling a gas chromatograph simultaneously to a flame ionization
detector and chemical ionization mass spectrometer for
isomer-resolved measurements of particle-phase organic compounds
Chenyang Bi1 , Jordan E. Krechmer2 , Graham O. Frazier1 , Wen Xu2 , Andrew T. Lambe2 , Megan S. Claflin2 ,
Brian M. Lerner2 , John T. Jayne2 , Douglas R. Worsnop2 , Manjula R. Canagaratna2 , and
Gabriel Isaacman-VanWertz1
1 Department  of Civil and Environmental Engineering, Virginia Tech, Blacksburg, Virginia 24060, USA
2 Aerodyne   Research Inc., Billerica, Massachusetts 01821, USA

Correspondence: Gabriel Isaacman-VanWertz (ivw@vt.edu)

Received: 30 June 2020 – Discussion started: 12 August 2020
Revised: 31 March 2021 – Accepted: 20 April 2021 – Published: 27 May 2021

Abstract. Atmospheric oxidation products of volatile or-        duced as reagent ions, to examine the feasibility of extend-
ganic compounds consist of thousands of unique chemicals        ing the use of an individual CIMS to a broader range of an-
that have distinctly different physical and chemical prop-      alytes with still selective reagent ions. While this approach
erties depending on their detailed structures and functional    reduces iodide-adduct ions by a factor of 2, [M − H]− and
groups. Measurement techniques that can achieve molecu-         [M + O2 ]− ions produced from lower-polarity compounds
lar characterizations with details down to functional groups    increase by a factor of 5 to 10, improving their detection by
(i.e., isomer-resolved resolution) are consequently necessary   CIMS. The method expands the range of detected chemical
to provide understandings of differences of fate and trans-     species by using two chemical ionization reagents simulta-
port within isomers produced in the oxidation process. We       neously, which is enabled by the pre-separation of analyte
demonstrate a new instrument coupling the thermal des-          molecules before ionization.
orption aerosol gas chromatograph (TAG), which enables
the separation of isomers, with the high-resolution time-
of-flight chemical ionization mass spectrometer (HR-ToF-        1   Introduction
CIMS), which has the capability of classifying unknown
compounds by their molecular formulas, and the flame ion-       Atmospheric aerosols can impact climate by scattering light
ization detector (FID), which provides a near-universal re-     and absorbing radiation and thus changing earth’s reflectiv-
sponse to organic compounds. The TAG-CIMS/FID is used           ity directly or by impacting the formation of clouds (Seinfeld
to provide isomer-resolved measurements of samples from         and Pandis, 2016). If inhaled, they may deposit into the alve-
liquid standard injections and particle-phase organics gen-     oli region of lungs and transmit into the bloodstream to cause
erated in oxidation flow reactors. By coupling a TAG to a       adverse health effects such as ischemic heart disease, cere-
CIMS, the CIMS is enhanced with an additional dimension         brovascular disease, and lung cancer (Burnett et al., 2014;
of information (resolution of individual molecules) at the      Pope and Dockery, 2006). A significant fraction of submi-
cost of time resolution (i.e., one sample per hour instead of   crometer aerosol mass is organic, mostly formed through
per minute). We found that isomers are prevalent in sam-        the oxidative conversion of gas-phase volatile organic com-
ple matrix with an average number of three to five isomers      pounds (VOCs) to lower-volatility oxygenated organic com-
per formula depending on the precursors in the oxidation        pounds that can condense to form secondary organic aerosol
experiments. Additionally, a multi-reagent ionization mode      (SOA) (Goldstein and Galbally, 2007; Jimenez et al., 2009;
is investigated in which both zero air and iodide are intro-    Kroll and Seinfeld, 2008).

Published by Copernicus Publications on behalf of the European Geosciences Union.
3896                                            C. Bi et al.: Coupled TAG-CIMS/FID for isomer-resolved chemical analysis

   Atmospheric oxidation of volatile organic compounds pro-        ture the composition of real-world atmospheres, which con-
duces thousands of unique chemicals that exist in a dynamic        tain compounds that are not easily synthesized or available,
and complex mixture that spans a wide range of physic-             such as transient and short-lived oxidation products. An im-
ochemical properties (Atkinson and Arey, 2003; Goldstein           proved approach would be the generation of oxidized prod-
and Galbally, 2007). The detailed structure and functional         ucts through the simulated atmospheric oxidation of atmo-
groups of each individual compound controls its properties         spherically relevant precursors, but this approach has limited
(Kroll and Seinfeld, 2008; Nozière et al., 2015). Rate of re-      utility due to the formation of multiple isomers of each for-
actions, partitioning between phases, and compound toxic-          mula (Brophy and Farmer, 2016). The range of CIMS reagent
ity are all impacted by the functional groups present in a         ion chemistries that are practically useful is therefore lim-
molecule (Arangio et al., 2016) and in some cases on its           ited to those, such as iodide, that yield distinguishable prod-
physical conformation (Atkinson, 2000; Lim and Ziemann,            ucts, while other potentially promising techniques (e.g., ac-
2009). Characterization of a compound to the level of detail       etate CIMS) have seen less use due to the complex ionization
of its molecular structure (i.e., isomer-resolved composition)     pathways. The lack of isomer resolution afforded by CIMS
is therefore necessary to predict whether a compound will          introduces several other limitations as well. The fate of a
deposit to a particle or surface, react with an oxidant, or per-   compound and its impacts on the environment are dependent
sist in the atmosphere and to understand its potential adverse     on molecular structure, so they may not be fully predicted
impacts on public or ecosystem health.                             or captured by molecular formulas (Isaacman-VanWertz and
   A major advance in the online nontarget analysis of oxy-        Aumont, 2021). Furthermore, a formula may represent many
genated organics in the atmosphere has been the develop-           isomers, but CIMS signals will preferentially represent iso-
ment and widespread adoption of the high-resolution time-          mers to which the ionization method is more sensitive. This
of-flight chemical ionization mass spectrometer (HR-ToF-           may bias the interpretation and quantification of CIMS data,
CIMS). These systems directly sample atmospheric con-              though the extent to which this issue has impacted the litera-
stituents with minimal pretreatment and classify them by           ture is unknown.
their molecular formulas, providing unprecedented char-               The resolution of individual components in a com-
acterizations of thermally and/or chemically labile atmo-          plex mixture is typically performed through some form of
spheric constituents. Multiple negative-ion chemical ioniza-       chromatography. While liquid chromatography (LC, e.g.,
tion methods have been applied to atmospheric sampling,            Gómez-González et al., 2008), ion chromatography (e.g.,
including acetate for the detection of carboxylic acids and        VandenBoer et al., 2012), and gas chromatography (e.g.,
some inorganic acids (Bertram et al., 2011; Brophy and             Hamilton, 2010; Schauer et al., 1996) have all been used
Farmer, 2016; Veres et al., 2008), nitrate for the detection       in atmospheric measurements, we limit our discussion here
of highly oxidized organic matter (Ehn et al., 2010; Krech-        to gas chromatography (GC), as it has been demonstrated
mer et al., 2015), and iodide for the detection of moderately      as a field-deployable technique for the analysis of oxy-
and highly polar organic compounds (Aljawhary et al., 2013;        genated organics, complementary with CIMS instrumenta-
Isaacman-Vanwertz et al., 2018; Lee et al., 2014; Lopez-           tion (Isaacman-VanWertz et al., 2016; Thompson et al., 2017;
Hilfiker et al., 2014; Riva et al., 2019). Iodide has seen par-    Zhang et al., 2018). GC separates compounds in a com-
ticularly wide use due to its relatively general selectivity and   plex mixture based upon their vapor pressure and polar-
straightforward chemistry, in which an adduct is formed be-        ity and has been deployed in the field for decades for the
tween the analyte and iodide ion. Due to the high negative         online measurement of low-polarity gas-phase components
mass defect of iodine, iodide-adduct ions are separated from       (Goldan et al., 2004; Goldstein et al., 1995; Helmig et al.,
other isobaric ions in the mass spectrum by the so-called “io-     2007; Millet, 2005; Prinn et al., 2000; Vasquez et al., 2018).
dide valley” in which few ions are present and so can be           More recent developments on the field-deployable thermal
classified by their molecular formula with high confidence         desorption aerosol gas chromatograph (TAG) have enabled
and low detection limits (Lee et al., 2014). Ions with posi-       the GC analysis of semivolatile and particle-phase air sam-
tive mass defects (i.e., non-iodide adducts) are observed in       ples through novel sampling cells, autonomous calibration
iodide-CIMS mass spectra of atmospheric mixtures and may           via liquid injections of authentic standards, and derivatiza-
represent peroxy acids (Lee et al., 2014; Mielke and Osthoff,      tion of oxygenates for the analysis of oxygenated compounds
2012), but these ions are generally poorly understood and          (Isaacman et al., 2014; Williams et al., 2006; Zhao et al.,
frequently excluded from analyses due to their uncertain in-       2013). Detection of analytes eluting from the GC may rely on
terpretation.                                                      a flame ionization detector (FID), which has near-universal
   A major barrier to understanding most reagent ion               response but provides no chemical information about an an-
chemistries is that isomers cannot be differentiated since an-     alyte (Kolb et al., 1977; Grob and Barry, 2004), or an elec-
alytes are classified by molecular formulas. Studying instru-      tron ionization mass spectrometer (EI-MS), which provides
ment response requires introducing analytes as known stan-         identification of compounds with mass spectra available in
dards, so it is limited to commercially available or custom-       existing libraries but requiring careful interpretation to iden-
synthesized compounds. Such compounds do not fully cap-            tify those not in the libraries. These techniques have allowed

Atmos. Meas. Tech., 14, 3895–3907, 2021                                             https://doi.org/10.5194/amt-14-3895-2021
C. Bi et al.: Coupled TAG-CIMS/FID for isomer-resolved chemical analysis                                                   3897

for quantification of some individual isomers in SOA, but the     of multiple reagent ions in the IMR. Instead of using pure ni-
substantial majority of analytes observed in GC analyses of       trogen, the multi-reagent ionization mode uses a mixture of
SOA have no known structures or identification (Isaacman-         1.91 slpm of UHP N2 and 0.09 slpm of ultra zero air as the
VanWertz et al., 2016) due to a lack of commercially avail-       methyl iodide sheath flow. This mixture is selected such that
able standards of atmospheric oxidation products.                 iodide ions (I− ) accounted for ∼ 50 % of the total reagent
    We demonstrate here a new instrument coupling the TAG,        ion count, with the rest comprised of air-based components
which enables the separation of isomers, with the HR-ToF-         as described later.
CIMS, which has the capability of classifying unknown com-           To obtain a smooth chromatographic peak, raw negative-
pounds by their molecular formulas, and with the FID, which       ion spectra are typically acquired at a rate of 4 Hz without
provides a near-universal response to all analytes for quan-      time averaging, which is higher than the rate typically used
tification with low uncertainty. The specific objectives of       for direct air sampling by CI-ToF-MS (1 Hz and 1 min aver-
this work are to (1) describe the setup and operation of          aging). Data collection as fast as 20 Hz was tested and found
a TAG-CIMS/FID, (2) evaluate the presence of isomers in           to be viable for applications requiring higher data frequency
laboratory-generated SOA, (3) demonstrate the utility of this     but is not necessary for data collection described here. The
instrument for investigating ionization chemistries by resolv-    ToF-MS is operated in “V mode” and achieves a mass reso-
ing mass spectra of individual compounds separated from           lution of ∼ 4100 at m/z 212 and a mass accuracy of < 5 ppm,
a complex mixture; and (4) expand the range of chemical           which enables the assignment of elemental composition to
species which can be measured by an individual CIMS using         observed mass-to-charge values.
multiple reagent ions.
                                                                  2.2   TAG

                                                                  The TAG used in this study is a custom-built instrument
2     Instrumentation and methods
                                                                  similar to those commercially available through Aerodyne
                                                                  Research Inc. In brief, aerosols are collected with a sam-
As shown in Fig. S1 in the Supplement, the TAG-CIMS/FID
                                                                  pling flow rate of 9 slpm through a nine-jet impactor with
integrates the use of a GC instrument, TAG, with two de-
                                                                  a 50 % collection cut-off point of 0.085 µm (Williams et al.,
tectors, HR-ToF-CIMS (Aerodyne Research Inc.) and FID
                                                                  2006). The collection cell is equipped with a liquid injection
(Agilent 7820A). The GC column effluent is split between
                                                                  port where chemical standards can be quantitatively added
the two detectors using a heated and passivated tee together
                                                                  through an automatic liquid injection system (Isaacman et
with heated fused-silica transfer lines. The instrument allows
                                                                  al., 2011). After a 5–15 min sample collection period, which
for the collection of chromatographic signals generated by
                                                                  is equivalent to 0.045–0.135 m3 of air sampled, samples are
CIMS and FID simultaneously.
                                                                  thermally desorbed in helium to the head of the GC column
2.1    HR-ToF-CIMS                                                by heating the cell to 300 ◦ C at a rate of 50 ◦ C min−1 while
                                                                  the GC column is held at 50 ◦ C with ∼ 3 sccm of helium
The HR-ToF-CIMS (Lee et al., 2014) uses a similar phys-           carrier gas flow. Samples pass through a passivated metal
ical configuration as described by Isaacman-Vanwertz et           manifold with restrictive capillaries to separate sample pres-
al. (2018) with modification at the inlet for adapting the GC     sures from GC operating pressures without the use of in-line
flow. The inlet is a heated metal interface which is kept at      valves (Kreisberg et al., 2014). A polar GC column (MXT-
225 ◦ C and has a 1/32 in. inner diameter bore-through center     WAX, 17 m × 0.25 mm × 0.25 µm, Restek) wrapped onto the
hole to allow for insertion of the fused-silica guard column      temperature-controlled metal hub is used for the separation
into the ion–molecule region (IMR) which is kept at room          of oxygenated organic compounds. The GC analysis is con-
temperature (∼ 20 ◦ C) . The tip of the guard column extends      ducted with 1 sccm of helium, and the temperature of the GC
2 mm out of the heated cartridge to mix with the reagent ion      column is ramped to 250 ◦ C at a rate of 10 ◦ C min−1 and
flow inside the IMR.                                              then held for 25 min. Though analysis focuses on oxygenated
   Two different ionization modes are used in this study: io-     compounds to which the CIMS may exhibit sensitivity, we
dide and multi-reagent ionization mode. The iodide ioniza-        highlight that derivatization, which is typically used in the
tion mode (Lee et al., 2014) is used in a similar configuration   analysis of oxygenates by GC (Isaacman et al., 2014), is not
to those published in the past for a gas-phase iodide CIMS        employed here to minimize chemical alterations to the func-
(Krechmer et al., 2016). Iodide ions are generated by pass-       tionality of the analytes reaching the detectors. Although not
ing a 2 slpm flow of humidified ultrahigh-purity (UHP) N2         observed with the injection of liquid standards, it is possible
over a permeation tube filled with methyl iodide and then         that skipping derivatization may bring up certain limitations
through a radioactive source (Po-210, 10 mCi, NRD) into           of the instruments such as the decrease of the transmission ef-
the IMR. The IMR pressure is maintained at 100 mbar. Be-          ficiency and stability of the analytes (Isaacman et al., 2014).
sides the pure iodide ionization mode, the CIMS operated
using a multi-reagent ionization mode to investigate the use

https://doi.org/10.5194/amt-14-3895-2021                                           Atmos. Meas. Tech., 14, 3895–3907, 2021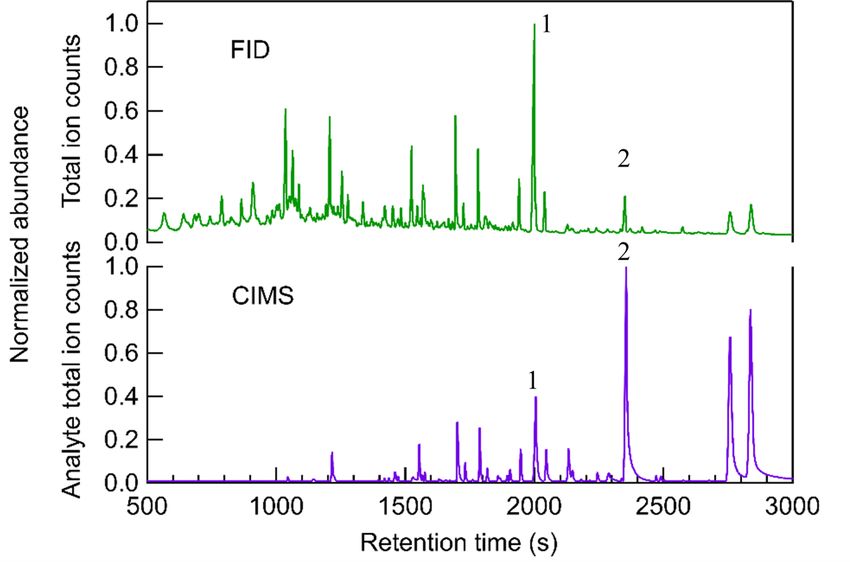
3898 C. Bi et al.: Coupled TAG-CIMS/FID for isomer-resolved chemical analysis
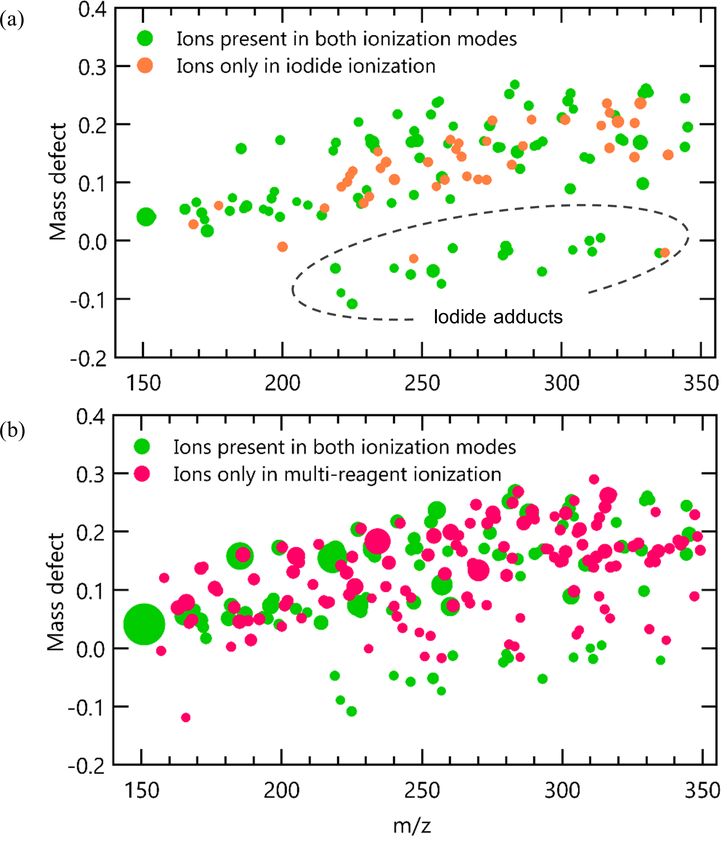
2.3 TAG-CIMS/FID interface metics Inc.) are also used to serve as representative complex
mixtures. SOA was generated via gas-phase O3 and/or OH
The design of the TAG-CIMS/FID interface needs to allow oxidation of limonene (Sigma-Aldrich, 97 % purity), 1,3,5-
for the efficient transfer of analytes from GC effluent to trimethylbenzene (Sigma-Aldrich, 98 % purity), and euca-
CIMS and FID. This interface is subject to three technical lyptol (Sigma-Aldrich, 99 % purity) in a potential aerosol
challenges: (1) the connections between capillary columns mass (PAM) flow reactor (Lambe et al., 2011) and collected
and fittings need to be leak-tight, (2) all components in the onto the TAG impactor cell at 9 L min−1 sampling flow rate
interfaces require proper heating to avoid cold spots and dead and analyzed by the TAG-CIMS/FID. We hereafter label
volume, and (3) the relative flow rates to CIMS and FID need data from a given set of oxidation experiments system as
to be controlled to maintain roughly equal split of flow. As “precursor–oxidant” (e.g., limonene–OH).
shown in Fig. 1, a 1/32 in. passivated (SilcoNert 2000, Sil-
coTek Corp.) metal cross piece (part no. ZX.5, VICI) is cov- 2.5 Data processing
ered by a two-piece heated aluminum block. The four ports
on this connector allow for splits from the GC to three de- CIMS and FID data are acquired as continuous time se-
tectors (FID, CIMS, optional third). Because the IMR pres- ries throughout a single GC run. TAG sends a start signal
sure of the CIMS is at 100 mbar while the FID is at ambient to both CIMS and FID once the GC run starts and sends
pressure, the restriction to the CIMS side needs to be signif- a digital signal to stop the data acquisition once a sample
icantly higher than that of the FID side to maintain compa- run is completed. For each run file, high-resolution (HR)
rable flow rates. These restrictions are achieved using deac- mass spectrum peak fitting of CIMS data is conducted us-
tivated fused-silica guard columns which have an inner di- ing the Tofware (Tofwerk, AG and Aerodyne Research Inc.,
ameter of 0.075 and 0.25 mm and a length of 0.18 and 0.5 m version 3.1.2) toolkit developed for the Igor Pro 7 analysis
to connect the cross with CIMS and FID, respectively. Be- software package (WaveMetrics, Inc.). HR fitting of iodide-
cause the change of temperature of GC column during a run adduct ions was used to generate a list of potential molec-
cycle may potentially influence the split flow, we mitigate ular formulas present within a given set of experiments.
the impacts by maintaining the TAG-CIMS/FID interface at Once the formulas are extracted and assigned in CIMS, the
a constant temperature, 300 ◦ C, that is 50 ◦ C higher than the high-resolution time-series data with the peak list are then
maximum temperature of the GC column. The guard column imported into TERN, which is the freely available (https:
to FID passes through a narrow-bore metal tube wrapped in //sites.google.com/site/terninigor/, last access: 20 May 2021)
heater cable with fiberglass insulation and heated to 300 ◦ C Igor-based software tool for the quantification of chromato-
to prevent the condensation of analytes in the transfer lines. graphic data (Isaacman-VanWertz et al., 2017). The retention
The temperature of the entrance capillary to the IMR of the times of peaks between CIMS and FID are aligned based on
CIMS is maintained at 225 ◦ C in order to prevent the degra- linear regression of retention times of internal standards (i.e.,
dation of PTFE components of CIMS inlet; this leads to some vanillin and 1,12-dodecanediol) and the most abundant com-
peak broadening of low-volatility analytes in the CIMS data. pounds in chromatographic runs.
With these dimensions and temperatures, the flow rate to FID
is approximately one-third of total GC flow (0.3 sccm, mea- 3 Results and discussion
sured using Sensidyne Gilibrator-2 at the inlet of FID) with
the remainder to the CIMS (0.7 sccm). To further evaluate the 3.1 Chromatograms
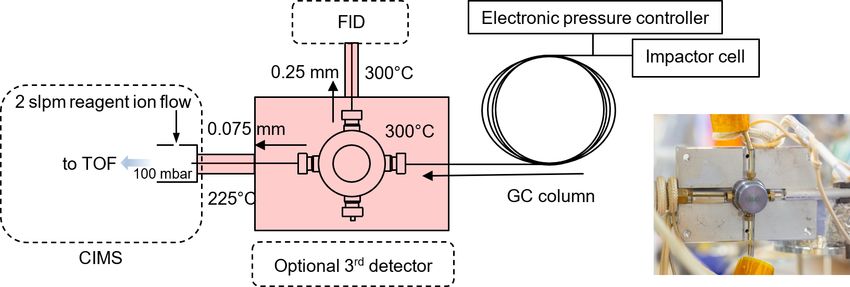
stability of the split ratio of flow, test runs were conducted
prior to the experiments to monitor the flow rate at the in- Figure 2 shows an example comparison of chromatograms
let of FID, variability in the flow split was found to be less collected by the FID and CIMS for limonene–O3 SOA. The
than 10 % variation throughout a run cycle, which is stable FID produces a total signal (y axis) as a function primarily
enough to be quantitative. of the mass of carbon combusted, so each analyte (i.e., chro-
matographic peak eluting at a given retention time) responds
2.4 Laboratory experiments with similar mass-based sensitivity. However, the total chro-
matogram shown is the full extent of the data available for a
Data are collected from two sources: injection of liquid given sample; there is no further separation by mass or other
standards and laboratory-generated SOA through the oxida- dimension. Co-eluting peaks that are not well resolved may
tion of atmospherically relevant precursors. Liquid standards not be able to be accurately integrated. In contrast, the CIMS
include 1,12-dodecanediol (Sigma-Aldrich, 99 % purity), analyte total ion count signal is the sum of all observed ions
undecanoic acid (AccuStandard, 100 % purity), eugenol with the reagent ions removed, so while two peaks may not
(Sigma-Aldrich, 99 % purity), vanillin (Sigma-Aldrich, 99 % be chromatographically resolved (i.e., co-eluting total sig-
purity), vanillic acid (Sigma-Aldrich, 97 % purity), and oleic nal), they may be mass-resolved by producing signals on
acid (Sigma-Aldrich, 99 % purity). Additionally, six com- different ions. Additionally, many peaks that are small yet
mercially available liquid fragrance samples (MakingCos- above the signal-to-noise ratio on their individual ions might
Atmos. Meas. Tech., 14, 3895–3907, 2021 https://doi.org/10.5194/amt-14-3895-2021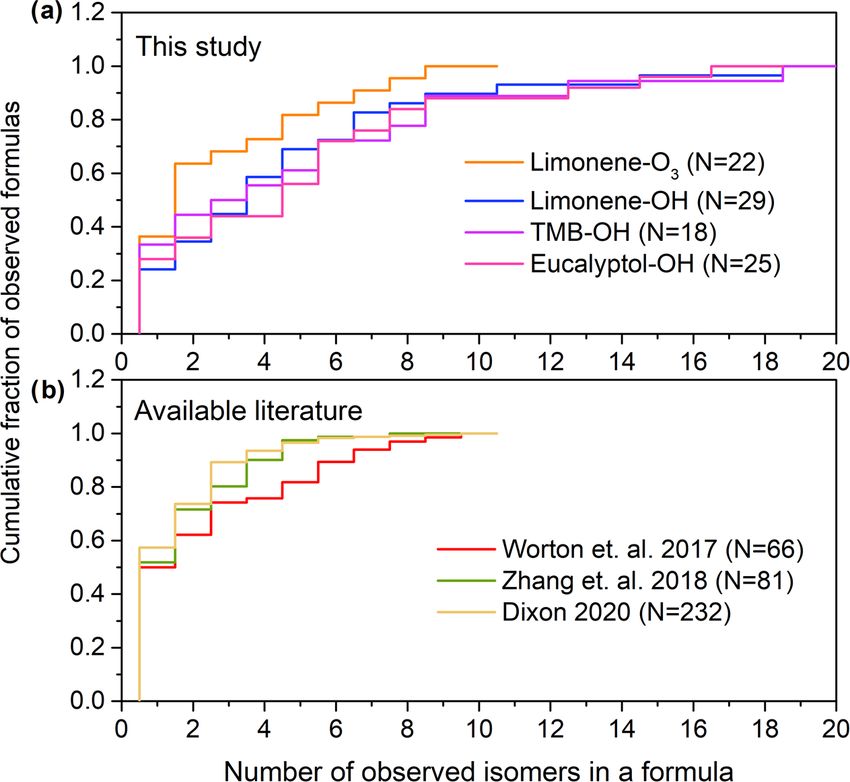
C. Bi et al.: Coupled TAG-CIMS/FID for isomer-resolved chemical analysis                                                              3899

Figure 1. Schematic of the TAG CIMS/FID interface, with a photo inserted. Details of each instrument are simplified. Restrictive capillaries
to each detector are used to balance flows to each detector due to differences in pressure (dimensions and temperatures shown).

not show up in the CIMS chromatogram of analyte total ion
counts due to noise in the total counts. The results demon-
strate that the responses from FID and CIMS have distinctly
different patterns with the number of peaks, and the height of
aligned peaks in the chromatograms of FID and CIMS dif-
fer significantly. Many early-eluting compounds (i.e., com-
pounds having peaks with retention times less than 1500 s)
that are observed by FID do not produce a clear signal in the
CIMS. Compounds with retention time longer than 1500 s
usually have peaks detected by both FID and CIMS chro-
matograms. Since the TAG-CIMS/FID interface and the cap-
illary to the FID is held at 50 ◦ C above the maximum col-
umn temperature, differences in the transfer of analytes to
these two detectors should be negligible. Instead, these dif-
ferences are due to the selectivity of the two detectors. FID           Figure 2. Comparison of chromatograms between FID and CIMS
is a near-universal detector, which is able to detect almost            from particle sample generated from limonene–O3 reaction. The
all organic compounds with relatively similar and predictable           time-series signals of CIMS are the analyte total ion counts, which
responses (Scanlon and Willis, 1985). The sensitivity of the            are the summation of all ions with the reagent ions removed, while
iodide-CIMS may differ by orders of magnitude and is high-              signals of FID are single channel. The signals of both CIMS and
                                                                        FID are normalized to the highest peak in the chromatogram.
est for compounds that contain multiple OH groups and can
therefore more readily form an adduct with the iodide ion
(Iyer et al., 2016). Since the TAG here used a polar (MXT-
WAX) GC column that more preferably retains polar com-                  nals in FID while analyte 2 with a retention time of 2380 s
pounds, the early-eluting compounds are likely less polar               is the largest peak in CIMS. Since FID sensitivity differs be-
and consequently less sensitive or not detected in the iodide-          tween compounds by less than a factor of two (Hurley et al.,
CIMS. Some early-eluting compounds may be present but                   2020), the peak area of FID approximates the relative mass of
have peaks too small to be visible due to the linear display of         a compound in a sample matrix. However, comparing to the
signal in Fig. 2. It is also possible that some of those peaks          near-universal response of FID signals, the signals of iodide
are thermally decomposed analytes which exhibit low sen-                CIMS per unit mole of analytes may vary up to 5 orders of
sitivity in CIMS since all thermal desorption instruments,              magnitude and highly depend on their enthalpies of binding
including the TAG, are known to potentially cause thermal               with iodide (Iyer et al., 2016; Lopez-Hilfiker et al., 2016a).
decomposition of samples (Isaacman-VanWertz et al., 2016;               The two peaks highlighted provide an example of the vari-
Stark et al., 2017).                                                    ability of CIMS response: analyte 1 has a larger FID peak
   The low abundance of early-eluting peaks in the CIMS                 area, indicating a higher mass concentration in the sample
chromatogram is an example of the value of the coupled                  mixture than analyte 2. However, since the CIMS peak area
CIMS/FID detector pair for investigating CIMS response.                 of analyte 1 is lower, it must be less sensitive than analyte 2 in
Although compounds having larger retention times can be                 an iodide CIMS. With the use of FID in addition to the CIMS
found in both FID and CIMS, their abundance is significantly            detector, calibration of compounds in CIMS without using
different between the two detectors. For example, analyte 1             authentic standards can therefore theoretically be achieved.
with a retention time of 2000 s has the most abundant sig-              While implementation of this calibration approach is com-
                                                                        plex, here we provide a proof-of-concept quantitative anal-

https://doi.org/10.5194/amt-14-3895-2021                                                   Atmos. Meas. Tech., 14, 3895–3907, 2021
3900 C. Bi et al.: Coupled TAG-CIMS/FID for isomer-resolved chemical analysis
ysis. Hurley et al. (2020) demonstrated that the number of 19, 19, and 17, respectively. The results indicate that iso-
moles of an analyte can be calculated from its FID peak area mers are prevalent in sample matrix with an average num-
based on a calibration response factor to hydrocarbons, with ber of three to five isomers per formula depending on the
a correction for oxygenation based on the chemical formula precursors in the oxidation experiments. We compare these
identified by CIMS (specifically, the FID response per car- data to previously published studies using isomer-resolved
bon atom relative to maximum = −0.54 O / C + 0.99, where analyses of SOA (Fig. 3b). Ambient measurements from a
O / C is the oxygen-to-carbon ratio in the target analyte; Hur- range of environments show a qualitatively similar distribu-
ley et al., 2020). By applying the calibration approach for the tion of isomers per formula, though with somewhat lower av-
two analytes in the example, analyte 1 (i.e., C10 H14 O3 ) is erages of 2.7, 2.1, and 1.9, based on data collected from am-
found to be roughly 4 times more abundant than analyte 2 bient air in a ponderosa pine forest in California measured
(i.e., C9 H14 O3 ) on a per mole basis, but appear substantially by two-dimensional GC without derivatization (Worton et
lower in its CIMS signal due to a 10 times lower sensitivity. al., 2017), southeastern USA by two-dimensional GC with
The detailed methods of quantification and determination of derivatization (Zhang et al., 2018), and combined datasets
isomer sensitivity will be addressed in future work. This ar- from SOA formation measured by liquid chromatography
ticle focuses instead on the descriptions of technical hurdles (Bryant et al., 2020; Dixon, 2020). These data were col-
overcome by TAG-CIMS/FID and its potential value in un- lected by different instruments (two-dimensional GC with
derstanding existing and new ionization chemistries, as well filter samples analyzed by thermal desorption and deriva-
as atmospheric systems. tization, two-dimensional GC with filter samples analyzed
by thermal desorption, and liquid chromatography, respec-
3.2 Number of isomers per formula tively) that are likely not sensitive to the same compounds.
Another possible reason for the lower number of isomers
We explore here the extent to which isomers are present in at- might be that the use of two-dimensional GC can limit the
mospherically relevant mixtures to assess the potential utility range of compounds detected since those analytes have to
of a TAG-CIMS/FID (or, more generally, a GC-CIMS/FID). be such that they make it through two consecutive capil-
The number of isomers per molecular formula identified in lary columns. Together, the published data and that collected
the high mass resolution peak fitting can be obtained by by TAG-CIMS/FID support the conclusion that isomers are
counting the number of peaks in the chromatograms of a abundant for molecular formulas with 10 or less carbon num-
specific high-resolution m/z of the iodide adduct (i.e., a spe- ber in particle-phase samples. Those isomers may have sig-
cific molecular formula). These data should be interpreted nificantly different physical and chemical properties that im-
cautiously. Overestimation may occur when large parent pact the formation, transport, and toxicity of SOA, and the
molecules decompose to isomers of a smaller formula dur- distribution of isomers could vary temporally or spatially.
ing thermal desorption. Conversely, isomers may be under- The isomer-resolved classification of SOA components pro-
counted if they fall below the threshold used to count them, vided by TAG-CIMS/FID therefore provides valuable under-
which was selected here to be conservative. The limitations standings of the oxidative process. Although the molecular
in these estimates will be discussed in detail later in this sec- structure of each isomer cannot be recognized directly in the
tion, but these data nevertheless provide a useful, if uncertain, chromatograph and the specific functional groups within the
understanding of the prevalence of isomers in atmospheri- formula remain unknown, the chromatographic separation of
cally relevant samples. the TAG-CIMS provides some comparison of polarity, which
Figure 3a shows the cumulative number of isomers found is dependent on chemical structures, for isomers within a for-
in formulas identified in the PAM oxidation experiments. mula.
In this study, compounds with a peak height higher than There are certain limitations for the analysis of the num-
1.0 × 10⁴ ions s−1 are taken into the isomer counts; the num- ber of isomers per formula in this study. The number of iso-
ber of isomers is sensitive to the selection of this threshold mers is probably underestimated due to exclusion of peak
so we set as a threshold the approximate level at which the heights less than 1.0 × 10⁴ ions s−1 . Furthermore, isomers
chromatographic peak height clearly rises above the base- may vary in their sensitivity, with isomers having less po-
line by at least a factor of 50; in many cases, peaks are lar functional groups possibly not detected by CIMS. Ad-
present below this threshold (e.g., Fig. S2, showing 12 iso- ditionally, the use of a GC column, which is selective to-
mers identified in (C9 H12 O4 )I). Although 30 % of formulas wards a certain range of volatility and polarity of compounds,
in the oxidation experiments have only one isomer, a signifi- which limits the detection of compounds. Conversely, ther-
cant portion (34 %) of formulas have more than five isomers. mal desorption within TAG may fragment larger accretion
For limonene–O3 , limonene–OH, 1,3,5 trimethylbenzene– products to form analytes not present in the original sam-
OH, and eucalyptol–OH reactions, the median numbers of ple (Buchholz et al., 2020; Isaacman-VanWertz et al., 2016;
isomers per formula are 2.0, 4.0, 3.5, and 5.0; the average Lopez-Hilfiker et al., 2016b; Stark et al., 2017) or may re-
numbers of isomers per formula are 3.7, 4.9, 5.1, and 5.3; verse particle-phase oligomerization reactions (Claflin and
and the maximum numbers of isomers per formula are 14, Ziemann, 2019). These fragments may not represent the ac-
Atmos. Meas. Tech., 14, 3895–3907, 2021 https://doi.org/10.5194/amt-14-3895-2021C. Bi et al.: Coupled TAG-CIMS/FID for isomer-resolved chemical analysis 3901
3.3 Exploring new chemistries: multi-reagent
ionization
Unlike direct air sampling by CIMS, in which the mass spec-
trum at a given time point is the summation of all analytes,
the mass spectra of TAG-CIMS/FID analytes are separated
in time by chromatography. Consequently, if a chromato-
graphic peak of a compound is well resolved in CIMS, all
signals detected from the ionization of a single analyte are
observed at the same chromatographic retention time and un-
ambiguously assignable to that specific compound, including
iodide adducts, products of adduct declustering, fragments
(generally not from iodide clustering), and any ions pro-
duced by simultaneous alternate chemistry with other ions
present in the atmospheric pressure interface (e.g., air). This
provides a clean mass spectrum for each chromatographi-
cally well-resolved analyte and is particularly useful when
Figure 3. Number of isomers per chemical formula in (a) observed analytes are in a complex mixture (Fig. S3). Consequently,
in this work in oxidation experiments and (b) available literature. this technique shows a significant advantage for understand-
Data in (b) are from ambient atmospheres in a ponderosa pine forest ing ionization chemistry. Previous work has demonstrated
in California measured by two-dimensional GC without derivatiza- that coupling a GC interface to a NO+ CIMS can determine
tion (Worton et al., 2017), southeastern USA by two-dimensional the products ion distributions for VOCs (Koss et al., 2016).
GC with derivatization (Zhang et al., 2018), and combined datasets This instrument complements this previous work by exam-
from SOA formation measured by liquid chromatography (Bryant ining less volatile and more oxidized compounds, as well as
et al., 2019; Dixon, 2020). The number, N , of formulas observed in
other CIMS chemistries. This technique is particularly inter-
each dataset is provided in the legend.
esting in the context of iodide CIMS chemistry, as it allows
us to explore ions with positive mass defects (i.e., non-adduct
tual molecular composition of SOA, though they neverthe- ions), which are not particularly well understood (Lee et al.,
less may provide insight into the formation mechanisms of 2014). We demonstrate the capability of the technique by
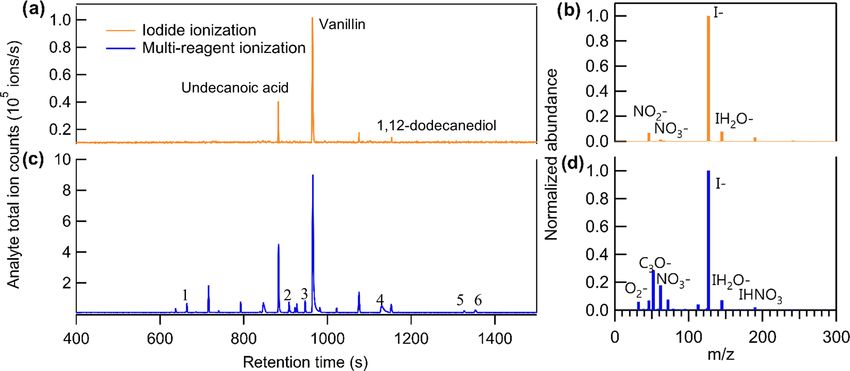
SOA (Isaacman-VanWertz et al., 2016). Consequently, the showing the chromatograms of a complex sample contain-
potential multiple fragments from one parent compound may ing a mixture of liquid chemical standards and six commer-
result in an overestimation of the number of isomers. We cially available fragrances in Fig. 4. Three known liquid stan-
note, however, that similar numbers of isomers are observed dards introduced in the mixture – undecanoic acid, vanillin,
when using liquid chromatography (Fig. 3b), which does not and 1,12-dodecanediol – are observed in iodide ionization
involve thermal desorption. Given these uncertainties, we be- mode using their iodide-adduct ion, i.e., [M + I]− (Fig. 4a).
lieve that the results presented are not a floor or a ceiling on However, while this mode is nominally dominated by ion-
the number of isomers in the atmosphere but a step toward ization by the iodide ion (Fig. 4b), other ions are observed
understanding a poorly constrained problem. In any case, in the mass spectrum of these standards, including the de-
the number of isomers observed by any single instrument protonated form of vanillin (i.e., [M − H]− ) and its nitrite
is expected to be underestimated as no instrument is capa- adduct (i.e., [M + NO2 ]− ), indicating that the iodide ioniza-
ble of measuring all atmospheric components with molec- tion mode used in these experiments includes declustering
ular speciation. The number of isomers shown in Fig. 3 is of iodide adducts for low-polarity analytes and/or side reac-
therefore likely more illustrative as an example than quan- tions. The CIMS voltage settings used in this study were not
titative, demonstrating the general ubiquity of isomers in optimized to minimize declustering of lower-polarity com-
the atmosphere. This issue raises significant questions the pounds like vanillin, leading to spectra of these compounds
atmospheric measurement community should address as to in which the iodide adduct significantly is significantly less
how isomers differ in their sources, physicochemical prop- dominant than the deprotonated form, even in iodide ion-
erties, instrument sensitivities, and atmospheric transforma- ization mode. However, it is a benefit of the GC-CIMS ap-
tions (Isaacman-VanWertz and Aumont, 2021). proach that a clean mass spectrum is obtained for each ana-
lyte within this complex mixture and is therefore a pathway
toward better understanding iodide adduct chemistry and co-
existing side reactions. Other than the introduced standards,
which were selected in part due to their tendency to form io-
dide adducts, few other major analytes are observed, despite
https://doi.org/10.5194/amt-14-3895-2021 Atmos. Meas. Tech., 14, 3895–3907, 20213902 C. Bi et al.: Coupled TAG-CIMS/FID for isomer-resolved chemical analysis
the co-introduction of multiple commercially available fra- abundance of non-adduct ions in multi-reagent ionization, all
grances known to contain many organic constituents. identified ions are plotted as a function of their exact mass
Using GC-CIMS not only enables the elucidation of dif- and mass defect for iodide ionization (Fig. 5a) and multi-
ferent ionization pathways in the CI source and enables sep- reagent ionization (Fig. 5b) with the marker area representing
aration of interferences in the quantification but might also the background-subtracted ion abundance. Analysis is lim-
be useful for exploiting these co-existing chemistries to yield ited to only ions that exhibit a chromatographic peak above
additional information. While chemical ionization intrinsi- the level of detection (taken as 10 times signal-to-noise ra-
cally offers selectivity for ease of analysis, selectivity is also tio in the chromatographic baseline) and with ion abundance
negatively limiting (Munson and Field, 1966). Thus, under higher than 1 % of the maximum signal across both systems.
certain circumstances it may be useful to use multiple reagent The results show that despite slight decreases in their abun-
ions to detect different classes of compounds using separate, dance, nearly all of the iodide-adduct ions (green markers
but still soft, ionization methods. Other ions like the deproto- within the dashed circle in Fig. 5a) are still present after
nated form of the analyte, [M − H]− spectra might be better switching to multi-reagent ionization mode. However, sig-
suited for the identification and quantification of some an- nals of non-iodide adduct ions observed in iodide ioniza-
alytes. The deprotonated ions are believed to be produced tion are enhanced significantly, even for lower-polarity com-
through the reaction with O− 2 present in the IMR (Dzidic pounds that exhibited non-iodide adduct ionization pathways
et al., 1975; Hunt et al., 1975). It is reported that the pres- in iodide ionization mode. Multi-reagent ionization also gen-
ence of O− 2 , which is commonly found in atmospheric pres- erates many new non-adduct ions. While shown summarily
sure ion sources such as electrospray ionization (ESI) (Has- as mass defect plots, it is important to remember that all
san et al., 2017), atmospheric pressure chemical ionization ions are not observed simultaneously but rather elute as chro-
(APCI) (McEwen and Larsen, 2009), atmospheric pressure matographic peaks comprised of some subset of ions. Fig-
photoionization (APPI) (Song et al., 2007), and direct analy- ure 5 consequently demonstrates that by using multi-reagent
sis in real time (DART) (Cody et al., 2005), may result in the ionization, identification of compounds with iodide-adduct
deprotonated molecules through oxidative ionization. There- signals can be maintained, while additional analytes are ac-
fore, using multiple reagent ions including I− and O− 2 , it cessed through these new ionization pathways, as demon-
is possible that low-polarity compounds tend to be ionized strated by the increase in peaks observed in Fig. 4c. Enhance-
through proton abstraction by O− 2 , while compounds with ment of these side reactions expands formula identifications
high polarity can still form iodide adducts. Although we did to compounds that do not strongly form iodide adducts in this
not find carbonate (as CO− −
2 and CO3 ) in the mass spectrum instrument, due either to inherent chemical limitations (e.g.,
in this study, we caution that those ions, like O− 2 , can also low polarity) or instrument operating conditions (e.g., adduct
deprotonate molecules and may interfere with the quantifica- declustering). For example, six peaks labeled in Fig. 4c are
tion of the deprotonated ions. not detected as iodide adducts but for which formulas can
To explore the feasibility of purposefully introducing mul- be assigned using [M − H]− and [M + O2 ]− as identifiers,
tiple simultaneous chemistries (e.g., deprotonation reactions i.e., 1: C15 H24 O, 2: C9 H10 O3 , 3: C12 H24 O2 , 4: C16 H32 O2 , 5:
in addition to iodide-adduct formation) to extend the util- C18 H34 O2 , and 6: C18 H36 O2 . The results suggest that the in-
ity of a CIMS with isomer resolution, the CIMS was oper- strument selectivity to other classes of compounds can be en-
ated in a multi-reagent ionization mode by adding 100 sccm larged by bringing in O− 2 as an additional reagent ion, with-
flow (i.e., 5 %) of ultra zero air to the 2 slpm flow of N2 for out significantly suppressing the iodide ionization pathway.
the gas supply of the methyl iodide permeation tube. Fig- In other words, the sensitivity of compounds that tend to be
ure 4b and d show the background ions under the two modes. ionized by O− 2 or other side reactions are significantly en-
With no sample introduced into the system (i.e., pure he- hanced in multi-ionization CIMS with only minor decreases
lium as GC effluent), the total ion counts are 2.4 × 10⁶ and in the sensitivity of compounds typically observed by an
1.4 × 10⁶ ions s−1 and the I− ion counts are 1.8 × 10⁶ and iodide-CIMS. As long as individual analytes enter the CIMS
0.7 × 10⁶ ions s−1 for iodide and multi-reagent ionization, at separate times, as in the case of chromatography, combin-
respectively. In other words, by mixing the reagent ion flow ing multiple ionization chemistries can provide additional in-
with 5 % air, the I− ion reduced by half, while the abundance formation or selectivity.
of additional reagent ions such as O− −
2 and NO3 increased by A reasonable objection to multi-reagent ionization is that
approximately an order of magnitude. the complexity of adding up signals in multiple ionization
As shown in Fig. 4c, for compounds that can be detected chemistry with variable sensitivities may prohibit reasonable
by iodide ionization, the total number of ions produced by CIMS quantification. However, using CIMS for identifica-
an analyte increased by a factor of 5 to 10 after switching to tion of unknowns by formula or other chemical information
multi-reagent ionization mode (note that the scale of y axis is valuable on its own, and quantification of many compo-
in Fig. 4c is a factor of 10 higher than that in Fig. 4a). This in- nents is achievable using the FID channel of this instrument.
crease in ions is observed to occur almost entirely through the This technique is likely only useful when analytes are in-
addition of new chemical pathways. To examine increases in dividually resolved (i.e., isomer resolution), as the result-
Atmos. Meas. Tech., 14, 3895–3907, 2021 https://doi.org/10.5194/amt-14-3895-2021C. Bi et al.: Coupled TAG-CIMS/FID for isomer-resolved chemical analysis 3903
Figure 4. Comparison of chromatograms of analyte total ion counts between (a) iodide ionization and (c) multi-reagent ionization. Com-
parison of background mass spectra between (b) iodide ionization and (d) multi-reagent ionization. The sample introduced in this run is the
mixture of liquid chemical standards and six commercially available fragrances.
of the competition between reagent chemistries in a multi-
reagent system is beyond the scope of this article.
4 Conclusions
We couple a thermal desorption aerosol gas chromatograph
with a chemical ionization mass spectrometer as a technique
for isomer-resolved analysis of particle-phase organics in the
air. The GC column effluent is also split and directed to a
FID, which provides a near-universal response to carbon-
containing analytes, to calibrate the compounds identified by
CIMS. We demonstrate that the TAG-CIMS/FID can mea-
sure compounds from liquid injections as well as compounds
in SOA generated in an oxidation flow reactor. By coupling a
TAG to a CIMS, the CIMS is enhanced with an additional di-
mension of information (resolution of individual molecules)
at the cost of time resolution (i.e., one sample per hour in-
stead of per minute). This trade-off may be valuable in am-
bient atmospheres, as the number of isomers per formula,
although subject to the positive bias during thermal decom-
position and the negative bias due to the vapor pressure limit
of the GC column, is observed in ambient samples and oxi-
Figure 5. High-resolution mass defect spectrum obtained for liq- dation experiments to be typically 2 to 5 and as high as 10 to
uid mixture samples in (a) iodide ionization mode and (b) multi- 20, depending on the instrument and the environment.
reagent ionization mode. The area of markers is proportional to the A key advantage of coupling a TAG to a CIMS is in char-
ion abundance. acterizing the reagent–analyte reactions occurring in the IMR
of a CIMS by resolving mass spectra of individual analytes
that might not be commercially available. While the iodide-
adduct ions do exist in the mass spectrum of individual an-
ing mass spectrum of the complete complex mixture would alytes, we also observe high abundance of non-adduct ions
be otherwise too difficult to interpret. We demonstrate here such as [M − H]− and [M + O2 ]− . Although such high abun-
an example of exploring new reagent chemistries: simulta- dance of [M − H]− may be partially resulted by the tuning-
neously using multiple reagent ions is only made possible driven declustering of low-polarity adduct ions, the observed
by the GC separation of analytes but expands the informa- non-adduct ions likely account for many ions in the non-
tion provided by this instrument. An in-depth understanding adduct region of the iodide valley. By separating analytes
https://doi.org/10.5194/amt-14-3895-2021 Atmos. Meas. Tech., 14, 3895–3907, 20213904 C. Bi et al.: Coupled TAG-CIMS/FID for isomer-resolved chemical analysis
chromatographically, these non-adduct ions can be used for Financial support. This research has been supported by the Al-
the identification of some compounds. These non-iodide ion- fred P. Sloan Foundation (grant no. P-2018-11129).
ization pathways can be further enhanced by the intentional
introduction of multiple reagent ions.
A multi-reagent ionization mode is investigated in which Review statement. This paper was edited by Mingjin Tang and re-
both zero air and iodide are introduced as reagent ions, to viewed by two anonymous referees.
examine the feasibility of extending the use of an individ-
ual CIMS for detection of a broader range of analytes. While
this approach reduces iodide-adduct ions by a factor of 2, References
[M − H]− and [M + O2 ]− ions produced from less polar
compounds increase by a factor of 5 to 10, improving their Aljawhary, D., Lee, A. K. Y., and Abbatt, J. P. D.: High-resolution
detection by CIMS. The method expands the range of chemi- chemical ionization mass spectrometry (ToF-CIMS): application
cal species that can be measured by CIMS without losing the to study SOA composition and processing, Atmos. Meas. Tech.,
advantage of identifying chemical formula using the iodide 6, 3211–3224, https://doi.org/10.5194/amt-6-3211-2013, 2013.
adducts. This novel multi-reagent approach is made possi- Arangio, A. M., Tong, H., Socorro, J., Pöschl, U., and Shiraiwa,
M.: Quantification of environmentally persistent free radicals and
ble by combining GC and CIMS detection together with co-
reactive oxygen species in atmospheric aerosol particles, Atmos.
measurements from FID. The advantage of simultaneously Chem. Phys., 16, 13105–13119, https://doi.org/10.5194/acp-16-
measuring FID signals for isomer-resolved quantification of 13105-2016, 2016.
iodide-CIMS sensitivity will be discussed in more detail in a Atkinson, R.: Atmospheric chemistry of vocs and nox, At-
forthcoming paper. Thus, taken together, the GC-CIMS/FID mos. Environ., 34, 2063–2101, https://doi.org/10.1016/S1352-
instrument is not only inherently valuable for its resolution 2310(99)00460-4, 2000.
of isomers in complex atmospheric samples but also for its Atkinson, R. and Arey, J.: Atmospheric degradation of
ability to characterize and calibrate known CIMS chemistries volatile organic compounds, Chem. Rev., 103, 4605–4638,
and to investigate novel and complex chemistries. https://doi.org/10.1021/cr0206420, 2003.
Bertram, T. H., Kimmel, J. R., Crisp, T. A., Ryder, O. S., Yatavelli,
R. L. N., Thornton, J. A., Cubison, M. J., Gonin, M., and
Data availability. All raw and processed data collected as part of Worsnop, D. R.: A field-deployable, chemical ionization time-
this project are available upon request. of-flight mass spectrometer, Atmos. Meas. Tech., 4, 1471–1479,
https://doi.org/10.5194/amt-4-1471-2011, 2011.
Brophy, P. and Farmer, D. K.: Clustering, methodology, and mech-
anistic insights into acetate chemical ionization using high-
Supplement. The supplement related to this article is available on-
resolution time-of-flight mass spectrometry, Atmos. Meas. Tech.,
line at: https://doi.org/10.5194/amt-14-3895-2021-supplement.
9, 3969–3986, https://doi.org/10.5194/amt-9-3969-2016, 2016.
Bryant, D. J., Dixon, W. J., Hopkins, J. R., Dunmore, R. E., Pereira,
K. L., Shaw, M., Squires, F. A., Bannan, T. J., Mehra, A., Wor-
Author contributions. CB led hardware design, instrumentation, rall, S. D., Bacak, A., Coe, H., Percival, C. J., Whalley, L.
data collection, and data analysis under the guidance of GIVW. K., Heard, D. E., Slater, E. J., Ouyang, B., Cui, T., Surratt,
GIVW, JEK, BML, and MRC contributed to the development of J. D., Liu, D., Shi, Z., Harrison, R., Sun, Y., Xu, W., Lewis,
the theory of the described approach. GIVW, GOF, JEK, JTJ, and A. C., Lee, J. D., Rickard, A. R., and Hamilton, J. F.: Strong
DRW contributed to hardware design and instrumentation. JEK, anthropogenic control of secondary organic aerosol formation
WX, ATL, and MSC contributed to data collection. CB prepared from isoprene in Beijing, Atmos. Chem. Phys., 20, 7531–7552,
the article with contributions by all authors. https://doi.org/10.5194/acp-20-7531-2020, 2020.
Buchholz, A., Ylisirniö, A., Huang, W., Mohr, C., Canagaratna, M.,
Worsnop, D. R., Schobesberger, S., and Virtanen, A.: Decon-
Competing interests. Jordan E. Krechmer, Wen Xu, Andrew T. volution of FIGAERO–CIMS thermal desorption profiles using
Lambe, Megan S. Claflin, Brian M. Lerner, John T. Jayne, Douglas positive matrix factorisation to identify chemical and physical
R. Worsnop, and Manjula R. Canagaratna are employed by Aero- processes during particle evaporation, Atmos. Chem. Phys., 20,
dyne Research Inc., which commercializes TAG and CIMS instru- 7693–7716, https://doi.org/10.5194/acp-20-7693-2020, 2020.
ments for geoscience research. Burnett, R. T., Pope, C. A., Ezzati, M., Olives, C., Lim, S. S., Mehta,
S., Shin, H. H., Singh, G., Hubbell, B., Brauer, M., Anderson, H.
R., Smith, K. R., Balmes, J. R., Bruce, N. G., Kan, H., Laden,
Acknowledgements. We would like to thank David Worton, Haofei F., Prüss-Ustün, A., Turner, M. C., Gapstur, S. M., Diver, W.
Zhang, Allen Goldstein, Jacqueline Hamilton, and William Dixon R., and Cohen, A.: An integrated risk function for estimating
for sharing their data, which is shown in Fig. 3. the global burden of disease attributable to ambient fine partic-
ulate matter exposure, Environ. Health Perspect., 122, 397–403,
https://doi.org/10.1289/ehp.1307049, 2014.
Claflin, M. S. and Ziemann, P. J.: Thermal desorp-
tion behavior of hemiacetal, acetal, ether, and es-
Atmos. Meas. Tech., 14, 3895–3907, 2021 https://doi.org/10.5194/amt-14-3895-2021C. Bi et al.: Coupled TAG-CIMS/FID for isomer-resolved chemical analysis 3905 ter oligomers, Aerosol Sci. Technol., 53, 473–484, ion chemical ionization mass spectrometry, J. Chem. Soc. Chem. https://doi.org/10.1080/02786826.2019.1576853, 2019. Comm., 151–152, 1975. Cody, R. B., Laramée, J. A., and Durst, H. D.: Versa- Hurley, J. F., Kreisberg, N. M., Stump, B., Bi, C., Kumar, P., Hering, tile new ion source for the analysis of materials in open S. V., Keady, P., and Isaacman-VanWertz, G.: A new approach for air under ambient conditions, Anal. Chem., 77, 2297–2302, measuring the carbon and oxygen content of atmospherically rel- https://doi.org/10.1021/ac050162j, 2005. evant compounds and mixtures, Atmos. Meas. Tech., 13, 4911– Dixon, W.: Quantitative analysis of secondary organic aerosol us- 4925, https://doi.org/10.5194/amt-13-4911-2020, 2020. ing a high-resolution mass spectral database, PhD dissertation, Isaacman, G., Kreisberg, N. M., Worton, D. R., Hering, S. University of York, York, UK, 2020. V., and Goldstein, A. H.: A versatile and reproducible auto- Dzidic, I., Carroll, D. I., Stillwell, R. N., and Horning, E. C.: Atmo- matic injection system for liquid standard introduction: applica- spheric pressure ionization (api) mass spectrometry: formation tion to in-situ calibration, Atmos. Meas. Tech., 4, 1937–1942, of phenoxide ions from chlorinated aromatic compounds, Anal. https://doi.org/10.5194/amt-4-1937-2011, 2011. Chem., 47, 1308–1312, https://doi.org/10.1021/ac60358a077, Isaacman, G., Kreisberg, N. M., Yee, L. D., Worton, D. R., Chan, 1975. A. W. H., Moss, J. A., Hering, S. V., and Goldstein, A. H.: On- Ehn, M., Junninen, H., Petäjä, T., Kurtén, T., Kerminen, V.-M., line derivatization for hourly measurements of gas- and particle- Schobesberger, S., Manninen, H. E., Ortega, I. K., Vehkamäki, phase semi-volatile oxygenated organic compounds by ther- H., Kulmala, M., and Worsnop, D. R.: Composition and tem- mal desorption aerosol gas chromatography (SV-TAG), Atmos. poral behavior of ambient ions in the boreal forest, Atmos. Meas. Tech., 7, 4417–4429, https://doi.org/10.5194/amt-7-4417- Chem. Phys., 10, 8513–8530, https://doi.org/10.5194/acp-10- 2014, 2014. 8513-2010, 2010. Isaacman-VanWertz, G. and Aumont, B.: Impact of organic molec- Goldan, P. D., Kuster, W. C., Williams, E., Murphy, P. C., Fehsen- ular structure on the estimation of atmospherically relevant feld, F. C., and Meagher, J.: Nonmethane hydrocarbon and physicochemical parameters, Atmos. Chem. Phys., 21, 6541– oxy hydrocarbon measurements during the 2002 new eng- 6563, https://doi.org/10.5194/acp-21-6541-2021, 2021. land air quality study, J. Geophys. Res.-Atmos., 109, 1–14, Isaacman-VanWertz, G., Yee, L. D., Kreisberg, N. M., Wernis, https://doi.org/10.1029/2003JD004455, 2004. R., Moss, J. A., Hering, S. V., De Sá, S. S., Martin, S. T., Goldstein, A. H. and Galbally, I. E.: Known and unexplored organic Alexander, M. L., Palm, B. B., Hu, W., Campuzano-Jost, P., constituents in the earth’s atmosphere, Environ. Sci. Technol., 41, Day, D. A., Jimenez, J. L., Riva, M., Surratt, J. D., Viegas, J., 1514–1521, https://doi.org/10.1021/es072476p, 2007. Manzi, A., Edgerton, E., Baumann, K., Souza, R., Artaxo, P., Goldstein, A. H., Daube, B. C., Munger, J. W., and Wofsy, S. C.: and Goldstein, A. H.: Ambient gas-particle partitioning of tracers Automated in-situ monitoring of atmospheric non-methane hy- for biogenic oxidation, Environ. Sci. Technol., 50, 9952–9962, drocarbon concentrations and gradients, J. Atmos. Chem., 21, https://doi.org/10.1021/acs.est.6b01674, 2016. 43–59, https://doi.org/10.1007/BF00712437, 1995. Isaacman-VanWertz, G., Sueper, D. T., Aikin, K. C., Lerner, B. M., Gómez-González, Y., Surratt, J. D., Cuyckens, F., Szmigielski, R., Gilman, J. B., de Gouw, J. A., Worsnop, D. R., and Goldstein, A. Vermeylen, R., Jaoui, M., Lewandowski, M., Offenberg, J. H., H.: Automated single-ion peak fitting as an efficient approach Kleindienst, T. E., Edney, E. O., Blockhuys, F., Van Alsenoy, C., for analyzing complex chromatographic data, J. Chromatogr. Maenhaut, W., and Claeys, M.: Characterization of organosul- A, 1529, 81–92, https://doi.org/10.1016/j.chroma.2017.11.005, fates from the photooxidation of isoprene and unsaturated fatty 2017. acids in ambient aerosol using liquid chromatography/(-) elec- Isaacman-Vanwertz, G., Massoli, P., O’Brien, R., Lim, C., Franklin, trospray ionization mass spectrometry, J. Mass Spectrom., 43, J. P., Moss, J. A., Hunter, J. F., Nowak, J. B., Canagaratna, M. R., 371–382, https://doi.org/10.1002/jms.1329, 2008. Misztal, P. K., Arata, C., Roscioli, J. R., Herndon, S. T., Onasch, Grob, R. L. and Barry, E. F. Modern practice of gas T. B., Lambe, A. T., Jayne, J. T., Su, L., Knopf, D. A., Goldstein, chromatography, 4th edition, John Wiley & Sons, Inc., A. H., Worsnop, D. R., and Kroll, J. H.: Chemical evolution of https://doi.org/10.1002/0471651141, ISBN 978-0-471-22983-4, atmospheric organic carbon over multiple generations of oxida- 2004. tion, Nat. Chem., 10, 462–468, https://doi.org/10.1038/s41557- Hamilton, J. F.: Using comprehensive two-dimensional gas chro- 018-0002-2, 2018. matography to study the atmosphere, J. Chromatogr. Sci., 48, Iyer, S., Lopez-Hilfiker, F., Lee, B. H., Thornton, J. A., and Kurtén, 274–282, https://doi.org/10.1093/chromsci/48.4.274, 2010. T.: Modeling the detection of organic and inorganic compounds Hassan, I., Pavlov, J., Errabelli, R., and Attygalle, A. B.: Ox- using iodide-based chemical ionization, J. Phys. Chem. A, 120, idative ionization under certain negative-ion mass spectromet- 576–587, https://doi.org/10.1021/acs.jpca.5b09837, 2016. ric conditions, J. Am. Soc. Mass Spectrom., 28, 270–277, Jimenez, J. L., Canagaratna, M. R., Donahue, N. M., Prevot, A. S. https://doi.org/10.1007/s13361-016-1527-5, 2017. H., Zhang, Q., Kroll, J. H., DeCarlo, P. F., Allan, J. D., Coe, Helmig, D., Ortega, J., Duhl, T., Tanner, D., Guenther, A., H., Ng, N. L., Aiken, A. C., Docherty, K. S., Ulbrich, I. M., Harley, P., Wiedinmyer, C., Milford, J., and Sakulyanontvit- Grieshop, A. P., Robinson, A. L., Duplissy, J., Smith, J. D., taya, T.: Sesquiterpene emissions from pine trees – identi- Wilson, K. R., Lanz, V. A., Hueglin, C., Sun, Y. L., Tian, J., fications, emission rates and flux estimates for the contigu- Laaksonen, A., Raatikainen, T., Rautiainen, J., Vaattovaara, P., ous united states, Environ. Sci. Technol., 41, 1545–1553, Ehn, M., Kulmala, M., Tomlinson, J. M., Collins, D. R., Cubi- https://doi.org/10.1021/es0618907, 2007. son, M. J., Dunlea, E. J., Huffman, J. A., Onasch, T. B., Al- Hunt, D., Harvey, M., and Russell, J.: Oxygen as a reagent gas for farra, M. R., Williams, P. I., Bower, K., Kondo, Y., Schnei- the analysis of 2,3,7,8-tetrachlorodibenzo-p-dioxin by negative der, J., Drewnick, F., Borrmann, S., Weimer, S., Demerjian, K., https://doi.org/10.5194/amt-14-3895-2021 Atmos. Meas. Tech., 14, 3895–3907, 2021
You can also read