Design and characterization of a new oxidation flow reactor for laboratory and long-term ambient studies - Recent
←
→
Page content transcription
If your browser does not render page correctly, please read the page content below
Atmos. Meas. Tech., 14, 2891–2906, 2021
https://doi.org/10.5194/amt-14-2891-2021
© Author(s) 2021. This work is distributed under
the Creative Commons Attribution 4.0 License.

Design and characterization of a new oxidation flow reactor for
laboratory and long-term ambient studies
Ningjin Xu1,2 and Don R. Collins1,2
1 Department of Chemical and Environmental Engineering, University of California Riverside, Riverside, CA 92521, USA
2 Collegeof Engineering – Center for Environmental Research and Technology (CE-CERT), University of California
Riverside, Riverside, CA 92507, USA

Correspondence: Don R. Collins (donc@ucr.edu)

Received: 15 September 2020 – Discussion started: 30 October 2020
Revised: 19 February 2021 – Accepted: 19 February 2021 – Published: 13 April 2021

Abstract. Oxidation flow reactors (OFRs) are frequently           efficiency is over 75 % in the size range from 50 to 200 nm,
used to study the formation and evolution of secondary            after minimizing static charge on the Teflon surfaces; (3)
aerosol (SA) in the atmosphere and have become valuable           the penetration efficiencies of CO2 and SO2 are 0.90 ± 0.02
tools for improving the accuracy of model simulations and         and 0.76 ± 0.04, respectively, the latter of which is compa-
for depicting and accelerating realistic atmospheric chem-        rable to estimates for LVOCs; (4) a near-laminar flow pro-
istry. Driven by rapid development of OFR techniques and          file is expected based on CFD simulations and suggested
the increasing appreciation of their wide application, we de-     by the RTD experiment results; (5) m-xylene SOA and α-
signed a new all-Teflon reactor, the Particle Formation Accel-    pinene SOA yields were 0.22 and 0.37, respectively, at about
erator (PFA) OFR, and characterized it in the laboratory and      3 × 10¹¹ molec. cm−3 s OH exposure; (6) the mass ratio of
with ambient air. A series of simulations and experiments         seed particles to precursor gas has a significant effect on the
were performed to characterize (1) flow profiles in the reac-     amount of SOA formed; and (7) during measurements of SA
tor using computational fluid dynamics (CFD) simulations,         production when sampling ambient air in Riverside, the mass
(2) the UV intensity distribution in the reactor and the influ-   concentration of SA formed in the reactor was an average of
ence of it and varying O3 concentration and relative humid-       1.8 times that of the ambient aerosol at the same time.
ity (RH) on the resulting equivalent OH exposure (OHexp ),
(3) transmission efficiencies for gases and particles, (4) res-
idence time distributions (RTDs) for gases and particles us-
ing both computational simulations and experimental verifi-       1   Introduction
cation, (5) the production yield of secondary organic aerosol
(SOA) from oxidation of α-pinene and m-xylene, (6) the ef-        Atmospheric aerosols play major roles in air pollution, global
fect of seed particles on resulting SA concentration, and (7)     climate change, and visibility reduction (Seinfeld and Pan-
SA production from ambient air in Riverside, CA, US. The          dis, 2006). The complex mixtures of inorganic and organic
reactor response and characteristics are compared with those      species present in atmospheric aerosols originate from both
of a smog chamber (Caltech) and of other oxidation flow re-       direct, or primary, emissions and production of secondary
actors: the Toronto Photo-Oxidation Tube (TPOT), the Cal-         aerosol (SA) from atmospheric reactions. Organic aerosol
tech Photooxidation Flow Tube (CPOT), the TUT Secondary           (OA) makes up a substantial fraction of atmospheric aerosols
Aerosol Reactor (TSAR), quartz and aluminum versions of           and is comprised of primary OA (POA) that is directly emit-
Potential Aerosol Mass reactors (PAMs), and the Environ-          ted in the particle phase and secondary OA (SOA) that is
ment and Climate Change Canada OFR (ECCC-OFR).                    formed in the atmosphere through reactions of gas phase pre-
   Our studies show that (1) OHexp can be varied over a range     cursors. SOA forms when the reaction of volatile organic
comparable to that of other OFRs; (2) particle transmission       compounds (VOCs) with gas phase oxidants produces less-
                                                                  volatile functionalized compounds (Pankow, 1994; Jimenez

Published by Copernicus Publications on behalf of the European Geosciences Union.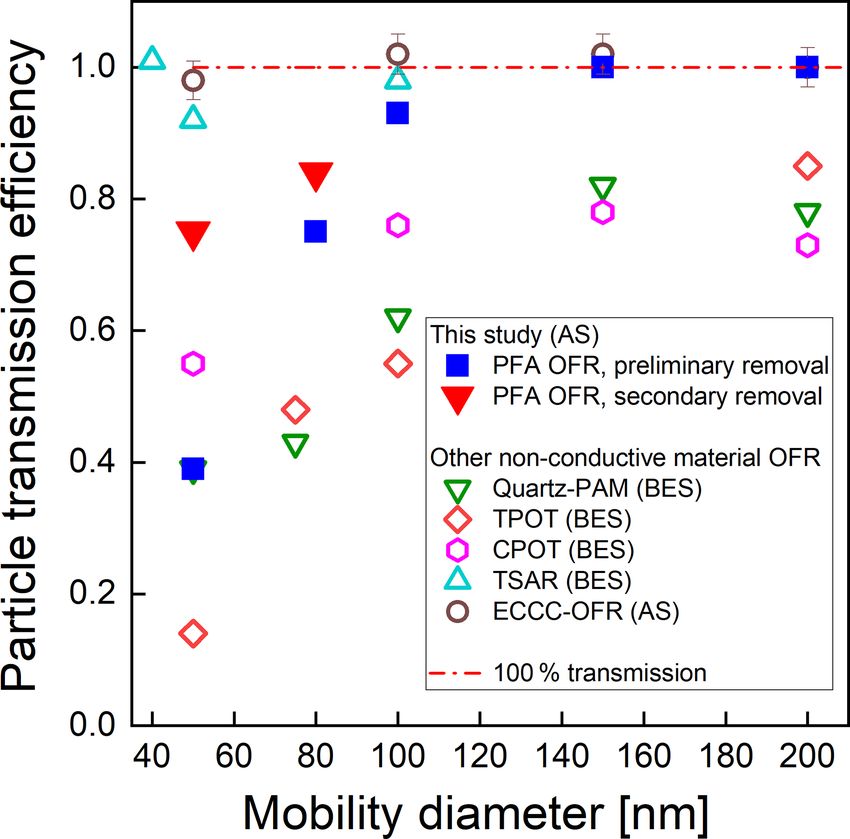
2892                                                    N. Xu and D. R. Collins: Design and characterization of a new OFR

et al., 2009; George and Abbatt, 2010) and when water-            as measuring time-resolved SOA formation from gasoline
soluble organics dissolve in the aqueous phase (aerosol wa-       vehicles during a transient driving cycle (Karjalainen et al.,
ter or cloud droplets) and are subsequently oxidized (Lim et      2016) and from rapidly changing vehicular emission sources
al., 2010; Ervens et al., 2011). However, the mechanisms of       (Simonen et al., 2017). Several groups have employed OFRs
SOA formation are still poorly understood and are continu-        to study SA formation from ambient air, with examples in-
ously extended and refined. Part of the complexity of SOA         cluding investigation of the variability of precursor gases
formation arises from the numerous oxidation reactions in-        and the resulting SOA in a ponderosa pine forest (Palm et
volving the large number of VOCs in the atmosphere (Al-           al., 2016), high-time-resolution quantification of SOA for-
jawhary et al., 2016). Additionally, after formation from pre-    mation from ambient air in central Amazonia (Palm et al.,
cursor gases the SOA can evolve through multiphase and            2018), and observation of SOA formation and aging from
multi-generational processes, forming more complex distri-        urban air (Ortega et al., 2016). For laboratory-based stud-
butions of compounds comprised of thousands of molecules          ies, the concentrations and SOA yield (Y ) for certain pre-
(Xu et al., 2015; Chen et al., 2018; Shrivastava et al., 2019).   cursors can serve as a reference to estimate total SOA po-
   For decades, comprehensive laboratory studies on the           tential (Iinuma et al., 2004; Loza et al., 2014). Yields deter-
sources, formation, and aging of SOA have been conducted          mined for common precursors can also provide a quantita-
in batch-mode atmospheric reactors, which are also known          tive measure of performance of a reactor relative to others of
as environmental chambers or smog chambers (Pandis et al.,        varying design and purpose (Kang et al., 2011; Lambe et al.,
1991; Carter et al., 2005; Song et al., 2005; Weitkamp et al.,    2015). Numerous studies have been conducted investigating
2007). Though such chambers can create environments that          differences in the SOA yield between OFRs and large envi-
closely simulate the complexity of the atmosphere, results        ronmental smog chambers (Matsunaga and Ziemann, 2010;
from their use are affected by the loss of particles and semi-    Bruns et al., 2015; Lambe et al., 2011, 2015). For exam-
volatile compounds to the walls (Zhang et al., 2014; Nah et       ple, Lambe et al. (2011) showed that the SOA yield they
al., 2016, 2017), by limitations on experiment duration and       observed in a PAM reactor is similar to that reported for
extent of reaction, and by potential leakage of room or out-      the Caltech smog chamber. Other studies focused on SOA
side air into the Teflon bags (Pierce et al., 2008; Matsunaga     produced from different precursor gas sources. For exam-
and Ziemann, 2010; Krechmer et al., 2015). Moreover, the          ple, Li et al. (2019) used a new OFR (the Environment and
size of common smog chambers, which typically range from          Climate Change Canada OFR; ECCC-OFR) to evaluate the
about 5 to 250 m3 (Lonneman et al., 1981; Mentel et al.,          SOA yields of single compounds (alkanes and α-pinene) and
1996; Wang et al., 2014; Tkacik et al., 2017), imposes a sub-     of complex precursor mixtures, such as emissions from oil
stantial restriction on their use for studying aerosol forma-     sands. Ahlberg et al. (2017) found that using single-precursor
tion in ambient air (Bruns et al., 2015). Oxidation flow re-      experiment yields could lead to underestimated SOA mass
actors (OFRs) have been developed as a complement to tra-         loadings if aerosol dynamics is not properly accounted for.
ditional smog chambers and offer advantages such as pro-          Cubison et al. (2011) characterized the evolution of labora-
viding oxidant exposure that can greatly exceed that pos-         tory biomass burning emissions using a PAM reactor, and
sible in smog chambers and is variable over a wide range          Kang et al. (2011) estimated the SOA-forming potential of
(Kroll et al., 2009), portability for use in the field (Wong et   model organic compounds.
al., 2011), and the ability to investigate time-varying sources      Reactor design is a critical step in the development of an
of SA (Kang et al., 2007). Inside an OFR, extremely high          OFR system and determines overall applicability and perfor-
concentrations of hydroxyl radical and/or other oxidants are      mance. The geometry and dimensions of the reactor have
maintained (up to 1010 molec. cm−3 for OH), such that sam-        substantial impacts on velocity profiles, residence time dis-
pled air experiences the equivalent of several hours to days      tributions, wall effects, and extent of reaction. The reactor
or even weeks of oxidative chemistry over the residence time      design mainly includes the selection of materials, the inlet
of just a few minutes. Shorter residence times minimize in-       configuration, the diameter-to-length ratio, the body length,
teraction of the gases and particles with walls (Keller and       the strategies for mixing the reactants, and the mode(s) of
Burtscher, 2012) and permit measurements of dynamic envi-         generating the hydroxyl radical or other oxidant(s). For ex-
ronments and sources. The portability and flexibility of OFRs     ample, some inlet designs can lead to dead zones near the
also make them versatile, with the same experimental system       reactor walls, increasing the difficulty of achieving laminar
applicable for a variety of laboratory and field measurements.    flow in the entrance of the reactor and broadening the resi-
Their fast response also makes them better suited than smog       dence time distribution (RTD) (Mitroo et al., 2018). The po-
chambers for experiments probing the influence of a matrix        sition and power output of the UV lamp(s) are determined
of parameters on SOA formation (Slowik et al., 2012; Palm         by the reactor materials and their transparency and by tem-
et al., 2018).                                                    perature control requirements during operation (Kang et al.,
   Previous investigations of potential SA formation using        2007; Ezell et al., 2010). With most OFRs, the lamps are ei-
different types of OFRs have resulted in optimized designs        ther mounted on the inner surface for metal-wall reactors or
and strategies for studying specific sources or processes, such   outside for quartz-based reactors. The emitted wavelengths

Atmos. Meas. Tech., 14, 2891–2906, 2021                                            https://doi.org/10.5194/amt-14-2891-2021
N. Xu and D. R. Collins: Design and characterization of a new OFR                                                            2893

and intensity uniformity of the UV lamp(s) are also impor-
tant considerations in reactor design (Li et al., 2015). Selec-
tion of wall materials and any surface treatments is guided by
an application-dependent balance of the importance of loss
of gas-phase compounds or delays in their transfer, loss of
charged particles to non-conductive materials, and UV trans-
mittance for designs for which the lamps are outside of the
reactor. Common materials used in OFRs include chromate-
coated aluminum (e.g., PAM), silicon-coated stainless steel
(e.g., TPOT), and quartz (e.g., CPOT, TSAR, and ECCC-
OFR). Recent studies of organic gas transmission through
common tubing types described by Deming et al. (2019) sug-
gest perfluoroalkoxy (PFA) and fluorinated ethylene propy-
lene (FEP) Teflon may be alternative choices for applications
for which minimizing wall losses of gases is a priority. Kang
et al. (2007) described the prototype PAM chamber, a 19 L
cylinder made of Teflon FEP film. To the best of our knowl-
edge, there are no previous studies describing that all-Teflon
OFR, and no data are available that show the advantages and
disadvantages of the all-Teflon reactor compared with those
constructed from other materials such as quartz and metal.
   Here we present the design of a new all-Teflon OFR called
the Particle Formation Accelerator or PFA OFR. The reac-
tor consists of a vertically oriented tube, with the inlet at the
bottom and outlet at the top. One notable design difference         Figure 1. Cutaway view of the PFA OFR.
between the PFA OFR and other OFRs is its use of a rel-
atively small and low power lamp at the top of the reactor,
which promotes thermal stratification and minimizes convec-
tive mixing. We report the results of computational, labora-        at the bottom and outlet at the top. The PFA tube has a vol-
tory, and field studies through which it was characterized.         ume of 7.5 L and dimensions of 151 cm length × 7.8 cm ID.
UV intensity and total OH exposure (OHexp ) were quantified         Both end caps have an OD of 10.2 cm and are sealed with
inside the flow tube. The flow profile in the OFR was mod-          the reactor tube by FEP-encapsulated O-rings. The small
eled and the resulting residence time distributions of gases        diameter-to-length ratio of the reactor section of 0.052 was
and particles were both modeled and experimentally veri-            selected to result in a narrow residence time distribution in
fied. Two precursor species were used to investigate SOA            the flow tube and a more uniform OH exposure (Lambe et
yield and the dependence of that yield on variations in pa-         al., 2011). However, the small diameter also results in a reac-
rameters such as precursor concentrations, OH exposure, and         tor surface-area-to-volume ratio of 0.53 cm−1 that is higher
the presence and concentration of seed particles. SOA mass          than that of the TPOT (0.33 cm−1 ) and PAM (0.23 cm−1 ).
yields are compared with those reported in the literature for          Some design elements of the PFA OFR are similar to
the same VOCs. Field testing was conducted by measuring             those of other recently developed OFRs (Kang et al., 2007;
SA formation in ambient air sampled in Riverside, CA, US.           Karjalainen et al., 2016; Huang et al., 2017), though there
Collectively, these tests confirm the utility of the PFA OFR        are some important differences as well. The inlet end cap
for both laboratory and field studies.                              has a 5.1 cm length × 1.3 cm ID bore used as the main sam-
                                                                    ple air injection port, two side injection ports for introduc-
                                                                    ing seed particles and O3 , and a cone-shaped diffuser. That
2     Design and experimental setup                                 cone, which serves as the transition between the inlet injec-
                                                                    tion port and the reactor tube, has an angle of 35◦ , which
2.1     Reactor design                                              is close to that suggested by Huang et al. (2017) for min-
                                                                    imizing recirculation. The sample flow gradually expands
2.1.1    PFA OFR and flow dynamic characterization                  and is expected to be fully developed shortly after entering
                                                                    the reactor tube. A single length of PFA tube (Ametek FPP
A cutaway view of the PFA OFR is shown in Fig. 1. It con-           P/N 33HPSC40x3.00) is used as the main body in order to
sists of a PFA-Teflon tube sealed between inlet and outlet end      simplify construction. Only the central ∼ 50 % of the flow
caps that were machined from blocks of polytetrafluoroethy-         through the reactor is extracted and analyzed. That sample
lene (PTFE). The reactor is oriented vertically, with the inlet     flow converges through an exit cone in the outlet end cap

https://doi.org/10.5194/amt-14-2891-2021                                             Atmos. Meas. Tech., 14, 2891–2906, 2021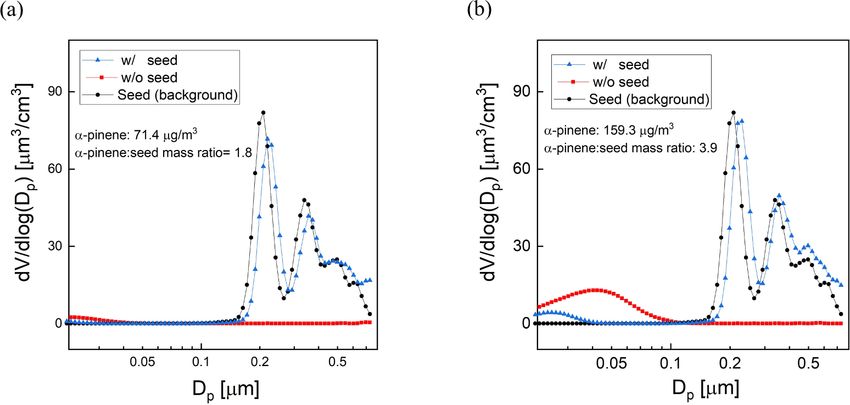
2894                                                    N. Xu and D. R. Collins: Design and characterization of a new OFR

that tapers at an angle of 24◦ from an ID of 4 cm to the
0.33 cm ID of the outlet bore through the top of the end cap.
The outer ∼ 50 % of the flow that is most influenced by in-
teractions with the reactor walls flows into an annulus sur-
rounding it. From there, it is pulled through 12 uniformly
spaced ∼ 0.15 cm ID pinholes drilled through the PFA pipe
about 3 cm from the top. The flow extracted through those
pinholes travels into a channel between the flow tube and the
end cap and then through a port on the top cap where it is
purged by a vacuum pump. The diameter of the opening into
the sample exit cone was selected such that, for the expected
parabolic velocity profile, the nominal 1 : 1 sample–side flow
ratio does not perturb gas streamlines.
   To characterize the flow field and velocity distribution
profile inside the PFA OFR, computational fluid dynam-
ics (CFD) simulations were performed using a 3D geom-
etry model in COMSOL Multiphysics 5.4 software, which
has been used by several research groups to optimize and
evaluate their reactor designs and to explore suitability for
applications in atmospheric and aerosol chemistry studies
(Renbaum-Wolff et al., 2013; Zhang et al., 2015; Huang et
al., 2017). The 2D geometry velocity profile simulation re-
sult is shown in Fig. 2. The simulation used the actual design    Figure 2. CFD simulation results of the velocity distribution in the
and dimensions of the PFA OFR. The flow at the entrance           PFA OFR.
to the sample outlet tube of the main body is assumed to be
fully developed and laminar, while an atmospheric pressure        such that emitted photons penetrate far down the reactor tube
boundary condition at the annular outflow boundary and the        as they are repeatedly reflected by the walls. The PFA tube is
no-slip condition at all the other boundaries were applied.       non-absorbing at 254 nm but is not opaque and would allow
Though high velocity extends into the central tube flow re-       UV to leak out. Thus, the tube is wrapped with an inner layer
gion above the inlet, within 15 cm from the entrance of the       of a highly reflective 0.32 cm thick expanded PTFE gasket
diffuser cone the velocity profile is nearly parabolic, with a    (ePTFE; Inertech) and an outer layer of aluminized Mylar
decrease in the maximum velocity over the entrance length         (Vivosun), though the combination of materials results in suf-
from 12 to 3 cm s−1 . The simulation suggests that jetting is     ficiently high reflectance for the 254 nm emission peak of a
minimal and that the area influenced by recirculation is neg-     mercury lamp. Silva et al. (2010) showed that the reflectance
ligible.                                                          of ePTFE at 175 nm is significantly lower, with the differ-
                                                                  ence thought to be due to absorption by O2 trapped in pores.
2.1.2   UV source and intensity profile                           Reflectance at the 185 nm emission peak of a mercury lamp
                                                                  is expected to be slightly higher than that at 175 nm, but it
The outlet end cap has NPT thread ports to accommodate one        is likely that a significant intensity gradient would still exist
or two 0.5 cm OD lamps. For the results discussed here, one       and so a 254 nm only lamp is used, and ozone is generated
5.1 cm length × 0.5 cm OD ozone-free (254 nm only) low-           externally and introduced with the sample flow. The high re-
pressure mercury lamp (BHK Inc; PN 80-1057-01) was in-            flectance of the ePTFE at 254 nm directs UV back into the
serted into the cap. Though the lamp is not isolated from the     reactor tube and results in increased intensity and uniformity.
flow, its position in the side purge flow annulus prevents any    This illumination approach reduces power consumption and
contact between it and the sampled flow. The handle of the        heat generation, thereby simplifying temperature control and
UV lamp is secured and sealed with a Swagelok male con-           long-term deployment for use in the field.
nector fitting. Use of a relatively small and low power lamp at
one end of the reactor is perhaps the most significant design     2.1.3   Temperature control
difference between the PFA OFR and others. One objective
of the approach was to promote thermal stratification caused      Temperature uniformity within an OFR and temperature sta-
by the hot lamp at the top of the reactor in order to minimize    bility over time impact overall performance. Incomplete re-
convective mixing. An obvious complication is that UV in-         moval of the lamp heat can cause convective mixing through
tensity, and therefore OH production, is expected to decay        the reactor, resulting in increased loss of particles and gases
with distance through the long reactor tube. To mitigate that     and broadening of the RTD (Lambe et al., 2011; Mitroo
decay, materials were selected that are highly UV reflective,     et al., 2018). Techniques used to minimize heating by the

Atmos. Meas. Tech., 14, 2891–2906, 2021                                             https://doi.org/10.5194/amt-14-2891-2021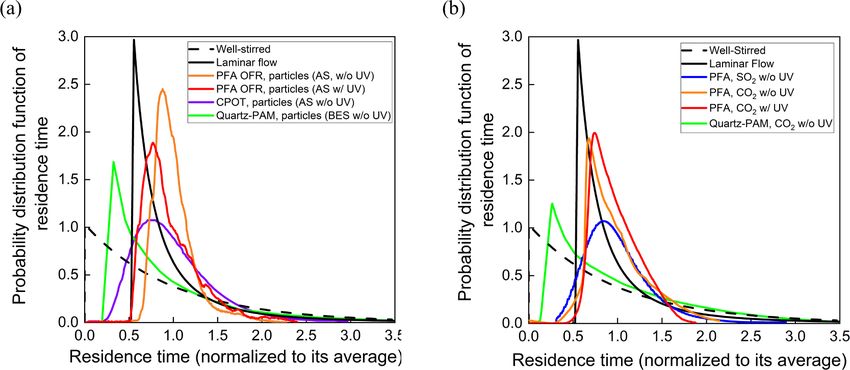
N. Xu and D. R. Collins: Design and characterization of a new OFR                                                           2895

lamps include enclosing them in sleeves that are continu-        analyzer, an SO2 analyzer (Teledyne Model T100UP), and a
ously flushed with N2 , but continuously controlling temper-     gas chromatograph with flame ionization detector (GC-FID,
ature during long-term field studies can still be challenging    SRI Inc. Model 8610C). A 0.95 cm OD stainless tube was
(Li et al., 2019). The PFA OFR assembly is protected by a        connected to the other leg of the tee and carried the aerosol
shell made from 13 cm × 13 cm square aluminum tube. Two          exiting the reactor to a fabricated scanning mobility parti-
U-bolts mounted through the surface of the aluminum shell        cle sizer (SMPS), which measured the particle size distribu-
hold the reactor securely, preventing accumulation of static     tion roughly once every 4 min. For the ambient air experi-
charge that could otherwise result from shifting between the     ments, outdoor air was brought inside the lab and to the PFA
reactor body and the ePTFE and Mylar layers. The shell also      OFR with a 200 cm length × 0.95 cm OD anti-static PFA tube
provides a barrier to reduce the accumulation of static charge   (Fluorotherm H2 PFA). A 150 cm × 0.95 cm OD length of
from inadvertent touching or other contact. A total of four      copper tube was used as a bypass in parallel with the OFR,
fans are mounted on opposite faces near the top and bot-         with sampling alternated between the two through the use
tom of the shell. The fans near the bottom bring air into the    of an automated three-way valve. The residence time of the
space between the reactor and the shell and those near the top   bypass line was approximately 2 s. Instrument operation and
exhaust it, which removes heat generated by the low-power        experimental sequencing were controlled using National In-
UV lamp and weakens the temperature gradient through the         struments LabVIEW software.
whole system. The average working temperature for the tests         The total flow rate for the laboratory tests was 3.5 L min−1 ,
reported below was approximately 23.6 ◦ C, which is close to     corresponding to an average residence time of 130 s, while
the average room temperature of 22.7 ◦ C. A temperature rise     those of the PAM, TPOT, and CPOT are about 100, 110, and
of less than 2 ◦ C was observed during continuous operation      1500 s, respectively. A purge flow rate of 1.5 L min−1 was
over several days.                                               extracted from the annulus outside of the sample exit cone as
                                                                 described above. The ambient experiments were conducted
2.2   Experimental setup                                         using a slightly lower flow rate of 3 L min−1 , resulting in a
                                                                 residence time of 150 s, and with a 1.5 L min−1 purge flow.
The PFA OFR is an OFR254-type oxidation flow reactor,
in which O3 must be generated externally and introduced          2.3   RTD experiments
with the sample flow (Li et al., 2015). Among the advan-
tages of OFR185-type oxidation flow reactors is their ability    The residence time distributions of particles and gases were
to be operated without an inlet, which is often desirable for    experimentally characterized and compared with results ob-
field investigations. As noted above, reflectance of 185 nm      tained from an ideal laminar flow model simulation. The ex-
UV by the ePTFE is insufficient to produce the intensity and     perimental configuration is illustrated in Fig. 3a. Monodis-
spatial uniformity required to rely on photolysis of O2 and      perse ammonium sulfate (AS) particles were generated by
H2 O for generation of O3 and OH. Instead, the OH radi-          atomizing a 0.04 M aqueous AS solution with an atomizer
cals are produced as the 254 nm UV radiation photolyzes          (TSI Inc. Model 3076). The atomized particles were dried by
O3 introduced with the sample to generate excited oxygen         directing them through a silica gel/molecular sieve diffusion
atoms, O(1 D), which then react with H2 O in ambient air or      column. The size of the particles was selected using a differ-
humidified laboratory air. For the laboratory experiments de-    ential mobility analyzer (DMA). The aerosol was brought to
scribed here, O3 and humidified zero air were mixed with         a steady state charge distribution before and after size classi-
the tracer or precursor gas(es) prior to being introduced into   fication by the DMA using soft X-ray neutralizers. The resi-
the reactor inlet. The schematic of the PFA OFR and asso-        dence time distributions (RTDs) for particles were character-
ciated experimental equipment for laboratory and field ex-       ized by introducing 30 s pulses of 200 nm AS particles into
periments are shown in Fig. 3a and b, respectively. Ozone        the PFA OFR while measuring the particle counts in the out-
was produced by flowing zero air through an O3 generator         let flow with a condensation particle counter (CPC, TSI Inc.
(Jelight Company Inc. Model 610). The flow rate was con-         Model 3762).
trolled to 0.4 L min−1 and the O3 mixing ratio was moni-             RTDs for gases were characterized by injecting 10 s pulses
tored by an O3 analyzer (Teledyne Model T400U). The re-          of SO2 and CO2 . Pulses of a compressed gas mixture con-
sulting O3 concentration can be easily and precisely adjusted    taining 27.5 ppm SO2 in nitrogen (Airgas) were injected into
by changing the position of a sleeve that covers a portion of    a continuous zero air flow, with the pulse width controlled
the UV lamp or by adjusting the flow rate of air through the     by opening and closing a mass-flow controller (Alicat Scien-
generator. When used, seed particles were generated using        tific, PN MC-100SCCM-D/5M). The SO2 concentration was
an atomizer and differential mobility analyzer (DMA), as is      monitored from the sampling outlet of the PFA OFR with
described in the RTD experiment section. The flow at the out-    an SO2 analyzer. Prior to the measurements, the reactor was
let of the reactor was split using a Swagelok tee. From one      purged with zero air for as long as required to reach a mea-
leg of the tee a 150 cm length × 0.635 cm OD PFA tube was        sured SO2 mixing ratio that was stable at less than 0.5 ppb.
connected to gas measurement instruments including the O3        To test the response function of a gas that would not react

https://doi.org/10.5194/amt-14-2891-2021                                           Atmos. Meas. Tech., 14, 2891–2906, 2021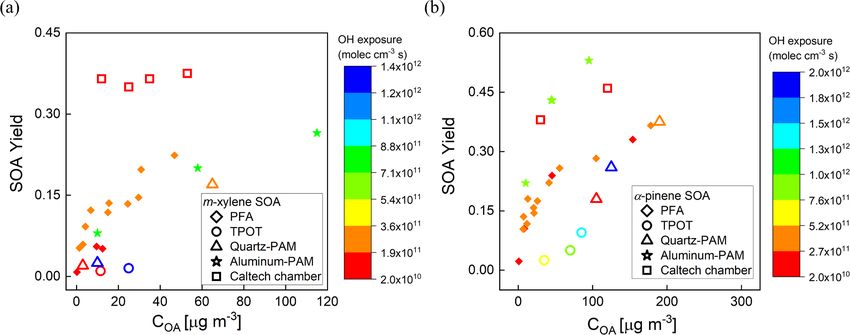
2896                                                      N. Xu and D. R. Collins: Design and characterization of a new OFR

Figure 3. Schematic diagram of the PFA OFR and associated experimental setup for (a) the laboratory and (b) field experiments.

on or be taken up by the walls, 10 s pulses of CO2 were in-           (TSI Inc. Model 3760A). After a set of initial tests, the static
jected from a custom-made CO2 tank, with the pulses con-              charge on the PFA, PTFE, and ePTFE surfaces was mini-
trolled by manually opening and closing a valve. The CO2              mized by pushing concentrated bipolar ions generated with
concentration was measured at the outlet of the PFA OFR by            an electronic ionizer (Simco-Ion Inc., Fusion) through and
a CO2 /H2 O gas analyzer (Li-COR Biosciences, Model Li-               around the flow tube for more than 12 h. Additional mea-
840A). A CO2 background of 400 ppm was subtracted from                surements of 50 and 100 nm particles were made after min-
the results because it was not removed by the zero air gener-         imizing the static charge. The measurements were repeated
ator. The residence time distributions of both gases and parti-       2 or 3 times for each particle size, with agreement between
cles were determined with the UV lamp turned on and turned            measurements found to be to within ±5 % when sampling
off. The whole process described above was repeated three             the same diameter.
times.                                                                   Gas losses were determined by continuously injecting gas
                                                                      mixtures containing CO2 and SO2 and measuring the ratio of
2.4    Gas and particle loss quantification                           the concentrations downstream and upstream of the reactor
                                                                      with the CO2 and SO2 analyzers identified above. For the
Particle losses in the reactor were characterized using AS            SO2 transmission efficiency tests, the PFA OFR walls were
particles within the diameter range from 50 to 200 nm. The            first passivated by flowing SO2 gas through the OFR for at
monodisperse AS particles were size-selected by a DMA and             least 15 min and until a stable concentration was measured
then passed through a soft X-ray neutralizer after size clas-         by the SO2 analyzer connected to the outlet.
sification. Upon exiting the neutralizer, the size-dependent
fraction of particles that possess at least one positive or neg-      2.5    UV intensity profile and OH exposure level
ative charge varies from about 41 % for 50 nm particles to
71 % for 200 nm particles (Wiedensohler, 1988). The flow              The 254 nm intensity at multiple positions inside the reac-
rate through the reactor was kept at 3.5 L min−1 .                    tor was examined using a spectroradiometer (OceanView,
   Particles were directed through the reactor or through a           Model USB4000 UV-FL) via a fiber-optic cable. The influ-
150 cm length × 0.95 cm OD copper tube bypass, with sam-              ence of the reflective material(s) wrapped around the flow
pling alternated between the two through the use of an auto-          tube was assessed by measuring when it was wrapped only
mated three-way valve. The particle transmission efficiency           with aluminum-coated Mylar and when it was wrapped with
was calculated from the ratio of the particle concentrations          a combination of a ePTFE gasket (inner layer) and Mylar
measured at the outlets of the reactor and bypass using a CPC         (outer layer). The OH production rate and corresponding

Atmos. Meas. Tech., 14, 2891–2906, 2021                                                  https://doi.org/10.5194/amt-14-2891-2021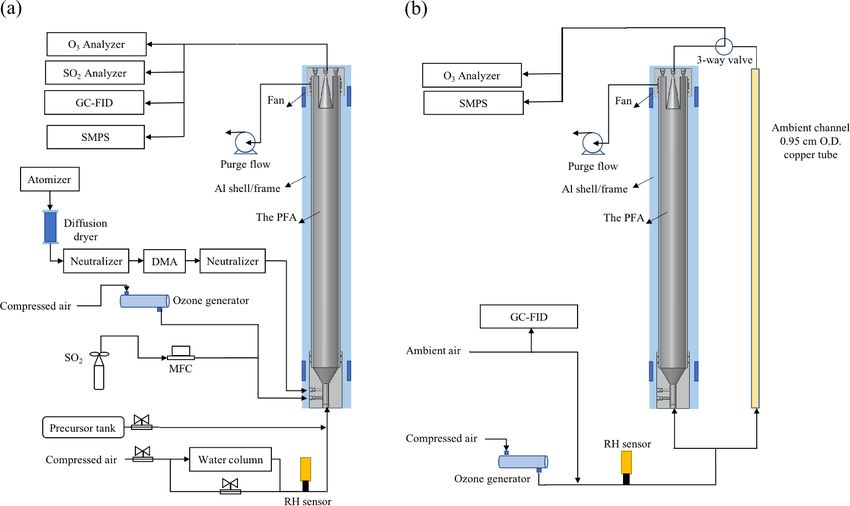
N. Xu and D. R. Collins: Design and characterization of a new OFR                                                             2897

equivalent exposure was varied by changing the UV inten-            the exit of the OFR and known RH using a photochemical
sity, RH, and injected O3 concentration. Here, OHexp is de-         model used in previous studies (Li et al., 2015; Peng et al.,
fined as the OH concentration (molec. cm−3 ) multiplied by          2015, 2019). The input photon flux of the model was ad-
the mean residence time of the sample in the reactor. The UV        justed to match the measured ozone concentration and OH
intensity from the lamp was controlled over a range of 50 %         exposure, which resulted in a maximum photon flux esti-
to 100 % using a lamp manager (BHK. Inc, PN IM10003) by             mate of ∼ 2.4 × 10¹⁴ photons cm−2 s−1 and 1.1 × 10¹⁵ with-
stepping the control voltage from 0 to 5 V. The O3 concen-          out and with the ePTFE layer, resulting in about 1.5 and
tration in the reactor was varied by adjusting the position of      7 times, respectively, that calculated from the lamp output
a sleeve over the lamp in the ozone generator. To quantify          power when neglecting any reflection. The OH concentra-
OHexp , SO2 was injected with initial mixing ratios ranging         tion and resulting OHexp were varied by varying the UV in-
from 150 to 250 ppb. For each test, the UV lamp was initially       tensity, the added O3 concentration, and the RH. Figure 5
off and was turned on only after the SO2 concentration mea-         shows the sensitivity of OH exposure as a function of photon
sured at the outlet was stable. After the lamp was turned on,       flux at 254 nm with and without ePTFE wrapped around the
the concentration of SO2 was monitored at the reactor out-          flow tube. Without the ePTFE wrap around the reactor (black
let. The distribution of the O3 and OH within the PFA OFR           solid symbols), the OH concentration ranged from approxi-
was not measured in the current study. Future studies will be       mately 1.3 × 10⁸ to 2.2 × 10⁹ molec. cm−3 . The correspond-
designed to investigate their profiles that result from that of     ing OHexp ranges from 2 × 10¹⁰ to 3.3 × 10¹¹ molec. cm−3 s,
UV. The typical concentration pattern observed is shown in          which is approximately equivalent to 0.15 to 2.5 d of at-
Fig. S1. OH exposure was quantified for each UV lamp in-            mospheric exposure based on the reference average OH
tensity and O3 concentration combination using Eqs. (1) and         concentration of 1.5 × 10⁶ molec. cm−3 . The increased re-
(2) (Davis et al., 1979; Atkinson et al., 2004). The procedure      flectance and UV intensity with the ePTFE wrap (red solid
was repeated 2 or 3 times at each UV intensity.                     symbols) resulted in a maximum OHexp of approximately
                                                                    1.1 × 10¹² molec. cm−3 s, equivalent to 8.5 d of atmospheric
d[SO2 ]/dt = −kOH−SO2 [OH][SO2 ]                             (1)    OH exposure, for the same RH (40 %) and O3 mixing ratio
         −1
OHexp = kOH−SO   × ln[SO2 ]0 /[SO2 ]f                        (2)    (3.3 ppm). Overall, the highly reflective (and non-absorbing)
               2
                                                                    materials used result in OH exposure comparable to that in
                                                                    other OFRs despite the use of a relatively low power output
Here, kOH−SO2 is 9 × 10⁻¹³ cm3 molec.−1 s−1 , [SO2 ]0 and
                                                                    lamp.
[SO2 ]f are SO2 concentrations measured at the reactor outlet
without and with the UV lamp turned on.
                                                                    3.2   Gas and particle transmission efficiency

3     Results and discussions                                       Figure 6 shows the transmission efficiency of AS particles
                                                                    with mobility diameter ranging from 50 to 200 nm. As stated
3.1    UV intensity distribution and OHexp level                    above, particle transmission efficiency is calculated as the ra-
                                                                    tio of the concentration exiting the reactor to that exiting a
The normalized UV intensity as a function of distance from          copper tube bypass. Concentrations measured upstream and
the lamp located at the top of the reactor is shown in Fig. 4a.     downstream of the copper tube agreed within ±1 %, confirm-
The normalized UV intensity is calculated as the intensity at       ing minimal loss in the bypass line. We performed two sets
a specified position divided by the maximum measured in-            of tests: first, following the removal of static charge on the
side the PFA OFR. As expected, an intensity gradient exists,        inner surface of the reactor tube (preliminary removal pro-
with decreasing intensity with distance from the lamp. The          cess), and second, following the additional removal of static
gradient is much steeper when the flow tube is not wrapped          charge between the ePTFE/Mylar wrap and the outer surface
with the ePTFE gasket. Without the ePTFE gasket, the inten-         of the reactor tube (secondary removal process). The parti-
sity near the bottom of the tube is only 15 % of that at the        cle transmission efficiency after removal of only the charge
top. Adding the ePTFE resulted in an intensity 30 cm from           on the inner surface of the tube was 0.39, 0.75, and 0.93
the bottom that was approximately 5 times higher than that          for 50, 80, and 100 nm diameter particles, respectively. With
with only the Mylar. The relative UV intensity enhancement          the removal of the static charge on the outer surface of the
(ERIntensity ) is shown as a function of position in Fig. 4b. The   tube, the transmission efficiency of 50 nm and 80 nm parti-
UV intensity is enhanced by a factor of between about 2 and         cles increased from 0.39 to 0.75 and from 0.75 to 0.84, re-
6 with the addition of the ePTFE layer. In addition to increas-     spectively. Each experiment was repeated twice, with agree-
ing the average UV intensity, the use of the reflective gasket      ment within ±10 % when sampling the same particle size
reduced the gradient in intensity, resulting in more uniform        and with the same flow rate. These results indicate that loss
OH generation throughout the reactor.                               of small particles in the reactor can be significantly reduced
   The maximum photon flux (with the maximum lamp                   by minimizing the static charge on both the inner and outer
power) was estimated for ozone concentration measured at            surfaces of the reactor tube. The similarity in the result-

https://doi.org/10.5194/amt-14-2891-2021                                              Atmos. Meas. Tech., 14, 2891–2906, 2021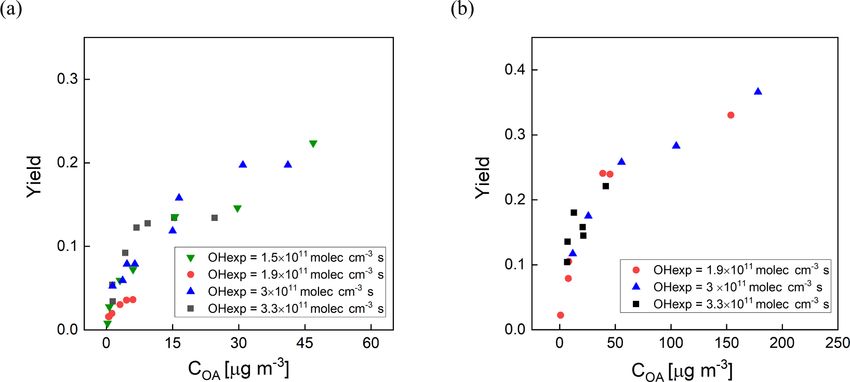
2898                                                      N. Xu and D. R. Collins: Design and characterization of a new OFR

Figure 4. Relative UV intensity profile (a) and intensity enhancement (b) achieved when the flow tube was wrapped with a reflective ePTFE
gasket.

Figure 5. Variations in the concentration of OH as a function of
photon flux at 254 nm with (red solid points) and without ePTFE        Figure 6. Measured particle transmission efficiency of the PFA
(black solid points) wrapped around the flow tube. Both experi-        OFR, quartz PAM and TPOT (Lambe et al., 2011), CPOT (Huang
ments were done with the same OH reactivity.                           et al., 2017), TSAR (Simonen et al., 2017), and ECCC-OFR (Li
                                                                       et al., 2019) flow reactors as a function of mobility diameter for
                                                                       bis(2-ethylhexyl) sebacate (BES) and ammonium sulfate (AS). Our
ing 36 % of the 50 nm particles that are no longer lost and            results are shown as blue squares and red triangles.
the 41 % of those 50 nm particles that are expected to be
charged (Wiedensohler, 1988) suggests electrostatic loss was
minimal after the static charge was minimized. Comparison
with the particle transmission efficiency of other types of            mission efficiency through the TSAR and the ECCC-OFR
flow tube reactors with non-conductive wall materials is in-           is 5 %–25 % higher than for the PFA-OFR, though at least
cluded in Fig. 6. The PAM reactor referenced is the horizon-           some of this difference is caused by the longer residence time
tal 46 cm length × 22 cm ID glass cylindrical chamber with a           of the PFA OFR than that of the other two reactors.
volume of 15 L that was described by Lambe et al. (2011),                 The experimental configuration used to measure the loss
hereafter referred to as the quartz PAM. The results show              of SO2 and CO2 is similar to that used to characterize
that the particle transmission efficiencies through the PFA            the gas RTD. The penetration efficiencies of CO2 and SO2
OFR, TSAR, and ECCC-OFR are higher than those for the                  were 0.90 ± 0.02 and 0.76 ± 0.04, respectively. The wall
quartz PAM, TPOT, and CPOT reactors, which may in part                 loss for most precursor species is expected to be equal to
be due to their use of similar cone-shaped inlets and of cen-          or less than the 24 % found for SO2 because it is a good
terline sampling. The particle transmission efficiencies of the        surrogate for wall-adhering species (Lambe et al., 2011;
quartz PAM, CPOT, and TPOT for 50–100 nm particles are                 Ahlberg et al., 2017; Huang et al., 2017). For comparison,
30 %–50 %, 15 %–25 %, and 35 %–65 % lower than that of                 Lambe et al. (2011) reported that the measured CO2 and
the PFA-OFR, respectively. On the other hand, the trans-               SO2 transmission efficiencies for the TPOT were 0.97 ± 0.10

Atmos. Meas. Tech., 14, 2891–2906, 2021                                                  https://doi.org/10.5194/amt-14-2891-2021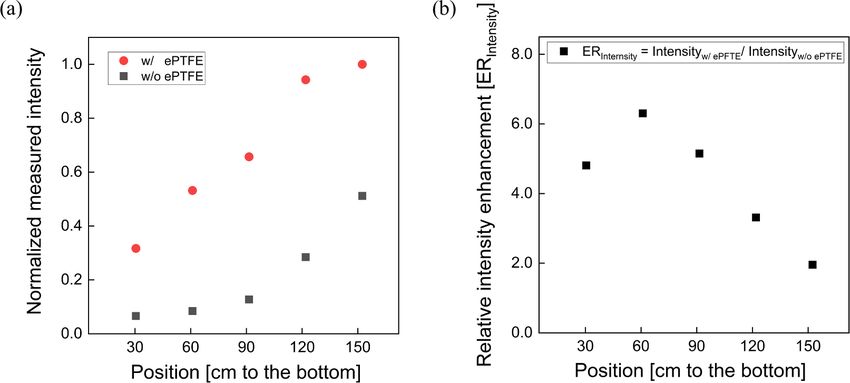
N. Xu and D. R. Collins: Design and characterization of a new OFR                                                           2899

and 0.45 ± 0.13, respectively, and for the quartz PAM were        near the outlet. The RTDs measured with the UV lamp turned
0.91 ± 0.09 and 1.2 ± 0.4, respectively.                          on are only slightly broader than those with it turned off. Pre-
   The fate of low-volatility organic compounds (LVOCs)           vious studies report that UV lamps broaden the RTD because
that can condense onto particles, stick to the reactor walls,     they heat the reactor walls and enhance convection inside the
react with OH, or exit the reactor before condensing can be       reactor (Simonen et al., 2017). Significant degradation is not
evaluated using the approach described by Palm et al. (2016).     observed in the PFA OFR, presumably because of the use
Based on the simple model they present, LVOC wall losses          of a comparatively low-power light source, circulation of air
for the PFA OFR have an upper limit of approximately 30 %         through the reactor housing, and the reactor being oriented
for a residence time of 130 s, which is comparable to that        vertically with the lamp at the top to promote stratification
observed for SO2 (24 %). Although the LVOC fate method            and to minimize convective mixing. Reversible uptake by the
is strongly dependent on the design and the geometry of the       walls is responsible for the broader RTD for SO2 relative to
reactor, the consistency between the estimated loss and that      that for CO2 .
measured for SO2 suggests the value is a reasonable esti-            We also investigated the effect of the ratio of the sample to
mate of the vapor loss for our design. Losses of some gases       side flow on the RTD for AS particles. The condition without
are expected to be greater in this OFR than in most others        the side purge flow was numerically simulated in COMSOL
because of its larger surface-area-to-volume (A/V ) ratio of      5.4 by coupling the Laminar Flow and the Transport in Di-
0.53 cm−1 , which is greater than that of the PAM reactor,        lute Species packages. This result is compared with the RTD
while the mean residence times of the two are similar. How-       of that obtained experimentally with different sample–side
ever, losses of some gases may be lower as well because only      flow ratios in Fig. S2. The experimental results show the im-
the central core flow is subsampled, all Teflon materials are     provement in RTD response as the sample–side flow ratio
used, and, as is described in the next section, the RTD is com-   is decreased. We expect future efforts to include simulation
paratively narrow, which suggests less mixing than in other       studies, such as the model-derived relationship between the
OFRs.                                                             sample–side flow ratio and the losses of particles and gases.

3.3   Gas and particle residence time distributions               3.4   SOA yield measurements

The residence time probability distribution functions for par-    Secondary organic aerosol yields (Y ) are defined as the mass
ticles and gases are shown in Fig. 7a and b. Reporting the        of OA formed (1COA ) per reacted precursor mass (1HC)
results as normalized distribution functions facilitates com-     (Odum et al., 1996). The measured yields of m-xylene and
parison of the flow characteristics of reactors of different      α-pinene SOA as a function of OH exposure and organic
shapes and sizes. RTDs of idealized devices and those re-         aerosol concentration (COA ) are shown in Fig. 8a and b.
ported for CPOT and quartz PAM are also shown in Fig. 7a          Here, the SOA yields are corrected for size-dependent gas
and b for comparison (PAMWiki, 2020). The residence time          and particle losses, with an average magnitude of the com-
probability distribution function is defined as the normalized    bined correction of 25 %. For comparison, the magnitude
measured concentration (Cout (t)) divided by the total area of    of the particle wall loss correction of the PAM reactor was
the normalized pulse (Fogler, 2006; Simonen et al., 2017), as     32 % ± 15 % (Lambe et al., 2015). The COA was calculated
described in Eq. (3) below. The average residence time was        by multiplying the volume concentration measured with an
calculated as the summation of the product of the measured        SMPS by an assumed density of 1.2 g cm−3 . The mixing
concentration and the corresponding residence time, all di-       ratios of m-xylene and α-pinene introduced into the PFA
vided by the total area of the pulse.                             OFR were in the ranges of 20–118 and 13–145 ppb, respec-
                 Cout (t)                                         tively. The OHexp was not measured simultaneously during
PDF (t) =                                                  (3)    the yield experiments, but applying the OFR254 OH expo-
            R∞
                 Cout (t)dt                                       sure estimation equation as a function of O3 , RH, and UV
            0                                                     lamp power (Peng et al., 2015) and the assumption that the
                                                                  OH reactivity was the same for both sets of measurements
   The residence time distributions of particles and gases in     resulted in estimated values that are consistent with the mea-
the PFA OFR shown in Fig. 7a and b approach those ex-             sured OHexp described in Sect. 3.1. As expected, the SOA
pected for laminar developed flow. Measured RTDs for both         yield was observed to be dependent on OH exposure and
particles and gases have relatively short tails at longer times   aerosol mass concentration. The m-xylene SOA yield was
compared with the ideal laminar flow pulse, as is expected        0.22 at 3 × 10¹¹ molec. cm−3 s OH exposure and an OA mass
because only the center ∼ 50 % of the sample flow is sub-         concentration of 46 µg m−3 and the α-pinene SOA yield was
sampled and directed to the analyzers. Relative to the total      0.37 at 3 × 10¹¹ molec. cm−3 s OH exposure and a mass con-
flow through the reactor, the subsampled core has a narrower      centration of 178 µg m−3 .
velocity range and less interaction with the walls. Extraction       The measured yields are compared with those reported by
of the side purge flow also helps by preventing recirculation     Lambe et al. (2011) for the TPOT (for 262–263 ppb precur-

https://doi.org/10.5194/amt-14-2891-2021                                            Atmos. Meas. Tech., 14, 2891–2906, 2021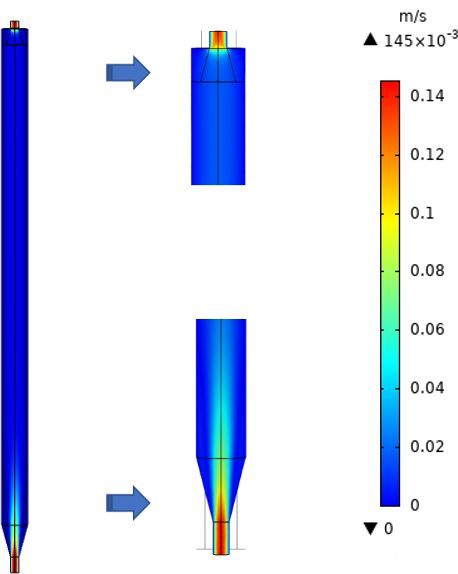
2900                                                     N. Xu and D. R. Collins: Design and characterization of a new OFR

Figure 7. Residence time probability distribution functions of the PFA OFR, CPOT (Huang et al., 2017), and quartz-PAM flow tubes (Lambe
et al., 2011) as a function of residence time for (a) particles and (b) gases.

Figure 8. SOA yield as a function of organic aerosol concentration (COA ) for (a) m-xylene SOA and (b) α-pinene SOA generated in the
PFA OFR. Marker color reflects experimental combinations of UV intensity, O3 mixing ratio, and RH. Each marker represents one VOC
concentration.

sor mixing ratio), the quartz PAM (78–88 ppb), and the Cal-           determine the dependence of OHexp on RH, O3 concentra-
tech environmental chamber (14–48 ppb), and by Ahlberg et             tion, and lamp power. This is also a source of uncertainty in
al. (2017) for the aluminum PAM (14–179 ppb of α-pinene               PAM yields that were reported in Lambe et al. (2011) and is
and 43–395 ppb of m-xylene). The comparisons as a func-               estimated by Li et al. (2015) to result in a factor of 2 uncer-
tion of COA are shown in Fig. 9a and b. The SOA yields                tainty in OHexp obtained from their model-derived equation.
are higher in the PFA OFR than those in the quartz PAM                Differences in O3 concentrations and resulting partitioning
and TPOT but lower than in the aluminum PAM. The α-                   between reactions with O3 and OH are expected to be more
pinene SOA yields in the PFA OFR (0.37 ± 0.02) and Cal-               important for α-pinene than for m-xylene. The formed SOA
tech chamber (0.42 ± 0.06) agreed within 12 % for compa-              is dependent on the reactivity of one or more of the SOA-
rable OH exposures (∼ 1011 molec. cm−3 s). A contributor to           forming compounds and the oxidant concentrations (McFig-
differences in yield among the OFRs is variation in OHexp ,           gans et al., 2019). For the same O3 mixing ratio (3.3 ppm)
which, as noted above, was not measured during the yield              and OH exposure (3 × 10¹¹ molec. cm−3 s) described above,
experiments. Our estimates of OHexp neglect the impact of             the reactivities of α-pinene towards O3 and OH are estimated
varying OH reactivity (OHR), which is defined as the sum-             to be 6.8 × 10⁻³ and 111 × 10−3 s−1 , while that of m-xylene
mation of the product of the concentrations of species that re-       towards OH is estimated to be 50 × 10−3 s−1 .
act with OH and their reaction rate constants (Li et al., 2015;          To investigate the effect of the RTD and wall interac-
Peng et al., 2015). During our experiments, the maximum               tions on aerosol production, we repeated the α-pinene SOA
OH reactivities for the m-xylene and α-pinene experiments             yield experiments under the same experimental conditions,
were 34 and 103 s−1 , respectively, which is higher than the          but without extracting the side purge flow and, therefore,
5.5 s−1 estimated for the SO2 experiments that were used to           without subsampling just the central core flow. Doing so re-

Atmos. Meas. Tech., 14, 2891–2906, 2021                                                https://doi.org/10.5194/amt-14-2891-2021
N. Xu and D. R. Collins: Design and characterization of a new OFR 2901
Figure 9. Comparison of SOA yields as a function of organic aerosol concentration (COA ) with those reported for other OFRs and one large
Teflon chamber. (a) m-Xylene SOA and (b) α-pinene SOA. Marker color reflects the OHexp.
sults in a broadened RTD and sampling of air that, on aver- tion of high concentrations of seed particles, as is expected
age, interacted more with the flow tube walls. The resulting because the increased surface area promotes condensation on
α-pinene SOA yields as a function of organic aerosol con- the aerosol and decreases the fraction of low-volatility ox-
centration (COA ) with (black squares) and without (red tri- idation products that reach and are lost to the walls or are
angles) extracting the side purge flow are shown in Fig. S3. further oxidized in the gas phase. In these experiments, the
The figure shows that the narrower RTD and reduced wall yield increased by as much as a factor of 3 at the minimum
effects accompanying subsampling of the central flow result precursor–seed mass ratio of about 2. The magnitude of the
in higher SOA yields, which may partially explain why the enhancement decreased with increasing precursor–seed ratio
yield presented in Fig. 9 is slightly higher than that reported and was within the run-to-run variability for ratios exceeding
for other OFRs. Additional experiments are needed to deter- about 5, which is shown in Fig. S4.
mine the relative importance of the RTD and the wall effects
and to evaluate any role of other differences between the ex- 3.6 Aerosol formed from oxidation of ambient air
periments such as the increased average residence time (and
OHexp ) when not subsampling just the higher velocity central Ambient air from outside our lab at the UCR College of En-
core flow. gineering – Center for Environmental Research and Tech-
nology (CE-CERT) in Riverside, CA, was processed by the
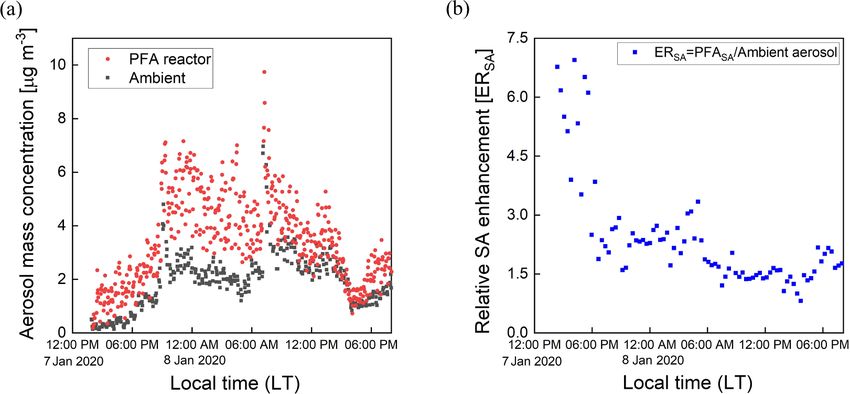
3.5 Seed particle SOA enhancement PFA OFR for several days in January 2020. Figure 11a and
b show results for a 30 h period (7–8 January 2020) and a 6 h
The influence of seed particle concentration was investigated period on 8 January 2020. Throughout the sampling period,
by measuring SOA yield for varying ratios of the mass con- the SMPS alternated through sets of three measurements of
centrations of α-pinene and AS seed. For all experiments a the processed aerosol at the exit of the reactor and sets of
constant flow rate (0.7 L min−1 ) containing the AS seed par- two measurements of unprocessed aerosol that bypassed the
ticles was introduced together with a varying mixing ratio of reactor through a copper tube. Each cycle of 5 measure-
α-pinene (8–30 ppb). Using the same method that was pre- ments lasted 21 min. The OHexp during the sampling pe-
sented in Sect. 2.4, a DMA generated a narrow mode of AS riod estimated from the model-derived equation introduced
seed particles centered at a diameter of 200 nm. The aver- in Sect. 3.4 was in the range of 1–4 × 10¹¹ molec. cm−3 s for
age mass concentration of the AS aerosol throughout the ex- the maximum lamp power and measured ozone concentra-
periments was 40 µg m−3 . The O3 concentration, RH, and tion and RH.
UV lamp power were the same for all measurements, with Time series of aerosol mass concentrations calculated
a resulting OHexp of about 2 × 10¹¹ molec. cm−3 s, which is from integration of the SMPS size distributions are shown
consistent with the OHexp estimated from the model-derived in Fig. 12a. The mass concentration of the aerosol exiting
equation (Peng et al., 2015). Measurements for each precur- the reactor was corrected for the fractional dilution by the
sor concentration were repeated 2 or 3 times, with agree- injected O3 flow and for size-dependent gas and particle
ment between measurements to within ±10 %. Figure 10a transmission efficiencies. The aerosol mass concentration in-
and b show the volume size distributions for one set of ex- creased significantly in the reactor during the oxidation pro-
periments with and without added AS particles. The results cess. A relative SA enhancement (ERSA ) is defined here as
show that the addition of seed particles suppresses the nucle- the ratio of the mass concentration of SA divided by that
ation mode as condensation on the larger particles is favored. of the ambient (unprocessed) aerosol, with the SA simply
The concentration of α-pinene SOA increased with the addi- defined as the difference between the processed and unpro-
https://doi.org/10.5194/amt-14-2891-2021 Atmos. Meas. Tech., 14, 2891–2906, 20212902 N. Xu and D. R. Collins: Design and characterization of a new OFR
Figure 10. Example sets of volume size distributions from experiments evaluating the impact of adding AS seed particles on SOA yield. The
precursor : seed mass ratio is (a) 1.8 (b) 3.9.
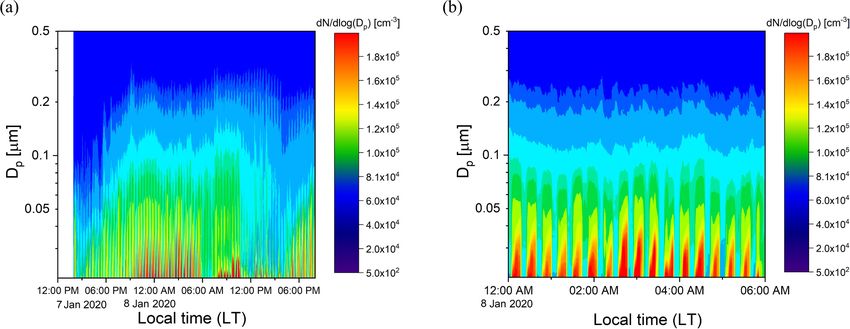
Figure 11. Example time series of size distributions of the aerosol processed by the PFA OFR and that which bypassed it over (a) 30 h on
7–8 January 2020 and (b) 6 h on 8 January 2020. The bands of high concentration were measured when the aerosol and ambient air were
processed through the reactor.
cessed aerosols. The ERSA for the same sampling period is 4 Summary
shown in Fig. 12b. A consistent diurnal pattern was not ob-
served throughout the sampling period. The SA mass con-
centration was an average of 1.8 times that of the ambient A new all-Teflon reactor, the Particle Formation Accelera-
aerosol during the selected period. More SA formation was tor (PFA) OFR, was designed, constructed, and characterized
observed during nighttime on 8 January, while decreasing using both experimental measurements and CFD modeling.
amounts formed until around noon. The maximum enhance- Its performance was examined and evaluated through labo-
ment due to SA formation was observed in the late afternoon ratory measurements and with ambient air. The reactor re-
on 7 January, when the SA mass concentration was approx- sponse and characteristics were compared with those from a
imately 7 times that of the ambient aerosol. A small SA en- smog chamber (Caltech) and other oxidation flow reactors:
hancement was also observed during the late afternoon on 8 the Toronto Photo-Oxidation Tube (TPOT), Caltech Pho-
January. The overall temporal pattern likely reflects the im- tooxidation Flow Tube (CPOT), the TUT Secondary Aerosol
pact of traffic-related emissions from nearby roads, including Reactor (TSAR), quartz and aluminum versions of Poten-
a major highway that is about 1.5 km away. In the future there tial Aerosol Mass reactors (PAMs), and the Environment and
is a need to add more comprehensive measurements of the Climate Change Canada OFR (ECCC-OFR).
chemical composition of the particulate and gaseous species. Our results show that OHexp can be varied over a range
comparable to that of other OFRs, with the dependence on
UV lamp power, RH, and O3 concentration characterized and
reported. The particle transmission efficiency is over 75 %
in the size range from 50 to 200 nm after minimizing static
charge on the PFA, PTFE, and ePTFE surfaces. The gas
Atmos. Meas. Tech., 14, 2891–2906, 2021 https://doi.org/10.5194/amt-14-2891-2021N. Xu and D. R. Collins: Design and characterization of a new OFR 2903
Figure 12. Time series of mass concentrations of the aerosol exiting the PFA OFR and that bypassing it (a), and (b) the relative enhancement
of the mass concentration due to SA formation.
transmission efficiencies of CO2 and SO2 are 0.90 ± 0.02 ambient concentrations. Future efforts will include adding di-
and 0.76 ± 0.04, respectively, with the latter comparable to rect measurement of OHexp during measurements, develop-
estimated transmission of LVOCs through the PAM reactor. ment of an OHexp estimation description for the PFA OFR
Computational simulation and experimental verification of comparable to that reported for other OFRs, and further ex-
particle and gas residence time distributions (RTDs) show ploring the influence of OH reactivity on OHexp and of seed
that the flow through the reactor is nearly laminar, with nar- particles on SOA yield. We will also expand upon measure-
rower RTDs than reported for OFRs with greater diameter- ments of the composition of the particulate products and
to-length ratios, making it better suited for measurements of gaseous precursors during one or more field studies to evalu-
dynamic sources with time-varying composition or concen- ate how well the PFA OFR simulates atmospheric chemistry
tration. that typically requires hours or days.
The mass yields of SOA from the oxidation of α-pinene
and m-xylene, and the effect of seed particles on those
yields, were investigated. At comparable OH exposure, the Data availability. Data presented in this work are available from
m-xylene and α-pinene SOA yields are slightly higher than the authors.
those in the quartz PAM and TPOT, but lower than in the
aluminum PAM. A likely contributor to differences in yields
between the PFA OFR and other OFRs is the uncertainty Supplement. The supplement related to this article is available on-
in OHexp , which was not measured simultaneously during line at: https://doi.org/10.5194/amt-14-2891-2021-supplement.
the yield measurements and was determined from separate
experiments for which the OH reactivity differed. The α-
Author contributions. DRC designed the reactor and edited the pa-
pinene SOA yields in the PFA OFR (0.37 ± 0.02) and Cal-
per. NX performed the experiments and simulations, processed the
tech chamber (0.42 ± 0.06) agree within 12 % for compara-
data, and wrote the paper.
ble OH exposures (∼1011 molec. cm−3 s). The presence and
concentration of seed particles was shown to have a signifi-
cant effect on SOA yield. At a nominally fixed OH exposure Competing interests. The authors declare that they have no conflict
of 2 × 10¹¹ molec. cm−3 s, the α-pinene SOA yield for the of interest.
minimum precursor–seed mass ratio of about 2 was about 3
times that when no seed particles were added. The magni-
tude of the enhancement decreased with increasing precur- Review statement. This paper was edited by Mingjin Tang and re-
sor : seed ratio and was within the run-to-run variability for viewed by three anonymous referees.
ratios exceeding about 5. The SA production from ambient
air was studied in Riverside, CA. The mass concentration of
SA formed in the reactor was about twice the mass concen-
tration of the ambient aerosol at the same time. References
Overall, the computational and experimental results indi- Ahlberg, E., Falk, J., Eriksson, A., Holst, T., Brune, W.
cate that the PFA OFR is suitable for laboratory studies and H., Kristensson, A., Roldin, P., and Svenningsson, B.:
for field use that includes measurement of rapidly changing Secondary organic aerosol from VOC mixtures in an
https://doi.org/10.5194/amt-14-2891-2021 Atmos. Meas. Tech., 14, 2891–2906, 2021You can also read