Ozonolysis of fatty acid monolayers at the air-water interface: organic films may persist at the surface of atmospheric aerosols
←
→
Page content transcription
If your browser does not render page correctly, please read the page content below
Atmos. Chem. Phys., 21, 1325–1340, 2021
https://doi.org/10.5194/acp-21-1325-2021
© Author(s) 2021. This work is distributed under
the Creative Commons Attribution 4.0 License.

Ozonolysis of fatty acid monolayers at the air–water interface:
organic films may persist at the surface of atmospheric aerosols
Benjamin Woden1,2 , Maximilian W. A. Skoda2 , Adam Milsom3 , Curtis Gubb3 , Armando Maestro4 , James Tellam2 ,
and Christian Pfrang3,5
1 Department   of Chemistry, University of Reading, Whiteknights, Reading, RG6 6AD, UK
2 ISIS  Neutron and Muon Source, Science and Technology Facilities Council,
Rutherford Appleton Laboratory, Didcot, OX11 0QX, UK
3 School of Geography, Earth and Environmental Sciences, University of Birmingham, Edgbaston, Birmingham, B15 2TT, UK
4 Institut Laue–Langevin (ILL), 71 Avenue des Martyrs, Grenoble, 38000, France
5 Department of Meteorology, University of Reading, Whiteknights Road, Reading, RG6 6BG, UK

Correspondence: Christian Pfrang (c.pfrang@bham.ac.uk)

Received: 16 July 2020 – Discussion started: 12 August 2020
Revised: 29 October 2020 – Accepted: 20 November 2020 – Published: 1 February 2021

Abstract. Ozonolysis of fatty acid monolayers was studied          termined to be (2.2 ± 0.4) × 10−10 cm2 s−1 at 21 ± 1 ◦ C and
to understand the fate of organic-coated aerosols under re-        (2.2 ± 0.2) × 10−10 cm2 s−1 at 2 ± 1 ◦ C.
alistic atmospheric conditions. Specifically, we investigated
the effects of temperature and salinity on the degradation of
oleic acid at the air–water interface and the persistence of the
aged surfactant film at the surface. The presence of a resid-      1   Introduction
ual film is of atmospheric importance, as surface monolayers
affect the physical properties of the droplets and because of      Organic films are formed at the surfaces of aerosol particles
the role they play in cloud formation. This occurs via sev-        in the atmosphere (Gill et al., 1983; Ellison et al., 1999; Sa-
eral effects, most notably via surface tension reduction. The      reen et al., 2013; Nozière et al., 2014 Kroflič et al., 2018;
interplay between atmospheric aerosol loading and the for-         Geŕard et al., 2019), and the partitioning of organic compo-
mation, nature, and persistence of clouds is a key uncertainty     nents in this manner changes the physical properties of the
in climate modelling.                                              aerosol particle and its chemical reactivity (Rudich, 2003;
   Our data show that a residual surface film, which we sus-       Ruehl et al., 2016; Ovadnevaite et al., 2017). A key review
pect to be formed of nonanoic acid and a mixture of aze-           (Donaldson and Vaida, 2006) has brought together various
laic and 9-oxononanoic acids, is retained at the interface after   emerging trends in the study of these films and their rele-
ozonolysis at near-zero temperatures but not at room temper-       vance to atmospheric processes. An important area of inter-
ature. Given the low-temperature conditions used here are at-      est regarding these films concerns the interactions between
mospherically realistic, the persistence of a product film must    atmospheric aerosol particles and clouds. This relationship
be considered when assessing the impact of unsaturated fatty       is complex and difficult to measure or predict (Stevens and
acid partitioned to the air–water interface. The presence of       Feingold, 2009), and resolving the role played by organic
stable (non-oxidisable) reaction products also opens the pos-      monolayers at the surface of aerosol particles is part of solv-
sibility of build-up of inert monolayers during the aerosol life   ing this puzzle. The organic species that are contained in
cycle with potential implications for cloud formation. Fur-        these surface films oxidise in the atmosphere and may pro-
thermore, we measured the kinetic behaviour of these films         duce low-volatility products that form secondary organic
and found that the reactions are not significantly affected by     aerosols. If the oxidation of these species is prevented, ac-
the shift to a lower temperature with rate coefficients de-        celerated, or otherwise modified by the partitioning of the
                                                                   reactant into a surface monolayer, then this will have impli-

Published by Copernicus Publications on behalf of the European Geosciences Union.
1326 B. Woden et al.: Ozonolysis of fatty acid monolayers at the air–water interface
cations for the contribution of that reactant to aerosol load- et al., 2020, for a recent study of heterogenous OH reactions
ing. More importantly, the presence of a surface monolayer on organic aerosols). Of these three primary atmospheric ox-
changes the physical and chemical properties of the aerosol idants O3 is the only one present during the day and night,
particle itself. and the present study is focused on ozonolysis, i.e. oxidation
The present study focuses on monolayers at the air–water by O3 .
interface as would be seen on aqueous aerosol droplets, but The initial reaction of O3 with oleic acid is chemically well
the concept is broadly transferrable to any aerosol particle understood and is laid out in Scheme 1 (compare King et al.,
with an organic film coating. These monolayers are relevant, 2009; see also Gallimore et al., 2017). It proceeds via an at-
as they decrease the surface tension of water (Donaldson and tack on the carbon–carbon double bond at the centre of the
Vaida, 2006; Ambaum, 2010); the surface tension of aque- molecule. The two reaction pathways resulting from the two
ous droplets plays a key role in the growth and formation possible collapses of the molozonide lead to a total of four
of clouds (Ambaum, 2010; Ovadnevaite et al., 2017). Fur- initial reaction products. These products are nonanoic acid,
thermore, the monolayer can act as a barrier to water uptake, nonanal, 9-oxononanoic acid, and azelaic acid (Zahardis and
retard droplet evaporation, and inhibit the transfer of atmo- Petrucci, 2007). One detailed kinetic study on bulk-like oleic
spheric species between the air and water phases (Rideal, acid (Thornberry and Abbatt, 2004) identifies nonanal as ma-
1924; La Mer, 1962; La Mer et al., 1964; Gaines, 1966; Gar- jor product with a yield of 0.50 (±0.10) for the oleic acid
rett, 1971; Ray et al., 1991; Benjamin, 1996; Barnes, 1997; ozonolysis using a coated-wall tube (0.6 mm thick oleic acid
Li et al., 2019). It can also act as a 2D solvent for normally layer). The authors found only a small temperature depen-
water-insoluble species that could not partition to a water dence of the uptake coefficients down to 263 K. The fate of
aerosol or modify the solvation behaviour of soluble species these products after the ozonolysis of an oleic acid mono-
(Tomoaia-Cotisel and Cadenhead, 1991; Cohen Stuart et al., layer however is the subject of debate (Voss et al., 2007; King
1996; Mmereki and Donaldson, 2002; Mmereki et al., 2003; et al., 2009).
Gilman et al., 2004). Organic monolayers can also act as effi- The presence of a product partitioned to the (air–water)
cient ice-nucleating particles (see Knopf et al., 2018; Knopf interface after reaction is the most important question for at-
and Forrester, 2011; Zobrist et al., 2007; Cantrell and Robin- mospheric impact, as a monolayer remaining after ozonoly-
son, 2006). sis may perpetuate the modifications to the properties of an
This catalogue of effects upon the aerosol particle caused aerosol droplet due to the persistence of the organic character
by the presence of an organic monolayer coating shows the at the air–water interface even after ozonolysis (Ellison et al.,
importance of establishing the lifetime and ageing of these 1999; Donaldson and Vaida, 2006).
monolayers in the atmosphere, and this has been the focus of The aim of this study is to extend the understanding of
previous research (e.g. Thornton and Abbatt, 2005; Hung et oleic acid monolayer ozonolysis under atmospherically rel-
al., 2005; Knopf et al., 2005; McNeill et al., 2006; Voss et evant conditions by investigating the impact of low tem-
al., 2007; Knopf et al., 2007; Cosman et al., 2008; Gross et peratures and saline subphases. King et al. (2009) investi-
al., 2009; King et al., 2009; Pfrang et al., 2014; Sebastiani et gated a variety of saline subphases but did not study dif-
al., 2018). ferences in ozonolysis behaviour between the monolayers
Oleic acid has been a monolayer component of particular spread upon them at room temperature, and to our knowledge
interest, as it is a major contributor to both anthropogenic no studies have yet investigated the effects of low tempera-
organic emissions – it is mostly produced by meat cooking tures (< 10◦ ), which are common in the lower troposphere
(Shrivastava et al., 2007) and is the dominant component (Grotjahn, 2015), where these reactions occur. To this end,
of such emissions (Allan et al., 2010) – and biogenic ma- we investigated the behaviour at ca. 0◦ , i.e. near the ice melt-
rine aerosols (Tervahattu et al., 2002; Fu et al., 2013). Its ing temperature (referred to as near-zero temperatures in this
ubiquity in such aerosols has allowed it to serve as a bench- paper), but it should be noted that aqueous NaCl solutions
mark molecule for more complex mixtures of organic surfac- will experience a slight ice melting point depression (see
tant produced by such anthropogenic activity (Zahardis and phase diagram and previous studies, in particular Koop et
Petrucci, 2007). While there are numerous studies of pure al., 2000a, b) and that water droplets in the atmosphere will
oleic acid or high-oleic-acid-content droplets and their ox- freeze at significantly lower temperatures. Near-zero temper-
idation reactions (e.g. King et al., 2004; Voss et al., 2007; atures are more frequently encountered in the atmosphere
Last et al., 2009; Pfrang et al., 2011, 2017a), work on the than room-temperature conditions used in other studies, es-
oxidation of an oleic acid monolayer at the air–water inter- pecially in temperate and polar regions as well as in the free
face in particular has been comparatively scarce (King et al., troposphere, possibly with the exception of the boundary
2009; Skoda et al., 2017; Sebastiani et al., 2018). layer in the tropics. Our neutron reflectometry (NR) study
q
Ozone (O3 ) and nitrate radicals (NO3 ) are important night- also incorporates simultaneous characterisation by infrared
time oxidants (e.g. Hung et al., 2005; Gross et al., 2009; Se- reflection absorption spectroscopy (IRRAS) as a secondary
bastiani et al., 2018; Woden et al., 2018), while O3 and hy- analysis technique, using a bespoke reaction/analysis cham-
q
droxyl radicals ( OH) are the key daytime oxidants (see Chen ber recently developed for this purpose (Skoda et al., 2017).
Atmos. Chem. Phys., 21, 1325–1340, 2021 https://doi.org/10.5194/acp-21-1325-2021B. Woden et al.: Ozonolysis of fatty acid monolayers at the air–water interface 1327
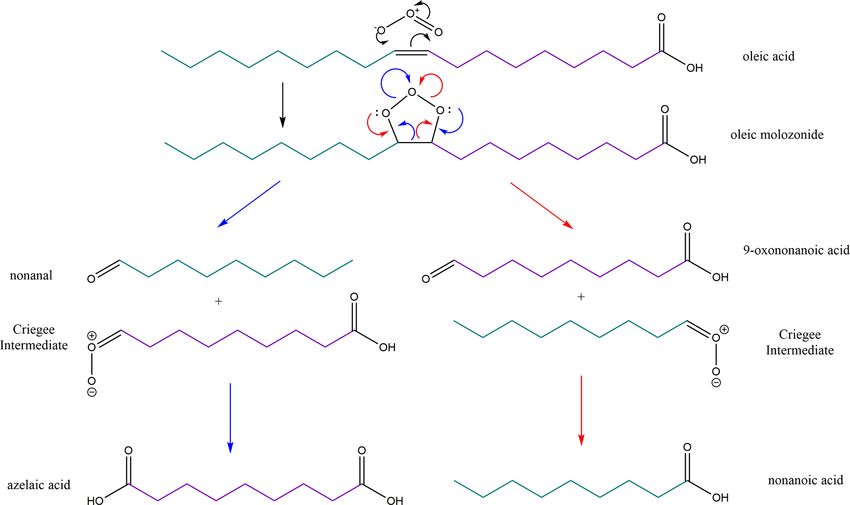
Scheme 1. Oleic acid ozonolysis reaction scheme. We used both fully and half-deuterated oleic acid samples, granting us the ability to create
different contrasts for analysis by neutron reflectometry. In the fully deuterated (d34 ) variant of oleic acid, both the head portion (purple) and
tail portion (teal) of the molecule are deuterated. In the partially deuterated (d18 ) variant of oleic acid, only the tail portion (teal) is deuterated.
The colouring of the products and intermediates indicates the fate of the two portions of the oleic acid molecule and demonstrates that, when
d18 -oleic acid is oxidised, two products (nonanal and nonanoic acid) are deuterated and two (azelaic acid and 9-oxononanoic acid) are not.
2 Methodology prepared to have a neutron SLD of zero, matching that of
air). The null-reflecting matched water was prepared as a so-
This research was performed on the specular neutron reflec- lution of D2 O (99.9 % atom D; Sigma-Aldrich) 8.8 % v/v in
tometry instruments INTER at the ISIS Neutron and Muon 18.2 M H2 O. Null-reflecting sodium chloride solution sub-
Source and FIGARO at Institut Laue–Langevin (ILL) and phase was prepared with 35 g NaCl (< 99 %; Sigma-Aldrich)
builds on previous work by this research group on the oxi- in 900 mL H2 O and 58 mL D2 O. This preparation compen-
dation of floating monolayers at the air–water interface per- sates for the scattering length of the salt ions with a slightly
formed at these facilities (Pfrang et al., 2014; Sebastiani et different H2 O / D2 O ratio.
al., 2015; Skoda et al., 2017; Sebastiani et al., 2018; Woden Details of the experimental setup and procedure can be
et al., 2018). found in Skoda et al. (2017). In short, a purpose-built alu-
minium gas flow cell with a volume of approximately 1.5 L
2.1 Neutron reflectometry was used, which accommodated a PTFE liquid trough with
inner dimensions of 238 mm × 70 mm. The sample stage was
A review paper (Lu et al., 2000) details how neutron reflec- equipped with passive and active anti-vibration control. The
tometry can be used to determine the surface concentration reaction chamber was mounted on the sample stage and in-
of organic films present as a monolayer at the air–water in- terfaced with the gas setup. The PTFE trough was filled with
terface. In short, neutron reflectivity depends on the differ- 90 mL of null-reflecting water. Monolayers were spread us-
ences between concentrations of atoms with a characteris- ing 20–40 µL of the spreading solutions in chloroform, leav-
tic neutron scattering length in adjacent thin layers of ma- ing a monolayer of the dissolved species after evaporation
terial. Simplifications of the equations describing this sys- of the solvent. A dry oxygen flow of 1.2 L min−1 was con-
tem are possible when studying just one layer (the organic tinuously present, providing a low (< 10 %) relative humid-
monolayer) at the interface between air – which essentially ity (RH) and avoiding any build-up of gas-phase products
has a scattering length density (SLD) of zero – and a “null- that would not be consistent with atmospheric conditions.
reflecting” or “air-contrast-matched” subphase (a subphase
https://doi.org/10.5194/acp-21-1325-2021 Atmos. Chem. Phys., 21, 1325–1340, 20211328 B. Woden et al.: Ozonolysis of fatty acid monolayers at the air–water interface
Thanks to the low RH, we did not observe any condensation and reaction setup is described in detail in a method paper
within the reaction chamber or windows throughout the ex- (Skoda et al., 2017). For this study it had been further de-
periments. Data were recorded for a few minutes before O3 veloped to allow for cooling of the subphase in order to ac-
was admitted into the chamber. O3 was then generated con- cess relevant atmospheric temperature conditions. IRRAS in-
tinuously by exposing the O2 flow to UV light. The height of tegration is primarily intended to facilitate the study of mixed
the air–liquid interface was aligned with respect to the neu- monolayers, in which one component can be deuterated (for
tron beam using a Keyence laser displacement sensor (model neutron reflectometry) and the other left non-deuterated (and
no. LK-G402), which was coupled into the sample chamber thus easily measurable by IRRAS). This work focuses on a
via a quartz window to allow automated height adjustment film composed solely of oleic acid, so the IRRAS analysis
during the measurements. Height adjustments over a 2 h ex- served as an additional semi-quantitative method to follow
periment were always less than 0.15 mm for a water height the oleic acid component rather than as a method to follow
of ca. 5 mm in the trough. The reflectivity (fraction of inci- non-deuterated film components (Skoda et al., 2017). During
dent neutrons reflected; R) varies as a function of the energy experiments using d18 -oleic acid, IRRAS data were sensitive
and reflection angle of the incident neutrons (expressed as to the deuterated and non-deuterated halves of the molecule
momentum transfer, Q) and the SLD (ρ) and thickness (τ ) (via the C–D and C–H absorption bands, respectively). The
of the monolayer as expressed in Eq. (1) (based on Lu et al., IRRAS equipment was only available at the INTER beam-
2000). line, given the large and flexible sample environment avail-
able at that instrument.
Q4 R ∼ 2 2 Qτ Baseline-corrected integrations under C–D peaks (sym-
= 4ρ sin (1)
16π 2 2 metric and asymmetric stretch) provide a series of peak area
The SLD and layer thickness characteristic of the system can against time traces for each reaction, which reflect the pres-
then be inferred from the relationship between reflectivity ence or absence of C–D chains at the surface and traces their
and momentum transfer as measured by the instrument. The evolution throughout the reaction.
two parameters are fitted over the whole Q range as a com- While IRRAS can measure deuterated components (the in-
bined ρτ value, which corresponds to a surface concentration frared absorbance bands are shifted to a lower wavenumber,
of scattering length, from which the surface concentration of distinguishing them from the absorbance bands associated
oleic acid can be determined as the scattering length of oleic with non-deuterated components), the sensitivity in this re-
acid is known (b = 315 fm). Reflectivity curves of R vs. Q gion is much lower, as these bands are weaker and more af-
are collected at 20 s intervals throughout the reaction and fit- fected by the gas-phase atmosphere above the organic film.
ted using MOTOFIT (Nelson, 2006) to give ρτ values for This meant that the IRRAS measurements could not distin-
each time slice. These fitted ρτ values can be converted into guish the residues left at low temperatures from background
surface concentration (0) values for oleic acid (Eq. 2, based noise. Figure S13 in the Supplement shows an example of
on Lu et al., 2000). IRRAS data from an ozonolysis experiment on INTER.
τρ 2.3 Materials
0= (2)
b
d34 -oleic acid was used (one batch custom synthesised by
In order for the layer to stand out sufficiently from the other the ISIS Deuteration Facility and one batch purchased from
phases, a deuterated form, d34 -oleic acid, was used. Spread- Sigma-Aldrich at 98 % atom D; 99.9 %); the half-deuterated
ing onto an aqueous subphase will cause the acidic deuterium d18 -oleic acid was produced by the ISIS Deuteration Facility;
to be exchanged with the subphase, so we use the scattering O3 was produced for the reaction using a commercial Pen-
length of oleic acid with 33 deuterium atoms (315 fm) to cal- Ray ozoniser (UVP Ltd, Cambridge) to ozonise a stream of
culate the surface concentration from ρτ values. For prod- O2 (99.999 %; BOC Ltd) regulated to a flow of 1.2 L min−1
uct identification studies, we used custom-synthesised half- (20 cm3 s−1 ) using an electronic mass flow controller to an
deuterated d18 -oleic acid. O3 concentration of (1.43 ± 0.05) × 1013 cm−3 ; the ozoniser
was calibrated offline using UV–Vis absorption at 254 nm
2.2 Reaction chamber for simultaneous infrared
and an absorption cross-section value of 1.13 × 10⁻¹⁷ cm−2
reflection absorption spectroscopy (IRRAS)
(Daumont et al., 1992). Mixing ratios of ozone (in O2 ) in the
The reactions were carried out in a bespoke chamber de- chamber were in the range 126–2010 ppb, so that we were
veloped by this research group. The chamber is designed to working in large excess of O3 compared to the organic mono-
provide a controlled and confined environment in which the layer, and [O3 ] remained approximately constant during the
monolayer can be oxidised by a gas-phase oxidant while un- reaction.
der analysis by both neutron reflectometry and IRRAS. The
integration of IRRAS analysis in situ during the neutron re-
flectometry experiment is non-trivial, and the entire analysis
Atmos. Chem. Phys., 21, 1325–1340, 2021 https://doi.org/10.5194/acp-21-1325-2021B. Woden et al.: Ozonolysis of fatty acid monolayers at the air–water interface 1329
(ISIS INTER RB 1810793 and RB 1710483; ILL FIGARO
9-10-1518).
3.2 Salt water subphase – room temperature
Sea spray aerosol will naturally be salty, and a simple mono-
valent common salt, sodium chloride (aq; 36 g L−1 ), was
used as a rough model of sea spray for this experiment.
At room temperature, the reaction also proceeded to
completion, with no residual deuterated material detectable
at the interface. King et al. (2009) found that there was
no detectable difference in the nature of the reaction be-
tween a room-temperature pure water subphase and a room-
temperature salted subphase (across a wider variety of salts
than studied here), and these results support that comparative
Figure 1. Ozonolysis of an oleic acid monolayer floating on pure vs. conclusion (though King et al. (2009) actually measured a
salt water. Time evolution plot for ozonolysis of 29 µL 1.0 g L−1 residual layer in both conditions while the present study has
d34 -OA (CHCl3 spreading solution) on pure water (green circles)
measured no residual layer in either condition; this experi-
and 25 µL 1.0 g L−1 d34 -OA 36 g L−1 NaCl(aq) (purple squares)
ment supports their finding that no difference between the re-
subphases by 323 ± 29 ppb O3 introduced at t = 0 s at 21 ± 1 ◦ C.
action in the two conditions is detectable using this method).
Figure 1 shows the results in these conditions as a time series
of 120 s time slices (a lack of points indicates no convergence
3 Results and discussion
in the numerical fit; a pair of before/after R vs. Q reflectivity
Prior to the ozonolysis studies we characterised the stability curves can be found as Fig. S4 in the Supplement).
of the oleic acid monolayers at room and reduced temper-
3.3 Near-zero temperature conditions: pure water
atures (see Sect. S1 of the Supplement with π -A isotherms
subphase
presented as Figs. S1 and S2). After confirming the reactant
film’s stability, we exposed the monolayers to ozone follow- Experiments were then undertaken to determine if the reac-
ing the reaction by neutron reflectometry and IRRAS in the tion proceeds in a similar manner at atmospherically more
conditions described below. relevant temperatures of 3 ± 1 ◦ C. A clear difference between
this reaction and the reaction at room temperature is ob-
3.1 Pure water subphase – room temperature servable. At the lower temperature, the neutron reflectome-
try data clearly show a residual signal from deuterated ma-
At room temperature, on a pure water subphase, we found
terial at the interface after the initial reaction of oleic acid
that the removal of deuterated material from the surface is
and ozone. On heating the subphase to room temperature,
consistent with complete oxidation. The remaining reflectiv-
this residue disappears. This is inferred from the fact that, af-
ity signal is not distinguishable from zero and cannot be fitted
ter heating, the reflectivity signal is consistent with that for a
except by using a fixed background. This is consistent with
null-reflecting water surface (i.e. background), meaning that
the results of Voss et al. (2007), but not with those of King et
no deuterated material remains at the surface (or so little that
al. (2009), where a stable product film was reported.
it cannot be distinguished from this background condition1 );
Figure 1 shows a time series of fitted ρτ values (propor-
the reflectivity data for such a null-reflecting air–water inter-
tional to surface concentration) for 120 s time slices of the re-
face are included in the Supplement (Fig. S11).
action, with an O3 concentration of 323 ± 9 ppb introduced at
The kinetics of the reaction, however, do not seem to differ
t = 0 s. The absence of points after ca. 800 s indicates that the
markedly in the two temperature conditions. A fuller treat-
numerical fits fail to converge after this point, demonstrating
ment of the kinetics of the reaction (in which we confirm no
that the reflectivity is not consistent with an adsorbed surface
significant difference in second-order rate coefficients for the
layer (i.e. not measurably different from the background).
two temperature conditions) will follow in Sect. 3.9.
Figure S3 in the Supplement illustrates this as a pair of be-
Figure 2 shows a time evolution plot for these conditions.
fore/after R vs. Q reflectivity curves. The figure also shows
It demonstrates that a stable residual layer remaining after
data for a salt subphase reaction, which will be discussed be-
ozonolysis for more than 1 h can be measured and fitted over
low.
This result of no measurable residue was reproducible 1 The exact value of this cut-off point varies depending on mea-
across 11 different ozonolysis runs carried out across an [O3 ] surement conditions and count time, but ρτ ∼ 5 × 102 cm−1 , corre-
range of 126 ± 15 to 2010 ± 238 ppb as parts of three differ- sponding to ca. 5 % of the oleic acid concentration spread initially,
ent beamline experiments at two different neutron facilities have been reliably measured with this experimental setup.
https://doi.org/10.5194/acp-21-1325-2021 Atmos. Chem. Phys., 21, 1325–1340, 20211330 B. Woden et al.: Ozonolysis of fatty acid monolayers at the air–water interface
range is close to mixing ratios of 100 ppb that have been
observed in polluted conditions (Warneck, 1999) and thus
approaches atmospherically realistic concentrations as far
as feasible within the time constraints of beam-time exper-
iments for such a rigorous study.
Twelve of these runs (those obtained at the high-flux in-
strument FIGARO at ILL; experiment 9-10-1518) were car-
ried out to determine the kinetic behaviour of this reaction
and were therefore performed using a high dQ/Q fast (5 s
per measurement) chopper and slit setup optimised for ki-
netic measurements of the fast reactions afforded by high
[O3 ]. These runs were used to measure second-order rate
constants for the reaction (cf. Sect. 3.9) rather than to pre-
cisely quantify the residual material. Therefore, these 12 runs
support the qualitative conclusion that a residue remains after
Figure 2. Ozonolysis of an oleic acid monolayer at low tempera-
ozonolysis but were not used to quantify this residue.
tures floating on pure vs. salt water. Time evolution plot for ozonol-
ysis of 25 µL 1.0 g L−1 d34 -OA (CHCl3 spreading solution) on pure Four runs (INTER; experiment RB 1810793) were carried
water (green circles) and 36 g L−1 NaCl(aq) (purple squares) sub- out with the precise and reproducible temperature control
phases by 323 ± 29 ppb O3 introduced at t = 0 s at 3 ± 1 ◦ C (pure system and with the neutron reflectometry setup optimised to
water) or −2 ± 1 ◦ C (salt water). facilitate precise measurement of a low-intensity reflectivity
signal (low dQ/Q, low background). These were assumed to
be sampling from a Gaussian distribution of residue intensi-
ties, and on that basis a mean deuterated residue fraction of
11.1 % of the initial spread material was calculated, with a
95 % confidence interval of ±1.9 % (absolute).
3.4 Atmospheric ageing simulation
In order to provide further assurance that the measured
residue was a genuine product monolayer and not, for exam-
ple, a temperature-dependent fitting artefact, an experiment
was performed in which, after ozonolysis of an oleic acid
monolayer, more oleic acid was added and another ozonoly-
sis reaction carried out, and then yet more oleic was added,
and a third ozonolysis reaction carried out. If the measured
Figure 3. Neutron reflectivity signal from the air–water interface residual reflectivity is due to a product monolayer, then this
before ozonolysis (blue circles – signal from the pristine oleic acid should build up over multiple spreading and ozonolysis cy-
monolayer), after ozonolysis (red squares – clear signal remain- cles. This was indeed observed, adding further weight to the
ing), and after heating (orange triangles – no measurable signal) for conclusion that the measured residual reflectivity stems from
ozonolysis of 25 µL 1.0 g L−1 d34 -OA (CHCl3 spreading solution) the presence of a product monolayer that is not susceptible to
on pure water subphase by 323 ± 29 ppb O3 introduced at t = 0 s at further ozonolysis.
3 ± 1 ◦ C. Figure 4 shows a time series representing reflectivity from
the air–water interface at 120 s time slices throughout this
process and clearly demonstrates the gradual build-up of a
120 s counting periods and that this is no longer the case product monolayer. As well as illustrating that this is a real
after heating to 20 ◦ C. The figure also shows data from a product, not a temperature-dependent measurement artefact,
salt subphase reaction, which will be discussed below. Fig- this represents a possible process in the real atmosphere, in
ure 3 draws particular attention to the distinction between the which reactive species could be repeatedly adsorbed to the
situation after ozonolysis and the situation after heating by surface and engage in reactions which leave a small amount
showing R vs. Q reflectivity curves before ozonolysis, after of unreactive material behind, gradually building up an un-
ozonolysis, and after heating (the analogous plot for the salt reactive monolayer. The atmospheric implications of this,
water condition is included in the Supplement as Fig. S5). which are potentially significant, are discussed in Sect. 4.2.
This measurable residue after ozonolysis is reproducible Figure 5 further illustrates this as a series of R vs. Q re-
across 18 experiments carried out with a wide [O3 ] range flectivity curves for each spreading and ozonolysis (as well
from 126 ± 15 to 2010 ± 238 ppb. The lower end of this as for a final heating step; data for second and third spread-
Atmos. Chem. Phys., 21, 1325–1340, 2021 https://doi.org/10.5194/acp-21-1325-2021B. Woden et al.: Ozonolysis of fatty acid monolayers at the air–water interface 1331
3.5 Near-zero temperature conditions: salt water
subphase
Ozonolysis reaction was also carried out on a simple mono-
valent sea salt solution model subphase. At the same tem-
peratures where a residue was observed on pure water
(3 ± 1 ◦ C), a residue was not reproducibly measurable for
the salt-water subphase: only one out of five runs carried out
with the temperature control setup produced a measurable
residue, and it is possible that this residue was not stable but
was still slowly disappearing – see discussion below on the
unexpected kinetics of the reaction in these conditions. This
could be because no residue remains under these conditions
or because whatever residue does remain is close to the de-
tection limit for this technique.
Figure 4. Experiment mimicking an aqueous aerosol droplet ex-
However, at still colder temperatures not accessible on a
posed to multiple cooking emission peaks and demonstrating the as-
sociated build-up of an inert organic film at the air–water interface
pure water subphase (−2 ± 1 ◦ C), a residue is reliably mea-
at low temperatures. Time evolution plot for ozonolysis of 25 µL surable. Figure 2 shows a time evolution for a reaction in
1.0 g L−1 d34 -OA (CHCl3 spreading solution) on pure water sub- these conditions, and Fig. S5 in the Supplement shows the
phase by 323 ± 29 ppb O3 introduced at t = 0 s and after two addi- corresponding R vs. Q plots for spreading, ozonolysis, and
tional spreadings of 25 µL 1.0 g L−1 d34 -OA at 3 ± 1 ◦ C. heating.
This result was produced in duplicate (INTER experiment
RB 1810793). Using the same assumption of sampling from
a Gaussian distribution of measured residues as a fraction of
initially deposited deuterated material as used in the pure wa-
ter at 3 ± 1 ◦ C, the mean deuterated residue fraction of 7.3 %
was calculated, with a 95 % confidence interval of ±0.45 %
(absolute). The upper confidence bound of this mean lies be-
low the lower confidence bound of the mean for the pure wa-
ter at 2 ± 1 ◦ C. This supports the conclusion that a little less
product monolayer remains at the interface in the salt wa-
ter at −2 ± 1 ◦ C condition than in the pure water at 3 ± 1 ◦ C
condition.
A basic visual appraisal of the time evolution of this re-
action (see Fig. 2) also suggests a considerable difference in
Figure 5. Neutron reflectivity signal from the air–water interface the kinetics of the reaction compared with those seen at room
before ozonolysis (blue circles; data only shown for first spread- temperature and on pure water at low temperatures. Instead
ing; fits shown for all three spreadings – clear and consistent signal of the linear-to-exponential decay (either to no signal or to
from the oleic acid monolayers across the three simulated cook- a residual signal) seen under other conditions, the reaction
ing emission peaks), after ozonolysis (red squares – demonstrating appears to follow a linear-to-exponential decay at first, be-
the build-up of organic residue at the air–water interface during re- fore switching to a much slower roughly linear decay to the
peated exposure to cooking emission), and after heating (orange tri- final residual monolayer. This shape was reproducible across
angles – removal of organic residue at room temperature) for the three runs under these conditions, as well as in five runs with
multi-ozonolysis reaction shown as a time evolution plot in Fig. 4. the salt subphase at 3 ± 1 ◦ C. One of these five runs in which
a residue was detectable may have simply been a slow lin-
ear decay that was not allowed to run to completion – as this
ing steps are omitted, and only fits shown as all three data
arresting of exponential decay and replacement with a much
series heavily overlap), and Fig. S6 in the Supplement fo-
slower linear decay was unexpected, it was initially difficult
cuses in on the build-up of the product monolayer by exclud-
to distinguish from the stable residual monolayer, as seen in
ing the spreading R vs. Q curves from the plot and zooming
pure water at 3 ± 1 ◦ C and after the slow linear decay in salt
in on the post-ozonolysis reflectivity data. In Fig. 5, the data
water at −2 ± 1 ◦ C.
points for the spreading of additional material (two series)
We can currently only speculate about what exactly is
are removed for clarity (they very closely overlap the initial
causing this deviation from expected stretched exponential
spreading data), and only the fits are shown.
decay in the low-temperature salt water conditions. The most
likely explanation seems to be that some deuterated products
https://doi.org/10.5194/acp-21-1325-2021 Atmos. Chem. Phys., 21, 1325–1340, 20211332 B. Woden et al.: Ozonolysis of fatty acid monolayers at the air–water interface
are building up on the surface throughout the reaction and products and therefore is the hardest to predict as regards to
then slowly partitioning away from the interface (in a process its partitioning. King et al. (2009) suggest tentatively that it
which goes to completion at 3 ± 1 ◦ C but not at −2 ± 1 ◦ C). does not partition to the interface.
From the results discussed so far and knowledge of the
3.6 Product elucidation with partially deuterated volatility, solubility, and amphiphilicity of the candidate
reactants at near-zero temperatures: pure water species, it is reasonable to dismiss nonanal from consider-
subphase ation due to its measured partition to the gas phase in a very
similar reaction and due to the lack of any obvious significant
In order to understand what the atmospheric impacts of this amphiphilicity in the structure of the molecule. The results
product monolayer are likely to be, it is important to un- discussed so far do not allow discernment between nonanoic
derstand its composition. The ozonolysis of oleic acid (see acid, azelaic acid, and 9-oxononanoic acid, all of which, if
Scheme 1) produces four initial products: nonanoic acid (es- present as product monolayers, could produce the observed
timated vapour pressure at 25 ◦ C: 0.0 ± 0.5 mm Hg; all esti- results.
mated vapour pressures are from ChemSpider), nonanal (es- However, the use of a partially deuterated form of oleic
timated vapour pressure at 25 ◦ C: 0.5 ± 0.4 mm Hg), azelaic acid allows for some discernment between possibilities.
acid (estimated vapour pressure at 25 ◦ C: 0.0 ± 1.8 mm Hg), Deuteration of only the tail side of the double bond of the
and 9-oxononanoic acid (estimated vapour pressure at 25 ◦ C: oleic acid molecule (shown in teal in Scheme 1) facilitates
0.0 ± 1.4 mm Hg). It should be noted that recent work has re- an ozonolysis reaction in which two of the products (nonanal
ported that Criegee intermediates not only re-arrange to form and nonanoic acid) will be deuterated (and thus detectable
carboxylic acids, but may also react with species such as car- via neutron reflectometry) and the other two (9-oxononanoic
boxylic acids, leading to formation of hydroperoxide esters acid and azelaic acid) will not be deuterated (and thus will
(see e.g. work at the air–water interface by Enami and Co- not be detectable via neutron reflectometry).
lussi, 2017, on reactions of cis-pinonic acid with Criegee Depending on the makeup of the product monolayer, the
intermediates produced from the ozonolysis of sesquiter- measured residue (as a fraction of initial deuterated mate-
penes and by Zhou et al., 2019, on reactions of condensed- rial) will vary from nothing (signifying a product monolayer
phase Criegee intermediates with carboxylic acids and per- made up entirely of azelaic acid and/or 9-oxononanoic acid)
fluoroalkyl carboxylic acids). To our knowledge there are no to twice the relative amount (the same absolute amount if the
studies on oleic acid reacting with Criegee intermediates, but same initial surface concentration of oleic acid is assumed)
it is clearly possible that the simple four products presented as in the d34 case (signifying a product monolayer made up
here are not the only products given the potential for sec- entirely of nonanoic acid).
ondary chemistry. For our specific approach of studying a This experiment was carried out on a pure water subphase
floating monolayer on water, secondary reactions seem com- at 3 ± 1 ◦ C, and the result was intermediate between these
parably unlikely given the geometry and relatively low con- two possible extremes. The fraction of deuterated material
centration of oleic acid compared to ozone in the conditions remaining at the interface was calculated for five ozonoly-
applied. Future studies as a function of oleic acid surface cov- sis reactions, and the mean deuterated residue fraction was
erage could disentangle this chemistry to some extent and po- 9.8 %, with a 95 % confidence interval (assuming sampling
tentially provide evidence for Criegee intermediates reacting from a Gaussian distribution as before) of ±2.0 % (absolute).
with oleic acid. The confidence interval here heavily overlaps with the con-
Out of the four initial products described in Scheme 1, fidence interval for the mean deuterated residue fraction for
nonanoic acid is the most obviously amphiphilic product and the d34 experiment, so the two values are not significantly dif-
thus the prime candidate picked out in the past for possi- ferent. Indistinguishable fractional deuterated residue means
ble membership in a post-ozonolysis monolayer (King et al., that, from the same oleic acid surface concentration starting
2009). Nonanal has been reported as partitioning to the gas point, the deuterated residue present in a d18 experiment is
phase upon oxidation of methyl oleate monolayers (McNeill half of what it is in a d34 experiment. This implies a prod-
et al., 2007). The surfactant activity of azelaic acid is under uct monolayer made up of roughly equal molar amounts of
debate, with Voss et al. (2007) suggesting no surfactant ac- nonanoic acid and azelaic and/or 9-oxononanoic acids (the
tivity and Tuckermann (2007) taking the opposite view. The ratio between these latter two cannot be determined by this
room-temperature solubility of azelaic acid (2.4 g L−1 ; Tuck- method, as both are deuterated in a d34 experiment and non-
ermann, 2007) is much higher than that of nonanoic acid deuterated in a d18 experiment). While there are limited data
(0.28 g L−1 ; Gilman et al., 2004), so, in a reaction produc- available on the temperature dependence of the solubilities
ing both products, azelaic acid is more likely to partition into of these three products, the solubility of azelaic acid has
the bulk rather than to the interface, although there is no con- been reported to reduce to 1.0 g L−1 at 1 ◦ C from 2.4 g L−1 at
clusive evidence that it does not partition to the interface. 20 ◦ C (O’Neil, 2006), which suggests that azelaic acid may
King et al. (2009) suggest that it most likely partitions to the be lost to the subphase at room temperature while being re-
bulk. 9-Oxononanoic acid is not as well studied as the other tained at the air–water interface at near-zero temperatures.
Atmos. Chem. Phys., 21, 1325–1340, 2021 https://doi.org/10.5194/acp-21-1325-2021B. Woden et al.: Ozonolysis of fatty acid monolayers at the air–water interface 1333
observed for d34 -oleic acid ozonolysis. This allowed inves-
tigation of the likely makeup of the product monolayer in
the same way as under the pure water 3 ± 1 ◦ C conditions.
However, the yet lower absolute amounts of residual deuter-
ated material in this experiment posed sensitivity problems
for this method of measuring the residue, and therefore the
conclusions that can be drawn about the composition of the
product monolayer in the salt water −2 ± 1 ◦ C conditions are
less secure than those that can be drawn about the composi-
tion of the product monolayer on pure water at 3 ± 1 ◦ C dis-
cussed above.
In two out of three runs, a residue was detected. This could
be because the residue was genuinely absent in the third
run or because it was simply below the detection thresh-
old. Treating the run in which no residue was measurable
Figure 6. Ozonolysis of a partially deuterated oleic acid monolayer
as a measurement of zero residue yields a mean fractional
floating on pure vs. salt water. Time evolution plot for ozonolysis of
17 µL 1.3 g L−1 d18 -OA (CHCl3 spreading solution) on pure water deuterated residue of 5.6 % with a 95 % confidence interval
(green circles) and 36 g L−1 NaCl(aq) (purple squares) subphases of ±2.9 % (absolute) for this system. This may be a slight un-
by 323 ± 29 ppb O3 introduced at t = 0 s at 3 ± 1 ◦ C (pure water) derestimate of the true value due to the treatment of below-
or −2 ± 1 ◦ C (salt water). threshold residue as zero residue.
Based on our analysis, the product monolayer cannot be
predominantly composed of nonanoic acid, as that would
Figure 6 shows a representative example of a time series of produce a significantly higher fractional deuterated residual
120 s time slices for this reaction on pure water, as well as the in the d18 case than in the d34 case, which can be ruled out
reaction on a salt subphase. The absolute amount of deuter- by our data. It is not possible to say with confidence that the
ated material in the residue is about half of that seen for the composition of this product monolayer is similar to that ob-
d34 experiment in the same conditions (see Fig. 2), and this served in the pure water 3 ± 1 ◦ C conditions (a roughly equal
comes close to the detection limit for 120 s count times in mixture of nonanoic acid and azelaic/9-oxononanoic acids),
this neutron reflectometry setup. This results in many non- as the data are also consistent with somewhat lower relative
converging fits for the product monolayer, making its identi- levels of nonanoic acid (though not none at all, as that would
fication via this method of analysis alone difficult. However, produce no measurable residue).
taking longer time slices allows for a reliable discernment of It must be noted that, in this particular case, an assump-
a product monolayer, as the quality of the reflectivity statis- tion had to be made that the reaction would have proceeded
tics scales with the square root of count time (assuming a to completion within 4000 s and that anything measured af-
constant neutron flux). This is also illustrated in the stage- ter that point was a stable residue. This is because the residue
by-stage R vs. Q reflectivity plots displayed in Fig. S7 in the was, in all these d18 salt water −2 ± 1 ◦ C cases, below the de-
Supplement. tection threshold for a 120 s count time. This meant that the
A topping-up and re-oxidisation experiment was also car- reaction could not be followed to ascertain at which point the
ried out with d18 -oleic acid, and the results were analogous system was stable in order to define a period over which the
to those for the d34 -oleic acid experiment (except scaled residue could be more accurately measured using a single re-
down by a factor of 2). This demonstrates that both the flectivity curve compiled over a long count time. As the salt-
nonanoic acid and azelaic/9-oxononanoic acid components water trace in Fig. 2 (low temperature) shows, the reaction on
of the product monolayer can be built up over time (if only salt water at low temperatures proceeds to completion over a
nonanoic acid were to build up, then the build-up of frac- much longer time frame than the pure water equivalent.
tional deuterated residue would be faster in the d18 experi- In order to measure the stable residue, the 120 s interval
ment; if only azelaic/9-oxononanoic acid were to build up, time series graph is first prepared, and the slope of that graph
then no build-up would be observed in the d18 experiment). is then used to determine at what point a stable residue has
These data are included in the Supplement (Figs. S9 and formed, and the time period during which that graph is flat
S10). is then averaged over to create the single after-ozonolysis
reflectivity curve which is shown in the R vs. Q reflectiv-
3.7 Product elucidation at near-zero temperatures with ity graphs and used to determine the fractional deuterated
partially deuterated reactants: salt water subphase residue values. For instance, Fig. 2 shows that the signal is
no longer declining after 4000 s, so the time period used for
A series of d18 experiments was also run for the salt wa- the after-ozonolysis reflectivity curve in Fig. S4 is 4000–
ter subphase at −2 ± 1 ◦ C in which measurable residue was 4500 s (heating began at 4500 s). For all fractional deuter-
https://doi.org/10.5194/acp-21-1325-2021 Atmos. Chem. Phys., 21, 1325–1340, 20211334 B. Woden et al.: Ozonolysis of fatty acid monolayers at the air–water interface
ated residue calculations except these last (for d18 salt water
−2 ± 1 ◦ C), the 120 s time series interval graphs have been
able to guide the time integration ranges for the step-by-step
R vs. Q reflectivity curves (see Fig. S7 in the Supplement).
However, for the d18 salt water −2 ± 1 ◦ C experiment, the
absolute signal from the residue was so low that 120 s count
times were not sufficient. As a result, the reaction was as-
sumed to have completed by 4000 s (longer than any ob-
served reaction times), and signal was averaged from this
point until heating in order to quantify the residue.
Figures 6 and S8 (in the Supplement) show a time series
and R vs. Q reflectivity plots for these conditions. The time
series plot demonstrates that any residue is below the de-
tection limit for 120 s of counting; however, the 500 s over
Figure 7. Gradual loss of residue due to increase in tempera-
which the after-ozonolysis reflectivity curve is calculated af-
ture. Time evolution plot for ozonolysis of 29 µL 1.0 g L−1 d34 -
fords good enough data to discern a residue. OA (CHCl3 spreading solution) on pure subphase by 754 ± 89 ppb
O3 introduced at t = 0 s at 2 ± 1 ◦ C, with temperature ramping (de-
3.8 Atmospheric product stability: temperature scribed in detail in the text) from t = 1035 s; error bars are omitted
threshold for visual clarity.
It has been demonstrated that a residue remains at the inter-
face after ozonolysis (2 h timescale) of an oleic acid mono-
This experiment was performed on the FIGARO reflec-
layer by gas-phase ozone at 3 ± 1 ◦ C on a pure water sub-
tometer at the ILL (experiment 9-10-1518) and showed that
phase and at −2 ± 1 ◦ C on a 36 g L−1 NaCl aqueous solution.
the product film was stable at up to 7 ± 1 ◦ C, though there
However, it would be useful to establish across what ranges
was a slight linear decay in product monolayer surface con-
of temperature this product monolayer persists.
centration with increasing temperature. On further heating
In order to investigate this, a product monolayer was grad-
to 12 ± 1 ◦ C, no threshold temperature was observed, but,
ually heated (1◦ every 5 min) to see if there was a critical
at this higher temperature, the linear decay ran into the de-
threshold temperature above which it would be rapidly re-
tection limits of the neutron reflectometry setup. This could
moved from the interface.
mean that the monolayer is not stable at or above 12 ± 1 ◦ C,
Figure 7 shows the temperature-ramping experiment in de-
or it could mean that it simply continues to gradually linearly
tail. The temperature of the subphase is controlled by vary-
decay with rising temperature above 12 ± 1 ◦ C, but passed
ing the temperature of a coupled coolant bath. For the exper-
the detection limit of the setup used for this experiment.
iments discussed thus far, the temperature of the subphase
Either way, the product monolayer is certainly stable up to
can be measured before each experiment, allowing the off-
7 ± 1 ◦ C but definitely not above 12 ± 1 ◦ C (upper limit).
set between bath and subphase to be measured and an accu-
It is important to note that a monolayer produced at
rate assessment of the subphase temperature via direct mea-
3 ± 1 ◦ C and then being stable at up to around 12 ± 1 ◦ C
surement used for each experiment. For this ramping experi-
does not mean that a reaction carried out at 12 ± 1 ◦ C
ment, it was not practical to measure the subphase tempera-
would definitely produce a stable monolayer. However, this
ture directly for every step. Instead, the relationship between
temperature-ramping experiment at least provides a hint for
bath and subphase temperatures was used to define a linear
the range of temperatures over which these product mono-
relationship between bath and subphase temperatures that
layers might persist. Most of the troposphere is below 10 ◦ C,
was deemed sufficiently accurate given the existing ±1 ◦ C
so these conditions are highly atmospherically relevant.
uncertainty. Diurnal temperature variations that could have
Hung and Tang (2010) suggested that the physical state of
disturbed this relationship were largely eliminated using air
products from the ozonolysis of solid state oleic acid parti-
conditioning to maintain the temperature of the experimen-
cles by O3 might be temperature dependent across a 4–9 ◦ C
tal area at around 15 ◦ C, which was also key in reducing
temperature range, and it is worth considering whether the ef-
the impact of condensation. The bath was set to −1 ◦ C for
fect we report in present work is linked to this phenomenon,
ozonolysis and then increased by 1 ◦ C at t = 1035 s and ev-
as there is overlap between this transition temperature range
ery 300 s following until 5 ◦ C (corresponding to a measured
and the 6–13 ◦ C transition range we observe.
subphase temperature of 7 ◦ C) was reached after 2535 s. A
single step to a bath temperature of 11 ◦ C, which corresponds
3.9 Kinetic analysis of oleic acid ozonolysis
to a subphase temperature of around 12 ◦ C, was performed at
t = 3260 s. Experiments were performed on the FIGARO reflectome-
ter at the ILL (experiment 9-10-1518) to elucidate the ef-
Atmos. Chem. Phys., 21, 1325–1340, 2021 https://doi.org/10.5194/acp-21-1325-2021B. Woden et al.: Ozonolysis of fatty acid monolayers at the air–water interface 1335
fect of temperature changes on the kinetics of the reaction.
The ozonolysis reaction was performed with [O3 ]gas ranging
between 126 ± 15 and 1005 ± 119 ppb. A pseudo-first-order
rate coefficient (k1 ) for each reaction was calculated by fit-
ting a modified exponential developed in previous work by
this group in order to account for the fact that [O3 ]gas ini-
tially builds up in the reaction chamber and thus rises steeply
at the start of the reaction as initial mixing occurs within the
chamber (Pfrang et al., 2014). The traditional first-order ex-
ponential equation that describes a second-order reaction oc-
curring with an excess of one reactant (in this case, O3 ) is
modified to (Pfrang et al., 2014)
f
−k1 t− fv 1−e− v t
0 (t) = 00 e . (3) Figure 8. Kinetics of ozonolysis of the oleic acid monolayer on pure
water at room and low temperatures. Fitted k1 pseudo-first-order
The expected exponential relationship between surface con- rate constants against [O3 ]surf at 21 ± 1 ◦ C (orange) and 2 ± 1 ◦ C
centration (0) and time (t) is modified by the inclusion of a (aqua).
second exponential function that includes constants for the
gas flow rate (f ), which is 20 cm3 s−1 for these experiments,
and chamber volume (v), which is 2.1 × 103 cm3 , but which
The fitted k2 values for these two conditions (± a
requires replacement with an effective chamber volume. The
95 % confidence interval) are (2.2 ± 0.4) × 10−10 and
derivation of Eq. (3) is presented in previous work (Pfrang et
(2.2 ± 0.2) × 10−10 cm2 s−1 at 21 and 2 ◦ C, respectively.
al., 2014).
Our experiments observe either no difference or a differ-
It is important to note that this analytical treatment is not a
ence too small to be reliably detected (a difference of < 10 %
complete description of the processes at work throughout the
might not be noticeable given the uncertainty in fitted k1
reaction. Transient reaction products at the interface are, due
parameters and [O3 ] calibration). This is a similar situation
to their deuterated nature, measured along with the reactant
to that found by Hung and Tang (2010), who observed, for
film throughout the reaction if and when they are present (this
ozonolysis of liquid oleic acid, a very slight dependence on
is why the technique is sensitive to a residual product film).
temperature based on their point estimates of reaction rate
As a result, fitting this analytical model to the data needs
that was within their margins of error (although they ob-
to take this into account. A number of assumptions have to
served a strong temperature dependence for the ozonolysis
be made about the precise way in which ozone mixes into
of solid oleic acid).
the chamber. These are discussed in detail in Sect. S3 of the
It is important to note that, as this reflectivity-based
Supplement. Here, we present and discuss the results of this
method for calculating surface concentration of oleic acid is
fitting procedure.
not sensitive only to oleic acid, but also to reaction products
Figure 8 displays fitted k1 values for reactions under a va-
that may remain at the interface, it is possible that the rate
riety of [O3 ]surf conditions at 21 and 2 ◦ C, as well as 95 %
of reaction does differ across this temperature range but that
confidence intervals for fits of k2 values (k2 = k1 /[O3 ]surf ) to
changes in product build-up and distribution conspire to en-
these data.
tirely mask this, leading to a similar trend in total adsorbed
[O3 ]surf values were calculated from [O3 ]gas values by
deuterated material at the interface. It seems highly unlikely
using a Henry’s law solubility constant for O3 in organics
that counterbalancing effects would conspire to so well bal-
of [organic] / [gas] = 11.7 (unitless) and assuming the same
ance each other out across a range of [O3 ] conditions. In any
layer thickness of 2 nm. This solubility constant is consistent
case, from an atmospheric perspective, the key question is
with the value used previously in ozonolysis experiments by
not how fast oleic acid reacts but how fast the monolayer is
King et al. (2009) and is informed by the work of Smith et
removed from the interface. These experiments confirm that
al. (2002).
changing the temperature from room temperature to a more
The error in each fitted k1 value, as noted in Sect. S3
atmospherically realistic near-zero temperature does not no-
of the Supplement, is dominated by uncertainty in model
tably alter the rate of monolayer removal from the interface.
fitting at the start of each reaction. Uncertainty in [O3 ]surf
Figure 9 shows time series of the product of SLD and
arises from uncertainties in the calibration of the Pen-Ray
thickness for the lowest and highest [O3 ]surf concentrations
ozoniser, which was performed using Beer–Lambert law
used at the two temperatures studied, to provide a clearer vi-
UV absorbance at 254 nm using an extinction coefficient of
sual confirmation of the similar rates of the two reactions.
1.13 × 10⁻¹⁷ cm−2 (Daumont et al., 1992).
It can be seen from these two comparisons that the rates of
these reactions do not differ appreciably. Indeed, the offset
https://doi.org/10.5194/acp-21-1325-2021 Atmos. Chem. Phys., 21, 1325–1340, 20211336 B. Woden et al.: Ozonolysis of fatty acid monolayers at the air–water interface
4 Conclusions
4.1 Atmospheric surface chemistry
Based on our neutron reflectometry data, we conclude that
the ozonolysis of an oleic acid monolayer on a pure water
subphase (a basic model of an atmospheric water droplet)
does not leave behind a product at the interface at room tem-
perature but does leave such a residual product film at more
atmospherically relevant near-zero temperatures and may do
so at temperatures of up to 7–12 ◦ C. Data from an experi-
ment involving re-deposition and re-ozonolysis of oleic acid
showing the build-up of this product monolayer convince us
that this is a genuine product of the reaction.
Further to this, we conclude that the ozonolysis of an oleic
Figure 9. Comparison of time-dependent loss of material from the acid monolayer film on a 36 g L−1 NaCl aqueous solution
air–water interface during oleic acid ozonolysis at room and low subphase (a basic model of a sea spray droplet) does not leave
temperatures and at highest and lowest [O3 ]. Time evolution plot for a product film at the interface at room temperature but does
ozonolysis of 39 µL 0.75 g L−1 d34 -OA (CHCl3 spreading solution) leave such a residual product film behind at temperatures be-
on pure subphase by O3 introduced at t = 0 s at 21 ± 1 ◦ C (orange)
low freezing. Such a residual product film probably is not left
and 2 ± 1 ◦ C (aqua); error bars are omitted for visual clarity.
behind after ozonolysis at the 3 ± 1 ◦ C temperature condition
at which stable product films were observed on pure water.
between the two curves is due in both cases to slight dif- Based on data from experiments performed with a partially
ferences in starting concentration. These plots also further deuterated form of oleic acid together with a knowledge of
corroborate the main result of this study – that a residue re- the expected major products of the ozonolysis, we conclude
mains after ozonolysis at near-zero temperature but not at that, for the pure water subphase, this product film is roughly
room temperature. half nonanoic acid, with the other half being azelaic acid or
The rate coefficients determined here are about 3 times 9-oxononanoic acid, or a mixture of the two. For the salt sub-
higher than those previously reported for ozonolysis of oleic phase case, the data are less conclusive on the ratio between
acid monolayers (King et al., 2009). Significant variabil- these components, though very high or very low fractions of
ity between experiments to determine rates for these het- nonanoic acid can be ruled out.
erogeneous reactions is not unprecedented. When Hung and Experiments performed at a variety of O3 concentra-
Tang (2010) investigated heterogeneous ozonolysis of liquid tions demonstrate that the rate of monolayer removal does
oleic acid, they measured a rate coefficient that was 3 times not differ significantly between the two temperatures stud-
higher than the highest value they could find in previous work ied, despite the clear qualitative differences in the end
(Moise and Rudich, 2002) and up to 10 times higher than the state of the reaction; rate coefficients were determined to
lowest. For solid state ozonolysis, the discrepancy was up to be (2.2 ± 0.4) × 10−10 and (2.2 ± 0.2) × 10−10 cm2 s−1 at
a factor of 40 (Hung and Tang, 2010). 21 ± 1 and 2 ± 1 ◦ C, respectively.
The most important conclusions here, however, are not the
4.2 Atmospheric implications
absolute rate coefficients measured but the fact that there is
not a notable difference between them. Despite the quali- Almost regardless of the chemical nature of the surface film,
tative differences between the ozonolysis of an oleic acid the result from an atmospheric physics perspective is very
monolayer at room temperature and more atmospherically similar: a film remains at the surface after ozonolysis of an
relevant near-zero temperatures (namely the presence of a oleic acid monolayer at atmospherically realistic tempera-
residual monolayer in the latter case), the kinetics of the re- tures. The presence of such a film means that the physical
action does not appear to be altered substantially in these two effects of a surface monolayer, such as reduced water up-
conditions. take, reduced surface pressure, and reduced evaporation, will
still be present, albeit not to the same extent, as they were
in the original oleic-acid-coated aerosol droplet. This means
the fact that an oleic acid film will oxidise in the atmosphere
does not render such a film irrelevant to the physical proper-
ties of the droplet in the long term, as would be the case if no
residual film remained after ozonolysis.
Atmos. Chem. Phys., 21, 1325–1340, 2021 https://doi.org/10.5194/acp-21-1325-2021You can also read