The early summertime Saharan heat low: sensitivity of the radiation budget and atmospheric heating to water vapour and dust aerosol - Atmos. Chem ...
←
→
Page content transcription
If your browser does not render page correctly, please read the page content below
Atmos. Chem. Phys., 18, 1241–1262, 2018
https://doi.org/10.5194/acp-18-1241-2018
© Author(s) 2018. This work is distributed under
the Creative Commons Attribution 3.0 License.

The early summertime Saharan heat low: sensitivity of the radiation
budget and atmospheric heating to water vapour
and dust aerosol
Netsanet K. Alamirew1 , Martin C. Todd1 , Claire L. Ryder2 , John H. Marsham3,4 , and Yi Wang1
1 Department  of Geography, University of Sussex, Brighton, UK
2 Department  of Meteorology, University of Reading, Reading, UK
3 School of Earth and Environment, University of Leeds, Leeds, UK
4 National Centre for Atmospheric Science (NCAS), Leeds, UK

Correspondence: Netsanet K. Alamirew (na286@sussex.ac.uk) and Martin C. Todd (m.todd@sussex.ac.uk)

Received: 29 April 2017 – Discussion started: 15 May 2017
Revised: 30 October 2017 – Accepted: 2 December 2017 – Published: 31 January 2018

Abstract. The Saharan heat low (SHL) is a key component           erage of 0.5 K day−1 and up to 6 K day−1 during synop-
of the west African climate system and an important driver        tic/mesoscale dust events from monsoon surges and convec-
of the west African monsoon across a range of timescales          tive cold-pool outflows (“haboobs”). On this basis, we make
of variability. The physical mechanisms driving the variabil-     inferences on the processes driving variability in the SHL
ity in the SHL remain uncertain, although water vapour has        associated with radiative and advective heating/cooling. De-
been implicated as of primary importance. Here, we quan-          pending on the synoptic context over the region, processes
tify the independent effects of variability in dust and water     driving variability involve both independent effects of water
vapour on the radiation budget and atmospheric heating of         vapour and dust and compensating events in which dust and
the region using a radiative transfer model configured with       water vapour are co-varying. Forecast models typically have
observational input data from the Fennec field campaign at        biases of up to 2 kg m−2 in column-integrated water vapour
the location of Bordj Badji Mokhtar (BBM) in southern Al-         (equivalent to a change in 2.6 W m−2 TOA net flux) and
geria (21.4◦ N, 0.9◦ E), close to the SHL core for June 2011.     typically lack variability in dust and thus are expected to
Overall, we find dust aerosol and water vapour to be of simi-     poorly represent these couplings. An improved representa-
lar importance in driving variability in the top-of-atmosphere    tion of dust and water vapour and quantification of associ-
(TOA) radiation budget and therefore the column-integrated        ated radiative impact in models is thus imperative to further
heating over the SHL (∼ 7 W m−2 per standard deviation of         understand the SHL and related climate processes.
dust aerosol optical depth – AOD). As such, we infer that
SHL intensity is likely to be similarly enhanced by the ef-
fects of dust and water vapour surge events. However, the
details of the processes differ. Dust generates substantial ra-
diative cooling at the surface (∼ 11 W m−2 per standard devi-     1   Introduction
ation of dust AOD), presumably leading to reduced sensible
heat flux in the boundary layer, which is more than com-          During boreal summer, the Saharan heat low (SHL), a low-
pensated by direct radiative heating from shortwave (SW)          level thermal low, extends over a vast sector of the central
absorption by dust in the dusty boundary layer. In contrast,      Sahara, covering much of northern Mauritania, Mali, Niger,
water vapour invokes a radiative warming at the surface of        and southern Algeria (Fig. 1). The area of low surface pres-
∼ 6 W m−2 per standard deviation of column-integrated wa-         sure is characterised by extremes of high surface tempera-
ter vapour in kg m−2 . Net effects involve a pronounced net       ture (Lavaysse et al., 2009; Messager et al., 2010) and a
atmospheric radiative convergence with heating rates on av-       deep boundary layer (BL) (Marsham et al., 2013b), and is

Published by Copernicus Publications on behalf of the European Geosciences Union.
1242                                                          N. K. Alamirew et al.: The early summertime Saharan heat low

co-located with a global maximum in seasonal dust aerosol
loading (Knippertz and Todd, 2012).
   It is increasingly recognised that the SHL is a key com-
ponent of the west African climate system and an impor-
tant driver of the west African monsoon across a range of
timescales of variability (e.g. Chauvin et al., 2010; Couvreux
et al., 2010; Lafore et al., 2010; Martin and Thorncroft, 2014;
Martin et al., 2014; Parker et al., 2005; Peyrille and Lafore,
2007; Sultan and Janicot, 2003; Thorncroft and Blackburn,
1999; Xue et al., 2010). Notably, the intensification of the
SHL in recent decades has been linked to the recovery of
the Sahelian rainfall from the multi-decadal drought of the
1970–1990s, partly through a water vapour positive feedback
process, in which radiative warming from increasing water
vapour strengthens the SHL, which enhances the moist low-
level monsoon flow, driving greater water vapour transport          Figure 1. Climatological state of the Saharan heat low region (mean
into the SHL and further warming (Dong and Sutton, 2015;            of June, 1979–2013): SHL location, low-level circulation, and dust
Evan et al., 2015b; Lavaysse et al., 2016) with an implied          load. Shaded: the mean position of heat low region (occurrence fre-
                                                                    quency of 90 % of low-level atmospheric thickness); arrows: mean
enhanced west African monsoon.
                                                                    925 hPa wind; blue line: the mean position of the intertropical dis-
   The SHL results from a complex interplay of heating pro-         continuity from ERA-Interim reanalysis data and aerosol optical
cesses within the Saharan BL, from the conversion of large          depth (AOD) from Multi-angle Imaging Spectroradiometer (MISR)
radiative surpluses at the surface into sensible heat flux, cool-   satellite data (contour intervals are 0.4, 0.6, and 0.8 for grey, white,
ing from horizontal temperature advection (itself a function        and cyan lines). The purple rectangle denotes the location of the
of the strength of the pressure gradient into the SHL core),        Fennec supersite 1 (SS1).
and radiative cooling and adiabatic warming via subsidence
in the upper BL (Alamirew et al., 2018). The SHL inten-
sity is therefore likely to be modulated by radiative effects       fundamental structure and maintenance and variability of
of variability in surface albedo, dust aerosol, water vapour,       the SHL. Addressing these research gaps is hindered by the
and clouds which feed back onto the circulation, and thus           acute shortage of routine observations in the region and large
advective cooling, water vapour transport, and the processes        discrepancies between models and reanalyses (Evan et al.,
governing dust emission and transport. In addition, the SHL         2015a; Roberts et al., 2015).
is also modulated by external dynamical controls on advec-             This paper seeks to address these gaps in our understand-
tive cooling from both tropical (Knippertz and Todd, 2012)          ing of radiative processes within the SHL during early sum-
and extratropical sources (Chauvin et al., 2010).                   mer. Specifically, its aim is to quantify the separate roles of
   Previous studies have quantified direct radiative effects        water vapour and dust aerosol in controlling the top of the at-
(DREs) of dust aerosol at the top of atmosphere (TOA) and           mosphere, surface, and the vertical profile of the atmospheric
the surface from in situ observations and satellite data (Ansell    column radiative budget. This will be achieved through ra-
et al., 2014; Banks and Brindley, 2013; Yang et al., 2009),         diative transfer (RT) model simulations using uniquely de-
whilst Marsham et al. (2016), hereafter M16, extend this em-        tailed observations of atmospheric conditions over the SHL
pirically to consider water vapour variations and implicitly        region during early summer, including those from the main
clouds as well as dust. However, there remain important gaps        supersite of the recent Fennec field campaign (Marsham et
in our understanding. First, there are substantial uncertainties    al., 2013b). Best estimates and associated uncertainty are es-
in the magnitudes of radiative fluxes (and other heat budget        tablished through a set of RT model experiments testing the
terms) across both the various reanalyses and observations.         sensitivity of radiative flux and atmospheric heating rates to
Second, separating the radiative effects of water vapour from       water vapour and dust variability and to uncertainty in a set of
both associated clouds and dust aerosol is challenging from         controlling variables. In this way, we can inform interpreta-
observations, given the strong co-variability of dust and total     tion of hypotheses on drivers of SHL variability and its wider
column water vapour (TCWV) anomalies in the Sahara as-              impact on the regional climate. A description of the radiative
sociated with monsoon surges and resulting convective cold-         transfer code is given in Sect. 2, followed by a list of input
pool events (“haboobs”) which transport water vapour and            data used to run the RT model in Sect. 3. The different ex-
dust into the central Sahara (Garcia-Carreras et al., 2013;         periments used towards the optimal model configuration are
Marsham et al., 2008, 2013b). As such, there is a need to           presented in Sect. 4. Results of the mean state and sensitivity
quantify more fully the DRE of dust and water vapour, both          RT runs for water vapour and dust are given in Sect. 4. The
independently and together, over the Sahara. This informa-          paper is concluded by presenting the summary and conclu-
tion is necessary to resolve the processes that govern the          sion of our results in Sect. 5.

Atmos. Chem. Phys., 18, 1241–1262, 2018                                                www.atmos-chem-phys.net/18/1241/2018/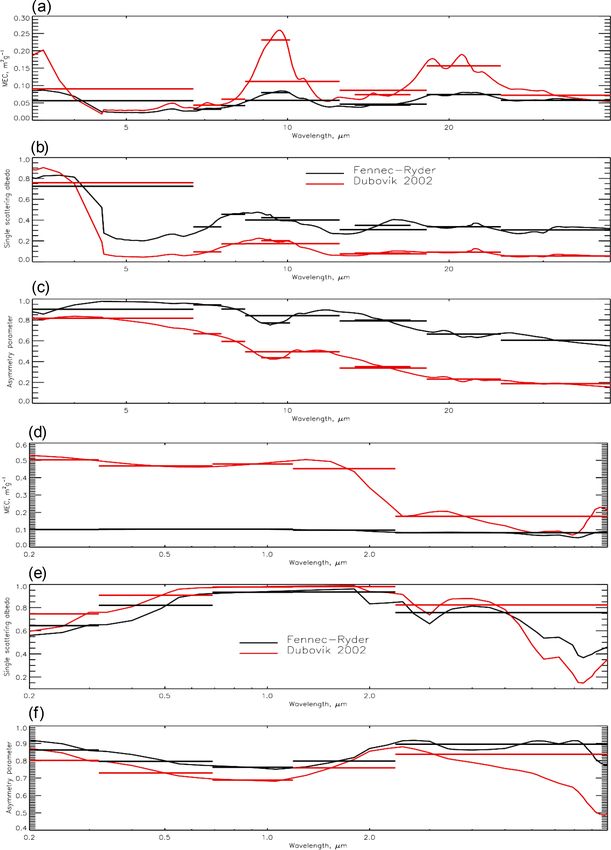
N. K. Alamirew et al.: The early summertime Saharan heat low 1243
2 Description of the SOCRATES radiative transfer TERRA footprint instantaneous gridded data (CERES Foot-
model print), twice daily with 1◦ resolution.
For our high-resolution, pixel-based analysis focused on a
The research questions are addressed through simulations single location, Bordj Badji Mokhtar (BBM), cloud screen-
from a column stand-alone RT model. Such models are com- ing is notoriously challenging. For GERB data, we apply the
monly used for detailing the combined and unique radia- EUMETSAT cloud mask to derive clear-sky and all-sky con-
tive impact of dust aerosol and water vapour (Osborne et ditions, and for CERES data, we use both all-sky and clear-
al., 2011; Osipov et al., 2015; Otto et al., 2007, 2009, 2011; sky products. MODIS cloud parameters are used to derive
Slingo et al., 2006). RT models typically comprise a radia- CERES cloud-free fluxes. However, analysis of GERB all-
tive transfer core and a pre-processor to configure the neces- sky minus clear-sky fluxes at BBM suggests unrealistically
sary information on the radiatively active atmospheric con- small cloud DRE (∼ 2 W m−2 in longwave flux), which indi-
stituents and surface characteristics. Typically, these include cates that the cloud mask is not robust. We therefore choose
meteorological and gas component profiles, aerosol optical only to use GERB all-sky fluxes and limit the clear-sky-only
properties and profiles, and surface optical properties. analysis to the CERES products. For “validation” of the “op-
Here, we use the Suite Of Community Radiative Trans- timum” model configuration (see Sect. 4), we favour com-
fer codes based on Edwards and Slingo (SOCRATES; Ed- parison with GERB (all-sky) because the time period of the
wards and Slingo, 1996; Randles et al., 2013) model con- CERES monthly product is not exactly compatible with the
figured with observed and idealised profiles of water vapour RT simulations of 8–30 June, whilst the CERES footprint
and dust aerosol, as described below. SOCRATES is a flex- data have observations twice daily.
ible RT model, operated here in two streams of stand-alone Surface measurements of shortwave and longwave up-
radiative transfer code, which calculates the longwave and welling and downwelling radiation are obtained from Kipp
shortwave radiative fluxes and heating rates throughout the and Zonen CNR4 radiometers, situated at 2 m height, de-
atmosphere given the atmospheric and surface properties of ployed at BBM during the Fennec campaign (Marsham et
that column, the solar zenith for the location, date, and time. al., 2013b).
Radiative flux calculations are made for parallel plane atmo-
sphere with spectral resolution ranging over the shortwave 3.2 Atmospheric profile and surface characteristics
and longwave from 0.2 to 10 µm divided into six bands and
3.3 to 10 000 µm divided into nine bands, respectively. Col- Input data which are required to run the RT model for the
umn atmospheric and surface characteristics required to run model are meteorological fields (temperature, specific hu-
the RT model are described in Sect. 3.2 and 3.3. A detailed midity), cloud mixing ratio and fraction, active radiative
description of the model is given in Randles et al. (2013). gases vertical profile mixing ratios, and surface optical prop-
erties (skin temperature, surface pressure, broadband albedo,
and emissivity). To include the effect of aerosols in RT sim-
ulations, optical properties and the vertical profile mass mix-
3 Data and methods ing ratio of the desired aerosol should be provided.
We specify these inputs as accurately as possible using
3.1 Observed top-of-atmosphere and surface radiation observations from the recent Fennec field campaign, which
measurements obtained unique data from within the SHL region during
June 2011 (Ryder et al., 2015). We use observations from
We use satellite retrievals of TOA radiation from two ground-based instruments deployed at the Fennec supersite
sources. The first source is EUMETSAT Geostationary Earth at BBM (Marsham et al., 2013b) and various aircraft flights
Radiation Budget (GERB) (Harries et al., 2005) level-2 prod- (see Ryder et al., 2015 for an overview) complemented with
ucts of averaged rectified geolocated (ARG) fluxes at ap- fields from the European Centre for Medium-Range Weather
proximately 17 min time resolution and 50 km spatial (at Forecasts (ECMWF) ERA-Interim reanalysis (ERA-I) (Dee
nadir) resolution, with spectral ranges from 0.32 to 4 µm in et al., 2011) and Modern-Era Retrospective analysis for Re-
the shortwave and 4 to 100 µm in the longwave. The sec- search and Application (MERRA) (Rienecker et al., 2011)
ond source is the Clouds and the Earth’s Radiant Energy reanalysis, where direct observations are inadequate.
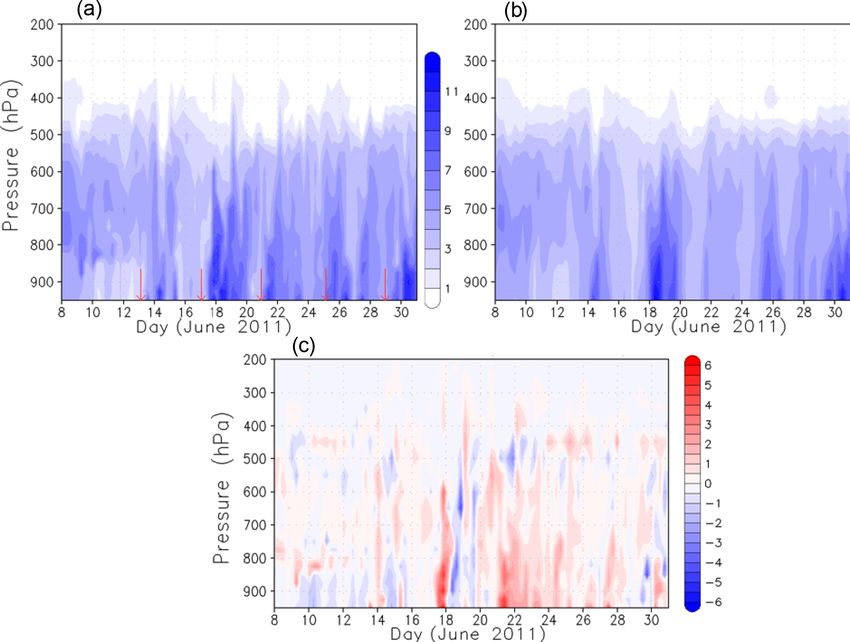
System (CERES) (Wielicki, 1996) instrument, which has Profiles of temperature and water vapour (Fig. 2) are
channels that measure total radiance (0.4–200 µm) and short- obtained from radiosonde measurements at BBM for 8–
wave radiance (0.4–4.5 µm). Since there is no longwave- 30 June 2011. The temporal resolution of radiosonde mea-
only channel on CERES, daytime longwave radiances are surements varied from 3 to 6 h over the study period. A dis-
determined from the difference between the total and short- tinction can be made between the cooler, drier, less dusty
wave channel radiances. We use two CERES products: (i) the Saharan “maritime” phase from around 8 to 12 June to a
monthly mean energy balanced and filled (EBAF) product hotter, moister, dustier “heat low” phase from around 13 to
at 1◦ resolution and (ii) the CERES level-3 SSF1deg_Hour 30 June (Fig. 2a), during which time both synoptic-scale
www.atmos-chem-phys.net/18/1241/2018/ Atmos. Chem. Phys., 18, 1241–1262, 2018
1244                                                          N. K. Alamirew et al.: The early summertime Saharan heat low

Figure 2. Vertical profile specific humidity (g kg−1 ): (a) Fennec radiosonde measurements, (b) ERA-Interim, and (c) difference between
panels (a) and (b). Red arrows in panel (a) denote times of major haboob events.

monsoon surges and mesoscale convective cold-pool events              are also taken from the standard tropical atmosphere. This is
transported both water vapour and dust into the heart of the          unlikely to affect RT model results significantly since there
SHL (see Ryder et al., 2015; Todd et al., 2013 for full de-           is little day-to-day variability in the uppermost part of the
tails). For comparison, profiles of water vapour from ERA-            atmosphere.
I reanalysis are shown in Fig. 2b. Despite the good agree-               Acquiring observations of the vertical structure of clouds
ment between measurement and model outputs, ERA-I un-                 of sufficient quality for radiative transfer calculations is al-
derestimates specific humidity in the lowest level by ∼ 4.9 %         ways challenging. Here, we use the ERA-I and MERRA out-
(MERRA by 5.5 %). The possible reasons for the remaining              puts of cloud fraction, liquid, and ice water mixing ratios.
error between observation and reanalysis products could be            Clouds are treated to have maximum overlap in a column
due to differences in model core dynamics and assimilation            where ice and water are mixed homogeneously. During the
procedures. Note that the error in reanalysis at BBM is rela-         Fennec period, clouds were characterised by shallow cumu-
tively small because the Fennec radiosonde data were assim-           lus or altocumulus near the top of the PBL and occasional
ilated. In the subsequent absence of such observational data,         deep convection. It is likely that the relatively coarse vertical
we expect reanalysis errors to be greater given the known             and horizontal resolution of both reanalysis models will have
problems of reanalysis model representation of mesoscale              considerable bias and we recognise that this is likely to un-
convective processes in the region (Garcia-Carreras et al.,           derestimate the true cloud-related uncertainty. For example,
2013; Roberts et al., 2015; Todd et al., 2013). Such mesoscale        M16 suggest that ERA-I underestimates cloud fraction by a
convective “cold-pool” outflow haboobs are known to make a            factor of 2.5.
significant contribution to moisture advection in addition to            We calculate surface albedo from the surface observations
being the dominant dust emission process (Marsham et al.,             of shortwave flux at BBM for the days when good measure-
2013b; Trzeciak et al., 2017). Red arrows in Fig. 2a denote           ment is available (see Fig. 3). During the days where mea-
major haboob events.                                                  surements were not good, we use the diurnal average surface
   Profiles of trace gases required for the radiative transfer        albedo of all other days. The mean surface albedo at BBM
model (CO2 , O2 , N2 O, O3 , and CH4 ) are taken from the             is 0.36 and shows a strong diurnal cycle, varying with solar
standard tropical atmosphere (Anderson et al., 1986). Tem-            zenith angle giving maximum surface shortwave reflection
perature and water vapour profiles beyond the upper maxi-             during the morning and evening hours, i.e. when the Sun is
mum height of the radiosonde data (approximately 20 km)               at high solar zenith angles. This has an impact on the diur-

Atmos. Chem. Phys., 18, 1241–1262, 2018                                                 www.atmos-chem-phys.net/18/1241/2018/
N. K. Alamirew et al.: The early summertime Saharan heat low 1245
Further information on the optical properties for the two dust
distributions is provided in the Supplement (Sect. S1).
No observations of the vertical profile of dust load-
ing at BBM are available from the Fennec instrumenta-
tion. Since the model requires the vertical distribution of
mass mixing ratio of dust as an input, we use the long-
term mean extinction coefficient profiles for dust aerosol de-
rived from the Cloud-Aerosol Lidar with Orthogonal Polar-
ization (CALIOP) (Liu et al., 2009; Winker et al., 2009)
satellite instrument. Data from all individual CALIOP satel-
lite orbits over the 2006–2014 period were quality con-
trolled and screened to retain dust-aerosol-only observa-
tions using the method described in Todd and Cavazos-
Guerra (2016), which provides sampling for robust charac-
terisation of aerosol distribution in three dimensions (Ridley
et al., 2012; Todd and Cavazos-Guerra, 2016; Winker et al.,
Figure 3. Diurnal cycle of mean surface albedo at BBM. 2009). The long-term mean extinction coefficient profile at
BBM (Fig. 6) shows a regular decrease of extinction through
the aerosol layer which extends up to about 5 km at the top
nal cycle of dust radiative effect (Ansell et al., 2014; Banks of the planetary boundary layer, which is also seen in Fennec
et al., 2014; Osipov et al., 2015). Fennec does not provide airborne measurements from 2011 (Ryder et al., 2013a).
measurements of skin temperature, and thus we look for the This extinction profile is scaled at each model time step to
best alternative approximations from ERA-I and MERRA. yield the observed column-integrated aerosol optical depth
For comparison, we also use the skin temperature product (AOD) from the BBM AERONET sun photometer. We then
from CERES level-3 SSF1deg_Hour TERRA footprint data. use the mass extinction coefficient (in m2 kg−1 ) to convert
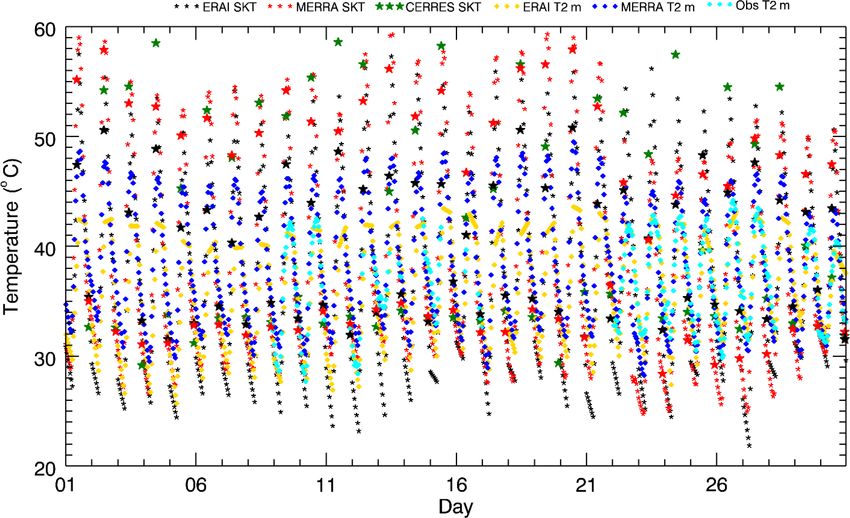
Figure 4 shows time series of skin temperature and 2 m air dust extinction coefficient (in m−1 ) to dust mass mixing ratio
temperature from observation and reanalysis. (kg / kg) as required by the model (e.g. Greed et al., 2008).
Mass extinction coefficient is calculated from Mie code (see
3.3 Dust optical properties and extinction profile Fig. 5).
AOD data used to scale the mean extinction coefficient
Dust radiative effect is known to be influenced by size dis- profiles are taken from retrievals from the AERONET (Hol-
tribution (Otto et al., 2009; Ryder et al., 2013a, b), which ben et al., 1998) instrument at BBM, using level-2 data
remains uncertain over the Sahara. We test the RT model which are cloud screened and quality assured. We compared
sensitivity to two different and highly contrasting dust size AERONET AOD with estimates of AOD from the Spin-
distributions (i) derived using AErosol RObotic NETwork ning Enhanced Visible and Infrared Imager (SEVIRI) instru-
(AERONET) sun photometer inversions from Cabo Verde, ment on the Meteosat-9 satellite (derived from the 550 nm
representative of transported dust (Dubovik et al., 2002), re- channel using the algorithm of Banks and Brindley, 2013)
ferred to as Dubovik hereafter, and (ii) measured directly over the June 2011 study period (Fig. 7). The more frequent
from aircraft observations during the Fennec campaign (Ry- dust events during the latter half of the month (heat low
der et al., 2013b) referred to as Fennec-Ryder hereafter, phase) compared to the earlier heat maritime phase is appar-
which include a pronounced coarse mode with effective ent, with dust events frequently associated with high water
diameter in the range between 2.3 and 19.4 µm, contrast- vapour indicative of convective cold-pool haboob dust events
ing with the much finer size distribution of Dubovik from (see Fig. 2a). The estimates of mean AOD agree to within
AERONET. In both cases, the dust size distributions and 20 % and there is a strong correlation between the two esti-
same measured refractive index (Ryder et al., 2013b) are mates of 0.7, despite some dust events apparent in SEVIRI
used as inputs to Mie code in the RT pre-processor from but not AERONET, e.g. 13 and 29 June. This is mainly due
which the optical properties of dust are calculated, specifi- to AERONET masking dust as clouds particularly in cases
cally the single scattering albedo (ω or SSA), mass extinc- when dust and clouds coexist.
tion coefficient (known as MEC or Kext units m2 kg−1 ), and Nighttime dust emission is common during summer in the
asymmetry parameter (g), for the relevant spectral bands ap- SHL region, although we expect the dust shortwave day-
plied in the RT model. Figure 5 displays the wavelength de- time radiative effect to be dominant (Banks et al., 2014).
pendence of optical properties for both Dubovik and Fennec- Estimation of AOD at night is problematic for most pas-
Ryder dust size distributions. The continuous lines are the sive instruments and we use the following method: estimate
spectrally resolved optical properties and the horizontal lines AOD from observations of scattering from the nephelome-
are the band-averaged data which are used in the RT code. ter instrument deployed near the surface at BBM (Rocha-
www.atmos-chem-phys.net/18/1241/2018/ Atmos. Chem. Phys., 18, 1241–1262, 2018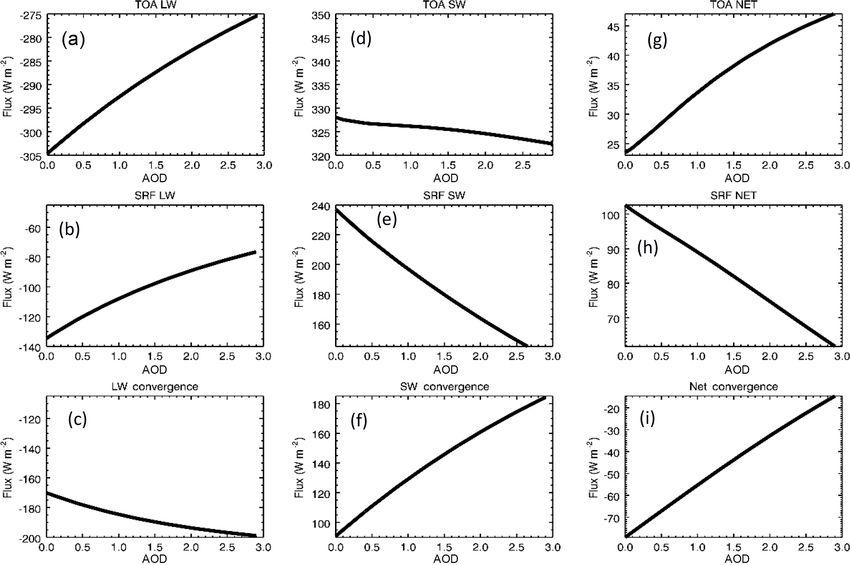
1246                                                          N. K. Alamirew et al.: The early summertime Saharan heat low

Figure 4. Surface skin temperature (SKT) (stars) and 2 m air temperature (diamonds) at BBM. The bigger black and red stars denote ERA-I
and MERRA skin temperature at the time steps when there are CERES observations.

Lima et al., 2018), based on the regression of scattering to               lites, e.g. Yang et al., 2009; Ansell et al., 2014) and
column-integrated AOD during coincident daytime observa-                   we use dust optical properties generated using Dubovik
tions. The nephelometer-based estimates of AOD will ac-                    size distribution in the optimum configuration. Recent
count for nighttime emission of dust due to haboobs (Mar-                  work suggests that the dust optical properties at BBM
sham et al., 2013b) but since haboobs tend to occupy a shal-               in June 2011 were significantly less absorbing than both
lower layer than the better-mixed daytime dust, this will tend             those measured by the aircraft further west during Fen-
to overestimate AODs estimated at night. However, this will                nec and the Dubovik representation (less absorbing,
not have a significant effect on the overall result, since at              smaller sized) with SSA values of 0.99 (Rocha-Lima et
night there is only longwave forcing which is small compared               al., 2018). Therefore, optical properties generated using
to shortwave forcing.                                                      Dubovik size distribution and measured refractive in-
                                                                           dex represent intermediate values in terms of shortwave
3.4    RT model experiments                                                (SW) absorption.
We undertake two types of RT experiments in this study:
                                                                         Given that we do not have accurate data for all the input
  i. The first type is model “configuration mode”, through            required to run the RT model, it is not unexpected to get some
     which we test the sensitivity of simulated radiative             uncertainty in our results. However, we have chosen the in-
     fluxes to uncertainty in as many of the input variables          puts in such a way that the calculated fluxes are as close as
     as possible (see Sect. S2 in the Supplement). The de-            possible to observation. This will result in an acceptably con-
     scription and results of all sensitivity experiments to          figured model for the experimental analysis presented next.
     the choice of different input data are provided in the
     Supplement (Sect. S3 and Table S1). Here, we present               ii. The second type of experiment is model “experiment
     the results of the sensitivity experiments to dust size                mode”, through which we address the research ques-
     distribution since it is an important part of the paper.               tions, specifically to quantify the combined and sepa-
     Sensitivity to the two contrasting dust size distribu-                 rate DREs of water vapour and dust. To this end, we
     tions is pronounced. As expected, results using Fennec-                undertook a number of experiments summarised in Ta-
     Ryder dust show much stronger absorption in the short-                 ble 1, with results described in Sect. 4. For all the ex-
     wave is compared with the Dubovik dust distribution,                   periments, RT calculations are made for each day using
     and the resulting TOA net shortwave flux is higher by                  the atmospheric profiles at hourly time steps over the
     25 W m−2 in the former. These shortwave fluxes using                   diurnal cycle, and the mean flux and heating rates are
     the Fennec-Ryder distribution are not consistent with                  derived by averaging outputs at each time step. For this
     the GERB/CERES satellite observations (nor with pre-                   purpose, all input data are linearly interpolated to a 1 h
     vious estimates of shortwave DRE derived from satel-                   temporal resolution.

Atmos. Chem. Phys., 18, 1241–1262, 2018                                                 www.atmos-chem-phys.net/18/1241/2018/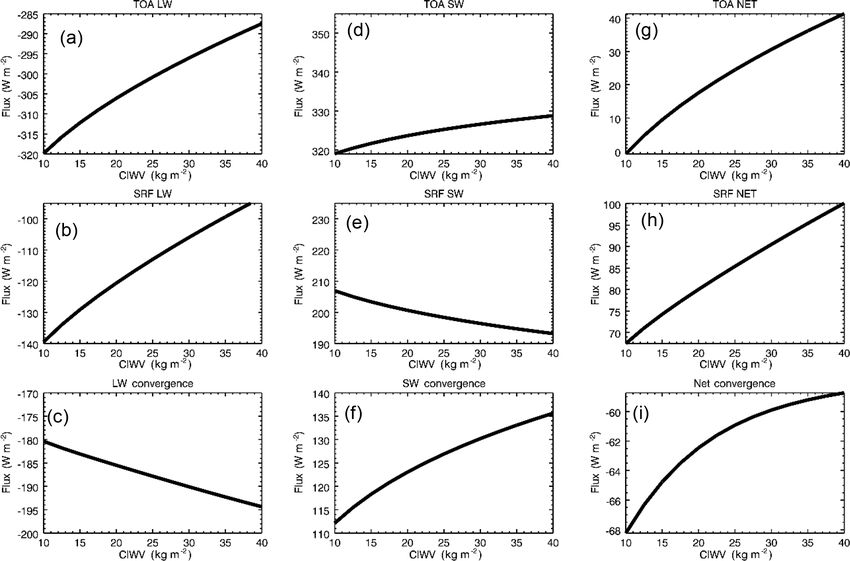
N. K. Alamirew et al.: The early summertime Saharan heat low                                                                                1247

Figure 5. Wavelength dependence of optical properties of dust particle for longwave (a, b, c) and shortwave (d, e, f). (a, d) Mass extinction
coefficient, (b, e) single scattering albedo, and (c, f) asymmetry parameter. The continuous lines are the spectrally resolved optical properties,
and the horizontal lines are the band-averaged data that are used in the RT code.

For experiments with (“w”) and without (“n”) dust (“D”), we                and with no clouds (nC). For the dust sensitivity experi-
simulate the 8–30 June 2011 period. For sensitivity (“sen”)                ment (“senDnC”), AOD is increased linearly over the range
experiments, we simulate linearly increased levels of dust                 from 0 (dust-free) to 3 (extremely dusty), while keeping the
AOD and water vapour. We use runs both with clouds (“C”)                   mean value of water vapour constant. For the water vapour

www.atmos-chem-phys.net/18/1241/2018/                                                         Atmos. Chem. Phys., 18, 1241–1262, 2018
1248                                                         N. K. Alamirew et al.: The early summertime Saharan heat low

                                                                   lected input parameters for further experiments is shown in
                                                                   Table S1 (column 4).
                                                                      The RT model with the above choices of input data is con-
                                                                   sidered to be the “optimum” configuration, and we validate
                                                                   TOA and surface fluxes with respect to satellite and surface
                                                                   observations, respectively (Tables 2 and 3) for the most “re-
                                                                   alistic” experiment (wDwC). The sign convention used here
                                                                   and in the remainder of the paper is that downward flux is
                                                                   considered as positive while upward radiation is negative.
                                                                      The simulated TOA net shortwave flux is 321 W m−2 ,
                                                                   compared with 314 W m−2 in GERB. It is −290 W m−2 for
                                                                   net longwave, with −276 W m−2 in GERB, giving 31 W m−2
                                                                   for net radiation, compared with 38 W m−2 in GERB; i.e.
                                                                   there is more shortwave heating in the model, with more
                                                                   longwave cooling, giving less net TOA heating. These RT
                                                                   model shortwave/longwave/net (SW/LW/N) biases of 7/ −
                                                                   14/ − 7 W m−2 , although larger than many of the sensi-
                                                                   tivity ranges for the input data uncertainties (Table 1),
                                                                   are within the estimated error of the GERB measurements
                                                                   (∼ 15 W m−2 ; Ansell et al., 2014). It is difficult to identify
                                                                   the most important sources of this bias although errors in
Figure 6. CALIOP mean extinction coefficient profile at BBM        the reanalysis skin temperature and ERA-I cloud represen-
2006-13.                                                           tation included in the wDwC experiment are likely candi-
                                                                   dates. The DRE of clouds provides a useful comparison and
                                                                   could be considered to be an estimate of the upper limit
sensitivity experiment (“senWVwDnC”), the mean diurnal             of cloud-related biases. Cloud DRE (Table 2) is estimated
profile of water vapour is used but is scaled so that the          from the difference in fluxes at TOA between wDnC and
column-integrated water vapour (CIWV) increases from 10            wDwC to be −4/7/3 W m−2 and from CERES-EBAF to be
to 40 kg m−2 and the mean AOD is used in each case. The            −15/16/1 W m−2 . These results of cloud DRE indicate that
DRE for dust is derived by (i) subtracting TOA and surface         the optimum configuration flux biases are within the uncer-
fluxes of experiment wDnC from nDnC and (ii) linear regres-        tainties of both observations and cloud effects. Despite the
sion of the flux dependence on the range of dust AOD from          fact we used a set of input data resulting in simulation of
the dust sensitivity experiments (senDnC), in which a single       radiative flux closest to observation and thus reduced result-
diurnal cycle is simulated. The impact of water vapour is de-      ing error, it is necessary to note there still exist uncertainties
termined by (i) composites of dry versus humid days from           raising the error in the flux calculations. For example, un-
the nDnC experiment and (ii) linear regression of the flux         certainty in dust size distribution could result in 25 W m−2
dependence on the range of water vapour from water vapour          bias, and a small fractional difference in surface albedo could
sensitivity experiments (senWVwDnC). The results of DRE            bring an error of 16 W m−2 in TOA shortwave flux (Ta-
of dust and water vapour are presented in Sect. 4.2.               ble S1).
                                                                      At the surface, there is a relatively wider disparity between
                                                                   simulated and observed fluxes (Table 3). The net shortwave
4     Results and discussion                                       simulated flux, 187 W m−2 , is 7 W m−2 more than measured
                                                                   surface shortwave flux. Net longwave flux is −103 W m−2
4.1    RT model validation                                         compared with that of measurement (−78 W m−2 ), the net
                                                                   effect being more cooling at the surface in the model than
Prior to testing the main research questions related to the rel-   measurement by 25 W m−2 . We can again give a comparison
ative roles of dust and water vapour in radiative heating, the     of cloud-related biases between our result and the CERES-
RT model was configured based on the “configuration mode”          EBAF product. Cloud SW/LW/N DRE at the surface is esti-
sensitivity analyses (described in Sect. S2 in the Supplement)     mated as −5/3/ − 2 W m−2 from the wDwC–wDnC exper-
and comparison with observed TOA fluxes from the CERES-            iments and −19/11/ − 8 W m−2 from CERES-EBAF, such
EBAF monthly mean product (clear sky in the case of all            that the shortwave bias at least could be explained by clouds
sensitivity analyses except the cloud sensitivity, which we        but not all the longwave or net radiation bias. The remain-
compare to CERES-EBAF all sky). The results of sensitivity         ing error could be attributable to measurement-related errors
experiments for the various input parameters are presented         and uncertainties to other variables such as surface emis-
in the Supplement of this paper (Sect. S3) and the list of se-     sivity, skin temperature, and surface albedo. For instance,

Atmos. Chem. Phys., 18, 1241–1262, 2018                                              www.atmos-chem-phys.net/18/1241/2018/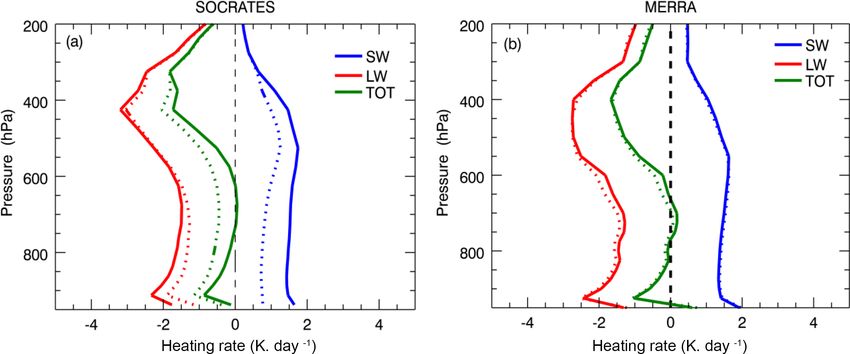
N. K. Alamirew et al.: The early summertime Saharan heat low                                                                       1249

Figure 7. AOD from AERONET and SEVIRI, and column-integrated water vapour from Fennec observations. Grey shades show the driest
days (11, 12, and 16), blue shades show the most humid days (18, 25, and 30), and green shades show a major haboob event that occurred on
the 21 June 2011 which resulted in large dust emission.

Table 1. Description of the RT “experiment mode”. Names of different experiments acronyms are defined as “n” for without, “w” for with,
“D” for dust, “C” for clouds, “WV” for water vapour, and “sen” for sensitivity.

 Name             Description                       Water vapour                       Aerosol                           Clouds
 nDnC             Dust-free and cloud-free          Observed 8–30 June 2011            None                              None
                  atmosphere
 nDwC             Dust-free but cloudy              Observed 8–30 June 2011            None                              ERA-I, MERRA
                  atmosphere                        diurnal cycle
 wDnC             Cloud-free but dusty              Observed 8–30 June 2011            AERONET AOD scaled with           None
                  atmosphere                        diurnal cycle                      CALIOP extinction
 wDwC             Dusty and cloudy atmosphere       Observed 8–30 June 2011            AERONET AOD scaled with           ERA-I, MERRA
                                                    diurnal cycle                      CALIOP extinction
 senDnC           Sensitivity to full range of      Mean diurnal WV                    Linear increase in AOD 0.0 to     None
                  possible AOD                                                         3.0; constant AOD each time
                                                                                       step for a given run
 senWVwDnC        Sensitivity to full range of      Linear increase in TCWV from       Mean diurnal AOD                  None
                  possible WV                       10 to 40 kg m−2 at 2.5 kg m−2
                                                    interval with mean diurnal WV
                                                    profile

in our sensitivity experiments, we found bias in net surface           cycle of flux bias (Fig. 8) shows that modelled outgoing
longwave flux by 6 W m−2 (Table S1) due to a difference of             longwave flux is overestimated at nighttime. Different factors
mean skin temperature of 1 K between ERA-I and MERRA                   could be attributed to this difference. Surface skin tempera-
data. Further, we found uncertainty in emissivity by 0.05 re-          ture used in this work is interpolated to 1 h (Fig. 4), which
sulting in 5 W m−2 changes in surface longwave flux. Note              could lead to errors in the longwave flux. Satellite observa-
also that the difference in time-averaging periods between             tions (see Marsham et al., 2013b) reveal both shallow cumu-
the CERES-EBAF data covering all of June 2011 and the RT               lus clouds at the top of the PBL during late afternoon and oc-
experiments wDwC–wDnC covering 8–30 June could possi-                  casional moist convection preferentially at night, which may
bly contribute to part of the differences in the above figures.        be missed in models given the poor representation of moist
   RT model bias in the longwave is larger than that in the            convection. This could also contribute to the difference be-
shortwave at both TOA and the surface. The mean diurnal

www.atmos-chem-phys.net/18/1241/2018/                                                    Atmos. Chem. Phys., 18, 1241–1262, 2018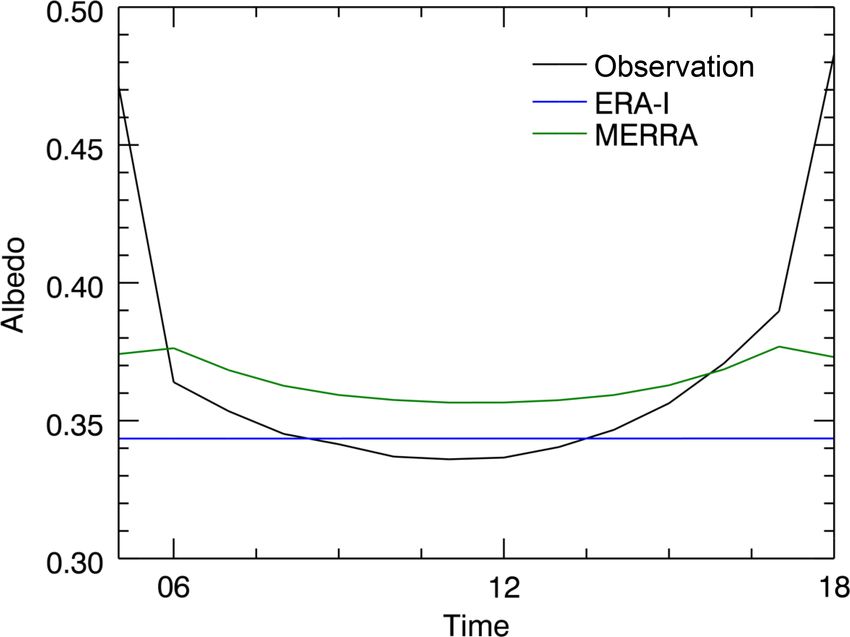
1250 N. K. Alamirew et al.: The early summertime Saharan heat low
Table 2. Mean 8–30 June 2011 TOA radiative flux at BBM (definitions of acronyms of model experiments are given in Table 1). Values are
in W m−2 . The sign convention is that downward flux is considered positive while upward flux is negative. In the sixth column, italic (bold)
fonts indicate model results overestimated (underestimated) compared with observation.
nDnC nDwC wDnC wDwC
TOA_SW SOCRATES 328 322 325 321
GERB – – – 314
MERRA 312 307 322 317
ERA-I – – 336 324
TOA_LW SOCRATES −313 −304 −297 −290
GERB – – – −276
MERRA −314 – −307 −296
ERA-I – – −309 −294
TOA_NET SOCRATES 15 18 28 31
GERB – – – 38
MERRA −2 – 15 20
ERA-I – – 27 29
Table 3. Same as Table 2 but for surface radiative flux and observations from the Fennec instrument.
nDnC nDwC wDnC wDwC
SRF_SW SOCRATES 237 232 192 187
FENNEC_OBS – – – 180
MERRA 220 215 190 185
ERA-I – – 210 199
SRF_LW SOCRATES −138 −134 −106 −103
FENNEC_OBS – – – −78
MERRA −139 – −119 −115
ERA-I – – −139 −132
SRF_NET SOCRATES 99 98 86 84
FENNEC_OBS – – – 103
MERRA 82 – 70 70
ERA-I – – 71 67
tween observed and calculated longwave flux associated with measurements compared with wDwC results and CERES
under-representation of clouds in the model. measurements for the wDwC simulation and observation can
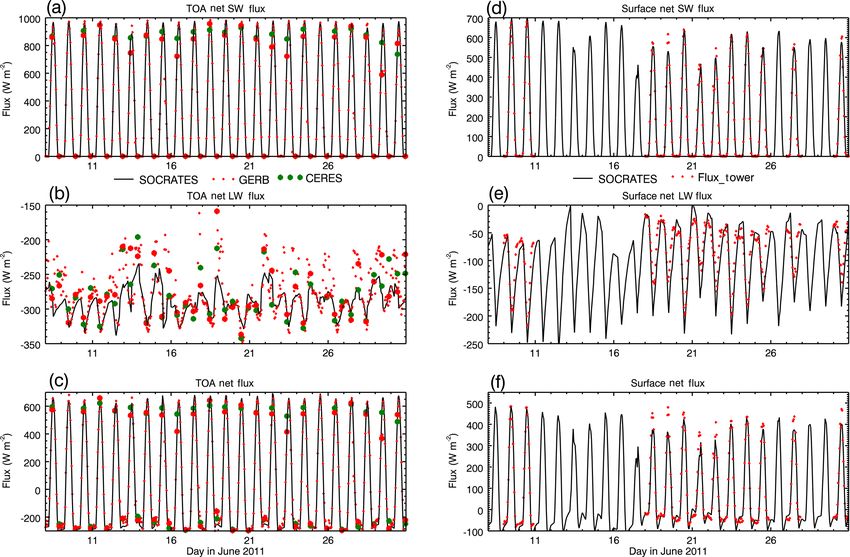
The RT simulation wDwC captures well the day-to-day be clearly seen in Fig. S2a and b.
variability in radiative fluxes at TOA and the surface (Fig. 9) We can evaluate our model wDnC experiment results
including the effect of the major synoptic and mesoscale against clear-sky CERES footprint data in which the root
dust/water vapour events, e.g. the haboob event of 21 June. mean squared errors (RMSEs) are 17 and 12 W m−2 for TOA
However, in the longwave, there are significant RT model er- shortwave and longwave fluxes, respectively. The equivalent
rors during nighttime on 17 and 18 June, which are cases of figures for the model versus GERB (cloud screened using the
high dust load following haboob events. Analysis of satellite CERES footprint cloud mask product) at the same times are
imagery shows this anomalous high GERB longwave flux 22 and 12 W m−2 . These are comparable to and consistent
to be coincident with convective cloud development, pre- with (i) the individual instrumental errors of CERES/GERB,
sumably resulting from the moistening of the Saharan at- (ii) the inter-sensor uncertainties (CERES versus GERB
mosphere, which the RT model, dependent on the reanal- RMSE of 22 and 6 W m−2 for shortwave and longwave), and
ysis cloud field, cannot capture. This coincidence of dust (iii) previous similar studies (e.g. Osipov et al., 2015).
and clouds is particularly challenging for both GERB cloud In summary, RT-simulated flux errors of the “optimum”
screening (which fails in this instance – hence our use of all- configuration are comparable to observational uncertainties
sky observations) and for the RT simulations themselves. A and those errors introduced by uncertainties in input fields.
stronger anomalous flux from the diurnal mean in GERB On this basis, we suggest the RT configuration is acceptable
Atmos. Chem. Phys., 18, 1241–1262, 2018 www.atmos-chem-phys.net/18/1241/2018/N. K. Alamirew et al.: The early summertime Saharan heat low 1251
(a) 4.2.1 Dust
1000
SOCRATES
800 GERB
Here, we determine the DRE of dust using two sets of ex-
SW flux (W m )
-2
600 periments described in Table 1. First, we compare the simu-
lations of radiative fluxes and heating during June 2011 be-
400
tween the wDnC and nDnC experiments (Figs. 10, 11, 12,
200 and 13 and Table 2). Secondly, we derive the sensitivity of ra-
0
diative fluxes and heating rates to a wide range of dust AOD
00:00 06:00 12:00 18:00
Time(UTC) using the sensitivity experiments (Fig. 11). We then compare
(b) our estimates of dust DRE to those from previous studies.
-250
The mean SW/LW/N DRE of dust at TOA for June 2011
-260
estimated from wDnC minus nDnC is −3/16/13 W m−2 ,
LW flux (W m )
-270
-2
-280
confirming the net warming effect of dust over the Sahara.
-290
This warming comes primarily in the longwave with a peak
-300
at ∼ 24 W m−2 close to midday (Fig. 10a). The net shortwave
-310
DRE is small, consistent with other estimates (Huang et al.,
-320 2014; Yang et al., 2009). However, it has a pronounced diur-
00:00 06:00 12:00 18:00
Time(UTC) nal structure driven by a semi-diurnal cycle in the shortwave
with a cooling effect of up to −29 W m−2 after dawn until
Figure 8. Mean diurnal cycle of TOA flux: (a) shortwave and 10:00 LT and after ∼ 16:00 LT until sunset, and a warming
(b) longwave. SOCRATES results are from the wDwC experiment. effect of up to ∼ 22 W m−2 around midday (Fig. 10a). The
diurnal cycle of dust DRE is not strongly dependent on the
amount of dust loading in the atmosphere but controlled by
for further analysis on the direct radiative effect of dust and solar zenith angle and surface albedo (Ansell et al., 2014;
water vapour. Banks et al., 2014). The phase function also exerts a control
on the diurnal cycle of the DRE as its value increases the
4.2 The radiative flux and heating effects of dust and backscatter fraction of SW radiation at large solar zenith an-
water vapour gles. For comparison, the equivalent TOA SW/LW/N DREs
of dust for MERRA reanalysis are 10/7/17 W m−2 , suggest-
First, we consider the TOA and surface mean radiative bud-
ing that although MERRA has a good estimate of net DRE
gets. In the absence of dust and clouds, the Saharan at-
the apparent shortwave warming effect is not in agreement
mosphere during June 2011 at BBM shows a positive ra-
with observations and the longwave warming is underesti-
diation budget at the surface of 99 W m−2 in which short-
mated.
wave heating of 237 W m−2 is offset by longwave cool-
At the surface, the SW/LW/N DRE of dust is estimated
ing of −138 W m−2 (Table 3). At TOA, the shortwave flux
to be −45/32/ − 13 W m−2 for SW/LW/N (Table 3). The
of 328 W m−2 is not quite offset by longwave losses of
net cooling is driven by the shortwave which peaks at
313 W m−2 (Table 2), leading to a net positive radiation bal-
∼ −108 W m−2 around noon (Fig. 10b), partly compensated
ance of 15 W m−2 making the SHL a weak net radiation sink.
by a longwave heating effect of 32 W m−2 . The MERRA re-
This strong (weak) radiation surplus at the surface (TOA)
analysis DRE at the surface is −30/20/−12 W m−2 , again
leads to the atmosphere having a net cooling of 83 W m−2
showing a good estimate of net effects but underestimating
(i.e. radiative divergence), presumably maintained by the
the shortwave and longwave components. The time series of
transfer of sensible heat from the surface into the atmosphere
shortwave DRE of dust (see Fig. S3a in the Supplement) at
through turbulent heat transfer (Alamirew et al., 2018).
TOA further confirms the diurnal cycle discussed above: a
Both dust and water vapour are known to play an impor-
midday warming, and early morning and late afternoon cool-
tant role in controlling the radiative budget and heating rate
ing. The impact of big dust events (e.g. 17 and 21 June) can
of surface and the atmosphere over Sahara. Variability in
be clearly seen on the time series of longwave DRE of dust
these two active radiative components is strongly correlated
(Fig. S3b).
due to the physical processes that govern transport of water
The results of sensitivity experiments “senDnC” are
vapour and dust emission into the SHL region (Marsham et
shown in Fig. 11 and the DRE per unit AOD and per unit
al., 2013b; M16) such that it is challenging to quantify their
standard deviation in AOD is presented in Table 4, assum-
separate radiative effects from observations alone. Our RT
ing a linear relationship between flux and AOD with regres-
simulations below address this research gap.
sions provided at 95 % confidence interval. We find the net
TOA shortwave flux to be only weakly sensitive to dust AOD
(Fig. 11d at −1.8 ± 0.1 W m−2 per AOD). This is due to the
competing dust effect of increasing surface albedo, which de-
www.atmos-chem-phys.net/18/1241/2018/ Atmos. Chem. Phys., 18, 1241–1262, 20181252 N. K. Alamirew et al.: The early summertime Saharan heat low
Figure 9. Time series of radiative flux at BBM. TOA longwave (a), shortwave (b), and net (c). Surface shortwave (d), longwave (e), and
net (f). The bigger red dots denote GERB measurements corresponding to CERES time steps.
consistent with the Sahara-wide estimates from satellites of
Yang et al. (2009) and those of Ansell et al. (2014). Dust
in the atmosphere acts to reduce the outgoing longwave flux
by 10.0 ± 0.4 W m−2 per unit increase in AOD (Fig. 11a),
warming the surface, consistent with the observations at
BBM of M16 (11 W m−2 per AOD increase) and within the
Sahara-wide range of Yang et al. (2009).
At the surface, dust has the opposite effect in the shortwave
and longwave, with shortwave having stronger cooling ef-
fect: for every unit increase in AOD, there is a shortwave re-
duction (Fig. 11e, Table 6) of 33.8 ± 1.3 W m−2 compared to
the increase in longwave (Fig. 11b), with 19.7 ± 1.4 W m−2
the net effect (Fig. 11h) being cooling of −14.1 ± 0.1 W m−2
per AOD increase.
Dust drives radiative convergence in the atmosphere, i.e.
the difference in TOA minus surface flux, which acts to
warm the atmosphere. This occurs through greater short-
wave absorption, at a rate of 32.1 ± 1.4 W m−2 per AOD
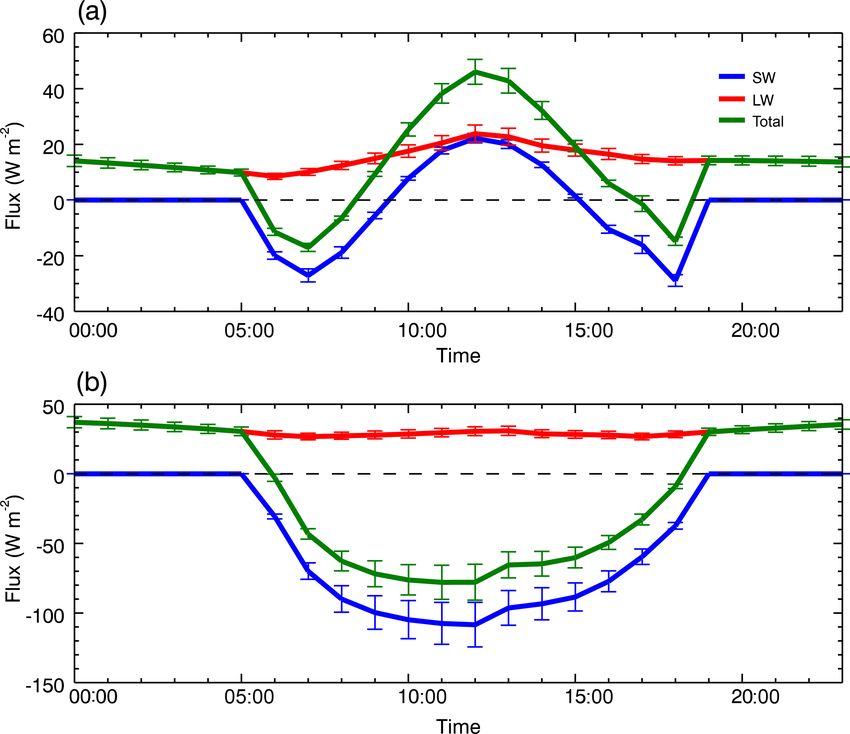
Figure 10. Mean diurnal direct radiative effect of dust averaged for
(Fig. 11f), offset partially by longwave cooling the atmo-
8–30 June 2011: (a) TOA and (b) surface. The bars show the stan- sphere at −9.7 ± 1.0 W m−2 per unit AOD increase, leading
dard error over the diurnal cycle. to a net warming effect of 22.4 ± 0.4 W m−2 per unit change
in AOD. Overall, the RT estimates of TOA and surface DRE
in the shortwave and longwave and the atmospheric radiative
convergence are within a few W m−2 of those of M16 derived
creases net TOA shortwave and absorption by dust, which in- from observations.
creases TOA net shortwave by reducing the upwelling short- We convert the radiative fluxes to actual heating rates
wave radiation. Our estimates of shortwave dust DRE are (Fig. 12a). In the absence of dust (nDnC experiment), the
less than half the sensitivity reported at BBM by M16 but
Atmos. Chem. Phys., 18, 1241–1262, 2018 www.atmos-chem-phys.net/18/1241/2018/N. K. Alamirew et al.: The early summertime Saharan heat low 1253 Figure 11. Radiative budget as a function of dust AOD. Top row: TOA longwave (a), shortwave (b), and net (c). Second row: surface longwave (a), shortwave (b), and net (c). Third row: atmospheric radiative convergence of longwave (g), shortwave (g), and net (i). Figure 12. Mean radiative heating rate profile for 8–30 June 2011 at BBM. (a) Results from nDnC (dashed lines) and wDnC (solid lines) using the Fennec profile and (b) MERRA model output for all-sky (solid lines) and clear-sky (dashed lines) conditions. PBL is heated in the shortwave mainly from absorption due to strong radiative flux from the hot desert surfaces in by O2 and water vapour peaking up to ∼ 1.3 K day−1 at the SHL. Dust acts to modify the vertical structure of this 450 hPa (the water vapour effect is shown in Fig. 14). radiative heating/cooling considerably. Absorption of short- Strong longwave cooling throughout the troposphere (up wave radiation leads to a strong warming effect in the short- to ∼ −3 K day−1 at ∼ 450 hPa) due to emission from wa- wave (especially in the dusty PBL up to ∼ 0.75 K day−1 be- ter vapour and other greenhouse gases exceeds this short- low ∼ 700 hPa, where dust loadings are the highest), off- wave heating, leading to tropospheric radiative cooling of set only partially by enhanced longwave cooling (up to ∼ −0.6 K day−1 throughout the PBL. This is consistent with ∼ −0.25 K day−1 ) resulting in a net warming of the atmo- the radiative heating estimate of Alamirew et al. (2018) de- sphere by up to ∼ 0.5 K day−1 at ∼ 700 hPa, such that the rived as a residual of the heat budget. In the lowest near- dusty troposphere above ∼ 600 hPa has near-zero cooling. surface layer (below 925 hPa), there is less longwave cooling For comparison, we consider that the MERRA reanalysis www.atmos-chem-phys.net/18/1241/2018/ Atmos. Chem. Phys., 18, 1241–1262, 2018
1254                                                           N. K. Alamirew et al.: The early summertime Saharan heat low

Table 4. Sensitivity of radiative flux to dust AOD and CIWV at selected altitudes. SD∗ indicates standard deviation (0.8 for AOD and
5.5 g kg−1 for water vapour). Mean AOD is 1.2 and mean column-integrated water vapour is 27.8 kg m−2 .

                                Change in flux                                  SW      LW      NET
                                Per unit AOD (W m−2 )            TOA            −1.8    10.0    8.2
                                                                 Surface        −33.8   19.8    −14.0
                                                                 Convergence    32.1    −9.7    22.4
                                Per unit CIWV (W kg−1 )          TOA            0.3     1.1     1.4
                                                                 Surface        −0.4    1.6     1.2
                                                                 Convergence    0.8     −0.5    0.3
                                Per one AOD SD∗ (W m−2 )         TOA            −1.4    8.0     6.6
                                                                 500 hPa        −6.2    10.6    4.4
                                                                 700 hPa        −14.8   11.6    −3.2
                                                                 Surface        −27.0   15.8    −11.3
                                                                 Convergence    25.7    −7.8    17.9
                                Per one CIWV SD∗ (W kg−1 )       TOA            1.7     5.8     7.5
                                                                 500 hPa        −0.4    9.3     8.9
                                                                 700 hPa        −1.6    9.4     7.9
                                                                 Surface        −2.4    8.3     5.9
                                                                 Convergence    4.0     −2.8    1.3

                                                                      ing large dust events (e.g. 17 and 21 June), there is strong
                                                                      shortwave heating up to 6 K day−1 around midday hours.
                                                                      This will be coincident with reduced surface net radiation
                                                                      and sensible heat flux. Together, these processes will act to
                                                                      reduce the vertical temperature gradient, stabilise the atmo-
                                                                      sphere, reduce dry convection, and reduce the depth of the
                                                                      PBL.

                                                                      4.2.2    Water vapour

                                                                      To estimate the heating rate profiles due to water vapour,
                                                                      we selected from the nDnC simulation the three driest days
                                                                      (11, 12, and 16 June) with mean column-integrated water
                                                                      vapour of 20.2 kg m−2 and three most humid days (18, 25,
                                                                      and 30 June) with mean column-integrated water vapour of
                                                                      34.7 kg m−2 . The mean heating rate profiles for the two con-
Figure 13. Shortwave radiative heating rates (K day−1 ) of dust in    trasting atmospheric conditions are shown in Fig. 14. High
the atmosphere (wDnC minus nDnC).                                     humidity drives an increase in the shortwave heating rate up
                                                                      to 0.5 K day−1 peaking near the surface. This atmospheric
                                                                      warming is counteracted by a slightly bigger cooling in the
product mean heating rate (Fig. 12b), which includes both             longwave. Thus, there is a net atmospheric cooling up to
clouds and climatological dust, is in close agreement with            −0.25 K day−1 and strong heating up to 2.5 K day−1 near
those of the wDwC experiment. However, MERRA does not                 the surface as a result of the increase in moisture. The at-
capture the day-to-day variability in shortwave heating from          mospheric cooling in the longwave causes surface warming,
dust and will not therefore be able to simulate the responses         which is suggested to be linked with the intensification of the
of the SHL atmosphere to variability at these timescales. Fur-        Saharan heat low region (Evan et al., 2015b). The reversed
ther weather/climate model simulations are required to de-            heating rate profiles in the layer between 500 and 400 hPa
termine the effect this has on the regional circulation and the       are because the mean moisture profile in this layer is larger
behaviour of the SHL.                                                 during the dry days, and vice versa (Fig. 2).
   Day-to-day variability in the dominant shortwave net heat-            Results from the water vapour sensitivity experiments
ing rate (Fig. 13) is pronounced and shows the impact of the          (senWVwDnC) are presented in Fig. 15 and the linear depen-
synoptic/mesoscale dust events on the SHL atmosphere. Dur-            dence on fluxes per unit water vapour in Table 4. We again

Atmos. Chem. Phys., 18, 1241–1262, 2018                                                 www.atmos-chem-phys.net/18/1241/2018/
N. K. Alamirew et al.: The early summertime Saharan heat low 1255
range (1.0–3.6 W kg−1 ) estimated by Evan et al. (2015b),
from observations and RT simulations, suggesting the role of
water vapour in driving longer-term interannual to decadal
heating of the SHL may not be as pronounced as previously
suggested.
4.2.3 The relative effects of dust versus water vapour
From the sensitivity experiments, we can quantify the DRE
of dust and water vapour at TOA and the surface per unit
change in AOD dust and kilograms of water vapour, respec-
tively (Table 4). By scaling this to the observed standard de-
viation in each variable observed during the Fennec observa-
tion period, we provide estimates of the relative importance
Figure 14. Atmospheric heating rate profile for selected dry days of dust and water vapour to the day-to-day variability in the
(11, 12, and 16 June; dashed lines) and moist days (18, 19, and radiation budget over the SHL.
25 June; solid lines). The resulting normalised dust SW/LW/net DRE per AOD
at TOA and the surface is −1/8/7 and −27/16/−11 W m−2 ,
respectively, where these figures provide a useful way of pre-
present the regression values to 95 % confidence level. The senting the variability of dust and water vapour on their ra-
outgoing longwave radiation (Fig. 15a) decreases with in- diative effects. The equivalent values for water vapour are
creasing of water vapour at a rate of 1.1 ± 0.7 W kg−1 which 2/6/8 and −2/8/6 W m−2 . As such, the radiative effects of
is associated with the greenhouse effect of water vapour. This dust and water vapour at TOA are of similar magnitude to
is about a third of that derived by M16 (3 W kg−1 ). Their re- the net warming of ∼ 7 W m−2 per unit variability. Dust and
sult includes the effect of water vapour and associated dust water vapour exert similar control on the total heating of
and clouds while our result considers sensitivity of radia- the Earth–atmosphere system. This contrasts with M16, who
tive flux to changes in water vapour only. The sensitivity report water effects (from vapour and clouds) as ∼ 3 times
of TOA shortwave flux due to water vapour (Fig. 15d) is more powerful than dust. This is an important finding of this
0.3 ± 0.3 W kg−1 which warms the atmosphere and in con- paper, signifying the role of dust particularly in controlling
trast cools the surface due to the reduction of the short- the variability of radiative flux and therefore heat budget of
wave reaching the Earth. M16 showed a reduction in the the region.
TOA shortwave radiation with increasing water vapour of At the surface, radiative flux is controlled much more
−0.98 W kg−1 , which is contrary to what we find in our strongly by dust than water vapour and with opposite sign:
results. However, this could be related with the impact of net cooling of −11 W m−2 and warming of 6 W m−2 per unit
clouds on shortwave radiation which will reduce TOA net variability, respectively. M16 found near-zero warming from
shortwave radiation. The net flux at TOA increases by to water (vapour and clouds). In our study, the net effect of
1.4 W m−2 for a unit change in CIWV, resulting in a net TOA versus the surface is strong atmospheric warming of
warming of the TOA. 18 W m−2 per unit variability from dust and negligible warm-
The net flux reaching the surface (Fig. 15h) is increased ing (1 W m−2 per unit variability) from water vapour. In con-
at a rate of 1.1 ± 0.4 W kg−1 which is the counteracting trast, M16 find almost equal warming from dust and water
effect of a dominant increase in longwave radiation re- vapour (of 11–12 W m−2 per unit variability). Although this
emitted downwards from the atmosphere (1.5 ± 0.8 W kg−1 ) radiative-transfer-based analysis of the role of water vapour
and a smaller reduction in downwelling solar radiation does not include clouds, which are implicitly included in
(−0.4 ± 0.4 W kg−1 ). The warming effect of water vapour M16, we suggest that the co-variability of dust and water
at both the surface and the TOA means that net at- vapour hinders calculation of their independent effects in the
mospheric convergence changes relatively little with wa- observational analysis of M16.
ter vapour (Fig. 15i) at 0.3 ± 0.6 W kg−1 which is a re- In summary, we find that dust and water vapour exert a
sult of −0.5 ± 0.1 W kg−1 in the longwave (Fig. 15c) and similarly large control on TOA net radiation, and therefore
0.8 ± 0.7 W kg−1 in the shortwave (Fig. 15f). In comparison total column heating, and by implication to the first order,
to the observational analysis of M16, we see some important a similar control on surface pressure in the SHL. However,
differences; notably, we see a greater surface net warming the vertical structure of radiative heating from dust is far
effect of water vapour and as a result negligible, not pos- more complex than that from water vapour. The schematic
itive, atmospheric radiation convergence. Nevertheless, our (Figs. 16 and 17) illustrates the sensitivity of dust and wa-
estimate of the sensitivity of surface longwave radiation to ter vapour, respectively, at different pressure levels. The grey
changes in CIWV of 1.1 W kg−1 is at the lower end of the shading in Fig. 16 (Fig. 17) represents amount of dust (water
www.atmos-chem-phys.net/18/1241/2018/ Atmos. Chem. Phys., 18, 1241–1262, 2018You can also read