America's Cup 36, Auckland 2021 Coastal Processes & Dredging Technical Report - Auckland Council
←
→
Page content transcription
If your browser does not render page correctly, please read the page content below
Report

America’s Cup 36, Auckland 2021
Coastal Processes & Dredging Technical Report
for Resource Consent Application, Wynyard Basin and Ferry &
Fishing Industry Relocation Facility
Prepared for Panuku Development Auckland
Prepared by Beca Ltd and Tonkin & Taylor Ltd
January 2018
America's Cup 36 Coastal Processes and Dredging Technical Report

Revision History
 Revision Nº       Prepared By                       Description                                             Date

 1                 Louis Reed, Jennifer Hart         Draft Issue                                             13.12.2017

 2                 Jennifer Hart, Richard Reinen-    Final Draft Issue                                       22.12.2017
                   Hamill
 3                 Jennifer Hart, Richard Reinen-    Interim Issue for Consent Application                   05.01.2018
                   Hamill
 4                 Jennifer Hart                     Final Issue for Consent Application                     12.01.2018

Document Acceptance
 Action            Name                              Signed                                                  Date

 Prepared by       Louis Reed, Jennifer Hart                                                                 12.01.2018

 Reviewed by       Stephen Priestley                                                                         12.01.2018

 Approved by       Jennifer Hart                                                                             12.01.2018

 on behalf of      Beca Ltd

© Beca 2017 (unless Beca has expressly agreed otherwise with the Client in writing).
This report has been prepared by Beca on the specific instructions of our Client. It is solely for our Client’s use for the
purpose for which it is intended in accordance with the agreed scope of work. Any use or reliance by any person contrary
to the above, to which Beca has not given its prior written consent, is at that person's own risk.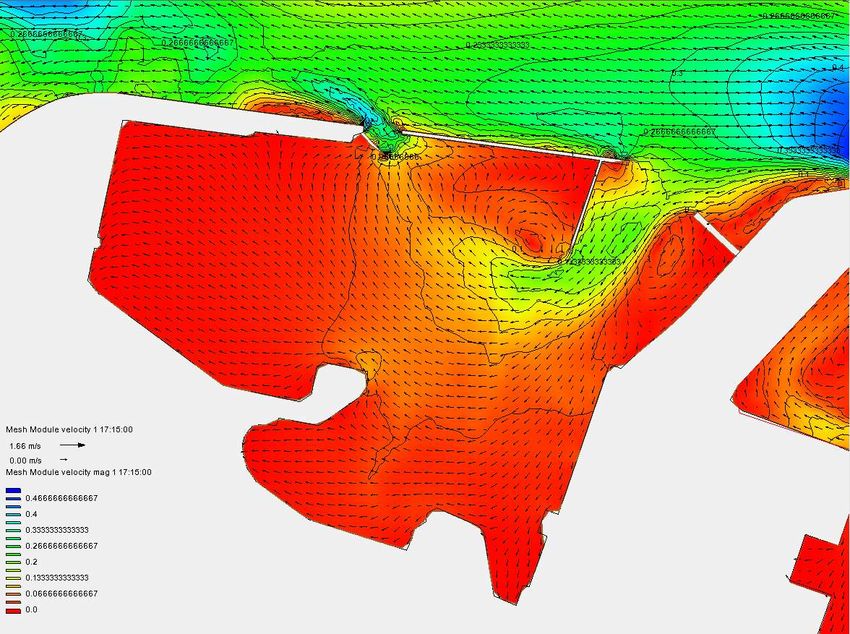
America's Cup 36 Coastal Processes and Dredging Technical Report

Executive Summary
Overview
1. The maritime-based works comprise new wharves (piles and deck), piled breakwaters, dredging, and
   underwharf services. Some of these related activities will result in discharges to the Coastal Marine
   Area (CMA). The proposed works for the 36th America’s Cup (AC36) are located adjacent to Viaduct
   Harbour, and the project is referred to as Wynyard Basin. This report relates to an application for
   resource consents for Wynyard Basin.

2. To facilitate these works, the vehicular ferry and fishing industry has been relocated to the west of
   Wynyard Point. This is referred to as the Ferry and Fishing Industry Relocation Facility (FFIRF) and this
   proposal is the subject of a separate application for resource consents (to which this report also relates).

Assessment Methodology
3. The predicted adverse effects on coastal processes are associated with changes to the basin flushing
   time, wave reflection outside of the Project Areas, and sedimentation. The predicted beneficial effects
   are more calm water for mooring a range of vessels.

4. Because of the relatively short time frame to prepare the resource consent application, parallel
   hydrodynamic models were developed (by Tonkin & Taylor and Beca) and comparison of
   results/interpretation were deliberated on by the modelling teams. Wave/wake modelling was undertaken
   by Cardno who have previously conducted wave modelling within the lower Waitemata Harbour. Models
   were verified by measured data, some of which was collected as part of this project. The interpretation of
   the potential adverse effects relating to changes in tidal currents, flushing periods, and waves/wakes was
   a joint assessment by Tonkin & Taylor and Beca.

5. Project objectives for moored boat tranquillity were established from internationally recognised
   performance criteria and with reference to the host syndicate. Residual wakes are more critical than
   residual wind waves in the moored areas, with the objective of wake heights being less than 0.1m.

Existing Environment
6. The affected CMAs (referred to as the Project Areas) are in the lower Waitemata Harbour.

7. The Project Areas are adjacent to the main tidal channel. Tidal velocities are less than 0.2 m/s and
   sedimentation rates are typically around 35mm/year averaged over the whole Viaduct Harbour. Water
   quality in terms of total suspended solids is generally good.

8. The natural, relatively high tidal range of 2.5m (median) results in good to fair flushing of Viaduct
   Harbour and Westhaven Marina.

9. The Project Areas are subject to diffracted wind waves from West and East and direct wind waves to the
   North. Vessel wakes are a regular feature and problematic (due to vessel excitation) for some moored
   vessels within Outer Viaduct Harbour and Westhaven Marina.

10. Relevant coastal hazards include sea level rise, storm surge (extreme storm tides) and associated wave
    overtopping, and tsunami.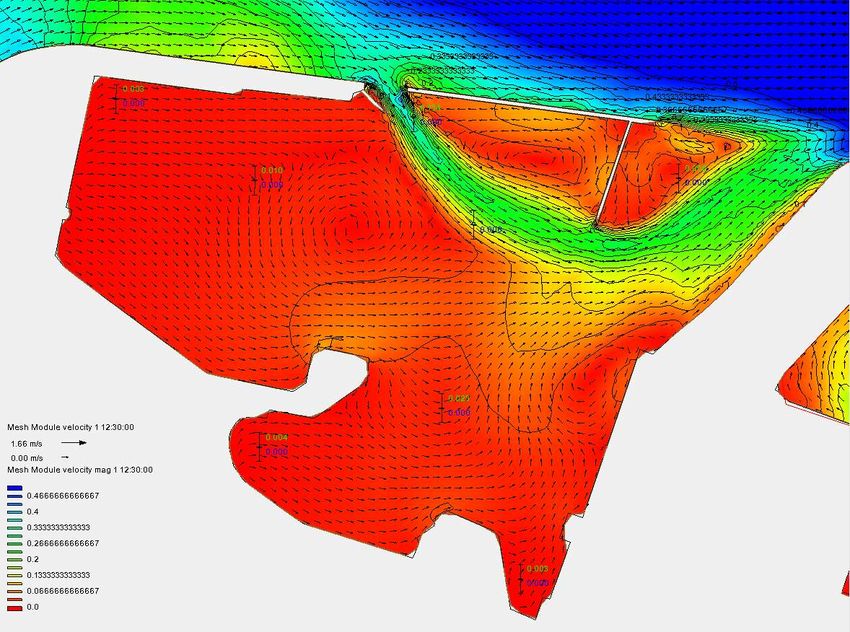
America's Cup 36 Coastal Processes and Dredging Technical Report

Proposed Works
Wynyard Basin
11. The approximate areas and dredging volumes for the Wynyard Basin facilities as shown in Civil
    Drawings 2 to 10 are given below. No reclamation is proposed.
        3,000m2 of temporary wharf structure.
        25,000m2 of permanent wharf structure including wave panels.
        2,000m2 of permanent piled, decked breakwater including wave panels.
        800m2 of pile footprint at the seabed.
        6,000m2 of floating pontoons.
        75,000m3 of dredging. .
FFIRF
12. The approximate areas and dredging volumes for the FFIRF as shown in Civil Drawings 11 to 15 are
    given below. No reclamation is proposed.
        3,000m2 of permanent wharf structure.
        100m2 of pile footprint at the seabed.
        400m2 of ramps and floating pontoons.
        20,000m3 of dredging.

Potential Environmental Effects
Wynyard Basin
13. The proposed layout will change tidal currents, basin flushing times, wave/wake reflection and
    sedimentation.

14. The effects of the proposed development on tidal flows and currents are considered to be no more than
    minor because of the localised extent and limited actual scale of these changes.

15. Basin flushing times are longer but tend to stay in similar good / fair categories as the existing flushing.
    The exception is the Inner Viaduct Harbour. All the increases are predicted to remain within the “fair” or
    “good” flushing band. Flushing is one of the inputs to the assessment of effects on water quality that is
    addressed in America’s Cup 36: Assessment of Coastal Environmental Effects Associated with the
    Development of AC36 Facilities (Golder Associates, 2018). The Golder report includes the description of
    existing water quality, incorporating the results of recent sampling, a discussion of water quality
    considerations and potential consequences, and conclusions regarding the effects of the proposed
    development on water quality. The Golder report conclusions, which consider water quality in relation to
    the discharge of stormwater, algal growth and overall ecology are summarised below:

        Stormwater discharge and total suspended solids (TSS): TSS concentrations from the Halsey St
         stormwater outfall should not result in prolonged water clarity changes within the Inner Viaduct
         Harbour, however a very large rain storm event is likely to result in some clarity changes over a
         period of 24 hours or more. At the Freemans Bay stormwater outfall beneath North Wharf the
         stormwater is untreated and known to have poor clarity at times. Currently, following a period of
         mixing, it is likely that some clarity changes will persist off North Wharf and alongside Wynyard Wharf.
         Post-development, clarity changes will be expected in this area for a period of at least 24 hours.
        Stormwater discharge and microbiological water quality: overall, no significant changes in
         microbiological water quality are expected within the Inner Viaduct Harbour from discharges from the
         Halsey St stormwater outfall. Discharge from the Freemans Bay stormwater outfall beneath North
         Wharf currently results in poor microbiological water quality in the area of North Wharf and north
         along Wynyard Wharf after rain events. Post construction, water quality in the Karanga Plaza steps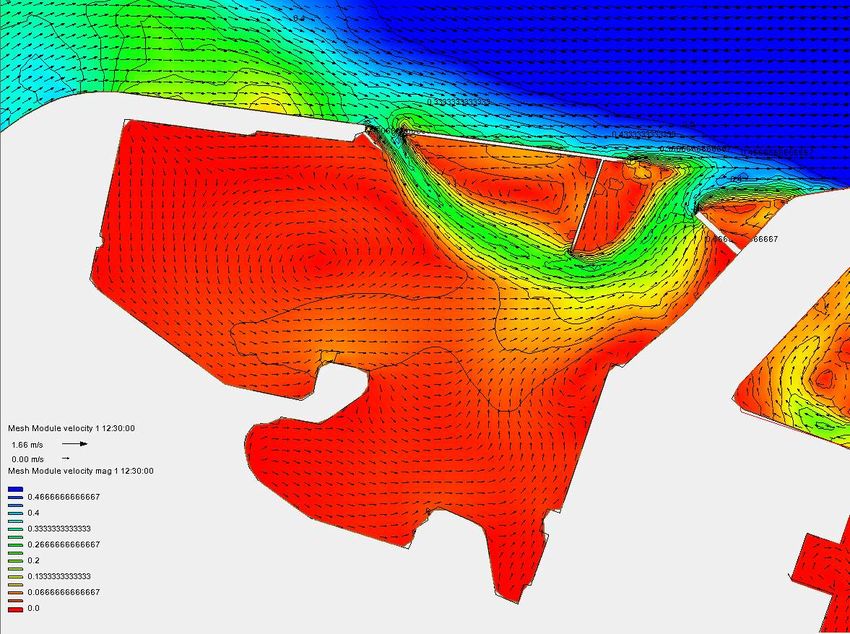
America's Cup 36 Coastal Processes and Dredging Technical Report

         area should be considered to be poor quality for 24-48 hours following a rain storm discharge from
         the Freemans Bay stormwater outfall. There is on-going work by Auckland Council and Watercare to
         address Freemans Bay stormwater outfall quality.
        Algal growth: increase in biomass is not anticipated to be observable to the casual observer.
        Overall ecology: the changes in water movement can potentially influence the composition of
         biological communities on basin walls, piles and floating pontoons.
        An Inner Viaduct Harbour Environmental Management Plan should be prepared and implemented,
         covering water quality monitoring and management in the Inner Viaduct Harbour. Recommendations
         on the plan are set out in the Golder report.

16. There will be an increase in reflection outside the project area, in Freemans Bay and the Maritime
    Museum basin but the increase in wave height is typically less than 0.1m for the recommended (less
    reflective) option. Any potential adverse effects relating to this small increase are expected to be difficult
    to detect as the sea state is relatively energetic under present conditions.

17. Sedimentation will increase in the more tranquil basins/harbours, at a similar scale to existing
    sedimentation rates. Potential adverse effects are therefore expected to be minor and to be managed
    using existing maintenance dredging practices in a similar manner to present sedimentation.

18. Dredging will create sediment plumes which become more diffuse away from the dredger. Assessment
    undertaken for this report and previous dredging have both shown effects from dredging plumes to be
    less than minor with localised and temporary increases in suspended sediment estimated to be less than
    1% of the total sediment flux per tide. The depth of material deposited at any single location from the
    plume is expected to be undetectable.

19. Coastal hazards and climate change have been considered for the Wynyard Basin structures and
    measures identified to address them.
FFIRF
20. The proposed layout will change tidal currents, basin flushing times, wave/wake reflection and
    sedimentation.

21. Changes in tidal currents are relatively small and localised, and any adverse effects are therefore
    expected to be minor. Penetration of the ebb tide current into the Westhaven waterspace provides
    beneficial flushing effects.

22. Under neap tide conditions, which are less effective for flushing and therefore provide a more stringent
    test, the proposed development has a negligible effect (0-2% change) or reduces e-folding times within
    Westhaven Marina. During both neap and spring tides, e-folding times for most of the marina remain
    within the “good” threshold. All results are within the “fair” 240 hour threshold. The Golder Associates
    report, America’s Cup 36: Assessment of Coastal Environmental Effects Associated with the
    Development of AC36 Facilities, includes a description of existing water quality, a discussion of water
    quality considerations including flushing time and potential consequences, and conclusions regarding the
    effects of the proposed development on water quality.

23. It is anticipated that there will be a temporary increase in wake heights outside of the site, generally of up
    to 0.1m. This is limited to localised areas to the northeast and southwest of the facility.

24. Berthing areas at the FFIRF should have a similar or better wave sheltering performance compared to
    the existing situation along the Halsey St Extension Wharf and at the ferry berth at Wynyard Wharf. It is
    noted that for the selected site, the potential for improved wave/wake sheltering is limited because of
    navigational constraints such as maintaining the vessel transit areas.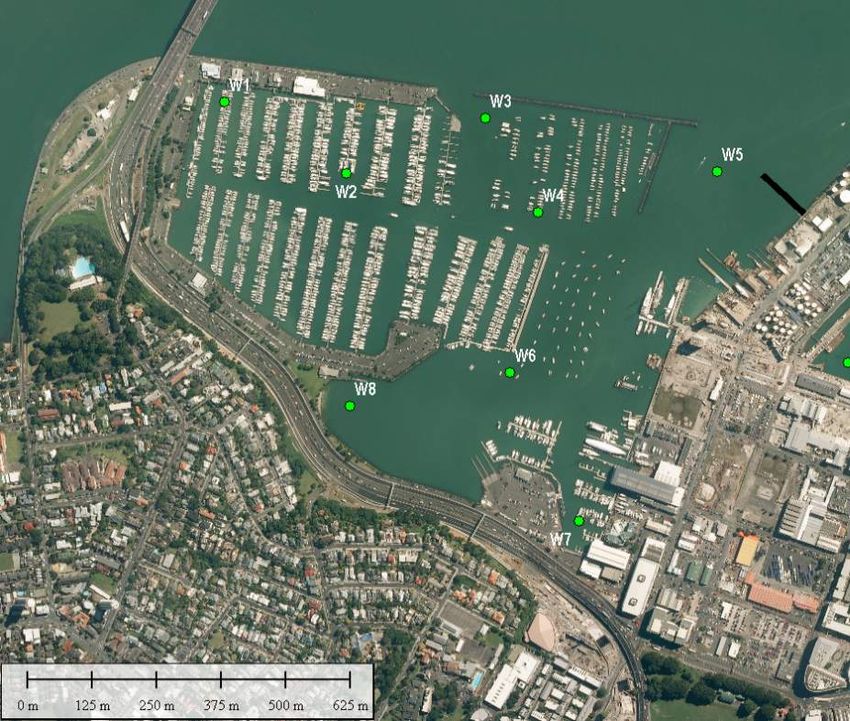
America's Cup 36 Coastal Processes and Dredging Technical Report

25. Sedimentation will increase in the FFIRF berths, of a similar order to existing adjacent sedimentation.
    Given the limited extent of the site and the expected level of sedimentation, this is a less than minor
    effect. It will be managed using existing maintenance dredging practices, in a similar manner to other
    areas of Westhaven Marina.

26. Dredging will create sediment plumes which become more diffuse away from the dredger. Assessment
    undertaken for this report and previous dredging have both shown effects from dredging plumes to be
    less than minor with localised and temporary increases in suspended sediment estimated to be less than
    1% of the total sediment flux per tide. The depth of material deposited at any single location from the
    plume is expected to be undetectable.

27. Coastal hazards and climate change have been considered for the FFIRF and measures identified to
    address them.

Overall Conclusions
For both the Wynyard Basin and FFIRF projects, the main beneficial effect is increased calm waterspace for
the berthing of vessels.

Wynyard Basin
28. In general, any adverse effects of the AC36 project on coastal processes will be localised and small-
    scale.

29. A range of mitigation measures, which could form the basis for conditions of consent, are recommended.

FFIRF
30. In general, any adverse effects of the AC36 project on coastal processes will be localised and small-
    scale.

31. A range of mitigation measures, which could form the basis for conditions of consent, are recommended.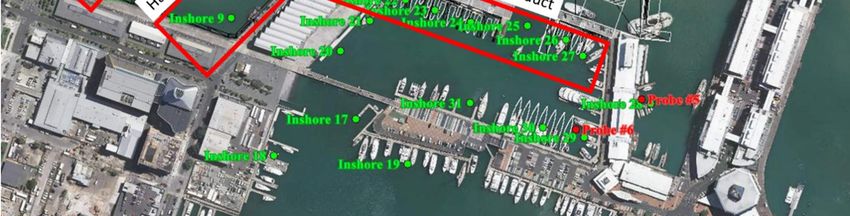
America's Cup 36 Coastal Processes and Dredging Technical Report

Contents

1. Introduction ........................................................................................................ 1
     1.1    Report Context ................................................................................................................................. 1
     1.2    Purpose of Report ............................................................................................................................ 1
     1.3    Report Structure .............................................................................................................................. 2
     1.4    Proposed Development ................................................................................................................... 2

2. Existing Environment ........................................................................................ 6
     2.1    Setting .............................................................................................................................................. 6
     2.2    Tides ................................................................................................................................................ 6
     2.3    Wind ................................................................................................................................................. 7
     2.4    Currents, Tidal Streams and Flushing ............................................................................................. 8
     2.5    Waves ............................................................................................................................................ 11
     2.6    Wakes ............................................................................................................................................ 13
     2.7    Sediment Processes and Sedimentation ....................................................................................... 18
     2.8    Coastal Hazards and Climate Change .......................................................................................... 20

3. Modelling Approach and Performance Criteria ............................................ 24
     3.1    Purpose of Modelling ..................................................................................................................... 24
     3.2    Hydrodynamic Tidal Modelling....................................................................................................... 24
     3.3    Wave/Wake Modelling ................................................................................................................... 24
     3.4    Moored Boat Tranquillity Criteria ................................................................................................... 25
     3.5    Wave/Wake Reflection and Transmission ..................................................................................... 25

4. Assessment of Environmental Effects: Wynyard Basin .............................. 27
     4.1    Tidal Flows and Currents ............................................................................................................... 27
     4.2    Flushing in Harbour Basins............................................................................................................ 29
     4.3    Waves and Wake........................................................................................................................... 33
     4.4    Sediment Processes and Sedimentation ....................................................................................... 41
     4.5    Coastal Hazards and Climate Change Adaptation ........................................................................ 42

5. Assessment of Environmental Effects: FFIRF .............................................. 43
     5.1    Tidal Flows and Currents ............................................................................................................... 43
     5.2    Flushing ......................................................................................................................................... 46
     5.3    Waves and Wakes ......................................................................................................................... 47
     5.4    Sediment Processes and Sedimentation ....................................................................................... 52
     5.5    Coastal Hazards and Climate Change Adaptation ........................................................................ 53

6. Dredging ........................................................................................................... 55
     6.1    Proposed Dredging ........................................................................................................................ 55
     6.2    Dredged Sediment Characterisation ............................................................................................. 55
     6.3    Dredging Operation and Volumes ................................................................................................. 56
     6.4    Dredging Effects ............................................................................................................................ 57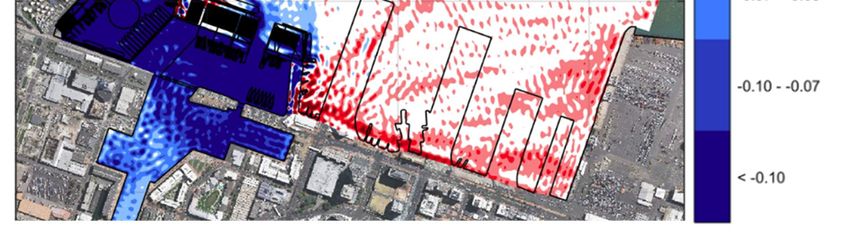
America's Cup 36 Coastal Processes and Dredging Technical Report

     6.5    Maintenance Dredging................................................................................................................... 60
     6.6    Disposal of Dredged Sediment ...................................................................................................... 60

7. Mitigation and Monitoring ............................................................................... 62
8. Conclusions ..................................................................................................... 63
     8.1    Wynyard Basin ............................................................................................................................... 63
     8.2    FFIRF ............................................................................................................................................. 64

9. References ....................................................................................................... 65

Appendices

Appendix A
     Sedimentation Analysis

Appendix B
     Beca Hydraulic Modelling Report

Appendix C
     Tonkin & Taylor Hydraulic Modelling Report

Appendix D
     Wake and Wave Reports:
     - Cardno Modelling Report
     - Mulgor Field Measurement Report

Appendix E
     Wave Tranquillity Performance Criteria

Appendix F
     Wave Reflection and Transmission Coefficients

Appendix G
     Sediment Plume and Fate Analysis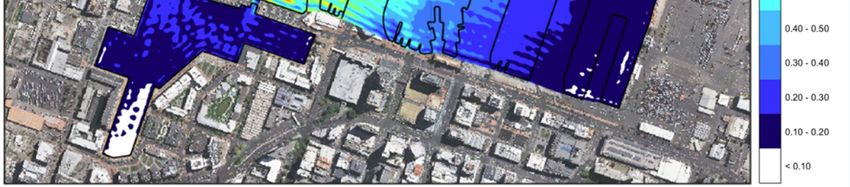
America's Cup 36 Coastal Processes and Dredging Technical Report

1. Introduction
1.1    Report Context
Panuku Development Auckland (Panuku), as lead delivery agency, has been tasked with providing
waterfront infrastructure to host the 36th America’s Cup (AC36) and associated regattas in Auckland in 2019-
2021.
Beca Limited (Beca) has been commissioned by Panuku to undertake technical studies on the existing
physical environment and the effects of the proposed development for the resource consent application, as
well as concept engineering design for the AC36 infrastructure. To document this work, Beca has prepared a
suite of reports and a set of engineering drawings for the Resource Consent Application for Wynyard Basin
and the Ferry and Fishing Industry Relocation Facility (FFIRF).
       America’s Cup 36 Base Infrastructure Technical Report.
       America’s Cup 36 Geotechnical Technical Report.
       America’s Cup 36 Groundwater Technical Report.
       America’s Cup 36 Preliminary Site Investigation (Contamination) and Remediation Action Plan.
       America’s Cup 36 Coastal Processes and Dredging Technical Report (this report).
       America’s Cup 36 Stormwater and Services Technical Report.
       America’s Cup 36 Traffic and Transport Technical Report.
       America’s Cup 36 Fire and Evacuation Assessment.
       America’s Cup 36 Marine Traffic Survey.
       America’s Cup 36 Engineering Concept Drawings.
Because of the relatively short time frame to prepare the resource consent application, parallel hydrodynamic
models for the coastal processes assessment were developed (by Tonkin & Taylor and Beca) and
comparison of results/interpretation was deliberated on by the modelling teams. Wave/wake modelling was
undertaken by Cardno who have previous conducted wave modelling within the lower Waitemata Harbour.
Models were verified by measured data, some of which was collected as part of this project. The
interpretation of the potential adverse effects relating to changes in tidal currents, flushing periods, and
waves/wakes was a joint assessment by Tonkin & Taylor and Beca.

Reports by other specialists for the resource consent application cover:
       Landscape, visual impact and natural character (Boffa Miskell).
       Urban design (McIndoe Urban).
       Ecology, sediment and water quality (Golder Associates).
       Noise and vibration (Marshall Day Acoustics).
       Navigation and recreational vessels (Navigatus).
       Economics (Market Economics).
       Risk (Sherpa Consulting).
       Planning (Unio Environmental).

1.2    Purpose of Report
The purpose of this report is to describe the existing coastal processes (i.e. tidal conditions, wave climate
and sedimentation) at the relevant sites. It also describes the potential effects on these processes of the
proposed development, the implications of coastal hazards for the project, as well as the proposed dredging,
its effects and disposal options. This report will form part of the resource consent application for the
proposed AC36 development.

                                                                                                            Beca // 12 January 2018
                                                                                        3233847 // NZ1-14861405-218 0.218 // page 1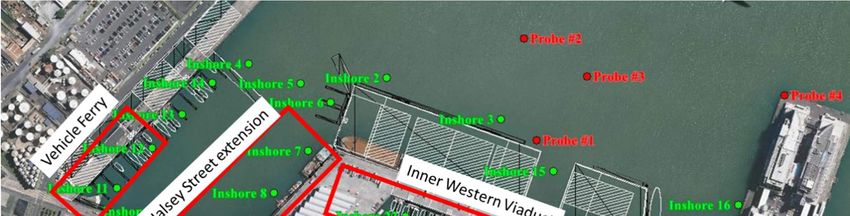
America's Cup 36 Coastal Processes and Dredging Technical Report

1.3     Report Structure
This report is structured as follows:
        Section 1: Introduction, including Panuku and Beca roles, reporting context and overview of the
        proposal.
        Section 2: Existing Environment, which gives an overview of the coastal processes.
        Section 3: Modelling and Performance Criteria sets out the modelling studies undertaken for the
        proposed development, and parameters adopted for the modelling.
        Sections 4 and 5: Assessment of Environmental Effects describes the effects of the development on
        coastal processes, and the implications of coastal hazards for the project for the Wynyard Basin and
        FFIRF, respectively.
        Section 6: Dredging describes the proposed dredging, its effects and the proposed approach to
        disposal of dredged material.
        Section7: Monitoring and Mitigation sets out the prosed measures to mitigate effects, and monitoring.
        Section 8: Conclusions summarises the effects on coastal processes, mitigation and monitoring.
        Appendix A: Sedimentation Analysis sets out the work undertaken to quantify existing sedimentation
        rates at the proposed development sites.
        Appendices B, C and D are the technical reports by Beca, Tonkin & Taylor and Cardno. They
        describe the numerical modelling undertaken to quantify the effects of the proposal on coastal
        processes.
        Appendix E: Wave Tranquillity Performance Criteria contains the parameters adopted for wave and
        wake conditions in the America’s Cup boat harbours, for use in the numerical modelling.
        Appendix F: Wave Reflection and Transmission Coefficients sets out further parameters adopted in
        the numerical modelling.
        Appendix G: Sediment Plume and Fate Analysis includes a calculation sheet for the dredging plume
        fate.
This report covers both the proposed development at Wynyard Basin and the FFIRF. For clarity when
describing the Wynyard Basin the heading is emphasized in bold underline while the FFIRF heading is
emphasized in bold italics. If headings are not either bold underline or italics, the text will be more general
and could apply to both developments.

1.4     Proposed Development
This report and assessment is submitted in support of the following resource consent applications to
Auckland Council for:
      The syndicate base infrastructure and event infrastructure for the AC36, by Panuku.
      The relocation of the Ferry and Fishing Industry to a new facility within the Wynyard Quarter, by
      Panuku.
Existing wharves and marinas are shown in Figure 1 and on Civil Drawing 1.

                                                                                                             Beca // 12 January 2018
                                                                                         3233847 // NZ1-14861405-218 0.218 // page 2
America's Cup 36 Coastal Processes and Dredging Technical Report
Westhaven Marina Wynyard Point
Freemans Bay
Silo Marina N
Outer Viaduct Harbour
Inner Viaduct
Harbour
Figure 1: Aerial photo showing the Wynyard Quarter and existing wharves
(The Inner and Outer Viaduct Harbour areas are collectively referred to as Viaduct Harbour.)
1.4.1 AC36 Base Infrastructure and Event Infrastructure (Wynyard Basin)
In 2017, Emirates Team New Zealand (ETNZ) defeated Oracle Team USA 7 – 1 in the 35th America’s Cup
regatta in Bermuda. AC36 is scheduled to be held in Auckland in 2021. It is proposed to establish the
America’s Cup bases in and around Wynyard Basin, which is located along part of Auckland’s City Centre
waterfront. This includes Hobson Wharf, the Halsey Street Extension Wharf and Wynyard Wharf, including
the surrounding waterspace.
ETNZ have indicated that up to eight syndicates will compete for the America’s Cup in Auckland. Five of the
bases will be double bases (two boats) and three of the bases will be single bases (one boat). The bases
consist of a 15m high building over approximately half of the base area and an area of hardstand over the
other half. The dimensions of the bases vary in size, with the single bases being generally 85m x 35m and
the double bases being a variety of sizes. The base sizes and locations are identified on the plans attached
to the resource consent application.
In order to facilitate five of the bases, an extension to Hobson Wharf and the Halsey Street Extension
Wharf/Western Viaduct Wharf will be required. Part of the waterspace between Wynyard Wharf and
Brigham Street will also be covered by a wharf extension (part temporary and part permanent) in order to
facilitate the other three bases. All of the base buildings will be temporary with the exception of the Base 1,
which is proposed to be located on the Hobson Wharf extension. Permanent wharf areas ‘post event’ are
anticipated to provide for a range of marine and public uses. Refer to Figure 2 and Civil Drawing 2.
Beca // 12 January 2018
3233847 // NZ1-14861405-218 0.218 // page 3America's Cup 36 Coastal Processes and Dredging Technical Report
Figure 2: Aerial photo overlaid with the proposed infrastructure
The resource consent for the syndicate base infrastructure and event infrastructure applications will seek
approval for activities and development associated with enabling the AC36 Base Infrastructure.
The ‘event’ period associated with AC36 will take place over a 6-month period commencing December 2020
culminating in May 2021. This event period will include a challenger series (such as the Prada Cup) and
supporting and complimentary regatta with the AC36 races held in March 2021. During the event additional
signage, lighting, live music and supporting structures will be located within the Viaduct and Wynyard area.
Resource consent is sought for the event envelope and effects including traffic, lighting, noise, additional
structures and the management of public spaces within the Wynyard and Viaduct areas in the immediate
vicinity of the AC36 bases are addressed in the relevant sections of the application material.
In addition to the planning Assessment of Environmental Effects, multiple technical reports have been
prepared in order to outline and assess the matters relevant to this application, this report should be read
alongside the other complimentary assessments provided as part of the application material.
The above activities will occur within the Wynyard Quarter Precinct, the Viaduct Harbour Precinct and the
City Centre/General Coastal Marine Zones. The proposal will also require various consents under the
overlays and Auckland-wide provisions of the Auckland Unitary Plan and these are outlined in detail in the
planning Assessment of Environmental Effects.
Beca // 12 January 2018
3233847 // NZ1-14861405-218 0.218 // page 4America's Cup 36 Coastal Processes and Dredging Technical Report
1.4.2 Ferry and Fishing Industry Relocation Facility (FFIRF)
The Auckland Fishing Fleet and Sanford’s (collectively termed the Fishing Industry) and Sealink currently
operate from existing facilities located on Wynyard Wharf, Halsey Street Extension wharf and Western
Viaduct Wharf. A new facility for the Fishing Industry and Sealink is proposed to be established on the
western side of Wynyard Point. See Figure 2 and Civil Drawing 2.
The new facility will involve the construction of a purpose-built facility on land at 108 Hamer Street (referred
to as the Hamer Street Yard) and within the coastal marine area. Resource consent is sought for the
infrastructure and enabling works.
The FFIRF will provide for fishing vessel berthage and ‘alongside’ access to enable loading and unloading of
vessels. The landward facilities will include associated parking and servicing areas to support this maritime
use. The Sealink Facility provides for berthage and loading and unloading facilities for three vessels,
associated maritime passenger facility and vehicle queuing, and manoeuvring areas. Access to FFIRF will
be provided from Hamer Street. The existing Firth concrete batching plant in Hamer St is an independent
activity, not included in the consent application for the AC36 project.
Beca // 12 January 2018
3233847 // NZ1-14861405-218 0.218 // page 5America's Cup 36 Coastal Processes and Dredging Technical Report
2. Existing Environment
2.1 Setting
Waitemata Harbour is a large drowned valley with numerous arms and extends some 25 kilometres inland
from the harbour entrance at North Head. The high tide area of the harbour is some 180km2 and the volume
is approximately 460 million m3. Hydraulic conditions are governed by the well-defined tidal channel, from
north of Rangitoto Island through to Herald Island in the Upper Harbour. The channel is fixed by firm features
like Takapuna Head and Stanley Point to the north, Rangitoto to the east and Takaparawha Point and the
Port of Auckland to the south. The harbour catchment, or area of land draining into the harbour, is
approximately 440km2.
The site is located in the lower Waitemata Harbour, on the downtown Auckland waterfront. The main harbour
channel lies approximately mid-way between the downtown waterfront and the North Shore. The narrowest
section of the lower Waitemata Harbour, at 930m, is at the Auckland Harbour Bridge. This compares with the
1600m open water distance between Wynyard Point and Bayswater, and the 1530m open water distance
between Hobson Wharf and Stanley Point.
The present day downtown Auckland waterfront has been formed by shoreline reclamation and development
of roading and marine infrastructure over the past 150 years. This includes the Auckland Harbour Bridge
reclamation, Westhaven Marina, Wynyard Quarter reclamation and wharves, Viaduct Harbour reclamation
and wharves, Outer Viaduct Harbour, the Council-owned finger wharves and the Ports of Auckland wharves
and terminals.
The project sites lie within Freemans Bay and west of Wynyard Point. Seabed levels at the sites vary from -
2.5m below Chart Datum (CD) at a shoal north of Halsey St Extension Wharf to -9m CD mid-way along
Wynyard Wharf; and from -2.5m CD to -5m CD to the west of Wynyard Point.
2.2 Tides
The Waitemata Harbour experiences semi-diurnal tides (high tides every 12.4 hours). The tidal prism, or
volume of seawater exchanged in every tide, is about 160 million m3 (Beca, 1996). This is about 35% of the
harbour volume. Table 1 gives the astronomical tide levels for the lower Waitemata Harbour (Port of
Auckland) due to the gravitational effects of the moon and sun.
Table 1: Tide levels for the lower Waitemata Harbour (LINZ, 2017)
Tide Condition Level (m CD)
Highest Astronomical Tide (HAT) 3.70m CD
Mean High Water Springs (MHWS) 3.39m CD
Mean High Water Neaps (MHWN) 2.86m CD
Mean Sea Level (MSL) 1.90m CD
Mean Low Water Neaps (MLWN) 0.95m CD
Mean Low Water Springs (MLWS) 0.41m CD
Lowest Astronomical Tide (LAT) 0.05m CD
Spring tide range 2.98m
Neap tide range 1.91m
Beca // 12 January 2018
3233847 // NZ1-14861405-218 0.218 // page 6America's Cup 36 Coastal Processes and Dredging Technical Report
Tide levels are measured in relation to Chart Datum (CD), which is 1.743m below Auckland Vertical Datum
1946 (AVD-1946), and standard barometric pressure of 1013 hectopascals. Chart Datum is the datum
adopted for marine-based projects and is at or close to the lowest astronomical tide.
Extreme storm tides (storm surge) are covered in Section 2.8.1.
2.3 Wind
Wind generates local currents and waves. The prevailing surface wind direction is predominantly from the
south-west (25%), west (15%) and from the north to north-east (15%). Auckland wind roses for Whenuapai
(long term record, 14km from site) and Mechanics Bay (historic shorter term wind record, 2km from the site),
are illustrated in Figures 3a and 3b. The Whenuapai rose shows 10 minute mean wind speeds, measured
hourly. The Mechanics Bay rose is based on daily observations. Wind speeds are typically less than 8 m/s
(approximately 30 km/hr).
Figure 3a: Wind rose for data recorded at Whenuapai (1960-2008) (Source; NIWA, 2012)
Beca // 12 January 2018
3233847 // NZ1-14861405-218 0.218 // page 7America's Cup 36 Coastal Processes and Dredging Technical Report
Windspeed m/s
Figure 3b: Wind rose for data recorded at Mechanics Bay (1955 to 1962) (Source: NIWA CliFlo)
Sustained extreme wind speeds for the predominant directions are given in Table 2, based on a review of
wind data from the Whenuapai gauge (1960-2008) and the Weather Research and Forecasting (WRF)
model data. These wind speeds include an allowance of 10% (compared to the existing environment) for
climate change.
Table 2: Predicted extreme wind speeds
Average Recurrence Wind speed by direction (m/s)
Interval (years)
West North East
1 18 16 16
10 23 20 22
50 25 23 23
100 27 24 25
2.4 Currents, Tidal Streams and Flushing
Tidal flows generate currents in the lower Waitemata Harbour. It is estimated that the average tidal flow in
the main harbour channel is 7,200m3/s.
Recorded current data for the Waitemata Harbour is limited and has been predominantly collected by the
Ports of Auckland Limited (POAL) for navigation. The following datasets have been utilised for this study
(refer to Appendix B):
Boat mounted Acoustic Doppler Current Profiler (ADCP) measurements at hourly intervals over mean
spring (3.0 m range) and neap (1.5 m range) tides. The survey tracks covered the harbour from
Westhaven Marina to North Head at the harbour entrance (Vennell 2015-2017).
ADCP measurements covering a 1 week duration from 23/11/2017 to 01/12/2017 at the Viaduct
Harbour Bridge and the Inner Harbour.
Drogue measurements at the Westhaven Marina entrances during mid flood and ebb tides during
springs and neaps. Measurements were completed on 06/01/2006 (Spring) and 10/01/2006 (Neap).
Beca // 12 January 2018
3233847 // NZ1-14861405-218 0.218 // page 8America's Cup 36 Coastal Processes and Dredging Technical Report
The current measurements show that within the main harbour currents are semi diurnal with higher ebb
currents (up to 0.95m/s) compared to flood (up to 0.9m/s). Within the water spaces bounded by the
wharves, reclamations and breakwaters currents patterns are more confused due to the generation of eddies
in the lee of the structures which tend to move as the current varies in the main channel. Generally within
these protected areas currents tend to have a single peak velocity and the semi diurnal pattern is less
pronounced compared to the main channel velocities.
Wind generated currents are also a frequent feature within the Harbour, with currents reaching about 2% of
the wind speed. In general, for wind speeds less than 7 m/s, wind generated currents (typically up to 0.14
m/s) predominate whereas for wind speeds greater than 7 m/s, wave conditions predominate (refer to
Section 2.6).
2.4.1 Wynyard Basin
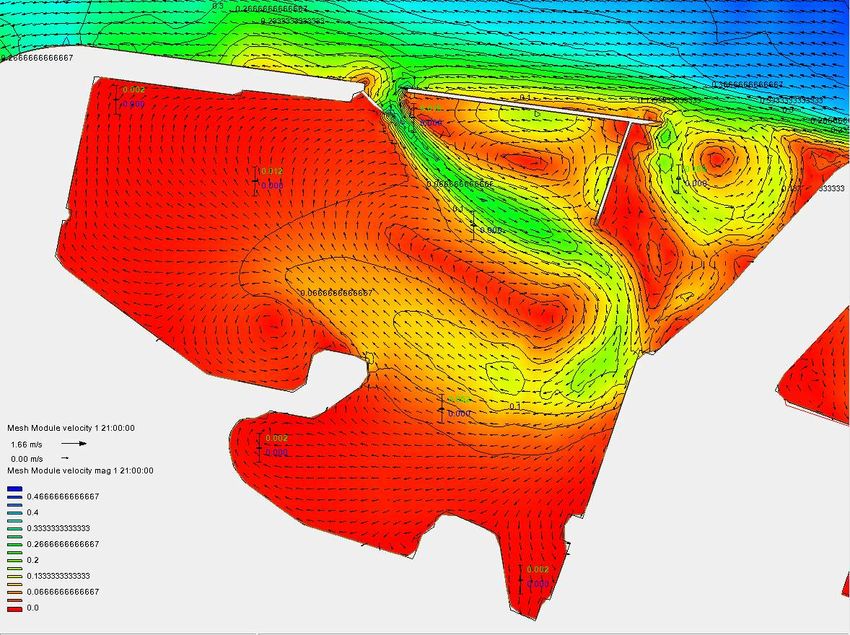
A characteristic of Freemans Bay is an eddy driven by the tidal flow in the main harbour channel. The eddy
develops over the last 2 hours of the flood flows and first 3 hours of the ebb flow and generally extends over
the basin. The circulation is clockwise during ebb and anti-clockwise during flood tides. The ebb eddy is
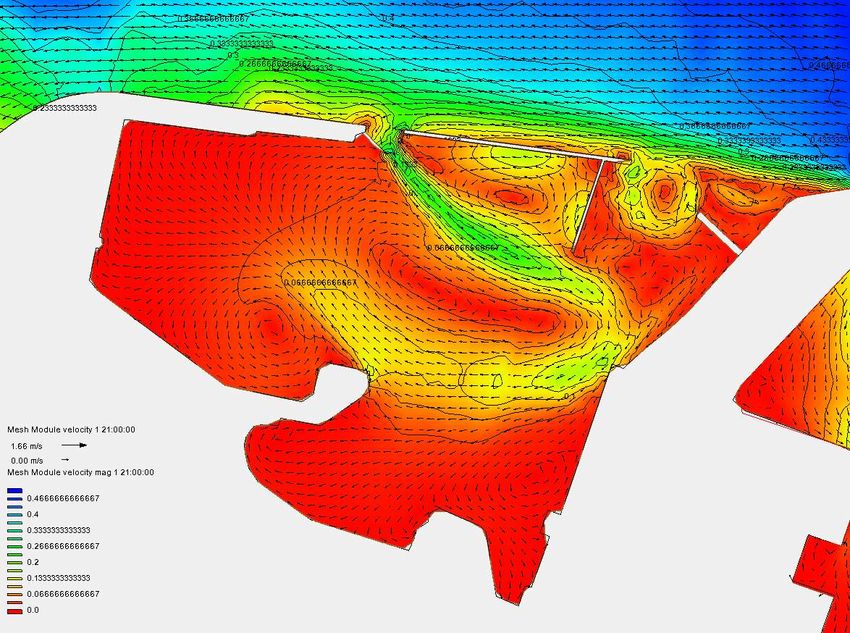
stronger, with peak velocities of approximately 0.1 m/s compared to 0.02 m/s during the flood eddy. A plot of
current velocities in Freemans Bay, illustrating this eddy feature, is shown in Figure 4. These eddies provide
a tidal flushing volume into and out of the water body that is greater than that associated with the filling and
emptying of the tidal prism.
Figure 4a: Plot of typical ebb tide vectors in Freemans Bay
Beca // 12 January 2018
3233847 // NZ1-14861405-218 0.218 // page 9America's Cup 36 Coastal Processes and Dredging Technical Report
Eddies from Freemans Bay penetrate only slightly into Viaduct Harbour. For the Outer Viaduct Harbour the
current pattern can be variable due to flows under Hobson Wharf, via the main entrance and leaving under
Halsey Wharf. On average current velocities were measured to be less than 0.09 m/s. Within the Inner
Viaduct Harbour the measurements suggested minor to no tidal response with peak current velocities of
approximately 0.02 m/s.
Flushing can be assessed using the e-folding method. e is the Eulerian number, approximated by 2.71828.
The flushing time calculated using this approach is the time required for an e-fold renewal of water, which is
the time taken for a body of water to reach a dilution level of 1/e or 37%. For a point in the centre of the Inner
Viaduct Harbour, the e-fold flushing time is 32-50 hours (spring tide conditions) to 46-64 hours (neap tide
conditions) (Appendices B and C). E- folding times less than 96 hours are considered “good” flushing,
between 96 – 240 hours indicates “fair” flushing and greater than 240 hours indicates “poor” flushing (EPA,
1985; PIANC 2008). Further information on the e-folding method and its application, including a detailed
table of existing e-folding times, is given in Section 4.1 and in Appendices B and C.
2.4.2 FFIRF
Tidal current data at the FFIRF site and within Westhaven Marina are sparse and limited to a series of mid
tide drogue measurements. Inferred current speeds (peak) at the FFIRF site range up to 0.5m/s on the ebb
tide, and up to 0.3m/s on the flood tide. Plots of typical flood and ebb tide velocities are shown in Figures 4b
and 4c, demonstrating the complex flow patterns that form in the marina.
The average e-folding time for a point in the centre of Westhaven Marina is 41 hours (spring tide conditions)
to 54 hours (neap tide conditions), which accords with ”good” flushing (Appendix B).
Figure 4b: Plot of typical flood tide vectors for Westhaven Marina
Beca // 12 January 2018
3233847 // NZ1-14861405-218 0.218 // page 10America's Cup 36 Coastal Processes and Dredging Technical Report
Figure 4c: Plot of typical ebb tide vectors for Westhaven Marina
2.5 Waves
The Freemans Bay and west of Wynyard Point FFIRF sites are sheltered from ocean swell waves but will
experience wind waves generated by westerly / northerly / easterly winds across the Waitemata Harbour.
The sites are sheltered from the prevailing southwesterly winds. The fetches measured from the main
channel north of Halsey St Extension Wharf are approximately 8km (west), 4.5km (north, though much of this
is over relatively shallow water) and 12km (east).
Table 3 summarises extreme wave conditions within the lower Waitemata Harbour, in the main harbour
channel adjacent to the Wynyard Basin site and west of Wynyard Point. The wave conditions have been
determined from hindcasting using the local wind data in Table 3, the above fetches, and sea level at
MHWS. It is based on Young (1997) for the shallow northerly fetch and the CEM (2008) for the deeper water
fetches to the west and east.
Beca // 12 January 2018
3233847 // NZ1-14861405-218 0.218 // page 11America's Cup 36 Coastal Processes and Dredging Technical Report
Table 3: Hindcast extreme wave conditions, Lower Waitemata Harbour
Average Wave parameter by direction
Recurrence West North East
Interval Hs (m) Hmax Tp (s) Hs (m) Hmax Tp (s) Hs (m) Hmax Tp (s)
(years) (m) (m) (m)
1 0.9m 1.5m 2.8s 0.6m 0.9m 2.8s 0.9m 1.6m 3.1s
10 1.2m 2.0m 3.1s 0.7m 1.1m 3.0s 1.4m 2.3m 3.5s
50 1.3m 2.2m 3.2s 0.8m 1.2m 3.2s 1.5m 2.5m 3.6s
100 1.4m 2.4m 3.3s 0.9m 1.3m 3.3s 1.6m 2.6m 3.7s
2.5.1 Wynyard Basin
A northerly wind wave equivalent to the 1 year Average Recurrence Interval (ARI) condition, with a
significant wave height of 0.6m and a peak period (Tp) of 3s was modelled by Cardno (refer to Appendix D).
Figure 5 shows the resulting wave heights within the Freemans Bay area.
Figure 5: Existing situation with 1 year ARI wind-generated wave from the north (Source: Cardno, 2018)
These results show that for this northerly wind wave, wave heights within Freemans Bay are in the order of
0.5 to 0.6m. There are lower waves (America's Cup 36 Coastal Processes and Dredging Technical Report
2.5.2 FFIRF
For the FFIRF site, Cardno has modelled a northerly wind wave equivalent to the 0.6m wave height, 3s peak
period, 1 year ARI wave. The model results, shown in Appendix D, indicate significant wave heights of 0.5m
at the outer end of the site. The Westhaven breakwater provides a degree of shelter against westerly wind
waves.
2.6 Wakes
The project sites are affected by vessel wakes. These include wakes generated by the commercial ferries in
the ferry basin to the east and travelling through the lower Waitemata Harbour. In addition, charter boats and
recreational craft travelling to and from the Inner Viaduct Harbour produce wake that affects the Outer
Viaduct Harbour. Similarly, the wide range of commercial and recreational vessels using the Westhaven
Marina entrance and lower harbour produce wake to the west of Wynyard Point (refer to Figure 6).
Figure 6: Vessel wakes, FFIRF site west of Wynyard Point, January 2017
Vessel wakes are problematic for marinas and boat harbours as the longer period wakes tend to be similar to
the natural period of moored craft. This causes excitation of vessel movements (e.g. roll, pitch, etc.), which is
uncomfortable for passengers on board and may develop high stresses in the mooring lines and/or have
potential for vessel damage.
2.6.1 Wynyard Basin
Measurements of wave height were carried out for one week in November 2017 at six locations within
Freemans Bay. Four gauges were placed within Freemans Bay, one was situated adjacent to the Maritime
Museum on the western side of Hobson Wharf and one gauge was situated within Viaduct Harbour (refer to
Figure 7).
Beca // 12 January 2018
3233847 // NZ1-14861405-218 0.218 // page 13America's Cup 36 Coastal Processes and Dredging Technical Report
Figure 7: Location of the wave gauges within Freemans Bay
Field studies (Beca, 2003; Mulgor, 2017) have identified vessel wakes outside and inside Viaduct Harbour.
Recorded vessel wake (Hs) characteristics are summarised in Appendix D. It has been assessed that a
design characteristic wake (for modelling) has a significant wake height of 0.45m and period of 5s.
Mulgor (2017) concluded that for the majority of time the wakes within Freemans Bay are small, with waves
exceeding 0.1m in height for just 1% of the time. Wake heights between Viaduct Harbour and Princes Wharf
(Probe 5) ranged from 0.05 m to 0.18 m and within Viaduct Harbour (Probe 6) ranged from 0.05 m to 0.19 m.
Wakes from multiple of directions were identified with a relatively energetic sea state, although when
direction could be identified wakes generally originated from 30 to 75 degrees. Table 4 summarises the
recorded maximum wave height for each observable wake event over the 1 week period. Colour shading
has been applied to identify when vessel tranquillity guidelines of 0.1 m have been exceeded at Probe 6,
representing the existing marina basin. All wake heights of less than 0.1 are shaded green; shadings of
yellow have been used where wave heights are between 0.1 and 0.15 m; and brown where wave heights at
Probe 6 are between 0.15 and 0.2 m. The largest recorded wave height within Freemans Bay are also
identified in red.
These results show that the tranquillity criterion within Viaduct Harbour is generally exceeded when the
maximum wake height is the highest, but generally occur when wake heights in Freemans Bay are between
0.4 and 0.5 m although no clear trend on wave steepness was observed.
Beca // 12 January 2018
3233847 // NZ1-14861405-218 0.218 // page 14America's Cup 36 Coastal Processes and Dredging Technical Report
Table 4: Maximum wave height recorded at Probes within Freemans Bay and the existing facilities
Probe Number
Event Date Time Direction 1 2 3 4 5 6
1 17-Nov 18:14:34 NaN 0.31 0.39 0.28 0.20 0.31 0.18
2 17-Nov 19:32:06 NaN 0.13 0.53 0.40 0.17 0.06 0.07
3 17-Nov 21:02:34 106 0.34 0.40 0.34 0.12 0.12 0.16
4 18-Nov 6:30:01 72 0.31 0.37 0.43 0.18 0.03 0.05
5 18-Nov 16:25:00 72 0.37 0.43 0.50 0.16 0.19 0.12
6 18-Nov 17:44:50 55 0.36 0.38 0.22 0.11 0.09 0.11
7 19-Nov 15:09:58 52 0.36 0.39 0.51 0.27 0.14 0.09
8 19-Nov 17:48:50 NaN 0.20 0.35 0.33 0.11 0.16 0.08
9 20-Nov 6:48:32 73 0.26 0.37 0.25 0.12 0.11 0.10
10 20-Nov 9:26:42 NaN 0.22 0.43 0.39 0.17 0.14 0.06
11 20-Nov 11:08:54 NaN 0.26 0.45 0.38 0.13 0.10 0.17
12 20-Nov 16:20:20 38 0.32 0.50 0.36 0.15 0.05 0.06
13 20-Nov 17:34:46 80 0.31 0.35 0.46 0.18 0.18 0.11
14 20-Nov 21:03:11 58 0.34 0.53 0.29 0.12 0.06 0.05
15 21-Nov 7:55:05 66 0.26 0.35 0.36 0.27 0.18 0.07
16 21-Nov 8:27:08 NaN 0.30 0.34 0.30 0.12 0.11 0.14
17 21-Nov 8:52:45 61 0.23 0.50 0.38 0.14 0.15 0.08
18 21-Nov 10:17:23 NaN 0.22 0.37 0.23 0.15 0.14 0.07
19 21-Nov 13:04:58 46 0.48 0.35 0.28 0.17 0.10 0.06
20 21-Nov 15:26:18 NaN 0.26 0.35 0.35 0.28 0.14 0.07
21 21-Nov 16:35:13 NaN 0.26 0.37 0.47 0.32 0.21 0.14
22 21-Nov 18:12:58 35 0.38 0.39 0.38 0.19 0.10 0.10
23 22-Nov 8:25:41 42 0.38 0.36 0.44 0.24 0.14 0.17
24 22-Nov 14:19:38 NaN 0.25 0.52 0.55 0.20 0.09 0.06
25 22-Nov 16:04:51 68 0.48 0.47 0.38 0.27 0.15 0.09
26 22-Nov 16:32:43 NaN 0.50 0.38 0.37 0.21 0.14 0.09
27 22-Nov 16:45:35 64 0.47 0.40 0.36 0.23 0.19 0.18
28 22-Nov 17:02:32 60 0.39 0.39 0.38 0.25 0.16 0.13
29 22-Nov 18:11:48 NaN 0.28 0.46 0.29 0.16 0.11 0.07
30 23-Nov 7:42:24 NaN 0.28 0.37 0.26 0.24 0.12 0.09
31 23-Nov 8:25:34 NaN 0.28 0.41 0.35 0.24 0.20 0.13
32 23-Nov 10:56:43 NaN 0.23 0.48 0.35 0.19 0.17 0.07
33 25-Nov 9:48:36 NaN 0.10 0.52 0.35 - 0.09 0.07
Beca // 12 January 2018
3233847 // NZ1-14861405-218 0.218 // page 15America's Cup 36 Coastal Processes and Dredging Technical Report
Steady state wake modelling was carried out by Cardno (Appendix D). Based on the analysis of the
measured wake heights, a design wake with a wave height of 0.45 m and a period of 5 s was run for 30
minutes originating from 30, 45, 60 and 75 degrees. Results for analysis were taken from the last 20 minutes
of this run time.
This provides a conservative basis for assessing wakes as it simulates a continuous passage of some 240
waves at an upper bound recorded wake height from the range of likely directions a wake may propagate.
This compares with an individual ferry wake as measured at the site (refer to Figure 8) where the maximum
wave height for a particular wake train is more than double the average wake height and a typical wake train
lasts around 8 waves or around 30 to 40 seconds. Results of the continuous wake progression (i.e. some
240 waves) for a wake direction of 60 degrees is shown in Figure 9a.
Figure 8: Recorded wave heights at probes within Freemans Bay showing typical wake train and relationship between
maximum wake height and typical wake (Source: Mulgor, 2017)
Beca // 12 January 2018
3233847 // NZ1-14861405-218 0.218 // page 16America's Cup 36 Coastal Processes and Dredging Technical Report
Figure 9a: Steady state maximum wake height for 0.45 m wake from 60 degrees (Source: Cardno, 2018)
The wake height can be seen to propagate through Princes and Hobson Wharves into Outer Viaduct
Harbour and wave reflection effects can be seen off the various existing wharf structures. Comparing the
modelled wave height with the recorded wake data (refer Table 5) for the measured wake direction shows
the modelling approach tends to over-estimate the maximum wake height, with the model showing waves
more than 25% higher than the maximum recorded wake height in Freemans Bay (Probes 1 to 3) and up to
three times higher within Outer Viaduct Harbour and along the western edge of Hobson Wharf adjacent to
the Maritime Museum.
Table 5: Comparison of modelled and measured maximum wake heights
Modelled data (Cardno, 2018) Recorded data (Mulgor, 2017) Ratio between
Max Wave Height, H (m) H max (m) Dir of H modelled and
Point
30º 45º 60º 75º max measured
(degree) maximum wave
height
Probe #1 0.72 0.63 0.63 0.51 0.48 46 0.8
Probe #2 0.73 0.61 0.62 0.40 0.53 58 0.8
Probe #3 0.75 0.68 0.59 0.60 0.51 52 0.8
Probe #4 0.82 0.62 0.56 0.55 0.27 66 0.5
Probe #5 0.65 0.69 0.79 0.33 0.19 64 0.3
Probe #6 0.52 0.55 0.68 0.24 0.18 64 0.3
Beca // 12 January 2018
3233847 // NZ1-14861405-218 0.218 // page 17America's Cup 36 Coastal Processes and Dredging Technical Report
These results indicate the combination of a maximum wake height (with spectrum) and the duration of wake
progression used in the model results in an over-estimate wave height for the existing situation particularly
closer to reflective structures. Comparing measured with modelled data suggests that model wave heights
could be reduced by 25% within the open coast and by at least 50% within the sheltered marina basin.
2.6.2 FFIRF
Steady state wake modelling for a design wake height of 0.45 m and a period of 5 s was also carried out by
Cardno for the FFIRF site (Appendix D). The design wake height as used for the Wynyard Basin modelling
was run originating from directions 300 degrees to 45 degrees, in 15 degree increments. These directions
correspond to the site’s exposure to wakes from ferries travelling in the Waitemata Harbour.
The 0.45m wave height is based on ferry wakes in Wynyard Basin, which is exposed to wakes from the
larger and more frequent ferries sailing on the central and eastern ferry routes. Ferries in the western
harbour routes are typically up to 22m length overall; ferries on the central and eastern routes as recorded in
Wynyard Basin A are typically up to 35m length over all. A review of 2018 ferry timetables indicates that
ferry traffic west of Wynyard Point, past the FFIRF, is approximately 25% of ferry traffic on the central and
eastern routes. The 0.45m wave height / 5s wave period adopted for the FFIRF modelling is therefore likely
to be a conservative value as the generating vessels are smaller and the likelihood of combined wakes from
multiple vessels is reduced. Further, as noted above and in Cardno’s report, the steady state modelling
simulates a continuous passage of waves over 20 minutes (i.e. some 240 waves), rather than the limited
number of waves recorded for vessel wakes (i.e. some 8 waves).
The modelled results indicate maximum wave heights at the FFIRF site occur with wake from the 30 degree
direction (refer to Appendix D). It appears that a maximum wave height of about 0.5m resulting from typical
ferry wake applies at the site.
2.7 Sediment Processes and Sedimentation
Sediment sampling found seabed sediments in the city waterfront basins typically comprises around 60% to
85% silt and clay size particles, with the remainder being sand and gravel (Golder 2007; Golder, 2011;
Golder Associates, 2018). These recent marine sediments, often referred to as marine muds, are up to
approximately 10m deep, overlying Waitemata Group siltstones and mudstones.
An assessment of twenty years of suspended sediment concentration measurements from the lower
Waitemata Harbour has been undertaken for this project. The assessment indicates a mean suspended
sediment concentration of around 10 g/m3.
Sedimentation in the Waitemata Harbour and particularly the city waterfront basins, is largely driven by:
Fine sediments carried in local stormwater from the city, which flocculate on contact with seawater and
settle out of suspension in quiescent areas.
Fine sediments derived from the wider Waitemata Harbour catchment and unarmoured coastal
margins (i.e. not the immediate vicinity of the site), and from reworking of existing intertidal sediments
with the harbour. The typical sediment yield is about 100 tonnes/km2/year or 40,000 - 50,000
tonnes/year. While much of this sediment is trapped in the upper Waitemata Harbour, a proportion is
transported by tidal flows through the harbour and settles in the deeper, quiescent waterfront basins
and beneath the wharves where flow velocities are lower.
With reference to the first point, stormwater outfalls relevant to the proposed development (refer to Services
Drawings 5 and 6) include:
Beca // 12 January 2018
3233847 // NZ1-14861405-218 0.218 // page 18America's Cup 36 Coastal Processes and Dredging Technical Report
A single outfall into the Inner Viaduct Harbour, which carries flows from the local mid-Halsey St
catchment. This catchment has rain gardens for stormwater treatment, which remove sediment.
There is no indication on the recent hydrographic survey of sedimentation that could particularly be
attributed to the outfall.
The 2.7m diameter stormwater outfall from the Freemans Bay catchment. It discharges beneath North
Wharf at the south western corner of Wynyard Wharf. The stormwater is not treated and localised
sedimentation is evident immediately adjacent to the outlet, caused in part by the flocculation and
settlement mechanism described above. This could be considered a beneficial situation in terms of
wider harbour water quality. Sediments and any associated contaminants are removed from the
stormwater and contained within a limited area, from where they can be dredged and disposed of to
an appropriate location.
Approximately seven local outfalls are located along Brigham St, carrying the flows from the
immediate road area. These would be unlikely to be a measurable cause of sedimentation given the
small paved (i.e. low sediment-generating) catchment that they serve.
For the average tidal flow of 7,200 m³/s, and a mean sediment concentration of 10 g/m3, the sediment flux is
about 1,600 tonnes per tide. On an annual basis, the tidal movement of sediment near the port basins is
considerably higher than the land based sources, all of which indicates that the reworked coastal margins
are an important source of sediment redistribution.
Vessel movements around low tide disturb seabed sediments at the sites. The remobilised sediment is
dispersed through the water column and ultimately resettles in natural depositional areas such as the
waterfront basins. Apart from this, there is little transport of bed material because of the cohesive nature of
the marine muds, and the project sites are relatively sheltered with water depths exceeding -2.5mCD, and do
not experience significant currents due to tidal conditions or wave action.
Historical reviews and a recent assessment of sedimentation rates (refer to Appendix A) have identified the
sedimentation rates summarised in Tables 6a and b.
Table 6a: Summary of sedimentation rates for Wynyard Basin
Assessed Sedimentation Rates per Assessed Sedimentation Rates per Annum
Location
Annum (post-2000) (pre 2000)
Viaduct Harbour Typically up to 18 - 36mm (Inner 5 - 37mm (Inner Viaduct Harbour, 1996
Viaduct Harbour) assessment)
16 – 27mm (Inner Viaduct Harbour,
1992 assessment)
Typically up to 36 - 55mm (Outer
Viaduct Harbour)
Freemans Bay 17 – 33mm (east and north east of
historical shoal)
Up to 130mm (centre and 75-125mm (Wynyard, Hobson and
southwest of Wynyard Wharf South Princes Wharves, 1992 assessment)
waterspace)
0 - 50mm (Halsey St Extension
Wharf and North Wharf)
Beca // 12 January 2018
3233847 // NZ1-14861405-218 0.218 // page 19You can also read