Experimental study of breathers and rogue waves generated by random waves over non-uniform bathymetry
←
→
Page content transcription
If your browser does not render page correctly, please read the page content below
Experimental study of breathers and rogue
                                                waves generated by random waves over
arXiv:2005.14193v1 [nlin.PS] 28 May 2020

                                                       non-uniform bathymetry
                                                   A. Wang1 , A. Ludu2 , Z. Zong1,3,4 , L. Zou5,6,7 , Y. Pei5

                                                 1. School of Shipbuilding Engineering, Dalian University of Technology
                                                                      Dalian 116024, Liaoning, China
                                               2. Dept. Mathematics & Wave Lab, Embry-Riddle Aeronautical University
                                                                         Daytona Beach, FL, USA
                                              3. Collaborative Centre of Advanced Ships and Deepwater Engineering, DUT
                                                                      Dalian 116024, Liaoning China
                                                  4. Liaoning Deepwater Floating Structure Engineering Technology Lab
                                                                         Dalian, Liaoning, China
                                                     5. School of Naval Architecture, Dalian University of Technology
                                                                      Dalian 116024, Liaoning, China
                                             6. State Key Laboratory of Structural Analysis for Industrial Equipment, DUT
                                                                      Dalian 116024, Liaoning, China
                                             6. Collaborative Innovation Center for Advanced Ship and Deep-Sea Exploration
                                                                       Shanghai 200240, PR China

                                                                             June 1, 2020

                                                                                Abstract

                                                     Experimental results describing random, uni-directional, long crested,
                                                 water waves over non-uniform bathymetry confirm the formation of sta-
                                                 ble coherent wave packages traveling with almost uniform group velocity.
                                                 The waves are generated with JONSWAP spectrum for various steep-
                                                 ness, height and constant period. A set of statistical procedures were
                                                 applied to the experimental data, including the space and time variation
                                                 of kurtosis, skewness, BFI, Fourier and moving Fourier spectra, and prob-
                                                 ability distribution of wave heights. Stable wave packages formed out of
                                                 the random field and traveling over shoals, valleys and slopes were com-
                                                 pared with exact solutions of the NLS equation resulting in good matches
                                              Emails:       wam@mail.dlut.edu.cn,    ludua@erau.edu,   zongzhi@dlut.edu.cn,   li-
                                           zou@dlut.edu.cn, zoulidut@126.com, ygpei@dlut.edu.cn

                                                                                     1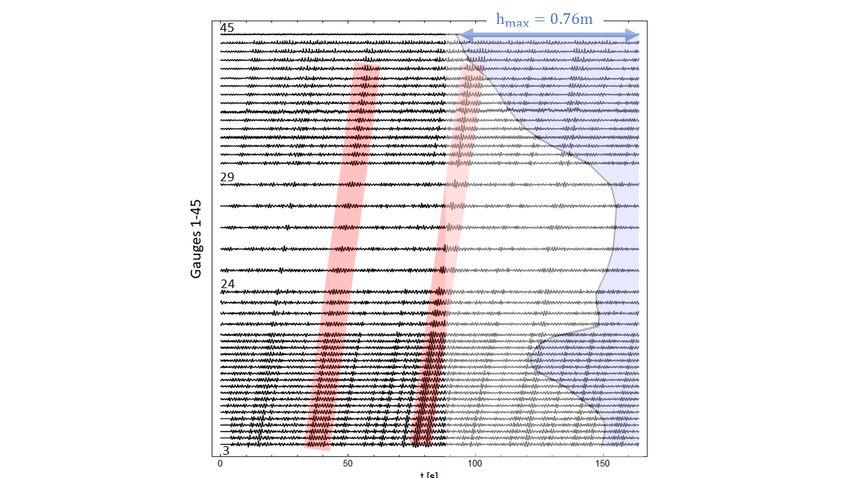
and demonstrating that these packages are very similar to deep water
      breathers solutions, surviving over the non-uniform bathymetry. We also
      present events of formation of rogue waves over those regions where the
      BFI, kurtosis and skewness coefficients have maximal values.

Keywords: random waves, non-uniform bathymetry, deep water, long crested,
breathers, Peregrine, Kuznetsov-Ma, nonlinear Schrödinger equation, rogue waves,
solitons, coherent packages, wave-maker experiments.

1    Introduction
It is very important to predict with greatest accuracy ocean waves for the safety
of ships and offshore structures, especially when operating in rough sea condi-
tions where extreme events could arise. Ocean extreme waves, also known as
rogue waves (RW), occur without apparent warning and have disastrous im-
pact, mainly because of their large wave heights [1, 2]. These highly destructive
phenomena have been observed frequently enough to justify advanced studies.
Possible candidates to explain the formation of rogue waves in the ocean are
presently under intense discussion [1, 3–5]. This topic attracted recently a great
deal of scientific interest not only because of the accurate modeling and pre-
diction of these extremes and similar structures [6–9], but also because of the
interdisciplinary nature of the modulation instability (MI) present in weakly
nonlinear waves [10–13]. Explanations solely based on linear wave dynamical
theories (constructive interference of multiple small amplitude waves) cannot
grasp the nonlinear coupling between modes, phenomenon which becomes im-
portant when the amplitude of the waves increases.
     One of the most cited nonlinear approaches for surface gravity wave prop-
agation is the modulation instability (MI) [14]. Such a phenomenon can be
described by the evolution of an unstable wave packet which absorbs energy
from neighbor waves and increases its amplitude, reaches a maximum and then
transfers its energy back to the other waves [15].
     The most common mathematical model for such unstable modes describing
the nonlinear dynamics of gravity waves is the nonlinear Schrödinger equation
(NLS) [10, 16, 18, 19] or extended versions of it [20, 21, 31]. Exact solutions of
the NLS equation provide feasible models that were successfully used to provide
deterministic numerical and laboratory prototypes both to reveal novel insights
of MI [32] and to describe rogue waves. The reason for the efficiency of the NLS
model is that through its balance between nonlinearity and linear dispersion it
can describe well the occurrence of Benjamin-Feir instability, and the associate
nonlinear wave dynamics [34–36]. Experimental studies confirmed validity of
NLS for deep water waves [37, 38, 40]. One other advantage of using the NLS
is its integrability [41], and analytic form for solutions, especially useful when
compared to experimental results.
     In NLS models the instability corresponds to various breather solution of this

                                        2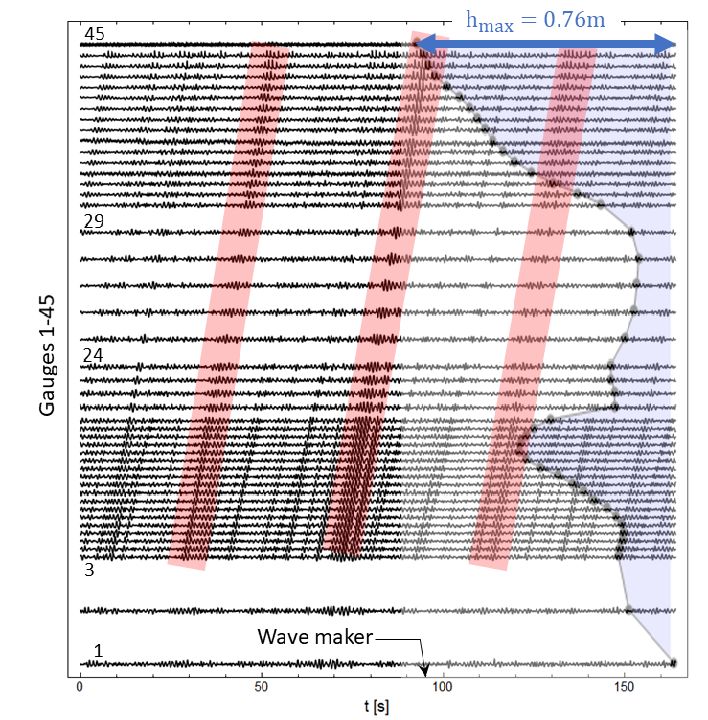
equation [19]. The NLS equation (as opposed to the solitons in other integrable
nonlinear equations like Korteweg-de Vries KdV) is characterized by a much
richer family of coherent structures, namely breather solutions [3, 15, 16, 31, 43–
45]. Even if the breathers change their shape during their evolution and hence
are not traveling solitons, they maintain their identity against perturbations
and collisions.
    Breathers are exact solutions of the nonlinear Schrödinger equation (NLS)
[10, 19] and describe the dynamics of modulation unstable Stokes waves [46]
in deep water [47, 48]. The MI starts from an infinitesimal perturbation that
initially growths exponentially, and after reaching a highest amplitude decays
back in the background wave field [18].
    Such full exact solutions for the NLS equation are given by rational ex-
pressions in hyperbolic and trigonometric functions of space and time and are
known as Akhmediev breathers (AB) [49, 50] providing space-periodic models
to study the Benjamin-Feir instability initiated from a periodic modulation of
Stokes waves [51, 52].
    A limiting situation is the case of an infinite modulation period and corre-
sponding significant double localization. Such solution is described through a
rational function called the Peregrine breather (PB) [49–53]. The growth rate
of the KM breather is algebraic [18]. Both AB and PB have been considered as
possible ocean rogue waves model [54, 55], and their features have been investi-
gated experimentally and numerically [56, 58, 59, 61].
    In addition to these MI solutions, NLS equation has also time-periodic so-
lutions in the form of envelope solitons traveling on a finite background, which
do not correspond to MI, and are called Kuznetsov-Ma solitons (KM).
    It is natural to apply such successful NLS-breathers deep water hydrody-
namic models in realistic oceanographic situations where the underlying field
is irregular and random [62]. Even if initially the ocean surface dynamics is
narrow-banded, winds, currents and wave breaking may induce strong irregu-
larities. Recently it was demonstrated the possibility of extending NLS models
to such broad-banded processes, a fact that becomes valuable in the predic-
tion of extreme events and in extending the range of applicability of coherent
structures in ocean engineering. There have been a lot of progress lately in this
direction [15, 16, 31, 45]. In [63] it is reported the possibility for exact breather
solutions to trigger extreme events in realistic oceanic conditions. By embed-
ding PB into an irregular ocean configuration with random phases, for example
a JONSWAP spectrum [64], the unstable PB wave packet perturbation initiates
the focusing of an extreme event of rogue wave type, in good agreement with
NLS and even modified NLS (MNLS) predictions [16]. In this study rigorous
numerical simulations based on the fully nonlinear enhanced spectral boundary
integral method shown that weakly nonlinear localized PB-type packets propa-
gate in random seas for a long enough time, within certain range of steepness
and spectral bandwidth of the nonlinear dynamical process, somehow in oppo-
sition to what the weakly nonlinear theory for narrow-banded wave trains with
moderate steepness would predict.
    This results are also backed up by recent hydrodynamic laboratory experi-

                                         3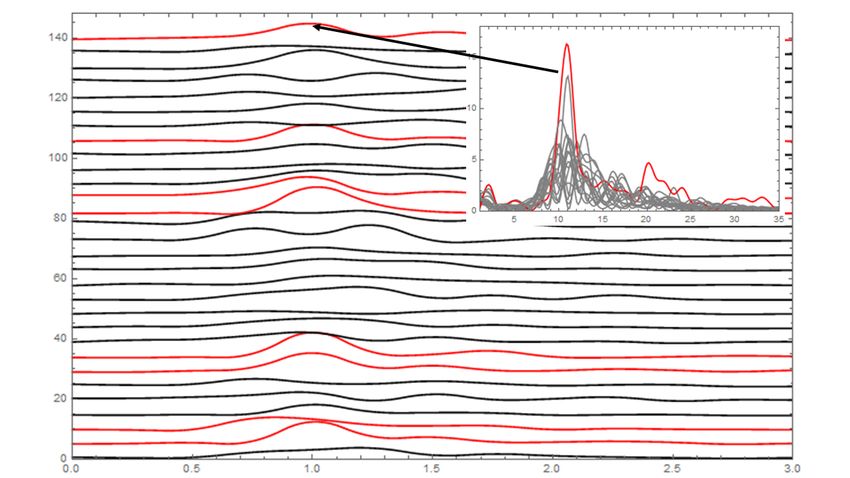
ments also show that PB breathers persist even under wind forcing [65]. From
the existing literature, especially the articles published in the last eight years
it appears that the role of coherent structures like solitons and breathers in the
properties of a system of a large number of random waves is definitely a task of
major importance both from fundamental and applications points of view.
    One of the objectives of the present work is to provide a detailed analysis
of our experimental data showing the occurrence out of the random wave field,
and survival against nonlinear interactions, and against the effects of travel-
ing over non-uniform bathymetry, of breathers and other coherent modes in a
hydrodynamic tank. The second objective is the comparison of these experi-
mental results with exact analytic expressions of PB, AB and KM breathers,
and to study the limits of applicability of the NLS equation model for deep
water random waves over variable bathymetry.
    In the last decade, the propagation of gravity waves over variable bathymetry
profiles has been studied as a possible configuration enhancing the occurrence of
large waves. Different studies have described the statistical properties of gravity
waves in this configuration both experimentally and with different numerical
methods ranging from KdV models, [28, 59], through modified NLS equations,
and Boussinesq models, [22], up to fully nonlinear flow solvers [42, 57].
    Trulsen et al shown, [22], that the change of depth can provoke increased
likelihood of RW. As waves propagate from deeper to shallower water, linear
refraction can transform the waves such that the wavelength becomes shorter,
while the amplitude and the steepness become larger, and vice-versa. The de-
pendence of the statistics parameters (spectrum, variance, skewness, kurtosis,
BFI, etc.) of long unidirectional waves over flat bottom, versus the depth h is a
result of interaction between several competing processes within the nonlinear
waves. One one hand, Whitham theory, [39], for nonlinear waves predicts that
in shallower depth long-crested waves become modulationally stable, hence the
modulation instability (MI) tends to decrease with the decreasing of kh, and
annihilate when kh < 1.363 because the coefficient the cubic nonlinear term
vanishes at this threshold. On the other hand Zakharov equation (for example
[22, 29]) predicts increasing of MI through increasing of the waves steepness
by linear refraction and by static nonlinear 2nd order effects with decreasing of
the depth. Numerical studies by Janssen et al, [30], have shown that shallower
water involves the decreasing of kurtosis all together by these effects.
    Nonlinear unidirectional wave fields over non-uniform bathymetry have a
different dynamical behavior because the traveling nonlinear waves reach an
equilibrium at some depth, and then they loose this equilibrium when running
over different depth, and it takes time and space extension for the waves to reach
another state of equilibrium. Numerical studies of NLS solution performed by
Janssen et al, [27], show that the combination of focusing and nonlinear effects
result in increasing of kurtosis when waves run over shallower depths, for ex-
ample when kh : 20 → 0.2. The same strong non-Gaussian deviation towards
shallower bottom was confirmed in numerical studies by Sergeeva & Pelinovsky
et al, [28]. More interesting though, the change in waves’ kurtosis with the
depth depends itself on what side of the slope the waves are investigated. In

                                        4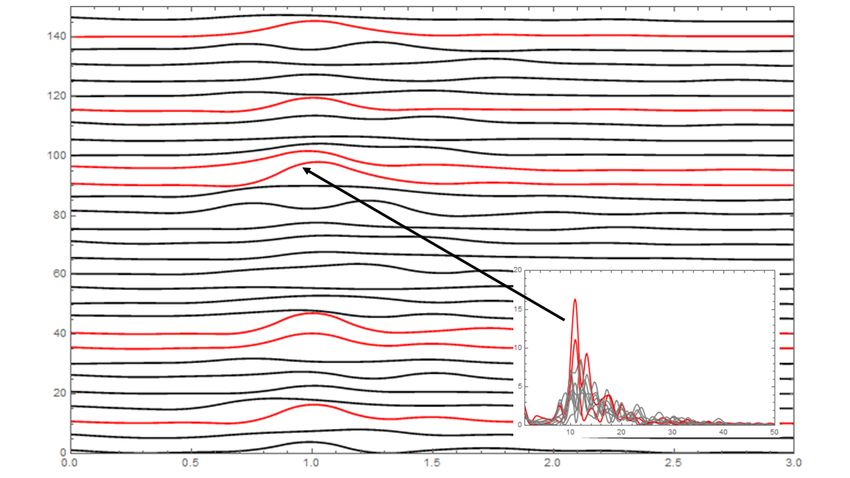
experiments over sloped bottom Trulsen et al, [22], shown that waves propagat-
ing over a sloping bottom from a deeper to a shallower domain present a local
maximum of kurtosis and skewness close to the shallower side of the slope, and
a local maximum of probability of large wave envelope at the same location,
situation which can generate a local maximum of RW formation probability at
that point, results backed by NLS numerical solutions in [26].
    The present paper provides experimental evidence of the above discussed nu-
merical predictions for long crested waves propagating over non-uniform bathymetry
and confirms the experimental results obtained by Trulsen et al in [22]. In ad-
dition to these results, and for the first time in literature we present nonlinear
waves generated by random fields and propagating over a slope, followed by a
submerged shoal, followed by another slope and a final run-up beach. We study
the evolution of the spectrum, skewness, kurtosis and other statistical descrip-
tors while the waves pass over this bottom landscape. Moreover, we detected the
formation and persistence of coherent wave packets, possibly breathers, travel-
ing over this variable bathymetry with almost constant group velocity and stable
evolution and shapes.
    The paper is organized as follows: In section 2 we present the experimental
setup and the type of waves and their physical parameters we are using, and
also how the results were collected and analyzed. We identify traveling stable
wave packages in the random wave field. In section 3 we analyze the experi-
mental results with respect to the waves steepness, Ursell number, MI, solitons
and RW conditions of formation like skewness, kurtosis and BFI. We also in-
vestigate the possibility of formation of RW and we evaluate the wave spectra
and the probability of distribution of wave heights. In section 4 we present
the NLS theoretical formalism for flat bottom and for non-uniform depth and
compare the corresponding exact solutions with our experimental results. In
conclusion we can prove that within the given bottom bathymetry, breathers,
solitons and rogue waves deep water phenomena are generated out of the ran-
dom wave background, are stable, and are little perturbed by the bathymetry
of our experiments.

2    Experimental set up. Random wave fields over
     non-uniform bathymetry
The experiments have been performed in the wave tank of the State Key Labo-
ratory of Coastal and Offshore Engineering in Dalian University of Technology.
The wave tank is Ltank = 50 m long, 3 m wide and 1 m deep. The water
tank is provided with a hydraulic servo wave maker at the left end which can
generate waves of arbitrary shape with minimum period 0.66 s at 15 cm wave
maximum height, and an absorbing beach is installed at the other end to avoid
wave reflections, Fig. 1. In the present experiment, the bottom has non-uniform
shape with the maximum depth of water in the tank h = 0.76 m. To insure a
unidirectional wave field and long-crested waves, the wave tank was divided in

                                      5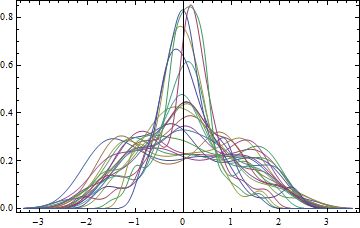
two sections along its length, of 2 m and respectively 1 m each, and we exper-
imented in the wider section. A number of 45 resistive wave probes (gauges)
were aligned along the wave propagation direction to measured the wave height.
The surface height of the water at these specified positions is measured with an
accuracy of up to 6 significant digits at a sampling δt = 0.02 s, with 170 s time
series length memory. The gauges are placed as shown in Figs. 1-4, namely:
first two control gauges, beginning at 9 m from the wave maker, then 17 equidis-
tant gauges with 30 cm in between, then 4 gauges at 50 cm separation, then
6 gauges separated by 1 m each, and finally 16 gauges separated by 40 m in
between. Since the width of the basin is large compared with the characteristic
wavelength of our experiments, viscous energy dissipation that occurs mostly on
sidewalls is assumed to be negligible at the center of the basin where our wave
probes are located [31]. The bottom shape is inspired by some specific sea floor
bathymetry. At the wave maker end the bottom is deep and then gradually
increases its heights towards shoal with minimum depth of hmin = 0.34 m at
gauge #16, at x = 13 m from the wave-maker. From this point the bottom
height drops at a larger slope and it reaches its deepest region at x = 20 m at
gauge #28. Then the bottom gradually becomes shallower increasing its height
towards a run-up beach all the way to the water surface, see Figs. 1-4.
    We have carried 40 different experiments by changing the significant wave
height Hs and significant period Ts , see Table 1, but because of the article length
we present here only three relevant cases of Hs and Tp . The sampling time of

                Table 1: Experimental      settings and parameters.
       Case            Hs (cm)                           Ts (s)
        B1               3.22              0.95 1.03 1.13 1.23 1.32 1.41 1.51
        B2               5.20              0.95 1.03 1.13 1.23 1.32 1.41 1.51
        B3               7.18              0.95 1.03 1.13 1.23 1.32 1.41 1.51
        B4     1.60; 2; 3; 4; 5; 6; 7; 8                  1.23
                   5.20; 7.18; 9.20                       0.75
         J      3.22; 5.20; 7.18; 9.20                    0.85
                3.22; 6.20; 8.20; 9.20                    0.95

Cases B1÷B4 is 81.92 s. In order to study the process of wave evolution in more
detail, the sampling time of Cases J is 163.84 s. A JONSWAP spectrum was
chosen for the irregular wave simulation, described by the following parameters
[67]
                                βJ Hs2 γ δ

                                                     1.25
                        S(f ) =            Exp −              ,
                                 Tp4 f 5            (Tp f )4
                                                   2
                                            f
                                           fp −  1
                            δ = Exp −                    ,                  (1)
                                              2σ 2

                                           6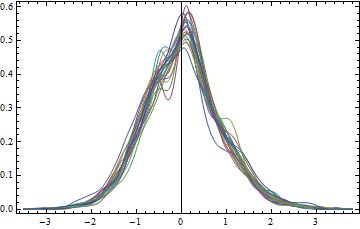
with
                           0.06238
       βJ '                                      · (1.094 − 0.01915 ln γ),
              0.230 + 0.0336γ − 0.185(1.9 + γ)−1
                                          THs
                         Tp '                            ,
                                1 − 0.132(γ + 0.2)−0.559
and the function of wave frequency given by
                                 (
                                   0.07 f ≤ fp
                             σ=
                                   0.09 f > fp ,

and were fp is the spectrum peak frequency, Tp is the spectrum peak frequency,
Ts is the significant period, and γ is the spectrum peak elevation parameters
which we set γ = 3.3. Given the geometry of the tank and dynamics of the wave

Figure 1: Experiment measurements setup. Positions of the wave gauges with
respect to the wave maker and bottom topography.

maker, ranges of the random waves parameters are limited by three physical
constraints: deep water condition, [68], neglecting capillary waves, and giving
the waves enough room to form breathers and eventually rogue waves, that is
λcapillary < λ < min{Ltank , 2πh}. The wave number for the carrier wave kp
is derived from the linear dispersion relation kp = 4π 2 /(gTp2 ). Under these
constraints and according to the parameters chosen in Table 1, the range of
peak wavelength that can be excited in the tank becomes 0.85 m < λp < 3.55
m. In our experiments the wavelength and group velocity of the carrier wave
changes slightly along the tank because of the non-uniform bottom. In the deep
regions at gauges #2 ÷ 7 and #22 ÷ 29 (h = 0.65 ÷ 0.76 m), or at x = 5 − 12
m and 14 − 22 m from the wave-maker, see Figs. 2,3, we have for the carrier
wave period Tp = 0.95 s deep water, long-waves, with parameters λp = 1.407
m, kp = 4.49m−1 and vg = 0.76 m/s. In the intermediate region over the shoal
(h ' 0.35 m) at gauges #11 ÷ 19, or at x = 12 − 14 m from the wave-maker, we
still have deep water long-waves with parameters λp = 1.31 m, kp = 4.79m−1
and vg = 0.85 m/s. Only towards the right end of the beach, (h ≥ 0.2 m) at
gauges #36 ÷ 45, or at x > 25 m from the wave-maker, we have shallow water
and waves with parameters λp = 1.13 m, kp = 5.55m−1 and vg = 0.89 m/s.
     In the left frame of Figs. 2 we present the bottom height (topography)
and gauges placement. In the right frame we present also with respect to the

                                         7
Figure 2: Left: Bathymetry profile in wave tank, placement of some key
gauges and quiescent water level (blue). Right: Water depth h(x), expression
kp (x)h(x), and MI extinction threshold 1.363.
distance to the wave-maker, the water depth h, and the calculated values of
kp h depending on depth and corresponding wavelength for fixed Tp . It ap-
pears that everywhere along the tank the condition for developing MI is fulfilled
(kp h > 1.363 [1, 2, 10, 14]), the deep water NLS equation model is valid for the
self-focusing regime of solutions, and wave train modulations will experience
exponential growth, see for example Figs. 7,8.
The physical parameters that characterize the evolution of irregular waves
are characteristic wave steepness p = kp Hs /2, which in our experiments is
ranged between 0.015 and 0.33, and by the bandwidth. The spectral bandwidth
is determined by choosing the peak enhancement factor, which in our case γ =
3.3 induces 4f /fp = 0.095. The Benjamin–Feir index BFI for the theory of
Stokes waves [11, 15, 74] which measures the nonlinear and dispersive effects of
wave groups is given by
p fp
BFI = √ .
24f
Beyond a critical value of BFI=1 [31] an irregular wave field is expected to be
unstable and wave focusing can occur. In our experiments we can cover the
range 0.11 < BFI < 2.2 namely covering all types of sea, from linear waves to
stronger MI with development of a rogue sea state, especially since the total
length of the measurements covers 28 m which is larger than the distance over
which the MI is expected to appear [31]. Since the waves in our experiments
may enter occasionally into a strongly nonlinear wave regime, the NLS equation
may not provide a very good fit with these experiments.
We first consider irregular JONSWAP waves with significant wave height
Hs = 3.22cm and significant period Ts = 0.95s over this complex bathymetry.
In Fig. 3 we present a typical experimental result. In this vertical longitudi-
nal section of the wave tank with variable bathymetry (the gray shape at the
bottom) and a wave maker placed at the left of the frame, we show the level
of quiescent water by a dashed blue line, on which we overlapped several waves
obtained at t = 75 (solid line showing a nonlinear coherent wave package on top
8Figure 3: Longitudinal section in the wave tank with variable bathymetry. The
wave maker is at the left of the frame, the dots represent gauges, and the vertical
axis shows depth in meters. The quiescent water level is the dashed blue line
and several of our waves are presented to visualize relations between the specific
wave heights, wavelengths and depth. We chose moments t = 75 (solid line),
80 (dotted line) and 86s (dashed line) when coherent spontaneous structures
(matched with Peregrine breathers) form over gauges number 5 ÷ 6 (solid line),
24 ÷ 27 (dotted line), and 30 ÷ 34 (dashed line), respectively. In the upper inset
the same picture is present at real scale.
of the shoal), 80 s (dotted line, showing the same structure which traveled now
over the deepest valley) and t = 86 s (dashed line, when the same coherent pack-
age travels up the slope of the run-up). The behavior of the waves shown in Fig.
3 is in agreement with the Djorddjevicć-Redekopp model for deep water with
variable bathymetry, using a modified NLS equation with variable coefficients
[60], Eq. 9. Indeed, in all our experiments the amplitudes and wavelengths of
the waves slightly decrease, while vg slightly increases, over the shoaling region
(about gauge #16), and the situation reverses when waves advance over deeper
regions (gauges #27 − 29).
In the upper inset of Fig. 3 we present the longitudinal section at real scale,
and the same waves, to stress that the all our waves amplitude are negligible
compared to the variations in bathymetry.
For every experiment of generation of random waves we noticed the for-
mation some localized traveling coherent wave packages. These structures,
once formed, keep traveling with almost same group velocity over the variable
bathymetry, over the shoal and tend to disintegrate when the kh = 1.363 crite-
9Figure 4: Random wave field of significant wave height Hs = 3.22cm, significant
period Ts = 0.95s and variable bottom with depth h ≤ 0.76m. Horizontal axis is
time evolution and the 45 gauges signals are lined up along the vertical axis from
the wave-maker (bottom) to the run-up (zero water depth on top of the frame).
The blue shape represents the bottom profile with the dots being the gauges
positions. We identify at least three coherent, stable, and almost uniformly
traveling packages, highlighted with red stripes.
rion for MI is not fulfilled anymore, that is around gauge number 39−41. In Fig.
4 we present such an example of a 164 s long time series (horizontal axis time)
as measured by different gauges lined up along the vertical axis. The traveling
coherent structures are identified (three of them, for example, are highlighted
in red stripes in the figure). These wave packages propagating approximately
constant with the peak group velocity of order vg ' 0.815 m/s. A larger image
for a typical such time series only for gauges 1 − 23 is given in Fig. 7 where one
can detect better the occurrence and stability over the shoal of the nonlinear co-
herent packages: one begins at t = 27 s and another larger one begins at t = 68
s. In Fig. 8 we present in more extended detail wave profiles for Hs = 3.22cm
and 160s duration time-series measured at 5 locations (gauges 1, 2, 23, 30 and
41) to observe better the nonlinear coherent formations that are spontaneously
formed in the random waves and that travel for as long as 20m.
3 Analysis of experimental results
In the analysis of our experiments over variable bathymetry we follow the
Trulsen et al approach, [22, 25, 26], by performing statistics over the time se-
ries (and not over space wave field) for the determination of the reference wave
and to discern the extreme waves or other coherent structures. In this proce-
10Figure 5: Same configuration and parameters as in Fig. 4 except here Hs = 5.2
cm. We still identify at least two coherent, stable traveling packages, highlighted
with red stripes.
dure Hs = Hs (x) becomes a function of space, and the criteria for identifying
breather solutions or RW become local. This approach, supported by numerical
studies [26, 57], allows to isolate the situation favorable for initiation of RW,
because linear refraction itself at variable bathymetry points cannot change the
probability of RW unless such local criteria for RW are not employed [22].
Random long-crested waves were propagated over the non-uniform bathymetry.
The slope of the bottom topography has values between 1 : 10 at the beginning
of the shoal (gauges #3, a drop of slope −1 : 240, then slope oscillating between
±1 : 16 and finally raising of the beach with slope 1 : 10 ÷ 1 : 35, all over a
length of 28.1 m. The gauges are placed as shown in Figs. 1-4. Three cases
of long-crested random waves were generated with different nominal significant
wave height Hs and constant nominal peak periods Tp , as shown in Table 1.
The peak wave-number kp has been computed from the linear waves dispersion
relation ωp2 = gkp tanh kp h where ωp = 2π/Tp , g = 9.81 m/s2 . The character-
√
istic amplitude is calculated as in [22] ac = Hs / 8 corresponding to a uniform
wave of the same mean power. The Ursell number is Ur = kp ac /(kp h)3 .
The three Hs cases for 45 recording gauges times 8192 samples taken at
δt = 0.02 s intervals, minus the startup effects provide about 7, 000 peak periods,
which, [22, 23], provide sufficiently reasonable estimates of kurtosis, skewness
and overall distribution functions. In Table 2 we present some wave param-
eters for the three Hs cases investigated, and for four regions of bathymetry
called: deep water, the deepest region, shoal and towards the upper parts of
the run-up beach, respectively. In all these regions the NLS theory derived by
Zakharov, [19], applies and the MI develops in all cases with kp h > 1.363 for
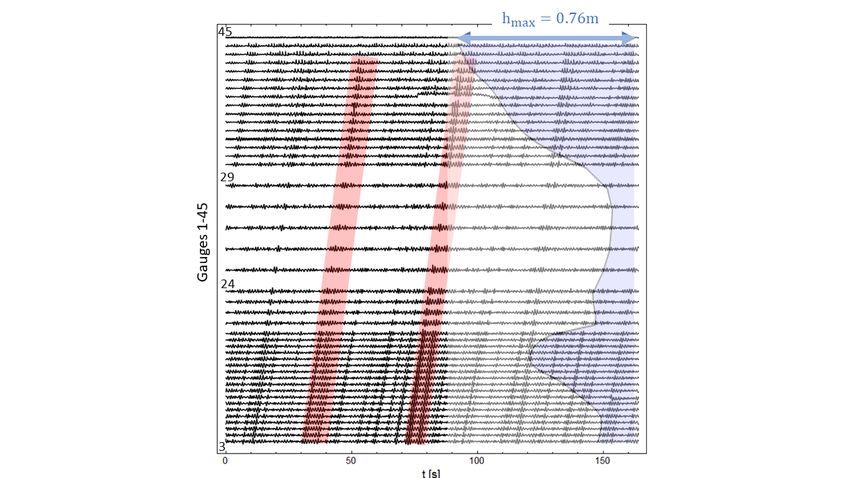
11Figure 6: Same configuration and parameters as in Fig. 4 except here Hs = 6.2
cm. We still identify at least two coherent, stable traveling packages, highlighted
with red stripes.
self-focusing regime. Steepness = kp ac , and Ursell number was also calculated
for all the cases (Table 2) and it shows a very good agreement with the similar
cases investigated in [22]. Ur has a small value in almost all deep regions, with
moderate increased values above the shoal but still in the range of Stokes 3rd
and NLS equation modeling, and larger values of Ur above the beach where the
waves cannot be considered anymore nonlinear deep water, and the character
shifts from Stokes 4th to 5th order to cnoidal behavior, towards breakers in the
end of the slope. In shallower water the 2nd -order nonlinearity of KdV dynam-
ics becomes responsible for the strong correlation observed between skewness,
kurtosis and Ur , see also Fig. 24.
Some further insight into understanding the waves obtained in these exper-
iments can be obtained by looking at the wave spectrum at different positions
along the wave-tank. The spectra at five representative points for the three cases
of significant wave height are shown in Figs. 11 with linear scales. The signal
peaks and the Fourier spectra were obtained by using and automatic multiscale
peak detection based on the Savitzky-Golay method. All the nominal peaks
are centered around the carrier frequency Tp = 0.9s. There is a slight spectral
development leading to a downshift of the peak, but not very visible, which
means that the MI is present almost all over the measurements, except the last
few gauges. The spectrum corresponding to the deeper sides, independently if
this deep region was before and after the shoal are almost identical (solid line
in Figs. 11). The spectra of waves on top of the shoal (dashed line) and the
spectra at gauges on the ramp about the same height as the shoal (dotted lines)
are not too different from the deep region ones. However, visible changes in the
12Figure 7: Gauges #3 ÷ 23 time series for Tp = 0.9 s and Hs = 3.22 cm in the
region where gauges are equidistant, but they run over the shoal. The coherent
structures, possible breathers, appears traveling with stable shape and group
velocity (slope of the line of traveling patterns representing the wave packages)
over the variable bathymetry.
Table 2: Three significant heights, at depths: Deep (gauges 3 ÷ 7, 22 ÷ 24, and
30), Deepest (gauges 26 ÷ 28), Shoal (gauges 15 ÷ 18), Beach (gauges 42 ÷ 44).
Deep Deepest shoal Beach
Tp = 0.95s h = 0.6 m h = 0.66 m h = 0.33 m h = 0.2 m
kp h = 2.7 kp h = 3 kp h = 1.6 kp h = 1.1
Hs [cm] kp ac Ur kp ac Ur kp ac Ur kp ac Ur
3.22 .055 0.25 .051 0.2 .055 1.4 .063 4.6
5.2 .083 0.4 .082 0.3 .089 2.3 .103 7.5
6.2 .098 0.5 .097 0.33 .106 2.7 .123 9
spectrum show when the waves propagate towards more shallower regions on
the final beach (gray line). At these points, where skewness and kurtosis attain
also maximum values, the spectrum tends to show a second maximum around
frequencies doubling the carrier frequency, most likely because of the growth of
second order bound harmonics caused by the increased nonlinearity at shallower
depth. Further into the shallow region the spectrum significantly broadens and
becomes noisier since energy is shared to lower and higher frequencies. This
situation becomes evident for regions with kp h ≥ 1.363 in agreement with the
results obtained in [22, 57].
Nonlinear transfer of energy between modes gives rise to deviations from
statistical normality of random waves (Gaussian e.g.). The most convenient
statistical properties intended to characterize nonlinear coherent wave packages
or extreme wave occurrence are the third and fourth-order moments of the free
13Figure 8: Steepness effect on coherent wave packages. The wave profiles from
gauges #10 (at x = 11.1 m) and #20 (at x = 14.1 m) for three cases: Hs =
3.22cm (first two bottom signals, black), Hs = 5.2 cm (middle two signals,
blue) and Hs = 6.2 cm (upper two, magenta signals) vs. time. Coherent
wave packages, most likely Peregrine breathers are spontaneously formed in the
random waves and can be observed traveling for as long as 20 m.
surface elevation η(x, t), [22, 57], namely the skewness and the kurtosis defined
as
< η− < η >3 >
Skewness = λ3 = ,
σ3
< η− < η >4 > < η4 >
Kurtosis = λ4 = 4
= − 1,
σ 3 < η 2 >2
where stands for the average over time and σ is the standard deviation
of η, directly related to the significant wave height Hs = 4σ. The skewness
characterizes the asymmetry of the distribution with respect to the mean while
the kurtosis measures the importance of the tails. The kurtosis of the wave field
is a relevant parameter in the detection of extreme sea states [30].
In Figs. 12 we present the kurtosis of the surface elevation in the left frame
and the skewness of the surface elevation in the right frame for the three signif-
icant wave heights experimented. The statistical estimates indicate 98% confi-
dence intervals obtained from 16, 500 selected samples from the original data.
For smaller wave amplitude there is a local maximum of kurtosis and skewness,
on top of the shallower edge of the shoal. For larger amplitude waves this kurto-
sis local maximum shifts towards the beginning of the slope, towards the deeper
region. All waves of all heights record a global maximum of the kurtosis in the
deepest region, over gauges numbers 24 ÷ 30, similar to the cases described in
[22, 25–28]. This effect is related to the fact that deeper means kh greater than
1.363 as seen in Table 2, and is also related to the spectral evolution leading to
a slight downshift of the shallow spectrum with dotted, dashed and gray lines
in Figs. 11. For all cases the global maximum of these two statistical quantities
is most prominent at the beginning of the shoal, that is at the positive slope
edges of the shoals. In all these three cases of different Hs values representing
different steepness degrees of the waves, except the end of the run-up beach, the
depth is everywhere larger than the threshold value for MI, and not significant
shift of the spectral peak can be easily seen.
14Figure 9: Density plot of the space-time wave field for Hs = 5.2 cm waves
(wave amplitude scale in cm to the right). The gauges from #3 ÷ 20 with 30
cm between gauges, the gauges from #20 ÷ 24 with 50 cm between gauges, the
gauges from #24 ÷ 30 with 100 cm between them and the gauges from #30 ÷ 33
with 40 cm between them. Higher-order breathers (doublets) can be observed
by their red-blue color while propagating uniformly.
Over deep water regions with kh ≥ 1.363, higher initial BFI (like the waves
with Hs = 5.2cm or 6.2cm, see the red and blue upper curves in Fig. 22) the
kurtosis tends to be stabilized at higher values as can be seen in the left column
in Fig. 12 for x = 3 ÷ 8 m and x = 25 ÷ 30 m, for waves with Hs = 3.22cm, for
x = 7 ÷ 10 m and x = 25 ÷ 28 m for waves with Hs = 5.2cm, and Hs = 6.2cm.
This result agrees well with previous publications demonstrating that stabilized
kurtosis is larger in deep water and smaller in shallower water [26, 29, 74]
However, when kh → 1.363 beginning at x ' 35 m, nonlinear effects diminish
and the kurtosis decreases towards 3. This is also visible in Fig. 12: for smaller
steepness waves with Hs = 3.22cm kurtosis tends to drop slightly around x ' 36
m just before the gray vertical stripe in the figure. The dropping effect is
more visible at higher steepness, Hs = 5.2cm at 36 m, and again less intense
for the steepest waves Hs = 6.2cm. After the 1.363 threshold, the observed
oscillations in kurtosis and skewness may be generated by other shallow water
effects, Bragg effect, reflection or linear diffraction. Our results make evident
that when a wave field travels over a bottom slope into shallower water, a wake-
15like structure may be anticipated on the shallower side for the skewness and
the kurtosis, as it was previously confirmed in [26]. The general expressions for
the skewness and the kurtosis of deep water surface evaluated with Krasitskii’s
canonical transformation in the Hamiltonian [30], apply to our cases with ' 0.1
(shallower regions for Hs = 5.2 cm and all regions for Hs = 6.2 cm, see Table 2)
and our experimental results lineup well with this theory when correlating the
values of kurtosis and skewness from Figs. 12 with the kp h values from Fig. 2
(right).
Also, noticing that the value of the BFI decreases with decreasing of the
water depth, as we can see it happening for x > 23 m (or after gauge 33)
in Fig. 22, while the nonlinear coherent structures (which we identified with
Peregrine or higher order NLS breathers) keep propagating stable up to shallow
water regions, we infer that the probability of RW occurring near the edge of
a continental shelf may exhibit a different spatial structure than for wave fields
entering from deep sea and BFI deep water criteria may not apply the same
way.
Right after the shoal, both the kurtosis and skewness show oscillations in the
values because of a combination between nonlinear effects and linear refraction.
One interesting observation resulting from Figs. 12 is that for small steepness
< 0.08 waves the kurtosis and skewness are larger above the extreme depths
h (very deep or h ' hmax , or very shallow or h
hmax ), while for larger steep-
ness waves, these two statistical moments tend to acquire their largest values
above the sloppy regions of the bottom. This observation can be expressed in a
phenomenological relation of the form
2
hmax dh
λ3,4 ∼ C1 h − + C2 ,
2 dx
for some empirically determined constants C1,2 . The conclusions obtained from
our experimental results and our statistical analysis of kurtosis and skewness
coincide with the statistical behavior suggested in the numerical studies from
[25–28, 57] and with the experimental results obtained for sloped bottom in
[22]. We have thus shown that as long-crested waves propagate over a shoal
and variable bottom in general, local maximum in kurtosis and skewness occur
closer to the beginning and the end of the slope, mainly on the shallower side of
the slope which can identify these regions as possible locations of high amplitude
breathers, multiple breathers and RWs formation.
3.1 Rogue waves from random background
In deep water, long-crested waves are subject to MI, [11, 18], which is known to
generate conditions for RW formation [1, 10, 16, 18, 23, 47, 54, 55, 58, 72, 74, 75].
It was also found that nonlinear modulations during the evolution of irregular
waves causes spectral development and frequency down-shift, suspected to be
related to the occurrence of RW [22, 24]. In this section we investigate the
occurrence of higher amplitude waves, out of the random background, as candi-
dates for RW. Extreme height waves, isolated in time and space from the typical
16background reference wave field is considered to be a Rogue Wave (RW) if it
satisfies some common criteria like η/Hs > 1.25 or H/Hs > 2, where η is the
crest elevation, H is the wave height, and Hs is the significant wave height, de-
fined as four times the standard deviation of the surface elevation, [22, 23]. In
Fig. 19 we present an example of two time series recorded in our experiments at
two locations, 19 m (left frame) and 26.5 m (right frame) from the wave maker.
The vertical axis shows the wave amplitude η(t) normalized to the characteristic
wave height Hs = 3.22 cm. We recorded such large amplitudes at 19, 22, 23.5
and 26.5 m (gauges #27, 30, 33, 41, respectively) from the wave maker. The
horizontal grid lines represent, in the order of their heights: minimum surface
(blue), standard deviation (black), and maximum wave (red). The maximum
height recorded is 2.1 ÷ 2.42Hs , which qualifies them as RWs. These events
happen over the deep water parts, at the locations where kurtosis and skewness
has also local maxima, Figs. 12.
For a system composed of a large number of independent waves, like the
random generation, the surface elevation is expected to be described by a
Gaussian probability density function. Under this hypothesis, Longuet-Higgins
[15, 43, 44], showed that, if the wave spectrum is narrow banded, then the
probability probability distribution of crest-to-trough wave heights is given by
the Rayleigh distribution. The distribution was found to agree well with many
field observations [15]. Nevertheless, recently [43, 44] it was shown numeri-
cally and theoretically that if the ratio between the wave steepness and the
spectral bandwidth this ratio is known as the Benjamin–Feir index (BFI) is
large, a departure from the Rayleigh distribution is observed. This departure
from the Rayleigh distribution was attributed to the MI mechanism. Moreover,
from numerical simulations of the NLS equation it was found [15] that, as a
result of the MI, oscillating coherent structures may be excited from random
spectra. In our experiments we obtained a very good correlation between the
waves at regions and during time intervals producing a narrower width spec-
trum and the corresponding detection (at the same locations and moments of
time) of coherent stable, traveling structures, most likely NLS breathers (AB,
KM, Peregrine of higher-order breathers, section 4). In Figs. 20, 21 we present
examples of Fourier spectra in the time-frequency domain calculated with a 4 s
moving window, at different locations and different moments of time. In these
figures, the red curves represent narrower bandwidth wave spectra measured
at points where also the coherent packages were detected and assimilated with
breathers/solitons/RW, wave packages described in previous sections. Namely,
the red curves in Figs. 20, 21 coincide with a good coefficient of correlation
(c = 0.76 Pearson correlation) with the structures highlighted with red stripes
in Figs. 4, 5, 6, with the coherent packages in uniform motion identified in the
mapping of Figs. 7, 8, 9, and 10, also they coincide with the packages chosen
for theoretical match with breathers and shown in Figs. 13, 15, 16, and 17, and
they are close neighbor with the extreme amplitude waves shown in Fig. 19.
These positive correlations represent an evidence that MI process takes place
in our experimental real long-crested water waves, with high values for the BFI
index (the ratio between the wave steepness and the spectral bandwidth) at
17various depths, on the top of the shoal and equally in the deep regions around
the shoal. In the case of our random waves the large values for BFI and the
narrower width of the spectra lead to MI evolution and to a “rogue sea” state,
that is a highly intermittent sea state characterized by a high density of unstable
modes, see Fig. 23. Our results are very similar with the same types of studies
reported [15].
By using the calculations of the spectral bandwidths for all our experimental
time series, at different locations and for the three types of significant wave
height (steepness), we can correlate these data with the mean wave height. The
result is presented in Fig. 24. We notice the formation of two separate clusters of
higher positive correlation: one for small waves with large spectral band width,
and one more localized for the breather/soliton/RW events described by large
wave heights and narrower spectra.
Another statistical feature which can confirm the formation of coherent trav-
eling packages of breather/soliton types (KM, Peregrine and AB solutions) is
the distribution of the probability for the wave heights, which we present in
Fig. 25. The middle frame, representing regions with coherent package for-
mation shows evidence of a cluster of narrow band-width spectra associated to
these breathers. In Figs. 26 we present the wave height probability distributions
for different moments of time over a 5 m length. We observe the formation of
three main modes: a dominant low-amplitude mode, a dominant high-amplitude
mode, and a flat probability distribution which occasionally tends to shift into
a bi-modal unstable mode as predicted by the Soares model [77].
Our experimental results, mainly gathered in Figs. 11, 12, 20-23 and 25, 26,
are in good agreement with the numerical calculation obtained by Trulsen et al
([22]a), from the Boussinesq model with improved linear dispersion, and with
the experiments presented in Gramstad et al ([22]b). Indeed, a significantly
increased BFI value, and consequently increase in the probability of RW occurs
as waves propagates into shallower water. For smaller Hs and = Hs kp the
maximum is smaller and delayed, while for larger steepness the maximum occurs
earlier and is larger, Fig. 22. Increased values of skewness, kurtosis, and BFI
are found on the shallower side of a bottom slope, with a maximum close to,
or slightly after the end of the slope Figs. 12, 22. Maxima of the statistical
parameters are also observed where the uphill slope is immediately followed by
a downhill slope. In the case that waves propagate over a slope from shallower to
deeper water, in the theoretical evaluations from [22] it was not found on increase
in RW wave occurrence where the wave parameters were akp = 0.038, a/h =
0.035, and U r = 0.031. In our experiments, however, we noticed this increase in
the BFI, kurtosis and steepness when traveling into deeper, probably because
our waves parameter, shown in Table 2, are different: akp > 0.05, a/h = 0.04,
and Ur > 0.2.
184 Comparison with exact solutions
In this section we present some current theoretical models that can fit our
experiments with random waves generated in a L = 50m long, 2 m wide wave
tank with variable bottom and maximum depth hmax = 0.76 m present by
the wave-maker and at two-thirds of the length, see Figs. 1, 3. Since in all
experiments described in section 2 we notice the formation of stable, traveling
coherent wave packages, we present in the subsequent section the match between
these waves and deep water breathers. We divide this section in two parts: in the
first part we present the corresponding theoretical results for uniform bottom,
and in the second part we extend this case to variable bathymetry.
In the uniform bottom case, for an ideal (incompressible and inviscid) liquid
under the hypothesis of irrotational flow, the dynamics of a free surface flow is
described by the Laplace equation for the velocity potential, and two bound-
ary conditions: a nonlinear one (kinetic) on the free surface, and zero vertical
velocity component at the rigid bottom [2, 18]. Under the assumption of very
small amplitude waves (or steepness) the problem can be considered as a weakly
nonlinear one, and the standard way of modeling is to derive the NLS equation
by expanding the surface elevation and the velocity potential in power series
and using the multiple scale method [1, 2, 17–20, 23, 47].
The procedure is to introduce slow independent variables (both for time and
space) and treat each of them as independent. The extra degrees of freedom
arising from such variables allows one to remove the secular terms that may
appear in the standard expansion. The multiple scale expansion is usually per-
formed in physical space and a simplification of the procedure is the requirement
that the waves are quasi-monochromatic. In the approximation of infinite wa-
ter depth, for two-dimensional waves the surface elevation, up to third order in
nonlinearity, takes the form
1 1
η(x, t) = |A(x, t)| − kp2 |A(x, t)|3 cos θ + kp |A(x, t)|2 cos(2θ)
8 2
3
+ kp2 |A(x, t)|3 cos(3θ) + . . . , (2)
8
where A(x, t) is a complex wave envelope, kp is the wave number of the carrier
wave, η(x, t) is the water elevation, θ = (kp x − Ω0 t + φ) is the phase, and φ a
constant phase. In addition we know that Ω0 = ωp (1 + kp2 |A(x, t)|2 /2) is the
p
nonlinear dispersion relation, with ωp = gkp . The complex envelope obeys
the NLS equation
ωp ∂ 2 A 1
∂A ∂A
i + cg − 2 − ωp kp2 |A|2 A = 0, (3)
∂t ∂x 8kp ∂x2 2
with cg = ∂ω/∂k being the group velocity. The NLS Eq. (3) has various types
of traveling solutions known as breathers or solitons. One analytic solution with
19major impact in literature is a combine one-parameter α family given by [17]
2iT 2(1 − 2α) cosh(2RT ) + iR sinh(2RT )
A(X, T ) = A0 e 1+ √ , (4)
2α cos(ΩX) − cosh(2RT )
where the X, T are arbitrary scaled
p √ s and the solution
variables by a factor
A(x, t) = sA(sX, s2 T ), R = 8α(1 − 2α) and Ω = 2 1 − 2α. When the
parameter α ∈ (0, 0.5) Eq. (4) describes the space-periodic Akhmediev Breather
family (AB), and when α > 0.5 Eq. (4) describes the time-periodic Kuznetsov-
Ma Soliton (KM) [17, 18]. Moreover, in the singular value for parameter α = 0.5
Eq. (4) describes a rational solution known as Peregrine (P) solution [53]
4 + 16iT
A(X, T ) = A0 e2iT −1 + . (5)
1 + 4X 2 + 16T 2
The Peregrine solution in Eq. (5) only represents the lowest-order solution of
a family of doubly-localized Akhmediev-Peregrine breathers (AP), [12, 54, 66],
also called higher order breathers [7]
Gj + iHj
Aj (X, T ) = e2iT (−1)j + , (6)
Dj
where the terms Gj , Hj , Dj are polynomials which can be generated by a recur-
sion procedure [66].
While in deeper water 3rd -order nonlinearity causes focusing of long-crested
and narrow-banded waves and hence possibility of occurrence of freak waves, in
shallower water the nonlinear dynamics are dominated by 2nd -order nonlinearity.
Waves over variable water depth can be modeled for irrotational, inviscid and
incompressible flow with a variable coefficient NLS equation. In the approx-
imation of finite depth (kh)−1 = O(1), mild slope ∂h/∂x = O(2), and small
steepness = O(3) the authors in [26] presented a NLS model with variable
coefficients plus a shoaling term. In this model water surface displacement η,
Eq. 2, and velocity potential Φ can be written as 3rd -order perturbation series
normalized to g and ωp , respectively
1
η = 2 η̄ + (Aeiθ + 2 A2 e2iθ + · · · + c.c.),
2
1 0 0
Φ = φ̄ + (A1 eiθ + 2 A2 e2iθ + · · · + c.c.), (7)
2
Rx
where θ = k(ξ)dξ − t, and c.c. means complex conjugation. The resulting
NLS modified (with respect to Eq. 3) equation in terms of the first harmonic
amplitude A of the surface displacement is
∂2A
dh ∂A 1 ∂A
iµ A + i + + λ 2 = ν|A|2 A, (8)
dx ∂x vg ∂t ∂t
where the coefficients µ, λ, ν, ω̄ depending on k, h and vg at constant imposed ω
are defined in [26]. In particular, the extra shoaling term iµhx generalizing the
20traditional NLS Eq. 3 comes from the conservation of wave action flux [39]. For
the specific bathymetry in our experiments, Figs. 1, 2, 3, when the waves travel
over the shoal (at x ∼ 11 − 15 m from wave-maker) the dispersion coefficient
λ(h) has only a slow variation of maximum 12% of its value. The nonlinear
term coefficient ν(h) decreases on top of the shoal with 54% of its deep water
value, while the shoaling term coefficient µ(h) has a local increase of 140% on
top of the island. The effect of the shoaling term, similar mathematically to
the linear dissipative terms occurring in non-homogeneous medium, or to the
boundary-layer induced dissipation term in an uniform depth, is a change in
wave’s amplitude. Actually, it was found [60], that such damping terms can
stabilize the BF instabilities, especially since the nonlinear term contribution
decreases in the shoaling regions. This effect is visible in our experiments man-
ifesting as a decrease in the BFI over the shallower region, for any Hs value,
Fig. 22. Analyzing Eq. 8 with the Djorddjevicć-Redekopp model [60], it results
that
dh dkp d|A|
∼− ∼ , (9)
dx dx dx
where these relationships are in effect because the shoaling term coefficient can
be absorbed in the relation µ ∼ dvg /dx. Eq. 9 implies that waves entering in a
shallower region experience a decreasing amplitude and wavelength, while waves
expanding over deeper regions experience amplitude and wavelength growth.
This effect is clearly visible in our results, see for example Figs. 3-6, 8.
In Fig. 22 we present the BFI for the three different wave steepness vs.
space. Where the water depth is larger (gauges 3 ÷ 8 and 21 ÷ 28) BFI has
larger values, and this value increases with the steepness as we can see from
the red and blue curves spikes at gauges 7, 22, 27. For example, this effect is
quite visible over gauges 23 ÷ 28 where BFI increases monotonically with water
depth, and again over gauges 27 ÷ 30 where BFI decreases monotonically with
decreasing of the water depth. Over regions with shallower water depth (kh
is closer to the MI threshold) the BFI decreases no matter of the steepness
(see black, red and blue curves over gauges 11 ÷ 20 in Fig. 22). However, the
dynamic response of the waves depends on a combination of water depth (gray
curve with circles), bottom slope (green thick curve) and wave steepness (in
order of its increasing the upper curves: black, red, blue). At a sudden drop in
the water depth, higher steepness tends to reveal a higher BFI, hence steeper
waves are more likely to build RW after shoals and islands (gauge 21).
Over regions where water becomes permanently shallower (gauges 30 ÷ 40)
the relaxation distance for decreasing and stabilizing of the BFI, kurtosis and
skewness depends on the wave steepness. While at Hs = 3.22cm the BFI varia-
tion is almost monotonically correlated to the water depth variation, for larger
waves with Hs = 5.2 ÷ 6.2cm the BFI spikes back to larger values, and is not
stabilized for a length of about 8 ÷ 10 m
λp as mentioned in [26], too.
We also noticed that for small values of the bottom slope in absolute value on
the shallow side of the slope, kurtosis and skewness can stabilize almost at the
same location as the change of depth. Large local values of the absolute value of
bottom slope (like fast drops or steep increases of the bottom represented by the
21spikes of the green curve in Fig. 22 over gauges 20−21 or 31−32) induce spikes in
the BFI and this effect is stronger for larger wave steepness, and less prominent
for smoother waves like the case Hs = 3.22cm. This effect can be correlated with
the observation of similar spikes in kurtosis and skewness at the same locations,
Fig. 12, and these observations are in agreement with the experiments in [22]
and numerical evaluations in [57]. The increase of skewness and kurtosis over
shallowing regions, especially in the transition zone, was also correlated with
deviations of the wave states from the Gaussian distribution and the increase of
probability of RW occurrence. These changes in the statistics parameters of the
wave field over transition zone depend on the wave steepness (and consequently
on the Ursell number and Hs ), but not necessary on the length of the transitional
zone, as we noticed the occurrence of localized spikes at the beginning of any
high bottom slope region which do not necessarily continue along the shallower
region. The results obtained confirm the conclusion made [21, 22, 28] in the
framework of the nonlinear Schrodinger equation for narrow-banded wind wave
field, that kurtosis and the number of freak waves may significantly differ from
the values expected for a flat bottom of a given depth.
While the wave propagate over the uphill slope, from deeper to shallower
water it becomes evidence from Figs. 12,22 that as long as the shallower side
of the slope is sufficiently shallow, and slope length is small enough, we observe
local maxima (spikes) of kurtosis, skewness and BFI. These localized maxima
are placed at the shallower end of the slopes in agreement with the results
from [22]. In our experiments the bottom mimics a realistic ocean floor, and
the regions with almost constant water depth are not very long, so we do not
observe the asymptotic stabilizing of kurtosis and skewness.
We fit the traveling coherent wave packages obtained din our experiments,
see for example the red stripes in Figs. 4,5,6, or the wave packages easily visible
in Figs. 7,8, with all the above solutions trying to identify which one describes
the best our results.
In Figs. 13 we fit the earliest coherent package formed in small steepness
waves with KM solitons. In experiment this group travels as a doublet of stable
localized waves, and it is not obvious if this is a bound group of two independent
KM solitons, or it is one AB double-breather (higher order Peregrine breather).
All theoretical breathers presented Figs. 13 have the same set of parameters,
except being translated in space and time accordingly to the gauge position and
chosen interval of time. It is very interesting that the match keeps being good
enough while the group travels over variable bottom, over a shoal and the deep
valley following, and even up the beach when the waves increase in amplitude
and become pretty sharp (see the 8th frame for example) and ready to break.
In Figs. 14 we do not show the theory but instead present an overlap of 7
instants of the same wave group, shifted in time correspondingly. The 8th frame
shows an obvious match of the same type of behavior for this coherent traveling
group, and the likeliness to a breather, possibly a higher-order breather
We also present the match of the stable traveling doublet with two KM
solitons bound together, Fig. 15 left, as compared to a best fit with a single
KM soliton, presented in the right frame. In Figs. 16 we fit the experiment
22with Peregrine breathers (red curves) solitons, and for comparison, the same
experimental instants were fitted with KM solitons (blue curves). In Figs. 17,
18 we present comparison with double AB breathers, Eq. 6. This modeling
represents the best match, so we believe that the stable, oscillating and traveling
doublets are actually higher order AB submerged in a random wave background.
There also a possibility to explain these oscillating and breathing doublets as
Satsuma-Yajima solitons and the supercontinuum generation effect [17, 18].
Same qualitative results, and the same percentage of matching are obtained
for the other two experiments, of higher steepness, but we do not present them
here in detail, in order to keep a reasonable length for the paper. In Figs. 9,
10 we present density plots of the wave heights, in space-time frames, for the
steeper waves. These plots show constant group velocity traveling breathers
over the shoal and deep valleys.
In our experiments the mean value of steepness is 0.0765 ± 4%, and the
theoretical one obtained from the match of experiments with the same KM or
peregrine breather results 0.07803 showing a good match between experiments
and theory. The match was made between the analytic form of the KM breather
and the experiment for the gauges #4, 10, 12, 18, 19, 20, 23, 25, 28, 30, 34. Since
ocean waves are usually characterized by an average steepness of about ∼ 0.1
corresponding to the peak frequency of the spectrum, both the experimental and
theoretical match are plausible. From measuring of the time interval when this
structure arrives at various gauges we obtain a group velocity for the breather
of Vg = 0.81 m/s. The theory predicts the occurrence of maximum heights of
these breather in the range Amax /A0 ∼ 3.92 which is in good agreement with
our experimental values of 3.41.
5 Conclusions
In this paper, we present experimental results describing the dynamics of a ran-
dom background of deep uni-directional, long crested, water waves over a non-
uniform bathymetry consisting in a shoal and several deeper valleys, as well as
a final run-up beach. Experiments were performed with waves initially gener-
ated with a JONSWAP spectrum, keeping the same carrier (central) frequency,
but for three different wave significant heights, involving three different wave
steepness. The experimental results confirm the formation of very stable, co-
herent localized wave packages which travel with almost uniform group velocity
across the variable manifolds of the bottom. By using well established statistical
tools, and by matching experiments with some of the exact solutions of the NLS
equation, we proved that these coherent wave packages coming out of the ran-
dom background are actually deep water breathers/solitons solutions (mainly
Kuznetsov-Ma, Akhmediev, higher order AB and Peregrine breathers/solitons
types), and we put into evidence the formation of rogue waves around those
regions where the BFI, kurtosis and skewness predict their formation by taking
larger values. The evolution and distribution of the statistical parameters, i.e.
space and time variation of kurtosis, skewness and BFI, Fourier and moving
23You can also read