Decrease in 230Th in the Amundsen Basin since 2007: far-field effect of increased scavenging on the shelf? - AWI
←
→
Page content transcription
If your browser does not render page correctly, please read the page content below
Ocean Sci., 16, 221–234, 2020
https://doi.org/10.5194/os-16-221-2020
© Author(s) 2020. This work is distributed under
the Creative Commons Attribution 4.0 License.

Decrease in 230Th in the Amundsen Basin since 2007: far-field effect
of increased scavenging on the shelf?
Ole Valk1 , Michiel M. Rutgers van der Loeff1 , Walter Geibert1 , Sandra Gdaniec2 , S. Bradley Moran3 , Kate Lepore4 ,
Robert Lawrence Edwards5 , Yanbin Lu6 , Viena Puigcorbé7 , Nuria Casacuberta8,9 , Ronja Paffrath10 ,
William Smethie11 , and Matthieu Roy-Barman12
1 Alfred  Wegener Institute Helmholtz Centre for Polar and Marine Research, 27570 Bremerhaven, Germany
2 Department    of Geological Sciences, Stockholm University, 106 91, Stockholm, Sweden
3 College of Fisheries and Ocean Sciences, University of Alaska Fairbanks, Fairbanks, AK 99775, USA
4 Department of Astronomy, Mount Holyoke College, South Hadley, MA 01075, USA
5 Department of Earth and Environmental Sciences, University of Minnesota, Minneapolis, MN 55455, USA
6 Earth Observatory of Singapore, Nanyang Technological University, Singapore 639798, Singapore
7 Center for Marine Ecosystem Research, School of Science, Edith Cowan University, Joondalup, WA 6027, Australia
8 Laboratory of Ion Beam Physics, ETH Zurich, 8093 Zurich, Switzerland
9 Institute of Biogeochemistry and Pollutant Dynamics, Environmental Physics, ETH Zurich, 8092 Zurich, Switzerland
10 Max Planck Research Group for Marine Isotope Geochemistry, Institute for Chemistry and Biology of the Marine

Environment, University of Oldenburg, 26129 Oldenburg, Germany
11 Lamont-Doherty Earth Observatory, Palisades, NY 10964-8000, USA
12 Laboratoire des Sciences du Climat et de l’Environnement, LSCE/IPSL, CEA – CNRS – UVSQ, Université Paris-Saclay,

91191 Gif-sur-Yvette, France

Correspondence: Ole Valk (ole.valk@awi.de)

Received: 8 May 2019 – Discussion started: 14 June 2019
Revised: 8 November 2019 – Accepted: 12 December 2019 – Published: 14 February 2020

Abstract. This study provides dissolved and particulate             it is suggested that these interior waters have undergone en-
230 Th and 232 Th results as well as particulate 234 Th data col-   hanced scavenging of Th during transit from Fram Strait and
lected during expeditions to the central Arctic Ocean (GEO-         the Barents Sea to the central Amundsen Basin. The 230 Th
TRACES, an international project to identify processes and          depletion propagates downward in the water column by set-
quantify fluxes that control the distributions of trace ele-        tling particles and reversible scavenging.
ments; sections GN04 and GIPY11). Constructing a time
series of dissolved 230 Th from 1991 to 2015 enables the
identification of processes that control the temporal devel-
opment of 230 Th distributions in the Amundsen Basin. After         1   Introduction
2007, 230 Th concentrations decreased significantly over the
                                                                    The Arctic Ocean is one of the most rapidly changing parts
entire water column, particularly between 300 and 1500 m.
                                                                    of the Earth’s ocean–atmosphere system as a result of climate
This decrease is accompanied by a circulation change, evi-
                                                                    change. Underlying the potential anthropogenic changes is a
denced by a concomitant increase in salinity. A potentially
                                                                    large natural variability in the Arctic. Due to the limited ob-
increased inflow of water of Atlantic origin with low dis-
                                                                    servations in this extreme environment, establishing datasets
solved 230 Th concentrations leads to the observed depletion
                                                                    that allow an assessment of its variability is important. Nat-
in dissolved 230 Th in the central Arctic. Because atmospher-
                                                                    ural tracers of physical, chemical and biological processes
ically derived tracers (chlorofluorocarbon (CFC), sulfur hex-
                                                                    provide an integrated description of the changing state of the
afluoride (SF6 )) do not reveal an increase in ventilation rate,
                                                                    system. They are therefore key tools to investigate processes,

Published by Copernicus Publications on behalf of the European Geosciences Union.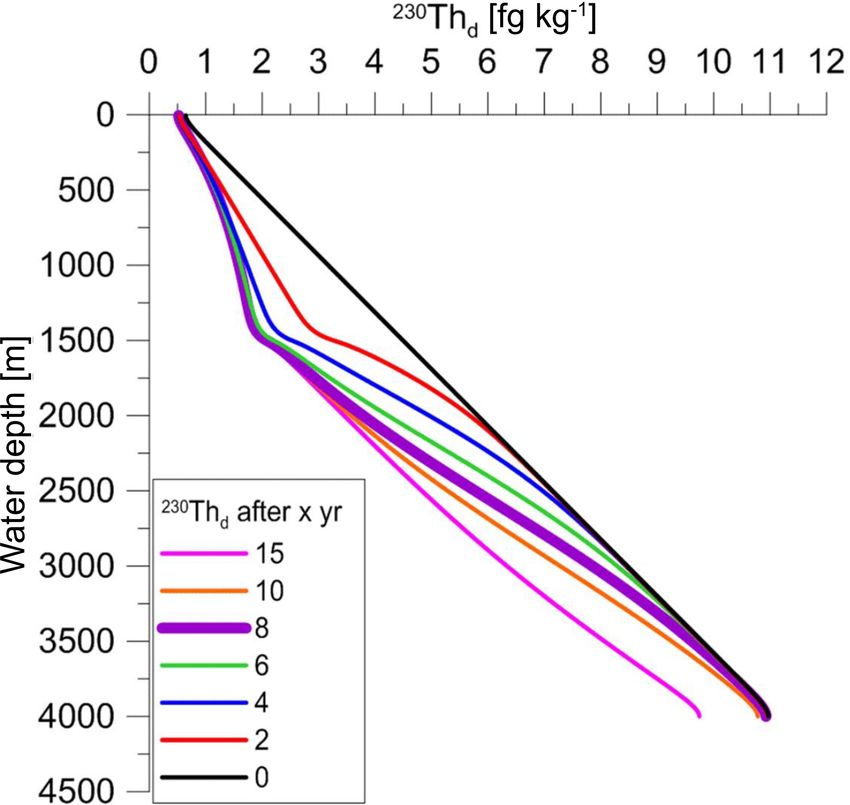
222 O. Valk et al.: Decrease of dissolved 230 Th in the Amundsen Basin
with a salinity of 34.87–34.92, are still able to exchange over
the Lomonosov Ridge. In contrast, deep and bottom waters
differ between the Eurasian Basin (salinity: 34.92–34.945)
and the Amerasian Basin (salinity: 34.92–34.96) due to the
topographic barrier.
Atlantic waters from the Norwegian Atlantic Current en-
ter the Arctic Ocean via Fram Strait and the Barents Sea.
Fram Strait Branch Water (FSBW) is supplied through the
West Spitsbergen Current (WSC) (Rudels, 2012) (Fig. 1).
Barents Sea Branch Water (BSBW) enters through the Bar-
ents Sea and consists of Atlantic water that undergoes strong
modifications in the Barents and Kara seas by cooling down
and mixing with continental runoff and meltwater (Rudels
et al., 2015). The BSBW enters the Nansen Basin through
the St. Anna Trough, where limited mixing with the FSBW
occurs. Once in the polar ocean, surface waters follow wind-
driven ice motion (Aagaard et al., 1980), whereas deeper At-
lantic water branches (FSBW and BSBW) flow cyclonically
to the east, forming a boundary current along the continental
slopes of the Nansen and Amundsen basins.
BSBW (approx. 1025 m depth; Tanhua, 2009) and FSBW
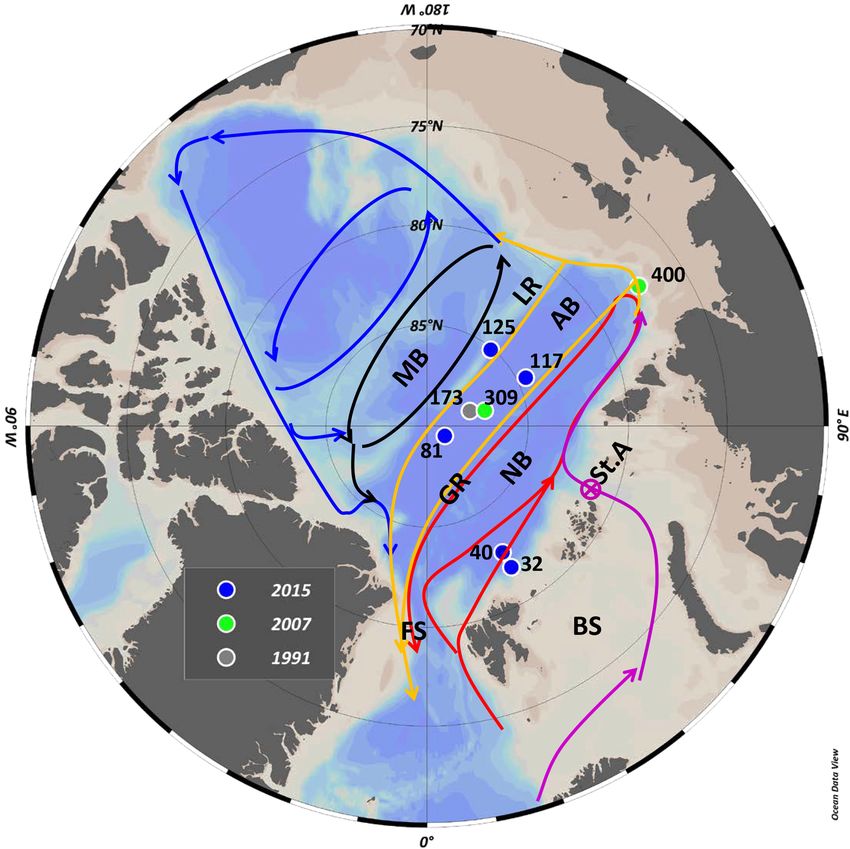
Figure 1. Map of the Arctic Ocean and station overview. AB: (approx. 425 m) return in the Atlantic and intermediate wa-
Amundsen Basin; NB: Nansen Basin; GR: Gakkel Ridge; MB: ter layers along the Lomonosov Ridge towards Fram Strait
Makarov Basin. BS: Barents Sea; FS: Fram Strait; LR: Lomonosov (Rudels et al., 2013) (Fig. 1), and a second branch crosses
Ridge; St.A: St. Anna Trough with intermediate water circulation the Lomonosov Ridge entering the Canada Basin following
patterns after Rudels (2009). Red is the Atlantic inflow through the Arctic Ocean Boundary Current (AOBC) (Rudels, 2009).
Fram Strait (FSBW) and return flow through the Nansen Basin; pur- Deep waters of the Arctic Ocean have similar structure,
ple is the inflow through the Barents Sea (BSBW). Atlantic layer
with a thick intermediate layer stratified in temperature but
circulation in the Amundsen Basin (orange), the Makarov Basin
with salinity almost constant with depth (Rudels, 2009). Yet,
(black) and Canada Basin (blue) are indicated as arrows. Copyright:
Schlitzer (2018). the Amerasian Basin Deep Water is warmer, saltier and less
dense than the Eurasian Basin Deep Water (EBDW) (Aa-
gaard, 1981; Worthington, 1953). The deepest exchange of
monitor environmental changes and provide an observational Makarov Basin water, part of the Amerasian Basin, with
baseline against which models can be tested. Eurasian Basin water occurs through a depression of the
ridge, called the Intra-Basin with a sill depth of approxi-
1.1 Hydrography and circulation patterns of the mately 1800 m (Björk et al., 2007, 2010; Jones et al., 1995).
central Arctic Ocean Water from the Amundsen Basin flows over the Lomonosov
Ridge into the deep Makarov Basin and in the reverse direc-
The central Arctic Ocean is divided into the Amerasian Basin tion (Middag et al., 2009).
and Eurasian Basin by the Lomonosov Ridge (Fig. 1). The Another important component of the Arctic Ocean is the
Gakkel Ridge separates the Eurasian Basin further into the freshwater content, coming from the melting of sea ice and
Nansen Basin and the Amundsen Basin, while the Amerasian from river runoff. The fresh water content of the central Arc-
Basin is separated into the Makarov and Canada basins by the tic Ocean is currently at the highest level since the early
Alpha–Mendeleev Ridge. 1980s and is expected to increase in the future (Rabe et
Water masses of the Arctic Ocean are commonly distin- al., 2014), which could lead to a stronger stratification of the
guished as five layers (Rudels, 2009). The uppermost low- water column. This process is supported by sea ice decline, as
salinity Polar Mixed Layer (PML) varies in thickness be- observed in the Beaufort Gyre (Wang et al., 2018). Karcher
tween winter and summer due to melting and freezing of sea et al. (2012) suggest a reversal in flow direction of Atlantic
ice. Salinity ranges from 30 to 32.5 (Amerasian Basin) to 32– Water in the Canada Basin at intermediate water depths on
34 (Eurasian Basin). Below the PML is a 100–250 m thick the basis of 129 I observations and modelling. This could lead
halocline in which salinity increases sharply from approxi- to a decoupling of flow regimes in the Canada and Eurasian
mately 32.5 to 34.5. The underlying Atlantic Layer is charac- basins and reduce exchange times between the two major
terized in salinity and temperature by waters of Atlantic ori- basins of the Arctic Ocean (Karcher et al., 2012).
gin and is usually found between 400 and 700 m water depth.
Its salinity is 34.5–35. Intermediate waters down to 1500 m,
Ocean Sci., 16, 221–234, 2020 www.ocean-sci.net/16/221/2020/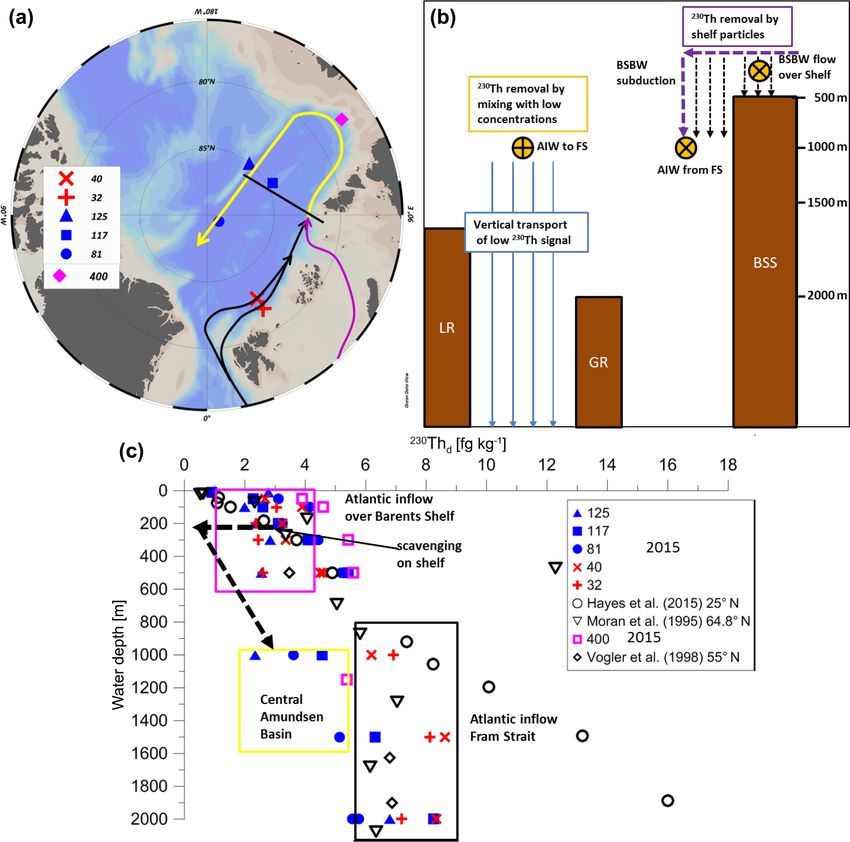
O. Valk et al.: Decrease of dissolved 230 Th in the Amundsen Basin                                                            223

1.2   Particle fluxes, shelf input and biological                 water column (e.g. Rutgers van der Loeff and Berger, 1993;
      productivity                                                Moran et al., 1995; Roy-Barman, 2009).
                                                                    232 Th (t                  10
                                                                             1/2 = 1.405 × 10 years) is known as a tracer for
Biological productivity in the central Arctic Ocean and re-       shelf- or continentally derived signatures (Hsieh et al., 2011),
lated particle fluxes are lower than in other oceans due to       while 234 Th (t1/2 = 24.1 d) serves as a tracer for particle flux
the perennial sea ice cover (Clark and Hanson, 1983). This        (Moran and Smith, 2000).
is expected to change in the future when light limitation is
relieved by sea ice retreat (Pabi et al., 2008). Arctic sea ice   230 Th   in the Arctic Ocean
extent is declining (Serreze et al., 2016) and ice is becom-
ing thinner (Serreze and Stroeve, 2015). Biological produc-
tivity may increase and begin earlier in the year, at least in    Several studies have addressed the regional distribution of
the Pacific part of the Arctic, depending on nutrient sup-        dissolved 230 Th in the Arctic Ocean in relation to particle
ply (Hill et al., 2017). Recent studies show that productiv-      fluxes and water mass residence time over the past decades.
ity is still low in the central Arctic Ocean, limited by both     Yet several key points to understand the removal processes
light and nutrient availability (Arrigo and van Dijken, 2015).    of dissolved 230 Th are not entirely understood and the sen-
Highest net community production (NCP) is found at the ice        sitivity of dissolved 230 Th to environmental changes is still
edge of the Nansen Basin and over the shelves, while the          not explained sufficiently. Bacon et al. (1989) hypothesized
Amundsen Basin shows the lowest NCP (Ulfsbo et al., 2014).        that the scavenging of reactive elements in the central Arc-
Apart from the possible effect on NCP, the declining sea ice      tic Ocean was significantly lower than in other parts of the
cover will also enhance ice-derived particle fluxes (Arrigo       world to explain the high 230 Th concentrations observed at
et al., 2008; Boetius et al., 2013). The Arctic Ocean has the     the Alpha Ridge and the northern Makarov Basin (Bacon et
largest relative proportion of shelves of all the World Ocean:    al., 1989). Edmonds et al. (1998), later confirmed by Trimble
approximately 50 % of area in total (Jakobsson, 2002). Shelf      et al. (2004), showed that 230 Th activities in the deep south-
sediments and large volumes of riverine input add trace met-      ern Canada Basin were much lower, and residence times cor-
als and carbon among other terrestrial components to Arc-         respondingly shorter, than observed by Bacon et al. (1989) at
tic shelf areas, some of which are transported to the central     the Alpha Ridge.
Arctic by the Transpolar Drift (TPD) (Wheeler et al., 1997;          Cochran et al. (1995) calculated residence times of dis-
Rutgers van der Loeff et al., 2018, 1995). On the basis of an     solved 230 Th of 18–19 years in the central Nansen Basin and
increase in 228 Ra supply to the interior Arctic Ocean, Kipp      10–12 years on the Barents Sea slope. 230 Th concentrations
et al. (2018) suggested that the supply of shelf-derived ma-      in the Nansen Basin were found to be lower than those from
terials is increasing, with a following change in trace metal,    the Alpha Ridge reported by Bacon et al. (1989), and deep
nutrient and carbon balances. Thawing permafrost and sub-         water in the central Nansen Basin had lower particulate and
sequent increasing coastal erosion (Günther et al., 2013) may     higher dissolved 230 Th concentrations than near the slopes
increase terrestrial input to the central Arctic Ocean (Schuur    (Cochran et al., 1995). Scholten et al. (1995) found that the
et al., 2013, 2015).                                              shallower EBDW is influenced by ventilation, in contrast to
                                                                  the deeper Eurasian Basin Bottom Water (EBBW) and sug-
                                                                  gested resuspension as the cause for the increased scavenging
1.3   Th as a tracer of water circulation and particle            rates in the EBBW. Valk et al. (2018a) showed that the deep
      fluxes                                                      Nansen Basin is influenced by volcanic and hydrothermal in-
                                                                  puts that lead to scavenging removal of 230 Th over several
Thorium isotopes have been extensively used to study and          years, at least episodically.
model physical oceanographic processes, such as advection,           Sedimentary 231 Paxs /230 Thxs from the Canada Basin pro-
water mass mixing and particle flux (Bacon and Ander-             vided new insights into the relevance of scavenging removal
son, 1982; Rutgers van der Loeff and Berger, 1993; Roy-           and the horizontal redistribution of these tracers as well as the
Barman, 2009; Rempfer et al., 2017). In seawater, 230 Th          fractionation between the low-productivity, sea-ice-covered
(t1/2 = 75 380 years) is produced by the radioactive decay        interior basins and the seasonally high particle flux areas
of dissolved 234 U. Without lateral transport by currents, the    at the margins. Low surface sediment 231 Paxs /230 Thxs ra-
vertical distribution of 230 Th in the water column is con-       tios were interpreted as a result of chemical fractionation of
trolled by reversible exchange with sinking particles and in-     230 Th and 231 Pa in the water column, resulting in preferred

creases with depth (Bacon and Anderson, 1982; Nozaki et           231 Pa export out of the Arctic. Almost all of the 230 Th pro-

al., 1981). Deviations from a linear increase with a depth        duced in situ (ca. 90 %) was estimated to be removed within
profile of 230 Th (Bacon and Anderson, 1982) suggest that         the Arctic by scavenging onto particles (Moran et al., 2005),
oceanic currents transport 230 Th away from the production        while Hoffmann et al. (2013) suggested that the deep waters
area or that ventilation, upwelling or depth-dependent scav-      of the Arctic are exchanged through Fram Strait on centen-
enging processes play a role in the 230 Th distribution in the    nial timescales.

www.ocean-sci.net/16/221/2020/                                                                   Ocean Sci., 16, 221–234, 2020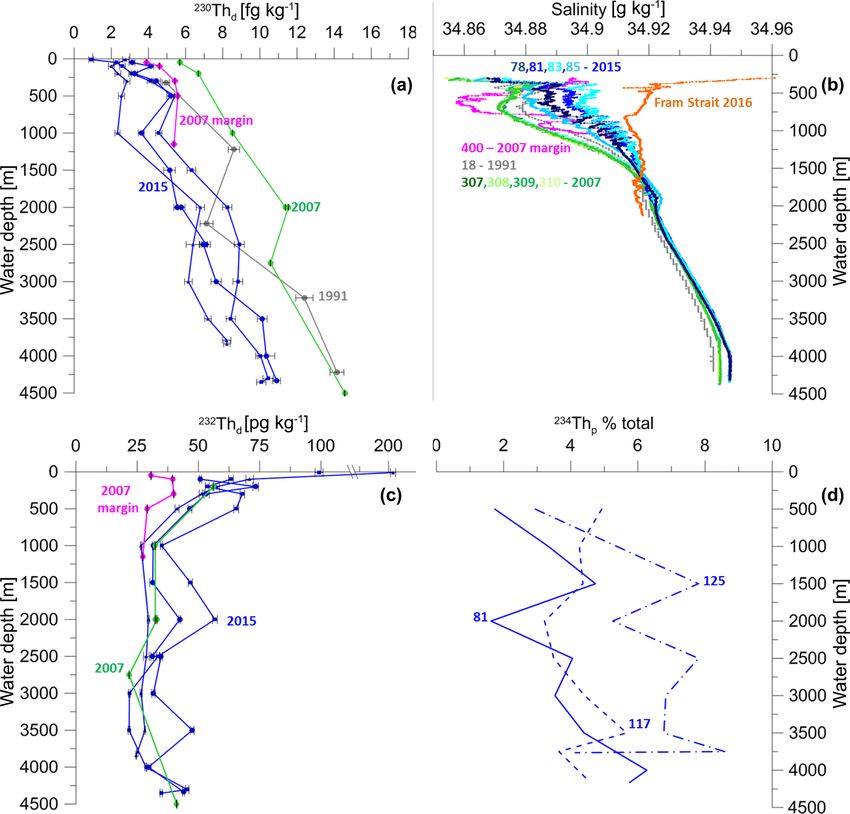
224                                                        O. Valk et al.: Decrease of dissolved 230 Th in the Amundsen Basin

   Roy-Barman (2009) presented a boundary scavenging pro-             Preconcentration and analysis of 230 Th and 232 Th were
file model, showing that linear 230 Th concentration profiles      performed following GEOTRACES methods in clean labo-
do not necessarily imply that circulation is negligible. They      ratories of the Alfred Wegener Institute (AWI) (Anderson et
suggested that the difference between the Arctic and other         al., 2012).
oceans is a considerable lateral transport of 230 Th from the         Samples were spiked with 229 Th and 236 U, calibrated
interior to the margins.                                           against the reference standard material UREM11, a mate-
                                                                   rial in radioactive equilibrium (Hansen and Ring, 1983),
1.4    Motivation                                                  followed by the addition of a purified Fe carrier solution
                                                                   (FeCl3 ). The next day, the pH of the samples was raised to
Global warming is triggering profound changes in the ocean,        8.5 by adding double-distilled NH4 OH to induce Fe(OH)3
and the Arctic Ocean is especially vulnerable to such envi-        precipitation. After 72 h, when the Fe(OH)3 had settled to
ronmental forcing. Summer ice cover is rapidly declining,          the bottom of the Cubitainer® , the precipitate was trans-
while the supply of terrestrial material (Günther et al., 2013)    ferred from the Cubitainer® containers to acid-cleaned 1 L
and particle flux (Boetius et al., 2013) increases and ocean       Teflon® bottles, after syphoning off the supernatant water.
circulation is changing (Karcher et al., 2012). These develop-     After the dissolution of the sample in concentrated HCl, the
ments are expected to leave an imprint on the distribution of      pH was raised again to 8.5 to allow the Fe(OH)3 precipitate
particle-reactive radionuclides, such as Th isotopes. A cen-       and settle. The supernatant water was syphoned off and the
tral motivation for this GEOTRACES study is to use the Th          precipitate was transferred into acid-cleaned 50 mL Falcon®
isotopes to depict changes in circulation and particle fluxes in   tubes the following day. The samples were then washed by
the Arctic Ocean from 1991 to 2015. The basis of this study        centrifugation four times at 4000 rpm for 12 min, where the
is a time series consisting of natural radionuclide data from      supernatant was decanted before the addition of new ultra-
various previous studies, combined with new data from 2007         pure Milli-Q® water. Finally, the precipitation was dissolved
and 2015.                                                          in concentrated HCl and evaporated to a drop (> 10 µL) in
                                                                   an acid-cleaned 15 mL Savillex® beaker. After evaporation,
                                                                   the fractions of Pa, Th, U and Nd were separated using
2     Methods
                                                                   chromatographic columns filled with anion exchange resin
2.1    Sampling and analysis of Th in samples collected in         (AG1X8, 100–200 mesh) according to GEOTRACES meth-
       2007                                                        ods (Anderson et al., 2012). All fractions were collected in
                                                                   acid-cleaned 15 mL Savillex® beakers, and columns were
Sea water samples were filtered directly from the 24 L CTD         washed and conditioned before the samples were loaded onto
(conductivity–temperature–depth) Niskin® bottles into acid-        the columns using concentrated HCl and HNO3 .
cleaned Cubitainer® containers (low-density polyethylene              Procedural blanks for 230 Th and 232 Th were run with each
(LDPE)) using 0.45 µm pore size Acropaks® . Samples were           batch of 10–15 samples. Average 230 Th and 232 Th blank cor-
collected in volumes of 1, 2 and 10 L and acidified with con-      rections are 0.24 fg kg−1 and 0.003 pmol L−1 , respectively.
centrated ultraclean HNO3 . Samples for the analysis of to-        At station 81, a sample (2000 m) was divided into two sam-
tal 230 Th were taken without filtration. Analyses were per-       ples and resulted in different dissolved 232 Th concentrations,
formed at the University of Minnesota, Minneapolis, follow-        probably due to Th attached to the walls of the original cu-
ing methods from Shen et al. (2003). Measurements were             bitainer. Here, an average value considering the volumes of
done using inductively coupled plasma mass spectrometry            both parts of the divided samples was calculated.
(ICP-MS; Thermo Finnigan, Neptune) equipped with a sec-
ondary electron multiplier (SEM) and a retarding potential         2.3   Sampling and analysis of particulate 234 Th samples
quadrupole (RPQ) energy filter.                                          collected in 2015
2.2    Sampling and analysis of dissolved Th samples
       collected in 2015                                           Particulate samples were taken using in situ pumps (McLane
                                                                   and Challenger Oceanic). In total, 268 to 860 L seawater
Samples were filtered directly from the 24 L CTD Niskin®           were pumped through a 142 mm diameter, 0.45 µm pore size
bottles into Cubitainer® containers (LDPE) through 0.45 µm         Supor® (polyether sulfone) filter (Anderson et al., 2012). Fil-
pore size Acropaks® in volumes of 10 L (> 2000 m) and              ters were cut aboard for subsamples under a laminar flow
20 L (< 2000 m), according to the expected concentrations          hood using tweezers and scalpels. Subsamples (23 mm di-
(Nozaki et al., 1981). Acropaks® were used for half of the         ameter) were dried, put on plastic mounts, covered with My-
cruise and then replaced by new ones. Subsequently water           lar and aluminium foil, and directly measured by beta decay
samples were acidified to a pH of 1.5–2 by the addition            counting of 234 Th for at least 12 h. Six months later, back-
of 1 mL acid L−1 (seawater) of concentrated double-distilled       ground measurements were performed at the AWI in Bre-
HNO3 .                                                             merhaven.

Ocean Sci., 16, 221–234, 2020                                                                  www.ocean-sci.net/16/221/2020/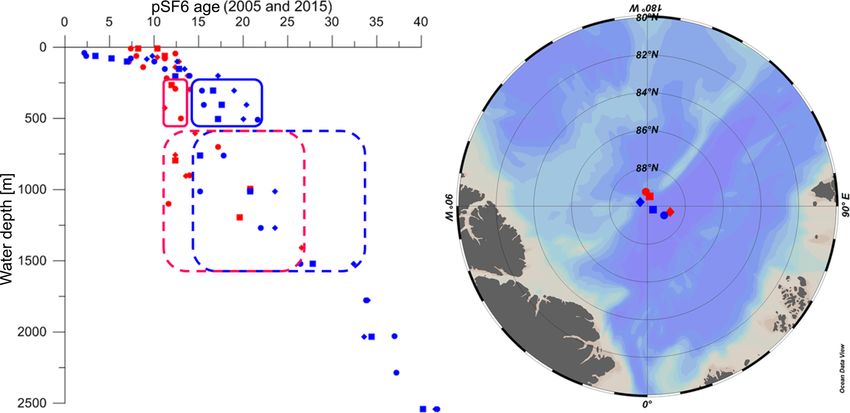
O. Valk et al.: Decrease of dissolved 230 Th in the Amundsen Basin                                                                                         225

Table 1. Parameters of the profile model adapted from Rutgers van                              3.1    Dissolved 230 Th in 1991, 2007 and 2015
der Loeff et al. (2018), representing transient 230 Th in the Amund-
sen Basin.                                                                                     Data obtained in 1991 by Scholten et al. (1995) consti-
                                                                                               tute the baseline for the time series presented in this study
    Parameter                                             Symbol         Value       Unit
                                                                                               (Fig. 2a). Dissolved 230 Th activities increased with depth in
    Vertical eddy diffusion coefficient                   Kz              4100       m2 yr−1   the Amundsen Basin in 1991, 2007 and 2015.
    Exchange time 0–1500 m with Kara Sea                                                          Station 400 (2007), located at the south-eastern margin of
       initial                                            tK                 ∞       years     the Eurasian Basin, showed lower concentrations than the
       during ventilation                                 tK                  4      years     open-ocean stations.
    230 Th Kara Sea                                       230 Th               0     fg L−1
                                                                   K
                                                                                               3.2    Dissolved 232 Th in 2007 and 2015
    Cp /Cd 230 Th∗                                        K230              0.5      –
    Cp /Cd 234 Th∗                                        K234             0.12      –         The concentrations of dissolved 232 Th from 2007 and 2015
    Adsorption rate constant                              k1               1.59      yr−1      were similar. In 2015, dissolved 232 Th concentrations ob-
                                                                                               served in the Amundsen Basin showed a decreasing trend
    Desorption rate constant                              k−1              3.18      yr−1
                                                                                               with depth. Surface concentrations were relatively high at
    Particle settling rate∗                               S                582       m yr−1    station 117 (100 pg kg−1 ) and 125 (> 200 pg kg−1 ). At sta-
∗ Valk et al. (2018a). C : particulate concentration; C : dissolved concentration.
                        p                              d
                                                                                               tion 81, dissolved 232 Th showed a relatively constant depth
                                                                                               distribution, where surface 232 Th concentrations were lower
                                                                                               compared to station 117 and 125. At stations 125 and 117
2.4      Model                                                                                 dissolved 232 Th also decreased slightly with depth, with sta-
                                                                                               tion 117 showing a mid-depth maximum at 2000 m (Fig. 2c).
The model of Rutgers van der Loeff et al. (2018) was used                                      Values from 2007 (station 309) decreased with depth until
to analyse the downward propagation of a ventilation sig-                                      2500 m and then slightly increased towards 4500 m. Close to
nal in the Atlantic layer by settling particles and radioactive                                the shelf (at station 400) concentrations were lower than in
ingrowth. The 230 Th model is based on the reversible ex-                                      the open basin in 2007.
change model of Bacon and Anderson (1982) and Nozaki et
al. (1981) and solved with the programming language R. We                                      3.3    Particulate 234 Th from 2015
first let the 230 Th model run with the base parameters as given
for the Amundsen Basin in Table 1 of Rutgers van der Loeff                                     Particulate 234 Th from 2015 is shown as the relative amount
et al. (2018), but without exchange with the Kara Sea, until                                   of particulate 234 Th (Fig. 2d) compared to total 234 Th, cal-
dissolved 230 Th reaches a linear steady-state profile. We then                                culated from 238 U activities, assuming equilibrium of total
                                                                                               234 Th with 238 U in deep water (Owens et al., 2011). All
simulate a hypothetical strong ventilation of the intermediate
water with 230 Th-depleted shelf water by introducing an ex-                                   profiles show rather low concentrations of particulate 234 Th
change process down to 1500 m with a 230 Th-free water mass                                    in the Amundsen Basin. Especially below 2000 m partic-
on a timescale of 4 years, which causes a rapid reduction in                                   ulate 234 Th is much higher in the Nansen Basin (Valk et
230 Th in this upper layer. The 230 Th profile is determined                                   al., 2018a).
over the full water column over time since the beginning of
this ventilation. Parameter values used in the simulation are
listed in Table 1.                                                                             4     Discussion

                                                                                               4.1    Temporal evolution of dissolved 230 Th in the
3     Results                                                                                         Amundsen Basin
230 Th  results are expressed as unsupported excess 230 Th                                     Figure 2a shows 230 Th concentrations from 2015 and the
(230 Thxs ); for simplification, hereinafter
                                             230 Th refers to
                                                                                               temporal development since 1991.
230 Th . Excess corrections were done following Hayes et
      xs                                                                                          Temporal changes have been manifest over the entire wa-
al. (2015). 230 Th concentrations are corrected for a pro-                                     ter column since 2007. With one exception, the 2015 concen-
portion of 230 Th released by the dissolution of lithogenic                                    tration range is below 2007 and 1991 (Scholten et al., 1995).
particles. This is based on parallel measurements of                                           This difference is larger than the concentration range for the
232 Th, considering a lithogenic ratio 230 Th/232 Th = 4.0 ×
                                                                                               three 2015 profiles (Fig. 2a). The three stations from 2015
10−6 mol mol−1 (Roy-Barman et al., 2009).                                                      (81, 117 and 125) are distributed over a wide area of the
                                                                                               Amundsen Basin (Fig. 1). Because all stations show lower
                                                                                               concentrations in 2015, this points to a temporal rather than a
                                                                                               regional variability over the entire basin. The decrease in dis-
                                                                                               solved 230 Th in the Amundsen Basin started after 2007, con-

www.ocean-sci.net/16/221/2020/                                                                                               Ocean Sci., 16, 221–234, 2020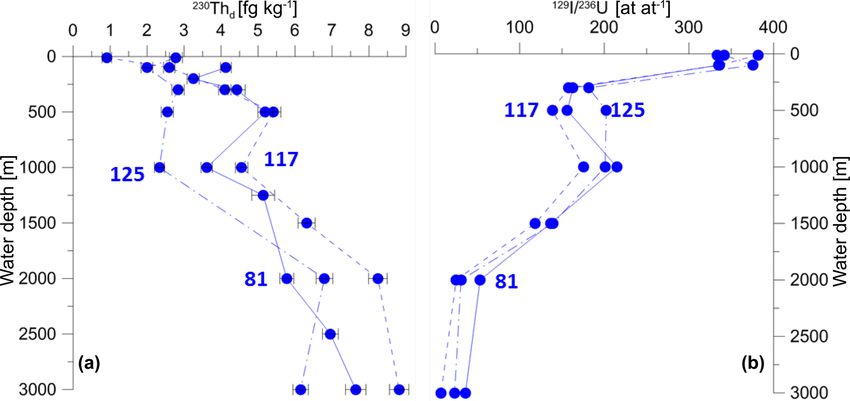
226                                                          O. Valk et al.: Decrease of dissolved 230 Th in the Amundsen Basin

Figure 2. (a) Amundsen Basin dissolved 230 Th from 2015 in blue (81: dots; 117: squares; 125: triangles; same as symbols in Fig. 2a and c),
2007 in green (309), 2007 margin in pink and 1991 in grey (173). (b) Amundsen Basin salinity profiles from 2015 (Rabe et al., 2016), 2007
(Schauer and Wisotzki, 2010) and 1991 (Rudels, 2010) and Fram Strait from 2016 (Kanzow et al., 2017). (c) Dissolved 232 Th from 2015
(81 = dashed, 117 = dashed dotted, 125 = solid), 2007 (309 = green), and 2007 margin (400 = pink) and (d) particulate 234 Th from 2015 in
percent of total 234 Th (81: dashed; 117: dashed–dotted; 125: solid).

sidering the similar concentrations in 1991 and 2007. Dis-              4.2   Scavenging in the central Amundsen Basin
solved 230 Th decreased by 0.32 fg kg−1 yr−1 at 300–500 m
water depth and by 0.52 fg−1 kg−1 yr−1 at 1000–1500 m.                  Biological production in the central Arctic Ocean in 2011
230 Th is known to respond to particle fluxes as well as ocean          was not higher than in 2007 (Ulfsbo et al., 2014). There-
circulation (Anderson et al., 1983b, a). A reduction in dis-            fore, enhanced biological production in the Amundsen Basin
solved 230 Th concentrations can therefore be caused by ei-             and subsequent sinking particles can be excluded as a rea-
ther increased scavenging (Anderson et al., 1983b) or by                son for the changing Th distributions. Enhanced scavenging
changing circulation (Anderson et al., 1983a).                          by lithogenic material at these stations can also be excluded
                                                                        because for all three stations from 2015, dissolved 232 Th val-

Ocean Sci., 16, 221–234, 2020                                                                        www.ocean-sci.net/16/221/2020/
O. Valk et al.: Decrease of dissolved 230 Th in the Amundsen Basin 227
ues at 1000 m are in the same range or lower than observed
in 2007 (Fig. 2c). Low dissolved 232 Th is taken here as an in-
dicator of low amounts of lithogenic material. Enhanced par-
ticle loads would result in high concentrations of particulate
234 Th, as observed in the deep Nansen Basin where partic-
ulate 234 Th ranges between 3.3 % and 9.1 % of total 234 Th
(Valk et al., 2018a). In the Amundsen Basin only station 125
(2015), located at the slope of the Lomonosov Ridge, shows
relatively high values of particulate 234 Th in the deep wa-
ter from 1500 m downward (Fig. 2d). This feature could be
explained by the resuspension of slope sediments along the
Figure 3. (a) Dissolved 230 Th and (b) 129 I/236 U (Casacuberta et
Lomonosov Ridge, as no increased scavenging was observed al., 2018) for three stations in the Amundsen Basin, 2015.
in the deep Amundsen Basin (Slagter et al., 2017). Slagter et
al. (2017) argue that similar riverine surface influence of hu-
mic substances in the Amundsen Basin and in the Makarov
Basin did not lead to increased scavenging at depth in the 129 I/236 Uratio (Rutgers van der Loeff et al., 2018). While
Amundsen Basin, even at stations influenced by the TPD anthropogenic radionuclides (Fig. 3) imply exchange with
(e.g. station 125) (Slagter et al., 2017; Rutgers van der Lo- young shelf waters of Atlantic influence, it is unclear to
eff et al., 2018). This is in contrast to the Makarov Basin, what extent the change in 230 Th may be caused by exchange
where Slagter et al. (2017) observed a slight increase in dis- with the Makarov Basin. Tanhua et al. (2009) found no-
solved Fe-binding organic ligand concentrations and reduced table changes in CFC tracer ages at the North Pole, indi-
dissolved Fe concentrations that may point to more intense cating older waters in 1994 compared to 1991 and 2005 at
scavenging or lower Fe inputs (Slagter et al., 2017; Klunder 400 m; a change that was also documented in silicate con-
et al., 2012), while the high 232 Th observed at the surface of centrations (Tanhua et al., 2009). This feature probably re-
station 125 points to a notable continental component, a sig- flected a shift in the front of Eurasian and Canada Basin wa-
nal that is not observed below (Fig. 2c). Hence, our observa- ter around the year 1994, with Canadian Basin water pene-
tions are consistent with Slagter et al. (2017). To summarize, trating deeper into the central Amundsen Basin (Tanhua et
dissolved 232 Th generally did not increase since 2007, except al., 2009). Unfortunately, there are no 230 Th data from this
for station 117 at 2000 m and station 81 at 3500 m. Recent phase of penetration of Canada Basin water around 1994. If
studies about Ra isotopes, Fe-binding ligands, NCP estimates the 230 Th data from 1991 are connected to CFC data from
and the particulate data (234 Th, 232 Th) do not point to en- the same year, while the 230 Th data from 2007 are con-
hanced particle fluxes in the central Amundsen Basin. There- nected to CFC data of 2005 (Tanhua et al., 2009), they are
fore, and putting all these different parameters together, it can both representative of periods of low intrusion of Canada
be concluded that scavenging of 230 Th within the Amundsen Basin water over the Lomonosov Ridge. The renewed in-
Basin is unlikely to be the primary factor for the observed trusion of Canada Basin water in 2015 can be excluded as
reduction between 2007 and 2015 in the Amundsen Basin. mechanism for the observed change in 230 Th because this
would increase rather than decrease dissolved 230 Th con-
4.3 At 500–1500 m: intermediate water mass changes centrations in the Amundsen Basin (Scholten et al., 1995;
Edmonds et al., 2004; this study). Moreover, the intrusion
The decrease in dissolved 230 Th at depths between 500 and of Canada Basin water would not match the ventilation age
1500 m for stations 81, 117 and 125 in the Amundsen Basin estimated by Rutgers van der Loeff et al. (2018), since the
(2015) is most prominent at 1000 m, where concentrations Canada Basin water is known to be much older than Amund-
decreased to half of the value in 2007 (Fig. 2a). This depth sen Basin water at this depth (Tanhua et al., 2009). Hence,
range in the Amundsen Basin is ventilated on considerably it is suggested that the changes in the Amundsen Basin can-
shorter timescales than in the Nansen and Makarov basins by not be explained by interaction with the Makarov Basin. On
a westward boundary circulation (Tanhua et al., 2009). the contrary, salinity distributions imply that the influence of
The drop in dissolved 230 Th at 1000 m corresponds to an Atlantic waters in the Amundsen Basin had increased at 500–
increase in the 129 I/236 U ratio (Fig. 3), implying a higher At- 1500 m by 2015, indicating that water masses changed after
lantic influence of younger waters (Casacuberta et al., 2018), 2007 (Fig. 2b). Figure 2b shows salinity profiles for three
which in turn is in agreement with an increase in the circu- stations from the Amundsen Basin from 2007 (Schauer and
lation or ventilation rate between 750 and 1500 m. For sta- Wisotzki, 2010), three from 2015 (Rabe et al., 2016), and one
tion 81, in the central Amundsen Basin, Rutgers van der Lo- from 1991 (Rudels, 2010). In 2015, the intermediate waters
eff et al. (2018) estimated a ventilation age based on SF6 of the Amundsen Basin had a stronger Atlantic contribution
data of 15–18 years at 1000 m. This estimate fits timescales (Polyakov et al., 2017; Rabe et al., 2016). This change is cor-
based on 228 Ra data and is supported independently by the related with the decrease in dissolved 230 Th.
www.ocean-sci.net/16/221/2020/ Ocean Sci., 16, 221–234, 2020228 O. Valk et al.: Decrease of dissolved 230 Th in the Amundsen Basin
Figure 4. Comparison of pCFC and pSF6 (partial pressures of CFC and SF6, respectively) ages from 2005 (red) and 2015 (blue) in the
Amundsen Basin at stations located in the return flow along the Lomonosov Ridge, distinguishing the depth ranges of FSBW (solid box)
and BSBW (dashed box). Locations of 2015 stations are marked in the map as blue symbols (81: dots; 85: squares; 89: diamonds) and 2005
stations in red (41: dots; 42: squares; 46: diamonds). Copyright: Schlitzer, R., Ocean Data View, odv.awi.de (2018).
Anthropogenic tracers can help determine whether the in- at 1000 m in the Amundsen Basin in 2015 (5 fg kg−1 ). That
creased Atlantic water contribution had resulted in increased means that these waters have lost 230 Th during their tran-
ventilation rates of the intermediate waters in the Amundsen sit to the central Amundsen Basin, through the productive
Basin. A comparison of CFC and SF6 ages between 2005 North Atlantic and Fram Strait (FSBW) and over the Bar-
and 2015 (Fig. 4) shows that both the FSBW (approx. 425 m) ents Sea shelf (BSBW). These pathways are influenced by
and the BSBW (approx. 1025 m) ventilation age did not de- an increased input of terrestrial matter (Günther et al., 2013)
crease after 2005. The SF6 age for the Atlantic Water (BSBW and/or increased primary production at the shelf and the ice
around 1000 m) at the northern end of the section in Fig. 4 edge compared to previous years (Arrigo and van Dijken,
is 12–15 years in 2005 and 15–18 years in 2015, suggest- 2015; Ulfsbo et al., 2018). Relatively high concentrations of
ing perhaps a slowdown of the transport of Atlantic Water Fe at the margin indicate the possibility of enhanced scav-
in the boundary current. That would indicate that a change enging by iron oxides (Rijkenberg et al., 2018).
in scavenging along the flow path of the Atlantic water must At station 400, located at the south-eastern margin of
be responsible for the observed decrease in dissolved 230 Th the Eurasian Basin, the deepest water is in the influence of
rather than a change in ventilation. BSBW, downstream of the Barents and Kara Sea shelf and
slope. At the largest depth of ∼ 1200 m, the 230 Th concen-
4.4 230 Thremoval process in intermediate waters on tration is low and similar to concentrations in the central
circulation pathways Amundsen Basin in 2015. This is consistent with the hypoth-
esis that Atlantic waters that were depleted in 230 Th on the
shelf contribute to the decrease in dissolved 230 Th in the cen-
In order to judge the scavenging intensity it is useful to
tral Amundsen Basin. Such a relic of the scavenging signal
compare dissolved 230 Th concentrations at various loca-
implies that scavenging occurs on pathways of inflow waters
tions along the flow paths of the Atlantic waters. Arctic
along the shelves rather than locally within the central basin.
Intermediate Water (AIW) is comprised of water from the
The high surface values of dissolved 230 Th at station 400 are
Greenland Sea and the Nordic Seas via the West Spitsber-
in line with low export production at this station compared to
gen Current (WSC) (Rudels, 2009). In the north-east At-
shallower stations over the shelf (Cai et al., 2010).
lantic at 25◦ N (GEOTRACES section GA03_W, station 20),
Hence, the observed reduction in dissolved 230 Th in the
dissolved 230 Th concentrations are 8.23 fg kg−1 at 1000 m
intermediate water of the Amundsen Basin is attributed to a
and 13.17 fg kg−1 at 1500 m (Hayes et al., 2015) (Fig. 5).
combination of scavenging and advection. Scavenging takes
At 55◦ N, dissolved 230 Th concentrations in 1995 were
place locally on the shelves and along the slopes of the Bar-
3.47 fg kg−1 at 500 m and 6.8 fg kg−1 at 1625 m (Vogler et
ents, Kara and Laptev seas, causing the removal of 230 Th ob-
al., 1998) (station L3). In the Norwegian Sea, dissolved
230 Th concentrations in 1993 were 5.81 fg kg−1 at 872 m served downstream in the central Amundsen Basin. Figure 5
shows pathways of intermediate waters and dissolved 230 Th
and 7.04 fg kg−1 at 1286 m (Moran et al., 1995) (station 13).
profiles from 2015, illustrating the mechanism controlling
These values are above the highest value of dissolved 230 Th
Ocean Sci., 16, 221–234, 2020 www.ocean-sci.net/16/221/2020/O. Valk et al.: Decrease of dissolved 230 Th in the Amundsen Basin 229 Figure 5. (a) Circulation pathways of Atlantic waters to the central Amundsen Basin. (b) Conceptual drawing of scavenging and mixing of water masses close to St. Anna Trough (black line in a represents the section of b). LR: Lomonosov Ridge; GR: Gakkel Ridge; BSS: Barents Sea shelf; FS: Fram Strait. (c) Development of dissolved 230 Th concentrations from the North Atlantic to the Amundsen Basin. Atlantic values (open symbols; Hayes et al., 2015; Vogler et al., 1998; Moran et al., 1995) are represented by a deep box flowing in through Fram Strait and a shallow box with lower activities flowing in over the Barents Shelf and exposed to additional scavenging on the shelf (horizontal black arrow) before it is subducted and mixed with deeper Atlantic inflow to form the observed reduced concentrations in the central Amundsen Basin. Stations 32 and 40 (red) are from Gdaniec et al. (2020). Copyright: Schlitzer, R., Ocean Data View, odv.awi.de (2018). the relatively low dissolved 230 Th concentrations observed et al., 1994). This is consistent with dissolved 230 Th con- in the central Amundsen Basin. Atlantic waters flowing over centrations observed at stations 81, 117 and 125 (2015), with the Barents and Kara shelves lose 230 Th by increased scav- station 125, located in the TPD and closest to the Lomonosov enging. 230 Th-depleted BSBW is subducted and gradually Ridge, showing the lowest concentrations. The low 230 Th mixes with deeper Atlantic inflow. The closer the stations concentrations at station 125 may also be affected by addi- are to the Lomonosov Ridge, the younger the ventilation age tional scavenging due to resuspension on the slope of the (Fig. 5) and the more the salinities are shifted towards At- Lomonosov Ridge. lantic values. Variability in temperature and salinity plots in- dicate that this branch interacts with ambient waters (Rudels www.ocean-sci.net/16/221/2020/ Ocean Sci., 16, 221–234, 2020
230                                                       O. Valk et al.: Decrease of dissolved 230 Th in the Amundsen Basin

4.5   Vertical transport of circulation-derived 230 Th
      scavenging signal and effects in deep waters

Intermediate waters in the central Amundsen Basin have a
lower dissolved 230 Th in the depth range up to 1500 m due
to increased scavenging during the transport of Atlantic wa-
ter over the shelves and along the slope. The time series data
also reveal changing conditions below the intermediate wa-
ters, indicated by a decrease in dissolved 230 Th in the deeper
water column (Fig. 2a).
   This raises the question as to whether a change, as ob-
served for 500–1500 m, might cause a decrease in concen-
trations in the water column below that depth within just
8 years. Theoretically, such a decreasing signal could be
manifested by sinking particles via reversible scavenging of
sinking particles. With particle settling rates of 582 m yr−1
(Rutgers van der Loeff et al., 2018), an average particle needs
approximately 6 years from the depth of strongest deple-          Figure 6. Modelled dissolved 230 Th distribution in the Amundsen
                                                                  Basin 0, 2, 4, 6, 8, 10, 15 and 20 years after the reduction in concen-
tion (1000 m) to reach the bottom of the water column. That
                                                                  tration in the upper layer (0–1500 m) by continuous exchange with
would match the timescale of the decrease in 230 Th observed      230 Th-free surface water. The model was modified after Rutgers van
between 2007 and 2015. The time for particle transport to         der Loeff et al. (2018).
depth is the limiting step because the timescale for particle
settling is longer than for adsorption and desorption of tho-
rium (Rutgers van der Loeff et al., 2018). On the basis of           Hydrothermal plumes released by volcanoes at the Gakkel
these parameters, Rutgers van der Loeff et al. (2018) cre-        Ridge could also decrease dissolved 230 Th efficiently and pe-
ated a model to illustrate the development of 228 Ra and 228 Th   riodically, as suggested by Valk et al. (2018a) for the deep
over time. This model is modified here to simulate how the        Nansen Basin. However, these plumes probably do not af-
full water column profile of dissolved 230 Th in the Amund-       fect the Amundsen Basin as much as the Nansen Basin due
sen Basin reacts to a sudden change in circulation transport      to recirculation in the Nansen Basin that retains most of
of water with low 230 Th into the intermediate depth layer        the hydrothermal-plume-affected waters in the Nansen Basin
(Table 1). The model should be seen as a description of the       (Valk et al., 2018a). Additionally, the depths where the ma-
downward penetration of the removal signal rather than as         jor changes occurred in the Amundsen Basin are too shal-
a precise retracing of profiles from the central Amundsen         low (the hydrothermal scavenging starts below 2000 m) and
Basin. The exchange process used to introduce the ventilated      the deep-water decrease in dissolved 230 Th in the Amundsen
water mass is not meant to reproduce the actual ventilation       Basin since 2007 is much weaker than in the Nansen Basin
with water from the Kara or Barents seas, but it merely serves    (Valk et al., 2018a).
the purpose of creating a rapid reduction in 230 Th in the up-
per 1500 m in order to model the downward propagation of
such a signal by reversible scavenging. The model results in      5   Conclusion
Fig. 6 show how fast a decrease in 230 Th in the ventilated
layer (500–1500 m) is propagated into the deep water. Un-         Concentrations of dissolved 230 Th throughout the entire wa-
certainties in the model assumptions, such as particle sink-      ter column in the Amundsen Basin decreased since 2007.
ing speed and exchange between dissolved and particulate          There is no indication of increased scavenging removal of
phases, might cause the difference between model and data.        230 Th due to increased particle flux within the Amundsen

This may also explain why the downward penetration of the         Basin. An increase in salinity of intermediate water (at 500–
ventilation signal is slower in the model, where it has not       1500 m) points to the influence of Atlantic-derived waters,
yet reached the seafloor after 8 years (Fig. 6), than in the      although SF6 data suggest that the ventilation of this layer
observed data. But the model results underpin the notion of       has not increased. The reduction in dissolved 230 Th concen-
a dissolved 230 Th decrease due to circulation and scaveng-       tration in the Amundsen Basin intermediate waters is there-
ing along the circulation pathways and account for the reduc-     fore attributed to increased scavenging from source waters
tion in dissolved 230 Th below the circulation influence. This    and the transport of this relict scavenging signature by ad-
temporal change can therefore be explained by a significant       vection. Thus, these downstream waters reflect a scaveng-
reduction in the input of low-230 Th waters from shallower        ing history over the Siberian shelves and slope that results in
depths, even if the scavenging rate in the deep basin remains     a reduction in 230 Th relative to Atlantic source waters and,
constant.                                                         in turn, reduced dissolved 230 Th in the central Amundsen

Ocean Sci., 16, 221–234, 2020                                                                    www.ocean-sci.net/16/221/2020/
O. Valk et al.: Decrease of dissolved 230 Th in the Amundsen Basin 231
Basin. The low-230 Th signal is propagated to deeper central References
Arctic Ocean waters by reversible scavenging. These find-
ings highlight the close interaction of horizontal transport by Aagaard, K., Coachman, L. K., and Carmack, E. C.: On the halo-
advection and particle scavenging removal, which combine cline of the Arctic Ocean, Deep-Sea Res., 28, 529–545, 1980.
Aagaard, K.: On the deep circulation in the Arctic Ocean,
to generate far-field distributions of reactive trace elements.
Deep-Sea Res., 28, 251–268, https://doi.org/10.1016/0198-
0149(81)90066-2, 1981.
Aksenov, Y., Ivanov, V. V., Nurser, A. J. G., Bacon, S.,
Data availability. Data are available at Polyakov, I. V., Coward, A. C., Naveira-Garabato, A.
https://doi.org/10.1594/PANGAEA.908068 (Valk et al., 2019) C., and Beszczynska-Moeller, A.: The Arctic Circumpo-
and at https://doi.org/10.1594/PANGAEA.893871 (Valk et lar Boundary Current, J. Geophys. Res., 116, C09017,
al., 2018b.). https://doi.org/10.1029/2010JC006637, 2011.
Anderson, R. F., Bacon, M. P., and Brewer, P. G.: Removal of 230 Th
and 231 Pa from the open ocean, Earth Planet. Sc. Lett., 62, 7–23,
Supplement. The supplement related to this article is available on- 1983a.
line at: https://doi.org/10.5194/os-16-221-2020-supplement. Anderson, R. F., Bacon, M. P., and Brewer, P. G.: Removal of 230 Th
and 231 Pa at ocean margins, Earth Planet. Sc. Lett., 66, 73–90,
1983b.
Author contributions. MMRvdL, OV and WG designed and Anderson, R. F., Fleisher, M. Q., Robinson, L., Edwards, R. L.,
planned the study. OV, MMRvdL, SG, KL, YL, RP, SBM and VP Hoff, J. A., Moran, S. B., Rutgers van der Loeff, M. M., Thomas,
conducted sampling at sea. RLE and YL analysed the 2007 samples, A. L., Roy-Barman, M., and Francois, R.: GEOTRACES inter-
and OV, VP and SG analysed the 2015 samples. NC provided I/U calibration of 230 Th, 232 Th, 231 Pa, and prospects for 10 Be, Lim-
data; WS provided and interpreted SF6 data. All authors contributed nol. Oceanogr.-Meth., 10, 179–213, 2012.
to writing the paper. Arrigo, K. R. and van Dijken, G. L.: Continued increases in Arc-
tic Ocean primary production, Prog. Oceanogr., 136, 60–70,
https://doi.org/10.1016/j.pocean.2015.05.002, 2015.
Competing interests. The authors declare that they have no conflict Arrigo, K. R., van Dijken, G., and Pabi, S.: Impact of a shrinking
of interest. Arctic ice cover on marine primary production, Geophys. Res.
Lett., 35, L19603, https://doi.org/10.1029/2008GL035028, 2008.
Bacon, M. P. and Anderson, R. F.: Distribution of Thorium Isotopes
Acknowledgements. We thank the captain and crew of RV Po- Between Dissolved and Particulate Forms in The Deep Sea, J.
larstern for their help during expeditions ARKXXIX/3 and Geophys. Res., 87, 2045–2056, 1982.
ARKXXII/2. We would like to thank Ronja Paffrath for help on Bacon, M. P., Huh, C.-A., and Moore, R. M.: Vertical profiles of
board. Ingrid Stimac is thanked for invaluable technical support and some natural radionuclides over the Alpha Ridge, Arctic Ocean,
help in the laboratory. This work was partially supported by a U.S. Earth Planet. Sc. Lett., 95, 15–22, 1989.
NSF grant (OCE, grant no. 143886) to Robert Lawrence Edwards. Björk, G., Jakobsson, M., Rudels, B., Swift, J. H., Anderson, L.,
Finally we thank the two anonymous reviewers for very thoughtful Darby, D. A., Backman, J., Coakley, B., Winsor, P., Polyak, L.,
and constructive comments, which helped to improve the paper. and Edwards, M.: Bathymetry and deep-water exchange across
the central Lomonosov Ridge at 88–89◦ N, Deep-Sea Res. Pt. I,
54, 1197–1208, https://doi.org/10.1016/j.dsr.2007.05.010, 2007.
Björk, G., Anderson, L. G., Jakobsson, M., Antony, D., Eriks-
Financial support. This research has been supported by the
son, B., Eriksson, P. B., Hell, B., Hjalmarsson, S., Janzen,
NSF (OCE, grant no. 143886) and the Swiss National Science
T., Jutterström, S., Linders, J., Löwemark, L., Marcussen, C.,
Foundation (AMBIZIONE, grant no. PZ00P2_154805).
Anders Olsson, K., Rudels, B., Sellén, E., and Sølvsten, M.:
Flow of Canadian basin deep water in the Western Eurasian
The article processing charges for this open-access
Basin of the Arctic Ocean, Deep-Sea Res. Pt. I, 57, 577–586,
publication were covered by a Research
https://doi.org/10.1016/j.dsr.2010.01.006, 2010.
Centre of the Helmholtz Association.
Boetius, A., Albrecht, S., Bakker, K., Bienhold, C., Felden, J.,
Fernández-Méndez, M., Hendricks, S., Katlein, C., Lalande, C.,
Krumpen, T., Nicolaus, M., Peeken, I., Rabe, B., Rogacheva, A.,
Review statement. This paper was edited by Matthew Hecht and Rybakova, E., Somavilla, R., and Wenzhöfer, F.: Export of Algal
reviewed by two anonymous referees. Biomass from the Melting Arctic Sea Ice, Science, 339, 1430–
1432, 2013.
Cai, P., Rutgers van der Loeff, M. M., Stimac, I., Nöthig, E.-
M., Lepore, K., and Moran, S. B.: Low export flux of partic-
ulate organic carbon in the central Arctic Ocean as revealed
by 234 Th:238 U disequilibrium, J. Geophys. Res., 115, C10037,
https://doi.org/10.1029/2009JC005595, 2010.
Casacuberta, N., Christl, M., Vockenhuber, C., Wefing, A.-M.,
Wacker, L., Masqué, P., Synal, H.-A., and Rutgers van der Lo-
www.ocean-sci.net/16/221/2020/ Ocean Sci., 16, 221–234, 2020232 O. Valk et al.: Decrease of dissolved 230 Th in the Amundsen Basin eff, M.: Tracing the Three Atlantic Branches Entering the Arctic Polar and Marine Research, Bremerhaven, PANGAEA, Ocean With 129 I and 236 U, J. Geophys. Res.-Oceans, 123, 6909– https://doi.org/10.1594/PANGAEA.871025, 2017. 6921, https://doi.org/10.1029/2018JC014168, 2018. Karcher, M., Smith, J. N., Kauker, F., Gerdes, R., and Smethie Jr., Clark, D. L. and Hanson, A.: Central Arctic Ocean Sediment Tex- W. M.: Recent changes in Arctic Ocean circulation revealed by ture: A Key to Ice Transport Mechanisms, in: Glacial-Marine iodine-129 observations and modeling, J. Geophys. Res., 117, Sedimentation, edited by: Molnia, B. F., Springer US, Boston, C08007, https://doi.org/10.1029/2011JC007513, 2012. MA, 301–330, 1983. Kipp, L. E., Charette, M. A., Moore, W. S., Henderson, P. B., Cochran, J. K., Hirschberg, D. J., Livingston, H. D., Buesseler, K. and Rigor, I. G.: Increased fluxes of shelf-derived materials O., and Key, R. M.: Natural and anthropogenic radionuclide dis- to the central Arctic Ocean, Science Advances, 4, eaao1302, tributions in the Nansen Basin, Artic Ocean: Scavenging rates https://doi.org/10.1126/sciadv.aao1302, 2018. and circulation timescales, Deep-Sea Res. Pt. II, 42, 1495–1517, Klunder, M. B., Laan, P., Middag, R., de Baar, H. J. W., 1995. and Bakker, K.: Dissolved iron in the Arctic Ocean: Im- Edmonds, H. N., Moran, S. B., Hoff, J. A., Smith, J. R., and Ed- portant role of hydrothermal sources, shelf input and wards, R. L.: Protactinium-231 and Thorium-230 Abundances scavenging removal, J. Geophys. Res., 117, C04014, and High Scavenging Rates in the Western Arctic Ocean, Sci- https://doi.org/10.1029/2011JC007135, 2012. ence, 280, 405–406, 1998. Middag, R., de Baar, H. J. W., Laan, P., and Bakker, K.: Dissolved Edmonds, H. N., Moran, S. B., Cheng, H., and Edwards, R. L.: aluminium and the silicon cycle in the Arctic Ocean, Mar. Chem., 230 Th and 231 Pa in the Arctic Ocean: implications for parti- 115, 176–195, https://doi.org/10.1016/j.marchem.2009.08.002, cle fluxes and basin-scale Th/Pa fractionation, Earth Planet. Sc. 2009. Lett., 227, 155–167, 2004. Moran, S. B. and Smith, J. N.: 234 Th as a tracer of scavenging and Gdaniec, S., Roy-Barman, M., Levier, M., Valk, O., van der Lo- particle export in the Beaufort Sea, Cont. Shelf Res., 20, 153– eff, M. R., Foliot, L., Dapoigny, A., Missiaen, L., Mörth, C.- 167, https://doi.org/10.1016/S0278-4343(99)00065-5, 2000. M., and Andersson, P. S.: 231 Pa and 230 Th in the Arctic Ocean: Moran, S. B., Hoff, J. A., Buesseler, K. O., and Edwards, R. L.: High Implications for boundary scavenging and 231 Pa–230 Th frac- precision 230 Th and 232 Th in the Norwegian Sea and Denmark tionation in the Eurasian Basin, Chem. Geol., 532, 119380, by thermal ionization mass spectrometry, Geophys. Res. Lett., https://doi.org/10.1016/j.chemgeo.2019.119380, 2020. 22, 2589–2592, https://doi.org/10.1029/95GL02652, 1995. Günther, F., Overduin, P. P., Sandakov, A. V., Grosse, G., and Grig- Moran, S. B., Shen, C.-C., Edwards, R. L., Edmonds, H. N., oriev, M. N.: Short- and long-term thermo-erosion of ice-rich Scholten, J. C., Smith, J. N., and Ku, T.-L.: 231 Pa and 230 Th permafrost coasts in the Laptev Sea region, Biogeosciences, 10, in surface sediments of the Arctic Ocean: Implications for 4297–4318, https://doi.org/10.5194/bg-10-4297-2013, 2013. 231 Pa/230 Th fractionation, boundary scavenging, and advective Hansen, R. G. and Ring, E. J.: The preparation and certification export, Earth Planet. Sc. Lett., 234, 235–248, 2005. of a uranium reference material, Council for Mineral Technol- Nozaki, Y., Horibe, Y., and Tsubota, H.: The water column distri- ogy, MINTEK (Analytical Chemistry Divison), Randburg, South butions of thorium isotopes in the western North Pacific, Earth Africa, Report, MINTEK-M–84, 12 pp., 1983. Planet. Sc. Lett., 54, 203–216, https://doi.org/10.1016/0012- Hayes, C. T., Anderson, R. F., Fleisher, M. Q., Vivancos, S. M., 821X(81)90004-2, 1981. Lam, P. J., Ohnemus, D. C., Huang, K.-F., Robinson, L., Lu, Y., Pabi, S., van Dijken, G. L., and Arrigo, K. R.: Primary production Cheng, H., Edwards, R. L., and Moran, S. B.: Intensity of Th in the Arctic Ocean, 1998–2006, J. Geophys. Res., 113, C08005, and Pa scavenging partitioned by particle chemistry in the North https://doi.org/10.1029/2007JC004578, 2008. Atlantic Ocean, Mar. Chem., 170, 49–60, 2015. Polyakov, I. V., Pnyushkov, A. V., Alkire, M. B., Ashik, I. M., Bau- Hill, V., Ardyna, M., Lee, S. H., and Varela, D. E.: Decadal mann, T. M., Carmack, E. C., Goszczko, I., Guthrie, J., Ivanov, V. trends in phytoplankton production in the Pacific Arctic Re- V., Kanzow, T., Krishfield, R., Kwok, R., Sundfjord, A., Morison, gion from 1950 to 2012, Deep-Sea Res. Pt. II, 152, 82–94, J., Rember, R., and Yulin, A.: Greater role for Atlantic inflows on https://doi.org/10.1016/j.dsr2.2016.12.015, 2017. sea-ice loss in the Eurasian Basin of the Arctic Ocean, Science, Hoffmann, S. S., McManus, J. F., Curry, W. B., and Brown-Leger, S. 356, 285–291, https://doi.org/10.1126/science.aai8204, 2017. L.: Persistent export of 231 Pa from the deep central Arctic Ocean Owens, S. A., Buesseler, K. O., and Sims, K. W. W.: Re-evaluating over the past 35,000 years, Nature, 497, 603–607, 2013. the 238 U-salinity relationship in seawater: Implications for the Hsieh, Y.-T., Henderson, G. M., and Thomas, A. L.: Combining sea- 238 U–234 Th disequilibrium method, Mar. Chem., 127, 31–39, water 232 Th and 230 Th concentrations to determine dust fluxes 2011. to the surface ocean, Earth Planet. Sc. Lett., 312, 280–290, 2011. Rabe, B., Karcher, M., Kauker, F., Schauer, U., Toole, J. M., Krish- Jakobsson, M.: Hypsometry and volume of the Arctic Ocean and its field, R. A., Pisarev, S., Kikuchi, T., and Su, J.: Arctic Ocean constituent seas, Geochem. Geophy. Geosy., 3, 1–18, 2002. basin liquid freshwater storage trend 1992–2012, Geophys. Jones, E. P., Rudels, B., and Anderson, L. G.: Deep waters of the Res. Lett., 41, 961–968, https://doi.org/10.1002/2013GL058121, Arctic Ocean: origins and circulation, Deep-Sea Res. Pt. I, 42, 2014. 737–760, 1995. Rabe, B., Schauer, U., Ober, S., Horn, M., Hoppmann, M., Ko- Kanzow, T., von Appen, W.-J., Schaffer, J., Köhn, E., Tsub- rhonen, M., Pisarev, S., Hampe, H., Villacieros, N., Savy, ouchi, T., Wilson, N., Wisotzki, A.: Physical oceanog- J. P., and Wisotzki, A.: Physical oceanography during PO- raphy measured with CTD/Large volume Watersampler- LARSTERN cruise PS94 (ARK-XXIX/3), Alfred Wegener Insti- system during POLARSTERN cruise PS100 (ARK- tute, Helmholtz Center for Polar and Marine Research, Bremer- XXX/2), Alfred Wegener Institute, Helmholtz Centre for Ocean Sci., 16, 221–234, 2020 www.ocean-sci.net/16/221/2020/
O. Valk et al.: Decrease of dissolved 230 Th in the Amundsen Basin                                                                          233

   haven, PANGAEA, https://doi.org/10.1594/PANGAEA.859558,               Scholten, J. C., Rutgers van der Loeff, M. M., and Michel, A.: Dis-
   2016.                                                                    tribution of 230 Th and 231 Pa in the water column in relation to
Rempfer, J., Stocker, T. F., Joos, F., Lippold, J., and Jac-                the ventilation of the deep Arctic basins, Deep-Sea Res. Pt. II,
   card, S. L.: New insights into cycling of 231 Pa and 230 Th              42, 1519–1531, 1995.
   in the Atlantic Ocean, Earth Planet. Sc. Lett., 468, 27–37,           Schuur, E. A. G., Abbott, B. W., Bowden, W. B., Brovkin, V.,
   https://doi.org/10.1016/j.epsl.2017.03.027, 2017.                        Camill, P., Canadell, J. G., Chanton, J. P., Chapin, F. S., Chris-
Rijkenberg, M. J. A., Slagter, H. A., Rutgers van der Loeff, M.,            tensen, T. R., Ciais, P., Crosby, B. T., Czimczik, C. I., Grosse, G.,
   van Ooijen, J., and Gerringa, L. J. A.: Dissolved Fe in the              Harden, J., Hayes, D. J., Hugelius, G., Jastrow, J. D., Jones, J.
   Deep and Upper Arctic Ocean With a Focus on Fe Limita-                   B., Kleinen, T., Koven, C. D., Krinner, G., Kuhry, P., Lawrence,
   tion in the Nansen Basin, Frontiers in Marine Science, 5, 88,            D. M., McGuire, A. D., Natali, S. M., O’Donnell, J. A., Ping,
   https://doi.org/10.3389/fmars.2018.00088, 2018.                          C. L., Riley, W. J., Rinke, A., Romanovsky, V. E., Sannel, A. B.
Roy-Barman, M.: Modelling the effect of boundary scavenging on              K., Schädel, C., Schaefer, K., Sky, J., Subin, Z. M., Tarnocai,
   Thorium and Protactinium profiles in the ocean, Biogeosciences,          C., Turetsky, M. R., Waldrop, M. P., Walter Anthony, K. M.,
   6, 3091–3107, https://doi.org/10.5194/bg-6-3091-2009, 2009.              Wickland, K. P., Wilson, C. J., and Zimov, S. A.: Expert assess-
Roy-Barman, M., Lemaître, C., Ayrault, S., Jeandel, C., Souhaut,            ment of vulnerability of permafrost carbon to climate change,
   M., and Miquel, J. C.: The influence of particle composition on          Climatic Change, 119, 359–374, https://doi.org/10.1007/s10584-
   Thorium scavenging in the Mediterranean Sea, Earth Planet. Sc.           013-0730-7, 2013.
   Lett., 286, 526–534, 2009.                                            Schuur, E. A. G., McGuire, A. D., Schädel, C., Grosse, G., Harden,
Rudels, B.: Arctic Ocean Circulation, in: Encyclopedia of Ocean             W. J., Hayes, D. J., Hugelius, G., Koven, C. D., Kuhry, P.,
   Sciences, 2nd edn., edited by: Steele, J. H., Academic Press, Ox-        Lawrence, D. M., Natali, S. M., Olefeldt, D., Romanovsky, V. E.,
   ford, 211–225, 2009.                                                     Schaefer, K., Turetsky, M. R., Treat, C. C., and Vonk, J. E.: Cli-
Rudels, B.: Physical oceanography during ODEN cruise OD91,                  mate change and the permafrost carbon feedback, Nature, 520,
   PANGAEA, https://doi.org/10.1594/PANGAEA.742746, 2010.                   171–179, 2015.
Rudels, B.: Arctic Ocean circulation and variability – advection and     Serreze, M. C. and Stroeve, J.: Arctic sea ice trends, variability and
   external forcing encounter constraints and local processes, Ocean        implications for seasonal ice forecasting, Philos. T. Roy. Soc. A,
   Sci., 8, 261–286, https://doi.org/10.5194/os-8-261-2012, 2012.           373, 20140159, https://doi.org/10.1098/rsta.2014.0159, 2015.
Rudels, B., Jones, E. P., Anderson, L. G., and Kattner, G.: On           Serreze, M. C., Stroeve, J., Barrett, A. P., and Boisvert, L. N.:
   the Intermediate Depth Waters of the Arctic Ocean, in: The Po-           Summer atmospheric circulation anomalies over the Arctic
   lar Oceans and Their Role in Shaping the Global Environment,             Ocean and their influences on September sea ice extent: A
   edited by: Johannessen, O. M., Muench, R. D., and Overland, J.           cautionary tale, J. Geophys. Res.-Atmos., 121, 11463–11485,
   E., AGU, 33–46, 1994.                                                    https://doi.org/10.1002/2016JD025161, 2016.
Rudels, B., Schauer, U., Björk, G., Korhonen, M., Pisarev, S., Rabe,     Shen, C.-C., Cheng, H., Edwards, R. L., Moran, S. B., Ed-
   B., and Wisotzki, A.: Observations of water masses and circu-            monds, H. N., Hoff, J. A., and Thomas, R. B.: Measure-
   lation with focus on the Eurasian Basin of the Arctic Ocean              ment of Attogram Quantities of 231 Pa in Dissolved and Par-
   from the 1990s to the late 2000s, Ocean Sci., 9, 147–169,                ticulate Fractions of Seawater by Isotope Dilution Thermal
   https://doi.org/10.5194/os-9-147-2013, 2013.                             Ionization Mass Spectroscopy, Anal. Chem., 75, 1075–1079,
Rudels, B., Korhonen, M., Schauer, U., Pisarev, S., Rabe, B., and           https://doi.org/10.1021/ac026247r, 2003.
   Wisotzki, A.: Circulation and transformation of Atlantic water in     Slagter, H. A., Reader, H. E., Rijkenberg, M. J. A., Rutgers van
   the Eurasian Basin and the contribution of the Fram Strait inflow        der Loeff, M., de Baar, H. J. W., and Gerringa, L. J. A.: Or-
   branch to the Arctic Ocean heat budget, Prog. Oceanogr., 132,            ganic Fe speciation in the Eurasian Basins of the Arctic Ocean
   128–152, https://doi.org/10.1016/j.pocean.2014.04.003, 2015.             and its relation to terrestrial DOM, Mar. Chem., 197, 11–25,
Rutgers van der Loeff, M. M. and Berger, G. W.: Scavenging of               https://doi.org/10.1016/j.marchem.2017.10.005, 2017.
   230 Th and 231 Pa near the Antarctic Polar Front in the South At-     Tanhua, T., Jones, E. P., Jeansson, E., Jutterström, S., Smethie,
   lantic, Deep-Sea Res. Pt. I, 40, 339–357, 1993.                          W. M., Wallace, D. W. R., and Anderson, L. G.: Ventilation
Rutgers van der Loeff, M. M., Key, R. M., Scholten, J., Bauch, D.,          of the Arctic Ocean: Mean ages and inventories of anthro-
   and Michel, A.: 228 Ra as a tracer for shelf water in the Arctic         pogenic CO2 and CFC-11, J. Geophys. Res., 114, C01002,
   Ocean, Deep-Sea Res. Pt. II, 42, 1533–1553, 1995.                        https://doi.org/10.1029/2008JC004868, 2009.
Rutgers van der Loeff, M., Kipp, L., Charette, M. A., Moore,             Trimble, S. M., Baskaran, M., and Porcelli, D.: Scavenging of tho-
   W. S., Black, E., Stimac, I., Charkin, A., Bauch, D., Valk,              rium isotopes in the Canada Basin of the Arctic Ocean, Earth
   O., Karcher, M., Krumpen, T., Casacuberta, N., Smethie, W.,              Planet. Sc. Lett., 222, 915–932, 2004.
   and Rember, R.: Radium Isotopes Across the Arctic Ocean               Ulfsbo, A., Cassar, N., Korhonen, M., van Heuven, S., Hoppema,
   Show Time Scales of Water Mass Ventilation and Increas-                  M., Kattner, G., and Anderson, L. G.: Late summer net com-
   ing Shelf Inputs, J. Geophys. Res.-Oceans, 123, 4853–4873,               munity production in the central Arctic Ocean using mul-
   https://doi.org/10.1029/2018JC013888, 2018.                              tiple approaches, Global Biogeochem. Cy., 28, 1129–1148,
Schauer, U. and Wisotzki, A.: Physical oceanography during                  https://doi.org/10.1002/2014GB004833, 2014.
   POLARSTERN cruise ARK-XXII/2 (SPACE), PANGAEA,                        Ulfsbo, A., Jones, E. M., Casacuberta, N., Korhonen, M., Rabe,
   https://doi.org/10.1594/PANGAEA.733418, 2010.                            B., Karcher, M., and van Heuven, S. M. A. C.: Rapid
Schlitzer, R.: Ocean Data View, available at: https://odv.awi.de (last      changes in anthropogenic carbon storage and ocean acidifica-
   access: November 2019), 2018.                                            tion in the intermediate layers of the Eurasian Arctic Ocean:

www.ocean-sci.net/16/221/2020/                                                                             Ocean Sci., 16, 221–234, 2020
You can also read


