Patching up the garbage patch: a drop in the ocean? - Diva Portal
←
→
Page content transcription
If your browser does not render page correctly, please read the page content below
Patching up the garbage patch: a drop in the ocean?
   A comparative study examining low levels of effective multinational cooperation on plastic
                                  pollution in the Pacific Ocean.

Elvira Sörman Laurien
Development Studies C (Bachelor Thesis)
Department of Government
Uppsala University, Spring 2016
Supervisor: Hans Blomkvist
Elvira Sörman Laurien, 2016

Contents
 List of figures and tables ........................................................................................................................... 3
 1 Introduction ........................................................................................................................................... 4
 2 Theory ................................................................................................................................................... 7
    2.1 Central concepts ............................................................................................................................. 7
    2.2 Maltais’ 5 factors for successful voluntary protection of common-pool resources ....................... 8
    2.3 Additional explanations: Elinor Ostrom’s 8 design principles for robust common-pool resource
    institutions ........................................................................................................................................... 10
    2.4 A short comment on theoretical framework choice ..................................................................... 12
 3 Method and material ........................................................................................................................... 13
    3.1 Method ......................................................................................................................................... 13
    3.2 Material ........................................................................................................................................ 14
 4 Case studies......................................................................................................................................... 15
    4.1 Background on eutrophication in the Baltic Sea .......................................................................... 15
    4.2 Background on plastic pollution in the Pacific Ocean ................................................................. 17
    4.3 Maltais’ 1st factor: number of actors ............................................................................................ 19
        4.3.1 Baltic Sea .............................................................................................................................. 19
        4.3.2 Pacific Ocean ........................................................................................................................ 19
    4.4 Maltais’ 2nd factor: location of expected damages and mitigation costs ...................................... 20
        4.4.1 Baltic Sea .............................................................................................................................. 20
        4.4.2 Pacific Ocean ........................................................................................................................ 20
    4.5 Maltais’ 3rd factor: time frame of mitigation pay-offs ................................................................. 22
        4.5.1 Baltic Sea .............................................................................................................................. 22
        4.5.2 Pacific Ocean ........................................................................................................................ 22
    4.6 Maltais’ 4th factor: level of certainty about mitigation pay-offs .................................................. 23
        4.6.1 Baltic Sea .............................................................................................................................. 23
        4.6.2 Pacific Ocean ........................................................................................................................ 24
    4.7 Maltais’ 5th factor: technical/infrastructural complexity and cost................................................ 25
        4.7.1 Baltic Sea .............................................................................................................................. 25
        4.7.2 Pacific Ocean ........................................................................................................................ 25
    4.8 Ostrom: clearly defined boundaries ............................................................................................. 26
        4.8.1 Baltic Sea .............................................................................................................................. 26
        4.8.2 Pacific Ocean ........................................................................................................................ 27
    4.9 Ostrom: monitoring ...................................................................................................................... 27
        4.9.1 Baltic Sea .............................................................................................................................. 27

                                                                                                                                                             1
Elvira Sörman Laurien, 2016
4.9.2 Pacific Ocean ........................................................................................................................ 28
4.10 Summary of results .................................................................................................................... 29
5 Discussion ........................................................................................................................................... 30
6 Conclusion .......................................................................................................................................... 33
7 References ........................................................................................................................................... 34
2Elvira Sörman Laurien, 2016
List of figures and tables
Figure 1: Drainage area of the Baltic Sea, p.15
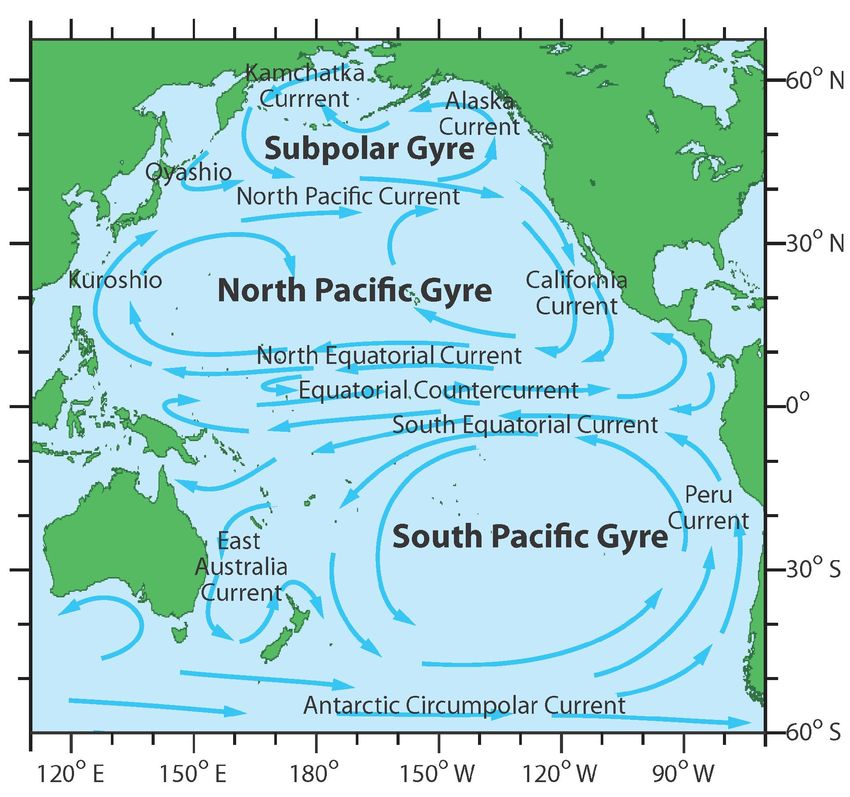
Figure 2: Ocean currents and gyres in the Pacific Ocean, p.17
Table 1: Maltais’ five factors, p.9
Table 2: Data-matrix, p.13
Table 3: Data-matrix with variable values, p.29
3Elvira Sörman Laurien, 2016
1 Introduction
In the late 1990’s, Captain Charles Moore brought to general attention the issue of marine plastic
pollution in the Pacific Ocean. The term “Great pacific garbage patch” suggested a mountain of
plastic waste in the middle of the Ocean, and although this is not completely the case, high levels
of plastic debris have been found in the Pacific Ocean, with real and potential dangers for
ecosystems, economy and human health. Cleaning the ocean of plastic debris would require huge
spending from a large number of states (in fact, many countries already spend a lot of money on
cleaning up beaches), and the matter is complicated further by the fact that the main part of the
accumulations of plastic are found at international waters, meaning that there is no one country
with complete responsibility of the plastic debris and of working actively and pro-actively with
decreasing the amounts of marine plastic debris.
Plastic debris has both immediate and long term effects on local and global ecosystems. In
the short term, plastic debris can harm animals through for example ingestion (which in worst
cases leads to starvation and death) and entanglement, and it can damage the motors of ships and
vessels, which can lead to economic losses for example for fishing companies (UNEP 2011). Long
term effects are more difficult to predict, but research has for example shown how hazardous
chemicals deriving from plastic debris can end up in animal species’ tissues as a result of plastic
ingestion over time, which eventually could lead to decreasing populations (Derraik 2002, p.846).
In an even longer term, plastics in the oceans might seriously interfere with global food-chains,
since human consumption of polluted sea food could lead to accumulations of dangerous chemicals
also in the bodies of humans (cf. Barnes et al. 2009; Encyclopædia Britannica 2016; Natural
Geographic 2014).
Despite the severe problems described above, no effective multinational cooperation exists
to tackle the problem with plastic pollution. This paper will—through comparative case analysis—
examine what factors explain low levels of effective multinational cooperation on plastic pollution
in the Pacific Ocean. The Baltic Sea with its pollution-, overfishing- and eutrophication problems
will be used as comparative case. To improve the health of the Baltic Sea, surrounding states have
come together under the Baltic Marine Environment Protection Commission – Helsinki
Commission (HELCOM); addressing one of the more severe problems which is eutrophication
(HELCOM 2010, p.14). Eutrophication can be described as “…an increased input of nutrients
causing an accelerated growth of planktonic algae, (i.e. algae that float or drift in the water column)
4Elvira Sörman Laurien, 2016
and higher plant forms” (BalticSTERN 2013, p.34). The phenomenon leads for example to lower
levels of oxygen in the water which can cause the death of fish. It can also lead to decreasing
tourism revenues as murky and algae rich water might deter tourists from bathing and doing other
water activities. Nitrogen and phosphor—the main substances causing eutrophication—inputs to
the Baltic Sea mainly come from land-based sources. The HELCOM has set clear targets and
suggested measures for decreasing the input of these substances (BSAP 2007, p.7).
In relation to what has been presented above, what factors can explain why there exists an
effective multinational cooperation on pollution in the Baltic Sea but not on pollution in the Pacific
Ocean? Factors that have been argued to be critical for the success and failure of the ozone
depletion and global warming problems respectively (see Maltais 2013) will mainly form the
analytical tool to explain low levels of cooperation on pollution in the Pacific Ocean. Further,
Elinor Ostrom’s design principles for robust common-pool resource institutions (Ostrom 1990;
Ostrom 1994) will be discussed as potential additional explanatory factors.
The research question of the paper is as follows: Using comparative case analysis, can
factors identified by Aaron Maltais and Elinor Ostrom explain low levels of multinational
cooperation on plastic pollution in the Pacific Ocean?
The general assumption of the paper is that when the variable values of Maltais’ five factors
correspond to those of “ozone depletion” (see Table 1 in section 2.2), and when boundaries of a
common-pool resource are clearly defined and monitoring is in place, the chance for effective
multinational cooperation on environmental collective action problems in global commons is high.
To clarify, the column for “ozone depletion” in Table 1 in section 2.2 presents the variable values
for each of the five factors. For factor number 1 (“number of actors”) the general claim of this
paper about that specific factor is that a low number of actors increases likelihood of successful
cooperation. Further, it is assumed that only because there exists no effective multinational
cooperation today, it is not impossible to achieve in the future. This paper will hopefully shed light
on the current situation, but does not discard the possibility of effective cooperation.
The paper is arranged in the following way: First, some concepts central to this paper are
briefly summarized. There, the informed reader will find repetition, but for the reader to whom
collective-action theories are more novel, the section functions as a foundation to the case analyses
and Discussion of the paper. The second part of the Theory chapter contains the theoretical
framework on which the case analyses are based. After the theory, methodology and case selection
5Elvira Sörman Laurien, 2016
as well as material, are presented. The main part of the paper is made up by the case analyses. The
Case study chapter begins with a background on the two cases respectively. Thereafter, the two
cases are examined through each of the seven factors. The chapter ends with a summary of the
result, presented in the form of a table which corresponds to the data-matrix presented in the
Method chapter. The final parts of the paper contain the Discussion and Conclusion. Here, the
results of the case analyses are analyzed and problematized. Comments about the applicability of
the theoretical framework are also made, and a summary of the paper and its main findings are
presented.
6Elvira Sörman Laurien, 2016
2 Theory
2.1 Central concepts
Common-pool resources
What characterizes both the Baltic sea and the Pacific Ocean is that they can both be argued to be
(global) common-pool resources (hereafter abbreviated CPR(s)). CPRs have been defined as
“…natural or human made facilities (or stocks) that generate flows of usable resource units over
time.” (Ostrom 1994, p.2). In other words, they are areas where resource units can be subtracted.
Examples of CPRs are irrigation systems (where the irrigation system is the stock and the water
being subtracted by each user makes up the resource units) and graze lands (where the defined
grazing area is the stock and the amount of grass being consumed by the animals makes up the
resource units). What is special about CPRs is first that developing institutions that can supervise
exclusion of potential appropriators is a difficult and costly task (and this is a feature that CPRs
have in common with public goods), and second that at the time when a resource unit has been
withdrawn from the stock, it is unavailable to other appropriators (a feature which can also be
found in private goods) (ibid., p.2).
Logic of collective action
Mancur Olson (in Richardson 1993, pp.23-37) argues that unless a group of actors is very small,
or unless there are clear sanctions or rules against non-cooperation, individuals of a group will not
act for the common good or the common interest of the group. Olson builds this argument on the
assumption that individuals are rational beings, which means that they will not act for the common
good of the group unless other members of the group do so too/if it is likely that other members
will do so too. This problem or way of reasoning that Olson refers to is also known as the logic of
collective action. The logic of collective action is connected to CPRs because the very core of the
concept of collective action problems is that the rationality and self-interest of members of a group
stops them from acting for the common good. And, since in a CPR the common good must be seen
as not overusing the resource, the logic of collective action would suggest that managing a CPR
without any rules or sanctions would always lead to overuse of the resource.
7Elvira Sörman Laurien, 2016
Tragedy of the commons
In a classic article, Garett Hardin (1968) discusses the problem of the tragedy of the commons.
There, Hardin discusses how we humans must realize that the world we live in is a finite one, and
that that also accounts for most resources found in it. Although mainly addressing overpopulation,
the famous example of the tragedy of the commons made by Hardin is that of two herders using
the same pasture land for their animals (ibid., p.1244). This example is the foundation for the
assumptions about why lack of CPR institutions can lead to the overuse or even destruction of a
common-pool resource.
Free-rider problem
Closely related to both the “tragedy of the commons” and the “logic of collective action” is of
course the problem with free-riders. According to Elinor Ostrom, “[w]henever one person cannot
be excluded from the benefits that others provide, each person is motivated not to contribute to the
joint effort, but to free-ride on the efforts of others.” (Ostrom 1990, p.6, my emphasis). In the
context of CPRs, this means that the difficulty of exclusion of potential appropriators will lead to
some individuals only subtracting from the CPR but not contributing to the sustainable
management of the CPR.
2.2 Maltais’ 5 factors for successful voluntary protection of common-pool resources
In an article on climate leadership, Maltais (2013) comments on how leadership and climate
mitigation efforts can be understood through analyzing the cases of global warming and ozone
depletion. It is commonly accepted in literature that the Montreal protocol of 1989, which regulates
the emittance into nature of substances that deplete the ozone layer, is a successful example of
cooperation on climate issues. On the other hand, the difficulties of coming to an international
agreement on greenhouse gas (GHG) mitigation efforts to reduce global warming are also widely
recognized. In his article, Maltais summarizes literature on these two cases and compares it, and
presents a table which identifies five factors (variables) and their values. These are presented as
the explanatory factors for why the ozone depletion case reached successful international
cooperation while the global warming case is still waiting for one.
8Elvira Sörman Laurien, 2016
Ozone depletion Global warming
(successful cooperation) (unsuccessful cooperation)
1. Number of actors A few key actors Many actors/virtually all
industries
2. Location of expected Tend to coincide Tend to diverge
damages and mitigation costs
3. Timeframe of mitigation Nearer term Longer term
pay-offs
4. Level of certainty about Exceptionally high Low even for the largest
mitigation pay-offs emitters
5. Technical/infrastructural Low High
complexity and cost
Table 1: Maltais' five factors (Maltais 2013, p.6)
The first (1) factor explains how the number of actors responsible for emissions (of ozone depleting
substances and greenhouse gases (GHG) respectively) affect(ed) likelihood of cooperation. In the
ozone case, only a few key actors were responsible for the majority of the emissions, while in the
global warming case almost all countries of the world and a diverse set of industries are responsible
for the emissions (Maltais 2013, p.4). A low number of actors is thus see as positive for the
likelihood of multinational cooperation.
The second (2) factor concerns the spatial distance between where the majority of the
emissions come from (i.e. where mitigation costs would be highest), and where it is most likely
that damages (as a result of emissions) will occur. In the global warming case, the major emitters
are developed countries (although this is somewhat changing) but it is foremost developing
countries (especially smaller island states) that will constitute the location of expected damages
(ibid.). One reason for this is that developed countries more likely have better climate security
systems and technology in place. All in all, for global warming, the spatial distance is greater, i.e.
the location of expected damages and mitigation costs diverge. Thus, the more mitigation costs
and expected damages diverge, the less is the likelihood for multinational cooperation.
The third (3) factor explains how the timeframe of mitigation pay-offs—i.e. how long it
will take until results from mitigation efforts become clearly tangible—affects how inclined actors
are to take multilateral action. From the examples of ozone depletion and global warming, it is
thought that a longer timeframe will affect the likelihood of cooperation negatively (ibid.).
The fourth (4) factor concerns the level of certainty about mitigation pay-offs. In the global
warming case, it is highly uncertain what mitigation efforts will lead to concretely. Because of
9Elvira Sörman Laurien, 2016
this, it is also difficult for states to predict the costs and benefits ratio of mitigation efforts, which
gives fewer direct incentives to act (ibid., pp.4-5). Thus, low certainty levels affect the likelihood
of multinational cooperation negatively.
The fifth (5) and final factor explains how the availability of appropriate technology and
infrastructure affects the motivation of actors to initiate mitigation cooperation. If there exist cheap
and/or available options for mitigation operations, the chance is higher that nations will cooperate
on environmental collective action problems in global commons. Absence of (cost-) effective
technology and infrastructure, or presence of very expensive and/or ineffective technology and
infrastructure affects the likelihood of multinational cooperation negatively.
2.3 Additional explanations: Elinor Ostrom’s 8 design principles for robust common-pool
resource institutions
Building on extensive empirical work, Elinor Ostrom (1990) developed a framework for successful
management of common-pool resources. This framework consists of eight so called “design
principles for robust common-pool resource institutions”. Ostrom’s argument is that only with
most or all design principles in place, a local CPR can be managed sustainably. The eight design
principles are: (1) clearly defined boundaries, (2) congruence between appropriation and provision
rules and local conditions, (3) collective choice arrangements, (4) monitoring, (5) graduated
sanctions, (6) conflict resolution mechanisms, (7) minimal recognition of rights to organize, and
(8) nested enterprises (for an explanation of the ones not explained below, cf. Ostrom 1994, pp.4-
11 and Ostrom 1990, pp.88-102).
There are two of these eight design principles that I find more crucial as complementary
factors to the five presented by Maltais in relation to the two cases in this paper: clearly defined
boundaries and monitoring. As for clearly defined boundaries, Ostrom (1994, pp.4-5) argues that
in order to avoid overuse and destruction of a CPR, it must be clear what individuals and
households (also called appropriators) are allowed to use the CPR (i.e. withdraw resource units
from it), and the CPR itself must also be defined in terms of geographical boundaries. In regards
to global commons, regions and whole nations can also be argued to be appropriators. Clearly
defined boundaries is interesting as complementary factor since both the Baltic Sea and the Pacific
10Elvira Sörman Laurien, 2016
Ocean consist of international waters, which might obstruct a defining of the boundaries of the two
commons.
Monitoring is something that Ostrom (1994, pp.6-9) argues is necessary for maintaining
sustainable appropriation of a CPR. To ensure that all appropriators follow the rules that are set up
for a CPR, monitors are needed to continuously audit both the conditions of the resource and the
behavior of the appropriators. If there is no continuous monitoring in place, the resource is in risk
of being over-used or in worst case, destroyed. The monitors appointed may themselves be
appropriators of the common-pool resource in question, but regardless of whether they are so or
not, they need to be accountable to the (other) appropriators. For any cooperation scheme—
whether small or large scale—the question of how to make sure that what has been agreed on is
actually happening is always central. Thus monitoring in the case of large water commons is
relevant as an alternative explanatory factor.
Clearly defined boundaries and monitoring seem interesting as complementary factors
since they might explain how the complexion of the CPR itself affects chances for durable
cooperation, something that I think Maltais’ factors fail to do. Only examining the problem at hand
and the actors involved in, and/or affected by the problem seems to me insufficient, since all global
commons are evidently not identical. I find it highly plausible that also the differing characteristics
of different CPRs (whether global or local) could affect the chances for multinational cooperation.
In relation to this paper, although the Pacific Ocean and the Baltic Sea share some characteristics,
they also differ on some aspects, which could be interesting for explaining the different levels of
multinational cooperation between them. Further, to include also (some of) Ostrom’s design
principles when studying levels of multinational cooperation on environmental collective action
problems in global commons is to me a way to make the theoretical framework more sensitive to
the “real world” and its complexities.
It should be noted that the two design principles chosen as crucial for the cases of this paper
should be seen as just that: crucial for the Baltic Sea and Pacific Ocean. Had this paper concerned
an existing (but unsuccessful) cooperation in the Pacific Ocean, there are no doubts that the choice
of additional explanatory factors (from Ostrom’s design principles) might have been different. Of
course, monitoring can be seen as situated somewhere in a grey zone as it can also be seen as
describing the “layout” of a cooperation, but I believe that it can also be interpreted in a more
hypothetical manner (as will be explained further in section 4.9.1).
11Elvira Sörman Laurien, 2016
2.4 A short comment on theoretical framework choice
As shown above, the two selected cases can both be argued to be common-pool resources (CPRs).
In both cases, it is difficult to exclude potential appropriators, especially since they both to some
extents are international waters. This first characteristic of CPRs is especially true for the Pacific
Ocean, but also the Baltic Sea. Further, resource units available in both the Baltic Sea and the
Pacific Ocean are finite in the sense that once a certain resource unit has been used (at a certain
point in time), it is unavailable to others. This goes for example for fish stocks and clean water.
This feature is the second thing that characterizes CPRs. So, both cases can be seen as CPRs, global
such if one wants to specify. Central to the literature on CPRs is the need for enduring institutions
to manage the resources themselves and in extension also the appropriation of them. Elinor
Ostrom’s seminal works on robust CPR institutions has resulted in identification of such
management institutions (see the previous section). Her work builds on smaller-scale CPRs, and
as mentioned above, the two cases in this paper are global ones1. Aaron Maltais’ article, on the
other hand, summarizes literature on the management of what can be argued to be two global
commons: the atmosphere/ozone layer, and the environment. The factors identified by Maltais in
relation to the successful and unsuccessful management of these two commons respectively might
therefore translate also onto other global commons.
To explain differences in levels of multinational cooperation in the two cases respectively,
applying factors identified in other cases of “environmental collective action problems in (global)
commons” seems most suitable.
1
For a discussion about the applicability of Ostrom’s design principles on global common-pool resources, see for
example Stern (2011).
12Elvira Sörman Laurien, 2016
3 Method and material
3.1 Method
The research method that this paper builds on is comparative case study. In this paper, two cases
are examined: eutrophication problems in the Baltic Sea (case 1), and plastic pollution problems
in the Pacific Ocean (case 2). As was established in the Introduction, the aim is to answer why
there exists a multinational cooperation in case 1, and why at the same time multinational
cooperation levels are low in case 2. To conduct the case studies in a consistent manner, structured
focused comparison (cf. Powner 2015, pp.105-106) is used. This is a research method which
evaluates two (or more) cases from the same set of beforehand determined factors (or variables),
to see if the outcomes of the cases (for this paper, levels of multinational cooperation) can be
explained by differences or similarities in the factors between the cases. The comparison made in
this paper aims to explain differences in outcome of two cases that both are global commons, and
therefore should face similar collective-action problems. Structured focused comparison is
favorable since it opens up for analysis of a number of different factors/variables.
To structure the results of the case analyses in the paper and to facilitate a coherent
discussion, the following data-matrix has been constructed:
BALTIC SEA (case 1) PACIFIC OCEAN (case 2)
Number of actors
Location of expected
damages and mitigation costs
Timeframe of mitigation pay-
offs
Level of certainty about
mitigation pay-offs
Technical/infrastructural
complexity and cost
Clearly defined boundaries
Monitoring
Successful cooperation Unsuccessful cooperation
(outcome 1) (outcome 2)
Table 2: Data-matrix
By breaking the comparative case analysis down into a data-matrix with variables and variable
values for each analytical unit (i.e. case), qualitative research results become more comprehensive,
which facilitate for thought-through analyses and discussions (Esaiasson et al. 2007, pp.47-61).
13Elvira Sörman Laurien, 2016
3.2 Material
The selection of material was made based on the seven independent variables. Official reports and
documents as well as academic papers form the main bulk of material. Additional information has
been gathered from web pages, mainly belonging to environmental organizations, but also online
newspaper sites and online encyclopedias. The collected material has been analyzed through
qualitative text analysis, a method that is used to bring out the essential and case-relevant sections
of a literature source (Esaiasson et al. 2007, pp.237-243).
For case 1 (the Baltic Sea), naturally much information has been collected from documents
and reports associated with and/or produced by HELCOM. The absence of an effective
multinational cooperation agreement on plastic pollution means that for case 2 (Pacific Ocean),
data has been collected from a wider array of sources. Although they have been chosen with
caution in regards of reliability, one needs to be aware that important information could be missing.
A more extensive study allowing for a deeper investigation could perhaps better make sure that all
relevant information is included in the cases analyses.
14Elvira Sörman Laurien, 2016
4 Case studies
4.1 Background on eutrophication in the Baltic Sea
As mentioned in the
introduction, one great problem
that the Baltic Sea faces is
eutrophication. Especially
coastal areas have been affected
by the phenomenon, through for
example algal blooms that
obstruct coastal recreational
activities. On a more
overarching level, whole
ecosystems can be damaged by
the effects eutrophication have
on the state of the water
(Bergström et al. 2013). In fact,
eutrophication is such a severe
issue in the Baltic Sea that it has
been concluded that in 2010
“[a]ll open waters in the basins
of the Baltic Sea, including the
open parts of the Bothnian Bay,
were found to be ‘affected by Figure 1: Drainage area of the Baltic Sea
eutrophication’.” (HELCOM
2010, p.16). As an example, direct effects of eutrophication on Baltic Sea ecosystems is found in
a study on the relationship between eutrophication on one hand, and occurrence of perch and
pikeperch (two fish species), and bladderwack and eelgrass (two aquatic plants) on the other hand,
conducted by Bergström et al. (2013). There, it is concluded that for all species except from
15Elvira Sörman Laurien, 2016
eelgrass, it is possible to see a correlation between Secchi depth2 and occurrence of the species.
The results of the study for example show how for perch—a species that thrives in more transparent
waters—increases in Secchi depth generate increases in occurrence of perch (Bergström et al.
2013, p.685). Eutrophication, which decreases the transparency of water thus seems to have a
direct negative effect on perch populations.
In contrast to the Pacific Ocean situation (see below), there is a multinational cooperation
in place to tackle the problem with eutrophication, as well as three other “issue focal areas”. The
Baltic Marine Environment Protection Commission – Helsinki Commission (HELCOM) is a
multinational body which governs the Convention on the Protection of the Marine Environment
of the Baltic Sea Area. At present date, the cooperating states are Sweden, Russia, Denmark,
Estonia, Latvia, Germany, Poland, Lithuania and Finland, and the Commission also includes the
European Union. The Convention governed by the commission was established in 1992 to protect
the Baltic Sea’s marine environment from all kinds of pollution. The Convention is an agreement
which applies to the whole of the Baltic Sea, meaning that also the parts of it that are international
waters are covered (HELCOM 2014). For the future, the commission envisions “…a healthy Baltic
Sea environment with diverse biological components functioning in balance, resulting in good
ecological status and supporting a wide range of sustainable economic and social activities.”
(HELCOM 2016).
2
Secchi depth measures the transparency of water. To measure Secchi depth, a round disc with two white and two
black fields is lowered vertically into the water. When the disc is no longer visible to the naked eye from the
surface, it has reached that specific spot’s Secchi depth. The depth is indicated in meters (m).
16Elvira Sörman Laurien, 2016
4.2 Background on plastic pollution in the Pacific Ocean
Figure 2: Ocean currents and gyres in the Pacific Ocean
In 1997, after finishing a sailing race, Captain Charles Moore decided to take a shortcut back from
Hawaii to Los Angeles through the North Pacific Subtropical gyre, and made a discovery which
fueled a debate about marine plastic pollution. What Moore found when sailing through the gyre
was a vast landscape of plastic debris floating on the surface. In an essay, Moore writes how as he
“…gazed from the deck [of the boat] at the surface of what ought to have been a pristine ocean,
[he] was confronted, as far as the eye could see, with the sight of plastic.” (Moore 2003). Although
there had already earlier been studies showing plastic pollution in the world’s seas (Encyclopædia
Brittanica 2016; Slat 2014, p.39), Moore’s discovery led to much media attention to the problem,
17Elvira Sörman Laurien, 2016
and the coining of the term “Great pacific garbage patch”. Today, however, many argue that it is
misleading to label the accumulation of plastic debris a “patch” since much of the plastic debris
found today is in fact small pieces of plastic that are not immediately visible to the naked eye,
rather than large chunks of plastic (UNEP 2011; NOAA 2016a). Regardless of whether the
accumulation of plastic should be labelled a “patch” or not, research shows that there is a high
density of plastic material in the ocean gyres and further that the non-biodegradable nature of
plastics means that as long as nothing is done to stop plastic pollution and to clean up the oceans,
the accumulations of plastic in the world’s seas will not disappear in a near future. It can in fact
take anywhere from 400 to 1000 years for plastics to break down completely (that is, not only
breaking down into smaller plastic molecules through photo-degradation, but into carbon dioxide,
water and inorganic molecules) (Slat 2014, p.37).
Although the problem of plastic pollution is severe, there exists no effective multinational
cooperation with main focus on this problem. There are, however, two programs touching upon
the issue of marine plastic pollution. The International Convention for the Prevention of Pollution
from Ships (MARPOL) is an international convention which went into force in 1988. It deals with
ships’ overboard waste disposal at sea, and its Annex V prohibits signatory states to dump waste in
all waters, whereas non-signatory states must refrain from dumping waste in signatory states’
territorial waters. This convention has, however, not led to much. It has severe enforcement
problems, and research investigating the effects of the Convention suggests there is little real
change as a result of the Convention (Greenpeace n.d., pp.33-34). Further, it only deals with waste
originating from ships, and research has shown that only about 20 percent of the plastic found in
the Pacific Ocean comes from water-based activities (Slat 2014, p.38). Thus, an important majority
of the sources to the problem of plastic pollution is not included in this agreement. Another
program that touches upon the issue of plastic pollution is the Global Programme of Action for the
Protection of the Marine Environment from Land-based Activities (GPA), but as marine litter is
only one of nine focus areas in this program, it will also not be addressed as an effective
cooperation. The MARPOL convention does not deal with the full scope of the problem of marine
plastic pollution, and for the GPA, marine litter is only one of many focal areas. Thus none of these
two cooperation efforts are here deemed successful.
18Elvira Sörman Laurien, 2016
4.3 Maltais’ 1st factor: number of actors
The lower the number of key actors connected to a global common, the higher the chance that a
multinational cooperation is established.
4.3.1 Baltic Sea
Regarding eutrophication in the Baltic Sea, key actors can either be seen as the states that both
emit nutrients and will enjoy a less eutrophic sea (which would make the coastal states first and
foremost into key actors), but one could also think that all states that in one way or another
contribute to the eutrophication of the Baltic Sea are key actors. If one argues for the latter, also
for example Belarus could be included, as it is included in the Baltic Sea drainage area (see Figure
1). Yet, around ten countries could be seen as a fairly low number of key actors, especially when
one takes into account the spatial closeness of all countries and the fact that the majority of them
are European Union member states (which means that EU legislation concerning the state of the
Baltic Sea applies to them).
4.3.2 Pacific Ocean
The Pacific Ocean is the largest body of water covering the Earth’s surface: in fact, it covers
approximately 165 million square kilometers which is roughly a third of the surface of the Earth.
Stretching from the Antarctic continent to the Arctic vertically, and from Asia and Australia to the
Americas horizontally, it is connected to a large number of states. It also surrounds many Island
states completely. The ocean currents that transport plastics in the Pacific Ocean pass all these
states, which means that land-based plastic waste that has entered the ocean from one state can end
up in a completely different part of the ocean. The longevity of plastic materials also means that
plastic found in the Pacific Ocean today might have entered the ocean more than a decade ago.
This, together with a shift in major plastic emitters means that it is difficult to pin-point the main
culprits.
It is fair to conclude that the number of key actors is great. Apart from the larger states that
somewhat form borders of the Pacific Ocean (for example Canada, the United States, Mexico, five
Central American countries, four South American countries, New Zealand, Australia, Indonesia,
China, and Japan) there are also the many so called “Island States” usually categorized into
Melanesia, Polynesia and Micronesia. In line with the argument about key actors in the Baltic Sea
(see above), all the aforementioned states can be argued to be key actors, as they all most likely
19Elvira Sörman Laurien, 2016
contribute to plastic pollution or feel the consequences of it (or both). Not only are there a lot of
actors, but they are also a very diverse lot, seen to both size, geographical location, and “stage of
development”.
4.4 Maltais’ 2nd factor: location of expected damages and mitigation costs
If there is a great spatial difference between the location of expected damages caused by emissions
and the location causing the emissions and therefore also would needs to invest in mitigation
efforts, the chances of multinational cooperation is smaller. If the location of expected damages
and mitigation costs coincide, the chance is higher.
4.4.1 Baltic Sea
The main emitters of pollutants that contribute to eutrophication are the Baltic States. Land-based
pollution from for example agriculture and industry (two of the contributors to eutrophication) is
something that in the end mainly affects Baltic States, since it is their coastlines and the ecosystems
there that are damaged by eutrophication. To exemplify the visibility of the problem to Baltic State
citizens, a survey made by the BalticSTERN (2013, pp.17-18) showed that
“…the Baltic Sea is important to people. More than 80 percent of the people living in countries
around the Sea have spent leisure time at the Sea. Many are worried about the environmental
situation and every second person of the respondents in the survey BalticSUN had themselves
experienced eutrophication.”
The fact that almost all key actors have a coastline connection to the Baltic Sea and thus tangibly
notice the effects of eutrophication (that they themselves have contributed to) makes for the
conclusion that the spatial distance between the location of expected damages and mitigation costs
is short.
4.4.2 Pacific Ocean
There are two main origins of plastics that enter the oceans: land-based sources and water-based
sources. Land-based sources (which as has been mentioned above contribute to about 80 percent
of the total amount of plastic in the oceans) include industries, drainage systems, landfills that are
managed poorly, recreational- and tourist activities in coastal areas, as well as plastics transported
from land to the ocean by the wind. Water-based sources (which then contributes to about 20
20Elvira Sörman Laurien, 2016
percent of the total amount of plastic in the oceans) include waste from ships (intentionally or
unintentionally) and offshore platforms (UNEP 2011; National Geographic 2014; Barnes et al.
2009). Although these sources are established, determining from what geographical areas the
majority of the plastics come from is more difficult. Plastic is a material that is used globally and
the production and use of it has boomed over the last decades due to its durability and low costs.
The Pacific Ocean is, as mentioned, bordering to both developed and developing countries, and it
seems fair to assume that the majority of all of them are or have been contributing to the problem
of plastic pollution.
When it comes to establishing the spatial distance between the location of expected
damages and mitigation costs regarding plastic pollution in the Pacific Ocean, there are three things
that makes the assessment complex. First, as has been explained above, the sources of plastic
pollution are both diverse and multinational. Second, establishing what “damages” are in relation
to plastic pollution is complicated. Damages could for example be seen as over-littered beaches
that may lead to decreases in tourist revenues. But damages could also be explained in the
phenomenon of “ghost fishing”3 (cf. UNEP 2011, p.25; National Geographic 2014), or even in the
uncertain long term effects that plastic litter can have on entire food-chains (see the Introduction
section of this paper). Third, it is difficult to pinpoint the main victims of plastic pollution emission.
Is it future generations? Small or large countries? “Developed” or “developing” countries? And
further, should damages be seen through a local or a global lens?
The three complex aspects presented above makes it difficult to establish whether the
spatial distance between the location of expected damages and mitigation costs is short or long,
since there seems to be also a temporal distance.
3
“Ghost Fishing is what fishing gear does when it has been lost, dumped or abandoned. Imagine a fishing net that
gets snagged on a reef or a wreck and gets detached from the fishing vessel. Nets, long lines, fish traps or any
man made contraptions designed to catch fish or marine organisms are considered capable of ghost fishing when
unattended, and without anyone profiting from the catches, they are affecting already depleted commercial fish
stocks. Caught fish die and in turn attract scavengers which will get caught in that same net, thus creating a
vicious circle.” ( [Accessed 13 May 2016])
21Elvira Sörman Laurien, 2016
4.5 Maltais’ 3rd factor: time frame of mitigation pay-offs
The shorter the estimated time until mitigation efforts pay off (i.e. until they become clearly
tangible), the higher the chance for multilateral mitigation action.
4.5.1 Baltic Sea
The Baltic Sea Action Plan (BSAP, adopted by the HELCOM in 2007) has set as target to reach
good environmental health of the Baltic Sea by 2021. The target (measured in Secchi depth, see
footnote 2) is based on 1997-2003 levels of eutrophication in the Baltic Sea (BSAP, 2007). As for
eutrophication, mitigation measures are to be implemented fully in 2016. However, this last target
has been questioned for being too optimistic by for example the Swedish Environmental Protection
Agency (Naturvårdsverket 2009, p.7). Even though the level of certainty about mitigation efforts
is high (see section 4.6.1) the severe state of the Baltic Sea, along with the fact that reversing the
trend of eutrophication is a slow process even if all the right measures are taken, gives at hand that
the time frame for mitigation pay offs is probably longer than just the goal set by the BSAP.
However, in the holistic assessment of the status of the Baltic Sea made by HELCOM in 2010
(HELCOM, 2010), it is claimed that it is possible to reverse the negative trends of eutrophication
in the Baltic Sea, and that it is possible to be “back on track” towards a healthier Sea already by
2021 (ibid., p.54). Therefore, even if the timeframe probably is longer than the BSAP targets, if
the right measurements taken the timeframe could still be considered fairly short.
4.5.2 Pacific Ocean
Plastic is a non-organic material which is both strong and durable. It can be used for a variety of
purposes, something that has contributed to its popularity in a variety of industries and areas.
Because of the chemical structure of plastic, it does not break down into organic component parts
immediately, but instead it goes through so called “photo-degradation” which simply means that
sunlight breaks it down into smaller and smaller plastic particles. This is why such a big part of
the plastics in the Pacific Ocean is not large chunks of plastic but rather so called “micro plastics”
that are rarely visible to the naked eye.
Should a multinational cooperation agreement come into being, effects of plastic pollution
mitigation efforts made by it would likely not be visible in a very long time. Simulations made by
22Elvira Sörman Laurien, 2016
the Ocean Surface Current Simulator4 (OSCURS, developed by the National Oceanic and
Atmospheric Administration5 (NOAA)) have shown that it takes around six years for plastic that
has entered the North Pacific gyre to reach its center (Slat 2014, p.39). In relation to the time frame
factor, this is telling: these six years make up only one stage in the “life-cycle” of plastic debris in
the marine environment. If the first stage is the plastic entering the ocean (either from a land-based
or a water-based source), the second stage is it travelling with the ocean currents to the North
Pacific gyre, the third stage is the six years it takes for it to reach the center of the gyre, and then
the lengthy fourth stage is when the plastic first goes through photo-degradation to finally
sometime in a farther future break down into organic component parts—a process that takes
hundreds of years (SEI, 2016; Slat 2014, p.37).
One could think of “mitigation efforts” in two terms: both the practical matter of cleaning
up the plastic that is already situated in the Pacific Ocean—a task that for example Boyan Slat and
colleagues (2014) are developing innovative tools for—and also the more societal and institutional
task of adopting laws and regulations that concern waste management and attitudes towards
sustainability and plastic consumption. The time frame for mitigation pay-offs could in any case
be seen as long. Even if both practical and institutional/societal solutions and changes are in place,
the very nature of plastic means that “clean oceans” is something that will take a long time to
achieve.
4.6 Maltais’ 4th factor: level of certainty about mitigation pay-offs
Low certainty about what mitigation efforts will lead to more specifically, and whether they will
pay off or not leads to difficulties in predicting the costs and benefits of mitigation efforts, which
decreases the chances for multinational cooperation.
4.6.1 Baltic Sea
The problem of eutrophication is, as has been mentioned, mainly caused by land-based agricultural
and industrial activities. Although the situation in the Baltic Sea is severe, there exists concrete
and effective measures that can be taken in order to improve its health. For example, a decrease in
4
For access to the OSCURS numerical model, visit [Last
accessed 05 May 2016]
5
Link to the NOAA website on [Last accessed 05 May 2016]
23Elvira Sörman Laurien, 2016
nitrogen input has a direct relationship with an improved status of eutrophication. Decreasing
nitrogen inputs is something that be done by for example increasing the capacity of sewage plants
to clean waste water from nutrients before the waste water is released into the Baltic Sea, by
decreasing the agricultural use of manure-based fertilizers, and by restoring wetland landscapes
since they can reduce nutrient levels (Gren et al., 1997). To stop phosphorous inputs (something
that also decreases eutrophication levels), legal bans prohibiting the use of them can be
implemented (HELCOM 2010, pp.45-46).
In the case of eutrophication in the Baltic Sea there are thus clear connections between the
sources of the problem and methods to reduce the impact of those sources. Some of the methods
mentioned above have proven cost-effective (cf. Gren et al., 1997) which should function as an
incentive for actors.
4.6.2 Pacific Ocean
As has already been mentioned, the Pacific Ocean is a vast area. Research has suggested that there
is a greater accumulation of plastic in the North Pacific subtropical gyre than in the South Pacific
gyre, and further it has been estimated that the North Pacific gyre contains about one third of the
plastic found in the world’s oceans (including the Mediterranean Sea) (Slat 2014, p.97). Although
believed to be underestimates, this one third has in concrete numbers been estimated to “…140,546
metric tons [in total]: 21,290 metric tons of plastic smaller than 2 cm and 119,256 metric tons of
plastic larger than 2 cm.” (ibid., p.101).
In comparison with the case of eutrophication in the Baltic Sea, one clear indicator of
mitigation success in the Pacific Ocean could be a decrease (or disappearance) of for example
plastic litter on beaches, or a decrease in observations of sea-animal entanglement. The amount,
and especially uncertainty about toxic substances in the ocean and their effects on ecosystem- and
human health is less tangible however (UNEP 2011). Eradicating toxic substances originating from
plastic debris would probably be a very long process, demanding cooperation and complete
engagement from many states and industries. It could therefore be assumed that the certainty about
plastic pollution mitigation pay-offs is low. Not only is it unclear what effects hazardous
substances (deriving from plastics) have on local and global ecosystems, but it is also unclear when
these eventual effects will “play out”, which means that it is also unclear when eventual mitigation
efforts will have concrete effects on the problem.
24Elvira Sörman Laurien, 2016
4.7 Maltais’ 5th factor: technical/infrastructural complexity and cost
If technical and infrastructural “tools” exist to facilitate mitigation, and if these are cheap, the
chance for multinational mitigation cooperation is higher.
4.7.1 Baltic Sea
The main sources of eutrophication are nitrogen and phosphorous loads that enter the Baltic Sea
mainly from sources on land. More specifically, agriculture, industries, municipal wastewaters and
poorly managed dump sites—all from either the coastal areas or the bigger catchment area of the
Baltic Sea—are important sources to the problem (HELCOM 2010, p.9). In section 4.6.1, measures
to decreases inputs of nitrogen and phosphor into the Baltic Sea were exemplified. Except from
the possibility that some Baltic States might have less money or will to implement changes to
reduce nutrient inputs, many of the measures that can be taken are fairly low-cost. Increasing the
capacity of sewage plants to clean waste water from nutrients, for example, has as a matter of fact
been identified as one of the least costly measures that can be taken (Gren et al., 1997, p.353). It
seems therefore that for the case of eutrophication of the Baltic Sea, there are cost-effective
techniques available to mitigate the problem.
4.7.2 Pacific Ocean
To achieve a “clean” Pacific Ocean, there seems to exist two major challenges: removing the
plastic that is already in the Ocean, and improving waste management and plastic recycling
processes and methods in order to stop more plastic from entering the oceans. Removing the plastic
that is already in the Ocean also faces some challenges.
First, as we have seen, not all plastic “out there” comes in the form of large pieces, but
rather has broken down into so called micro plastics. Thus, an effective clean-up mission should
preferably be able to catch both types of debris. Further, it is not completely established that all
plastic in the Pacific Ocean is located at the surface, meaning that any type of “scrape-off”
technology must be supplemented with technology/-ies that can catch also debris that is located
further down in the water (Slat 2014, p.65). Today, there are two main types of clean-up methods
available: drones, and vessels. Both have, however, proven costly and in relation to the large scale
of the problem, fairly ineffective (ibid., pp. 68-73). Although there are attempts today to create
cost-effective ways to clean up large amounts of plastic (cf. the project described in Slat 2014),
these are still at an infant stage and will probably need much financial and political support before
25Elvira Sörman Laurien, 2016
they can be used at a large scale. Then there is the task to improve the management of plastic
waste, so that as little as possible enters the ocean. To achieve this, large-scale actions are needed
by governments to change plastic consumption behavior and to create legal incentives for
industries to re-adjust to become less dependent on plastic materials and for communities to better
handle their plastic waste (UNEP 2011). The final challenge concerns what to do both with the
plastic that future effective clean-up strategies collect. Who owns it, and what shall be done with
it are questions that need to be sorted out.
To sum, the problem at hand is a very complex one, there are great uncertainties of how to
deal with it effectively and sustainably, and the costs associated with existing clean-up techniques
are extensive.
4.8 Ostrom: clearly defined boundaries
To guarantee robust common-pool resource (CPR) institutions, “…[i]ndividuals or households
with rights to withdraw resource units from the CPR and the boundaries of the CPR itself are
clearly defined.” (Ostrom 1994, p.4)
4.8.1 Baltic Sea
The Baltic Sea is a semi-enclosed sea, only connected to the North Atlantic via the Danish Straits.
Geographically, thus, its boundaries are well defined. The nine states that have coastal access to
the Baltic Sea are the main appropriators. However, the matter is complicated a bit by the fact that
in the Baltic Sea, parts are international waters,6 meaning that ships and vessels under all flags can
travel and appropriate it, and further it is one of the busiest maritime areas of the world (WWF
2013, p.7). Despite this, it should be relatively easy to define the boundaries of both appropriators
and resource unit withdrawal, for the latter provided that it would be possible to set limits of
resource unit withdrawal also for the parts of the Baltic Sea that are international waters. Also, the
fact that the entrance port to the Baltic Sea is very narrow means that it probably would be fairly
easy to control what ships and vessels (that are under non-Baltic Sea states flag) enter the Baltic
Sea. The assessment that HELCOM makes of the health of the Baltic Sea could be seen as a way
to define the resource units available, and in agreeing on nationally determined targets for emission
reductions the contracting states are in a way setting boundaries for resource unit withdrawal.
6
cf. map on < http://www.livinginthebalticsea.com/baltic_sea/files/bspas_2008web.jpg > [Accessed 18 May 2016]
26You can also read