Subtle Changes or Dramatic Perceptions of Air Pollution in Sydney during COVID-19 - MDPI
←
→
Page content transcription
If your browser does not render page correctly, please read the page content below
Article

Subtle Changes or Dramatic Perceptions of Air Pollution in
Sydney during COVID-19
Peter Brimblecombe 1,* and Yonghang Lai 2

                                         1 Department of Marine Environment and Engineering, National Sun Yat-Sen University,
                                           Kaohsiung 80424, Taiwan
                                         2 School of Energy and Environment, City University of Hong Kong, Hong Kong;

                                           yonghalai2-c@my.cityu.edu.hk
                                         * Correspondence: p.brimblecombe@uea.ac.uk

                                         Abstract: The COVID-19 pandemic made it critical to limit the spread of the disease by enforcing
                                         human isolation, restricting travel and reducing social activities. Dramatic improvements to air
                                         quality, especially NO2, have often characterised places under COVID-19 restrictions. Air pollution
                                         measurements in Sydney in April 2019 and during the lockdown period in April 2020 show reduced
                                         daily averaged NO2 concentrations: 8.52 ± 1.92 and 7.85 ± 2.92 ppb, though not significantly so
                                         (p1~.15) and PM2.5 8.91 ± 4.94 and 7.95 ± 2.64 µ g m−3, again a non-significant difference (p1~.18). Sat-
                                         ellite imagery suggests changes that parallel those at ground level, but the column densities aver-
                                         aged over space and time, in false-colour, are more dramatic. Changed human mobility could be
                                         traced in increasing times spent at home, assessed from Google Mobility Reports and mirrored in de-
                                         creased traffic flow on a major road, suggesting compliance with the restrictions. Electricity demand
                                         for the State of New South Wales was low under lockdown in early April 2020, but it recovered
                                         rapidly. Analysis of the uses of search terms: bushfires, air quality, haze and air pollution using
                                         Google Trends showed strong links between bushfires and pollution-related terms. The smoke from
                                         bushfires in late 2019 may well have added to the general impression of improved air quality during
Citation: Brimblecombe, P.; Lai, Y.      lockdown, despite only modest changes in the ground level measurements. This gives hints that
Subtle Changes or Dramatic               successful regulation of air quality requires maintaining a delicate balance between our social per-
Perceptions of Air Pollution in          ceptions and the physical reality.
Sydney during COVID-19.
Environments 2021, 8, 2.                 Keywords: Australia; bushfires; lockdown; public perception; social media; traffic; visibility
https://doi.org/10.3390/environ-
ments8010002

Received: 19 November 2020
                                         1. Introduction
Accepted: 29 December 2020
Published: 1 January 2021                      Dramatic improvements to air quality have often characterised places under COVID-
                                         19 lockdowns. The coronavirus (often called SARS-CoV-2) was identified in December
Publisher’s Note: MDPI stays neu-        2019 and the contagious nature of the virus was established shortly after [1]. It became
tral with regard to jurisdictional       critical to limit epidemic spread, so there was a growing need to enforce human isolation,
claims in published maps and insti-      restrict travel and reduce social activity [1]. The megacity of Wuhan was at the epicentre
tutional affiliations.                   of the outbreak and locked down on 23 January 2020, with other nearby cities nearby,
                                         namely, Huanggang, and Ezhou and Huangshi, following soon after [2]. Wuhan re-
                                         mained under lockdown until 8 April, though some cities of Hubei province opened ear-
                                         lier. In Beijing, a lockdown was not enforced, but following a two-day extension to the
Copyright: © 2021 by the authors.
                                         Chinese New Year holiday, there were pressures on the population to reduce activity and
Licensee MDPI, Basel, Switzerland.
                                         these more modest restrictions were seen widely across China [1]. Gradually, such re-
This article is an open access article
                                         sponses spread around the globe. Australia was no different, with the Government de-
distributed under the terms and con-
                                         claring a human biosecurity emergency on 18 March 2020. The New South Wales (NSW)
ditions of the Creative Commons At-
tribution (CC BY) license (http://cre-
                                         government increasingly strengthened restrictions in an extraordinary set of emergency
ativecommons.org/licenses/by/4.0/).
                                         orders through late March: “In what must be the most far-reaching legal instruction in

Environments 2021, 8, 2. https://doi.org/10.3390/environments8010002                                         www.mdpi.com/journal/environments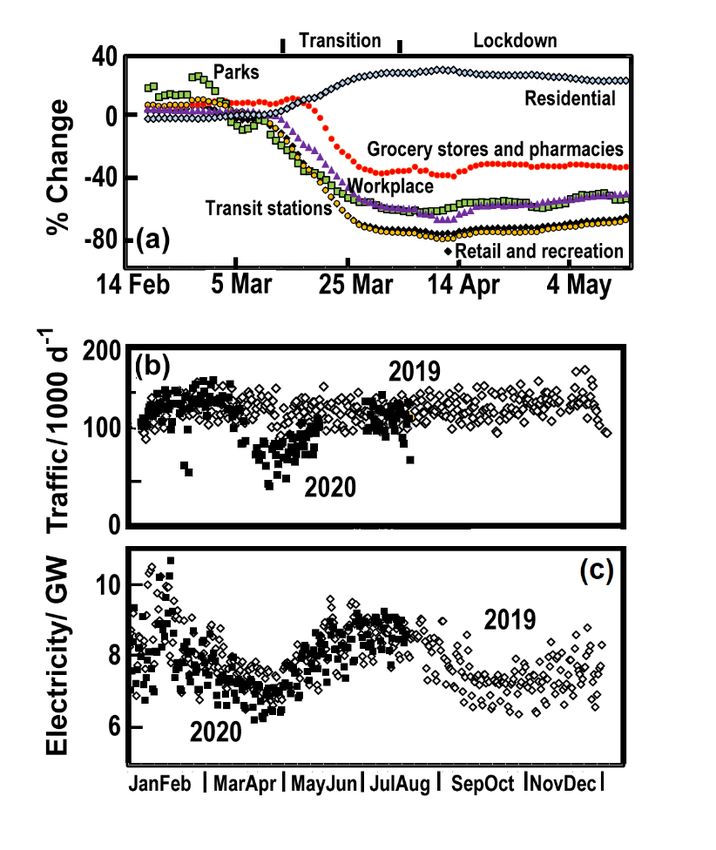
Environments 2021, 8, 2                                                                                          2 of 16

                          NSW’s history, the Minister for Health, Brad Hazzard, has now directed every person
                          within the state to remain in their residence” [3].
                                Limiting travel and human activity, during lockdown, reduced pollutant emissions.
                          Concentration reductions, especially of nitrogen dioxide (NO2), were observed in many
                          places: China [4–10], Korea [11], Europe [12,13], the United States [14] and South America
                          [15–17]. While such improvements in air quality were occasionally welcomed with posi-
                          tive and sometimes poetic phrases [7,18–20], the improvements are not evenly spread [21].
                          These are likely more nuanced than reported in the media [2,5], and not all cities experi-
                          enced declines in air pollution [22,23]. Some authors have drawn attention to potential
                          reductions in premature deaths as a result of improved air quality [24], though under
                          lockdown it seems likely that the exposure would not be well-represented by outdoor
                          measurements and there is a possibility of higher exposures indoors under lockdown [25–
                          27].
                                Air pollution studies during the pandemic are not always easy to evaluate, as these
                          have often reflected research at an early stage of an on-going crisis [28], with publications
                          difficult to assess because of an absence of statistics or stringent control for emission or
                          weather changes. While decreases in NO2 have been widely observed, these may not be
                          paralleled for particulate material, which may be complicated by secondary aerosols [29]
                          or sulphur dioxide, SO2 [30], while seasonal weather and changing chemistry can add
                          confusion [31]. Peak air pollution concentrations might remain [32] and increased ozone
                          levels that have accompanied the declines in nitrogen oxides (NOx) have been widely
                          discussed [33–35]. Enhanced ozone has also offered the possibility that secondary aerosol
                          concentrations would additionally increase, reminding us that emission and pollution is
                          often linked by a complicated chemistry [5,35]. Some authors, additionally suggest that
                          emissions might increase, as public transport is restricted [36].
                                Sydney, Australia represents an interesting case to study, as it had an increasingly
                          stringent lockdown from mid-March, which was eased on 15 May. The restrictions fol-
                          lowed a period of poor air quality because of bushfires late in 2019 [37,38]. Although me-
                          dia reports note Sydney’s improved NO2 from satellite imagery, some suggest that pollu-
                          tion under lockdown in Melbourne and Perth might not have improved [39]. Most studies
                          on the impact of COVID-19 on air quality have focused on cases where improvements
                          have been dramatic, so here we address a case where change has been subtler. This paper
                          examines NO2, PM2.5, CO, SO2 and O3 (where PM2.5 refers to particles less than 2.5 microns
                          across, CO refers to carbon monoxide and O3 refers to ozone), and considers what might
                          have influenced the modest improvements seen in Sydney. We are additionally concerned
                          with the relevance of social change and perceptions as portrayed on social media and
                          within journalism and have become interested in the enthusiasm with which air quality
                          improvements have been greeted, even where changes have probably been small.

                          2. Materials and Methods
                                This study focuses on Sydney, where there is a metropolitan population of more than
                          five million in an urban area covering some 12,400 km2. The air pollution data come from
                          official records from monitoring stations in and around the city. We used data from 2019
                          and 2020 through to the end of July; records are available at hourly intervals for six pollu-
                          tants: NO2, PM2.5, CO, SO2 and O3, along with nephelometric measurements of visibility.
                          The more centrally located sites used here are: Randwick, Rozelle, Liverpool, Bringelly,
                          Chullora, Earlwood, Richmond, Bargo, St Marys, Parramatta North, Oakdale, Prospect,
                          Campbelltown West, Camden, Macquarie Park, Rouse Hill and Cook & Phillip (Figure 1).
                          Records are not always complete: data for Rouse Hill and Cook & Phillip were not avail-
                          able for the early part of 2019. Carbon monoxide and sulphur dioxide had additional sites
                          where data were not available. When comparing data sets, it became important to check
                          that there were no large amounts of missing data, though we should note that five stations
                          (Lindfield, Vineyard, MacArthur, Rouse Hill and Cook & Phillip) often had to be omitted
                          when comparing the two years because of gaps in the data.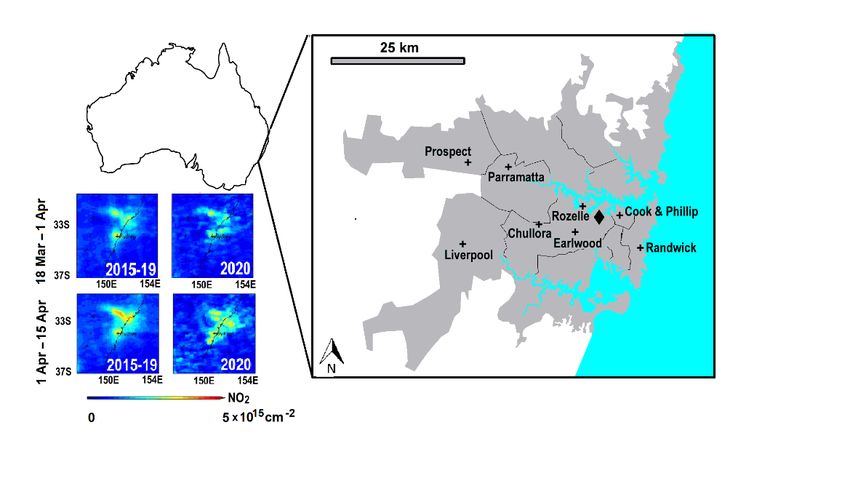
Environments 2021, 8, 2                                                                                                 3 of 16

                          Figure 1. Map of the study area shows the sites in the inner parts of Sydney used in this study. The
                          diamond marks the location traffic count data on the Western Distributor Road. The block of four
                          images show the NO2 Aura/OMI column densities across the beginning of lockdown.

                               A range of online sources were used to access data in this project. This included air
                          pollution measurements, satellite products and social and economic data available from
                          the URLs below:
                          1.   Concentration measurements are available from official air quality monitoring sites:
                               https://www.dpie.nsw.gov.au/air-quality/air-quality-data-services/data-download-
                               facility
                          2.   The satellite observations are available from the Copernicus Sentinel-5P Mapping
                               Portal: https://maps.s5p-pal.com/ and also https://so2.gsfc.nasa.gov/no2/no2_in-
                               dex.html
                          3.   Counts to establish traffic flow are provided by Transport for NSW:
                               https://opendata.transport.nsw.gov.au/node/2171/exploreapi
                          4.   Electricity generation data are available from the Australian Energy Market Opera-
                               tor:
                               https://www.aemo.com.au/energy-systems/electricity/national-electricity-market-
                               nem/data-nem/aggregated-data
                          5.   The number of COVID-19 cases in Sydney extracted from statistics are available from
                               the NSW Government: https://data.nsw.gov.au/data/dataset/covid-19-cases-by-loca-
                               tion
                          6.   Google        Community         Mobility      Reports      are     available      at:
                               https://www.google.com/covid19/mobility
                          7.   Google trends was accessed using search terms at: https://trends.google.com/

                               Convenient images and data were not always available in periods that overlapped,
                          so occasionally we have had to change time windows, as noted in the text. Data analysis
                          used simple UNIX scripts and statistical calculations took advantage of the online calcu-
                          lators in Vassarstat (http://vassarstats.net/) and WessaNet v.1.2.1 [40]. The t-test adopted
                          was Welch’s form as appropriate for unequal variance. Where the number of data ele-
                          ments were small or ordinal, non-parametric techniques were used, notably the Kendall
                          rank correlation coefficient (statistic τ) and the Wilcoxon signed-ranks test (statistic W).
                          Pollution measurements from sites were often used as a daily average, but only retained
                          when more than 20 h was available, except when relaxed for the non-parametric Wilcoxon
                          signed rank test, where it was 15 h.
Environments 2021, 8, 2 4 of 16
The lockdown period started on 16 March 2020, followed by an increasingly stringent
set of restrictions imposed under no less than seven NSW Public Health Orders; the final,
and most restrictive, came into effect on 31 March. There was some easing on 15 May, and
by 13 June, private homes could have as many as 20 visiting guests. From 1 July, there was
further easing, although it became rather more restrictive again on 17 July [3], because of
an increase in cases, which meant, for example, new rules for pubs being introduced.
3. Results
The results presented here consider concentration changes over from March 2019 to
July 2020, a point at which the first wave of infections was largely over, and compare those
under lockdown with column densities for NO2. These are then compared with percep-
tions and mobility changes over the lockdown period.
3.1. Ground Level Pollutant Concentrations
The average concentrations NO2 across Sydney are shown in Figure 2a, with the
standard deviation bounded by a light grey line. The hourly values are smoothed as a 25-
point running mean of hourly data to reflect roughly daily averages. It is always difficult
to ascertain whether year-to-year differences arise from weather change or emissions [5],
so caution is needed in subsequent interpretation. Nevertheless, the figure suggests that
the period of lockdown in 2020 has concentrations that are a little lower. Air quality im-
provements under lockdown have often compared values with those of earlier years, fre-
quently presented as satellite images [6], which give a strong visual confirmation of
change (block-of-four satellite images in Figure 1). Even with NO2, the most sensitive
marker of change, the declines seen in ground level measurements under lockdown may
be subtle [2,13,21,41,42]. Welch’s t-test suggests that Sydney’s daily averages for April in
2019 and the same month of 2020 are not significantly different (p1~.15), although the mean
concentrations 8.52 ± 1.92 and 7.85 ± 2.92 ppb would suggest a modest improvement, dur-
ing this period of stringent lockdown. Comparisons between the two years may be unre-
liable because some 20% of the data are missing. However, we were reassured that an
additional station-by-station analysis (individual details see Table A1) examining only
those days where > 15 h of data are available, showed that the median daily values were
lower in 2020, for only 9 of the 15 sites.Environments 2021, 8, 2 5 of 16
Figure 2. The 25 h running mean of (a) NO2, (b) PM2.5, (c) CO, (d) SO2 and (e) O3 concentrations across Sydney from March
2019 to July 2020. The grey lines mark the standard deviation (negative values not plotted). Note: lockdown period marked
as grey bar and the period of bushfires by the horizontal line in (b), see [38] for details.
A similar situation over lockdown pertains to daily average PM2.5 concentrations as
illustrated in Figure 2b, with the April differences between 2019 and 2020, 8.91 ± 4.94 and
7.95 ± 2.64 µ g m−3, but again, these are not significantly different (p1~.18). The bushfires
from November 2019 had a detrimental effect on air quality [43], with a set of increasinglyEnvironments 2021, 8, 2 6 of 16
higher and more frequent peaks in PM2.5 over Sydney through November, becoming al-
most continuous in December. Figure 2c suggests a small respite towards the end of De-
cember, but further increases over the last few days of the year, which are also seen in the
record from TropOMI described by Khaykin et al. [38]. They observed a peak in the aero-
sol absorbing index off the East Australian Coast (150–155° E, 20–40° S) on 22 December
with a gap and then a further peak on 31 December, declining through the first week of
January. The ground level measurements of Ulpiani et al. [43] detail the changes in Sydney
across the period of 20 December 2019 until 13 January 2020, and show slight decreases in
PM10 over the Christmas period, but higher concentrations into the New Year. While the
spatial extent and averaging times between the ground level and satellite measurements
are different, they show a satisfying agreement.
We can also see the effect of bushfires on the CO concentrations, as shown Figure 2c.
The CO data assembled from the 11 monitoring sites are rather patchy, but CO is often
fairly evenly spread across cities, so the picture is probably a coherent one, despite the
missing data. The differences in CO in April for 2019 and 2020 are 0.227 ± 0.049 and 0.201
± 0.040 ppm, respectively, with Welch’s t-test suggesting a significant decrease (p1 = 0.013).
This is a clear change over a year, but hardly convincing, as such short periods could
readily differ from one year to the next. Although a comparison with the previous year
has been a popular tool to show the effect of emission reductions under lockdown, it fails
to account for weather differences between years. It can be argued that daily and weekly
cycles may be less sensitive to this [42]. There are hints of shifts in the diurnal cycle, alt-
hough these are slight in most cases for the Sydney data. However, in the case of a few
individual sites, there appears to be a loss of the broad peak across the morning, which
might suggest changes that resulted from the lockdown, but by-and-large, these remained
unconvincing. There is a slight decrease in SO2 between 2019 and 2020 (Figure 2d): 0.60 ±
0.41 and 0.48 ± 0.38 ppb, respectively, but the t-test suggests this is not significant (p1~.13).
Ozone shows a slight, though barely significant (p1~0.09) increase from 14.2 ± 3.3 to 15.4 ±
3.5 ppb (Figure 2e), as often observed because of decreasing NOx emissions under lock-
down.
3.2. Column Density From Satellite Observations
Early observations of the impact of lockdown on air pollution often came from col-
umn density as measured by satellite [6,9,44]. These frequently relied on the TropOMI
instrument on the sun-synchronous Sentinel-5 Precursor satellite, which has an overpass
time of 13:30. TropOMI uses a range of wavelengths to provide measurements for a range
of pollutants such as: O3, NO2, SO2, CO and aerosols with daily coverage at a maximum
3.5 km × 5.5 km resolution. The measurements are usefully averaged over longer times
(i.e., two weeks and part of the satellite product) and for NO2, which has generally been
studied because the changes are clearest [6]. The 15-day averaged images over the lock-
down period are plotted in Figure 3a–e. There appears to be a dramatic visual decline in
Sydney from late March (15–30) into early April, although column densities returned to
higher values later in the month. These were well-reported in the media, e.g., The Conver-
sation [39]. However, these changes were not universal, and by contrast, The Conversation
noted that NO2 increased by 20% for Newcastle, with the country’s largest concentration
of coal-burning heavy industry, increasing by 40% for Melbourne, a sprawling city
strongly dependent on cars, whereas Perth showed no real change.Environments 2021, 8, 2 7 of 16
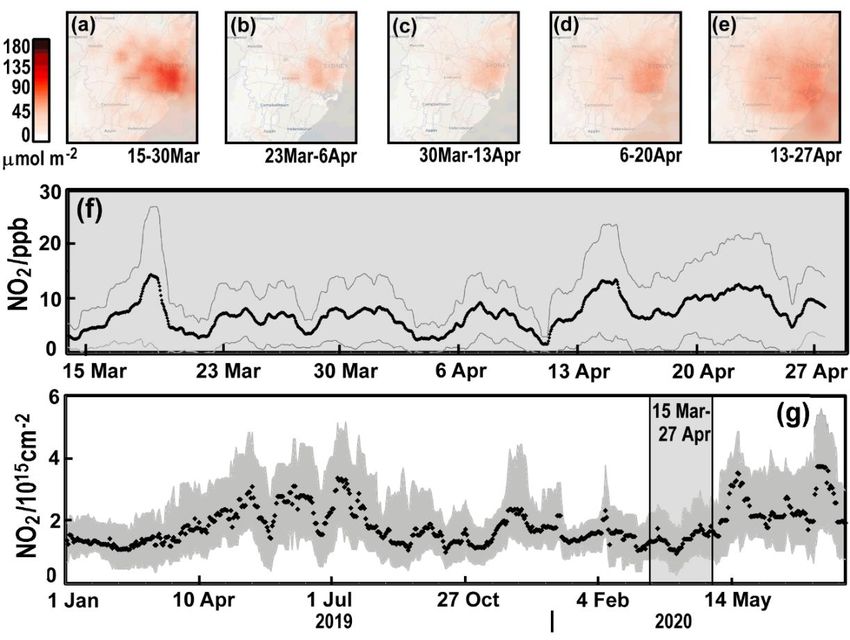
Figure 3. Satellite imagery of the NO2 column density over the Sydney area from the Sentinel 5P
TropOMI instrument for the dates (a) 15–30 March, (b) 23 March–6 April, (c) 30 March–13 April,
(d) 6–20 April and (e) 13–27 April; (f) the 25-h running mean of surface NO2 concentrations across
the Sydney sites and (g) measurements of column density of NO2 from across the period January
2019 to July 2020 from the Aura OMI system.
Satellite products are atmospheric column measurements that have a different spa-
tio-temporal resolution compared with ground level measurements. Thus, they may not
capture just how variable ground level concentrations may be (Figure 3f). As noted in the
previous section, the lockdown period is not especially distinctive in terms of ground level
concentrations, although ground level NO2 was low in early April and the 10–13th of
April, which corresponds with the Easter holidays. There are some gaps in the instrumen-
tal record in the first days of April, though it is likely that the concentrations of NO2 were
nevertheless rather low, as illustrated in Figure 3f. The general impression given by the
satellite maps agrees with the measured ground level trend, i.e., low concentrations in
early April, rising later that month. The column density of NO2 over longer periods is
given in Figure 3g, which reminds us that these vary and show a distinct seasonality (i.e.,
higher in winter than summer). This might explain the rise in concentrations throughout
April. The inset to Figure 3g for the 46-day period covering the five TropOMI maps shows
that ground level daily average NO2 concentrations for Sydney are well-correlated (Ken-
dall τ = 0.38, p < 0.00025), with median daily column densities from the Aura OMI system
[45].
Satellite imagery can be very dramatic, with vivid colours contributing to an impres-
sion of a “vastly lower concentration of air pollution” under lockdown [39], even though
the changes might in reality be quite modest. This may have arisen from the saturated
colours associated with published images, and perhaps also because of the smooth inte-
gration of NO2 across time and space. These might enhance an impression of change.Environments 2021, 8, 2 8 of 16
3.3. Emissions, Human Mobility and Electricity Production
A key reason to expect air quality to improve under lockdown is the reduction in
emissions from industry and transport, although many accounts do not present detailed
values for these reductions. The tabulation found in Kumar et al. [46] suggests that papers
discussing emission reduction may take measurements of concentration or column den-
sity reduction as the indicator, rather than determine emissions independently. Many per-
haps seeing reductions under lockdown as inevitable. However, Li et al. [47] estimated
emission reductions across the Yangtze River Delta during restrictions where vehicle
emission reduced by three quarters, while stationary sources were down only a third. Hu-
man mobility is a key element to changes under lockdown, though understandably, some
sources, such as domestic cooking emissions, are likely to increase. Emissions from Syd-
ney are available in detail for 2013 [48], but as the reports take many years to generate, it
represents the most recent set of consolidated results for natural and human-made emis-
sions. We can see from Table 1 that traffic emissions represent almost half of the source
for CO and NOx, but represents only ~10% of the particulate emissions. Some 5000 tonne
PM2.5 comes each year from domestic solid fuel combustion and represents just over half
the total emissions in Sydney.
Table 1. Total estimated emissions (units: Mg a−1 i.e., tonne per annum) and percentage of total in
parentheses from in Sydney for 2013 extracted from Air Emissions Inventory for the Greater Metropol-
itan Region in New South Wales, NSW Environment Protection Authority, Sydney. EPA 2019P1917.
Domestic
Commercial Industrial Off-Road On-Road Total
Commercial
CO 320 (< 1) 90,299 (43) 5968 (3) 22,465 (11) 91,239 (43) 210,291
NOx 359 (1) 2701 (5) 7387 (13) 15,734 (27) 32,496 (55) 58,676
PM10 682 (4) 5744 (37) 6040 (39) 1111 (7) 1838 (12) 15,415
PM2.5 291 (3) 5517 (55) 1824 (18) 1034 (10) 1279 (13) 9945
SO2 79 (1) 124 (1) 3057 (30) 6790 (67) 98 (1) 10,148
Even under the limited January lockdown in Guangdong Province, far from the
COVID-19 epicentre in Wuhan, residents still cancelled unnecessary trips [49], so changes
in human mobility are readily affected by social pressures. Traffic restrictions were wide-
spread [36] and in Beijing, where limited areas of the city were closed after a COVID-19
outbreak at Xinfadi Market in April, mobile phone data suggest wider reductions in ac-
tivity across the city; at shopping malls and amusement parks [50]. The changing location
of Sydney residents (Figure 4a) can be explored using Google’s Community Mobility Re-
ports, which aggregate anonymised sets of hourly data from users with Location History
set on. The normalised output shown has been smoothed with a 7-day running mean to
remove the weekly cycle. Time spent at home rose in the first weeks of March, the very
beginning of the lockdown, even though it was not initially very stringent. Through the
second half of March, there was a transition to tougher restrictions. Australians spent 25%
of their time working and commuting, ~10% on recreational activities, 15% at home (social
media, TV etc.) and 30% sleeping, with domestic duties and recreation taking 20% [51].
This means that two-thirds of their time was already spent at home, so a 30% change is
substantial, and indicates that Sydney residents were most likely at home. This makes the
concerns of Ezani et. al. [25] over the exposure to air pollutants in the domestic environ-
ment seem quite reasonable. The proportion of time spent at home grew gradually as Pub-
lic Health Orders became stricter; by the 4th Order of 23 March, social life in the city was
virtually suspended. Time-at-home reached a plateau at the beginning of April after a
final Order was put in place on 31 March. However, there are hints that people were al-
ready aware of the significance of changes underway. The use of the transit system and
parks declined just prior to mid-March and time in the workplace soon after. Shopping
for grocery and pharmaceutical items showed a positive peak centred around the week-
end of 14–15 March, only to decline a little later, lagging by a week or more comparedEnvironments 2021, 8, 2 9 of 16
with other reductions. Overall, the picture is one that suggests a large degree of compli-
ance.
Figure 4. (a) Changing location of residents of Sydney using Google’s Community Mobility Re-
ports, showing percentage change at various sites. (b) The daily traffic flow in both directions
along Sydney’s Western Distributor in 2019 and the first part of 2020. (c) Average daily power
output for New South Wales for both 2019 and 2020. Note: in (b) and (c), 2019 is represented with
open white diamonds and 2020 with filled squares.
The changed mobility was also reflected in decreased traffic flow from a vehicle cen-
sus on the Western Distributor (marked as a diamond in Figure 1), as shown in for 2019
(Figure 4b) and 2020 (Figure 4c), suggesting a 50% decrease as restrictions were imple-
mented. Even by the end of June, traffic flow had not fully recovered; this slow recovery
has been observed elsewhere [50]. There is also a general perception that industrial emis-
sions would drop, though clearly electricity supply is still needed at perhaps only a
slightly reduced amount even under lockdown. In Sydney the five coal generating plants,
though 90–240 km distant, were often seen as a contributor to the city’s air pollution.
However, two of the four units at Liddell (170 km distant) were out of action and one at
the nearby Bayswater power station (240 km distant). Over four hours of Easter Saturday
(11 April), renewable energy provided more than half of the power for the electricity mar-
ket. The demand for the State of New South Wales was low, under the restriction in early
April, as seen in Figure 4c although recovery was rapid. Overall, the traffic patterns and
their emissions changed in Sydney during lockdown, but energy generation shows lower
emissions. As a public heath response, lockdown achieved some success, with the number
of new COVID-19 cases falling dramatically by April 14, although Australia and New
Zealand continued to impose tight restrictions on travel and public gatherings.Environments 2021, 8, 2 10 of 16
3.4. Icons and Media Visions
The notion that air pollution was reduced by the COVID-19 pandemic [6] is widely
spread within the popular media. It seemed likely that the public viewpoint was shaped
by journalism, although Sekar et al. [52] claimed otherwise for the Indian population in
their paper on public perception of air quality during COVID-19: “It is evident that the
respondents perceived improvement in air quality without the influence of media”. The
argument about an improved environment has been extended with the view that many
lives were saved through improved air quality [24,53]. This has gained support from aca-
demic articles, so it is seen to represent a silver lining to clouds of COVID despair [7,18–
20]. Nevertheless, a number of papers have questioned the universality of such visions
and regard improvements in air pollution as more nuanced than portrayed by the media
(e.g., [7]), with health benefits overstated or in need of more rigorous analysis and clear
caveats [28,54–56].
The acceptance of greatly improved air quality was potentially aided by some iconic
satellite imagery that matches the eye-catching colours of the ozone hole; a seemingly in-
delible and well-accepted icon [57]. Such imagery has been frequently used in media rep-
resentations as a graphic illustration of change, with false-colour representations surpris-
ingly readable [58]. However, satellite images represent column densities, and in the case
of media presentations during COVID-19, they were smoothed over large areas across
many days (e.g., [39]). This means that although these gave a good sense of longer-term
change in emissions, the published satellite imagery might not represent day-to-day
changes in perceived visibility, or even less, the hour-long ground level exposure to NO2
relevant to health concerns. Nevertheless, the vivid nature of the imagery often looks so
convincing that it may inhibit extended reflection on the subtly of the changes and the
high degree of variation.
The impression of change to air quality in Sydney may have been enhanced by con-
trast with that experienced during the extensive bushfires of late 2019. Pictures of Sydney
obscured by smoke were widely shared by the global media. There were near-apocalyptic
images of Sydney’s famous Harbour Bridge and Opera House under orange skies, along
with pictures of rescued koalas that have become indelibly linked to the period. Visibility
can be a key perception for the public in defining air pollution [59]. During the lockdown
in April, media comments drew attention to Sydney’s air, which had recovered from the
smoke of previous months. Journalist Peter Hannam [37], wrote that the “virus and fa-
vourable weather delivers clear skies over Sydney”, while acknowledging bushfires had
been important in generating high PM2.5 concentrations. The dramatic changes must have
made it easy to see lockdown as a time of cleaner air, a case well-supported by satellite
imagery and Figure 2b, where we can see rapid changes between bad days and days that
were less affected.
The media also reflected on the lockdown period as a catalyst for wider environmen-
tal and social change once the pandemic ends [60]. People potentially have more time for
reflection on environmental issues under lockdown, when they are distanced from the
hustle-and-bustle of daily life. In addition, as often reported in the media, lockdown has
led to some improvements in the natural world, with more wild-flowers and animals [61].
Equally, any recovery may bring with it increased pressure on the environment; there is,
rightly, public cynicism about short-term responses to improving environmental quality
[59].
3.5. Popular Opinion
The lockdown period may have been one where the balance of perceptions of air
pollution was different. This was explored using Google Trends, which determines the fre-
quency of search queries on Google. Some of these search terms are compared with the
daily number of cases in Sydney in Figure 5.Environments 2021, 8, 2 11 of 16
Figure 5. (a) The daily number of COVID-19 cases in Sydney. Normalised weekly search terms from Google Trends for
New South Wales for (b) “Coronavirus” (c) “bushfire” (d) “air quality” with an inset histogram of assessment of air pol-
lution before (grey) and after (white) lockdown; (e) search terms “haze” and “air pollution” and a light-coloured line
denoting extinction coefficient (units: Mm−1) estimated from a visual range; (f) search term “PM2.5” and a light-coloured
line denoting the average daily PM2.5 concentration (units: µ g m−3). The inset to (f) shows the extinction coefficient (y-axis:
0–8 Mm−1) as a function of the daily mean PM2.5 for Sydney (x-axis: 0–150 µ g m−3).
Although the search terms usage comes from NSW, the data are useful here, as a
large proportion are from Sydney and nearby Wollongong. Not surprisingly, the search
term “coronavirus”, matches, and perhaps even slightly precedes, the rising number of
cases in Sydney. Google Trends suggests that while searches rose very steeply during lock-
down (Figure 5b), they fell during lockdown, only to rise again from late June, showing
that interest persisted, as the crisis was global and concern grew about a second wave.
Australia has had a second wave, but this was seen mostly in Melbourne [62]. While Syd-
ney experienced only modest changes, it was anxious to avoid the second wave found in
Melbourne. A small number of cases derived from Victoria were found in Sydney by July.Environments 2021, 8, 2 12 of 16
“Bushfires” as a search term (Figure 5c) proves contemporaneous with the term “air
quality” (Figure 5d) and are associated with the fires late in 2019. Barbieri et al. [63] sur-
veyed pre- and post-lockdown perceptions of air quality in: Australia, Brazil, China,
Ghana, India, Iran, Italy, Norway, South Africa and the United States using an online
questionnaire hosted on two platforms: Google Forms and Wen Juan Xing. Globally citizens
did not regard the amount of air pollution as high during the COVID-19 restrictions. This
was also clear in NSW (inset to Figure 5d), where on the Likert scale used in the survey,
there is a decline in the number of respondents reporting high or average air quality after
the lockdown was in place. A pairwise comparison was significant (n = 113; W = 3637; p1 <
0.0001). A single respondent thought air pollution had become worse, though 27 thought
there was no difference. Elsewhere in Australia, people generally believed air pollution
had improved (n = 274; W = 13372; p1 < 0.0001), though a larger proportion (40%) than in
Sydney thought it unchanged.
The terms “haze” and “air pollution” (Figure 5e), though spread more widely over
time, were frequent over the period of intense fires. There is a satisfying relationship be-
tween these terms and the extinction coefficient (inverse of visibility) measured by neph-
elometry at the air pollution monitoring sites (shown as a light-coloured line). The more
specific term “PM2.5” (Figure 5f) is associated with the bush fires, but it shows up in a
number of other periods where the search term was used at higher frequency; thus, there
may be some association with the lockdown. The daily PM2.5 concentrations (light-col-
oured line) and the inset shows an excellent agreement between particulate concentrations
and the extinction coefficient, as has often been observed [64]. The strong links between
the terms bushfire smoke, visibility, PM2.5 and air quality at the end of 2019 may well have
added to an impression of improved air quality during lockdown. However, there ap-
peared by comparison only a weak association with air pollution searches using the terms
“air quality”, “haze” and “air pollution” during lockdown. Neither the search terms
“NO2” or “nitrogen dioxide” showed any trends or peaks in NSW across the period and
few searches relate to “Tropomi”, “Copernicus” or “Sentinel” in Australia.
4. Conclusions
Emission reductions under lockdown and other restrictions has generally led to de-
creases in primary air pollutants, most evident in NO2. The changes in other pollutants
such as PM2.5, CO and SO2 may have been more variable, and regionally, O3 was typically
observed to increase. Given the relatively low level of pollutants in Australia, it is not
surprising that improvements were modest under lockdown, even though the population
was largely compliant in terms of reduced mobility. It may be argued that the magnitude
of emission driven-changes might be obscured by seasonal or year-to-year variations in
weather. However, the perceptions of air quality at interest here relate to the concentra-
tions experienced (as in Figure 2) and naturally make no allowance for weather change.
A significant fraction of the Australians surveyed thought air pollution had improved
during lockdown.
The extent of perceived improvement in air quality may have been emphasised by
the widely distributed satellite imagery from around the globe. False-colours may have
added drama to the change, especially given that satellite column densities have a spatio-
temporal resolution that differs from ground level. Residents of Sydney might have, very
reasonably, made a comparison between the sparkling air during lockdown and the bush-
fire haze just a few months earlier. This link emerges in the analysis of search terms from
Google Trends. There may also have been a natural desire to accept stories of an improved
environment at a time of crisis. The work presented here should remind us that air pollu-
tion is as much an event of society, as it is one of emissions and meteorology. Successful
regulation of air quality likely requires maintaining a delicate balance between our social
perceptions and physical reality.Environments 2021, 8, 2 13 of 16
Author Contributions: Conceptualisation, methodology and review and editing, P.B. and Y.L.;
formal analysis, P.B.; data curation, Y.L. All authors have read and agreed to the published ver-
sion of the manuscript.
Funding: This research received no external funding.
Institutional Review Board Statement: Not applicable.
Informed Consent Statement: Not applicable.
Data Availability Statement: Not applicable.
Conflicts of Interest: The authors declare no conflict of interest.
Appendix A
Table A1. (ppm) and PM2.5 (µ g m−3), with more than 15 h of data, from the site for the month of April in 2019 and 2020
along with the p values associated with the difference between the means determined from Welch’s t-test.
Site 2019 2020 t-test 2019 2020 t-test
cNO2 σNO2 cNO2 σNO2 pNO2 cPM2.5 σPM2.5 cPM2.5 σPM2.5 pPM2.5
Randwick 9.83 3.96 8.37 4.19 0.1371 9.58 5.29 8.22 3.21 0.120
Rozelle 10.69 3.13 10.34 4.75 0.3740 8.80 4.82 7.11 3.20 0.059
Liverpool 13.02 2.45 12.90 5.10 0.4545 10.66 6.94 9.22 3.94 0.163
Bringelly 5.29 1.60 5.21 1.32 0.4307 7.93 4.00 8.48 3.34 0.285
Chullora 11.99 2.62 12.73 4.17 0.2313 10.19 7.60 7.95 3.13 0.082
Earlwood 10.86 2.44 10.24 4.71 0.2729 9.21 6.31 7.39 3.56 0.089
Richmond 4.79 1.10 3.58 1.15 0.0004 8.12 3.46 8.90 3.39 0.197
Bargo 7.93 2.35 8.60 3.99 0.2560 9.50 6.87 7.16 2.76 0.050
St Marys 4.68 1.77 5.58 1.68 0.0398 7.35 2.90 8.22 2.72 0.129
Parramatta 10.88 2.68 9.42 2.84 0.0294 7.56 3.77 7.36 2.97 0.413
Oakdale 2.29 0.92 2.33 1.10 0.4507 8.31 3.94 9.52 1.87 0.079
Prospect 10.16 2.64 9.97 3.02 0.4071 9.34 4.22 8.57 3.98 0.237
Campbelltown 11.15 2.22 12.53 4.54 0.0799 12.99 12.17 7.75 2.96 0.021
Camden 5.53 1.78 4.60 2.08 0.0430 9.53 10.08 8.12 2.81 0.238
Macquarie 5.70 2.21 4.92 1.81 0.0780 6.82 3.24 6.22 2.62 0.216
References
1. Leung, K.; Wu, J.T.; Liu, D.; Leung, G.M. First-wave COVID-19 transmissibility and severity in China outside Hubei after control
measures, and second-wave scenario planning: A modelling impact assessment. The Lancet. 2020, 395, 1382–1393.
2. Brimblecombe, P.; Lai, Y. Effect of fireworks, Chinese New Year and the COVID-19 lockdown on air pollution and public atti-
tudes. Aerosol Air Qual. Res. 2020, 20, 2318–2331, doi:10.4209/aaqr.2020.06.0299.
3. Mills Oakley, Melbourne. Available online: https://www.millsoakley.com.au/thinking/nsw-under-official-lockdown-full-de-
tails-of-new-government-directions-now-published/ (accessed on 1 January 2021).
4. Bao, R.; Zhang, A. Does lockdown reduce air pollution? Evidence from 44 cities in northern China. Sci. Total Environ. 2020, 731,
139052, doi:10.1016/j.scitotenv.2020.139052.
5. Fan, C.; Li, Z.; Li, Y.; Dong, J.; van der A, R.; de Leeuw, G. Does reduction of emissions imply improved air quality? Atmos.
Chem. Phys. Disc. 2020. doi.org/10.5194/acp-2020-1101
6. Dutheil, F.; Baker, J.S.; Navel, V. COVID-19 as a factor influencing air pollution? Environ. Pollut. 2020, 263, 114466.
7. Muhammad, S.; Long, X.; Salman, M. COVID-19 pandemic and environmental pollution: A blessing in disguise? Sci. Total En-
viron. 2020, 728, 138820.
8. Pei, Z.; Han, G.; Ma, X.; Su, H.; Gong, W. Response of major air pollutants to COVID-19 lockdowns in China. Sci. Total Environ.
2020, 743, 140879.
9. Wang, Q.; Su, M. A preliminary assessment of the impact of COVID-19 on environment–A case study of China. Sci. Total Envi-
ron. 2020, 728, 138915.
10. Yue, X.; Lei, Y.; Zhou, H.; Liu, Z.; Letu, H.; Cai, Z.; Lin, J.; Jiang, Z.; Liao, H. Changes of anthropogenic carbon emissions and
air pollutants during the COVID-19 epidemic in China. Trans Atmos Sci. 2020, 43, 265–274.
11. Seo, J.H.; Jeon, H.W.; Sung, U.J.; Sohn, J.R. Impact of the COVID-19 Outbreak on Air Quality in Korea. Atmos. 2020, 11, 1137.Environments 2021, 8, 2 14 of 16
12. Menut, L.; Bessagnet, B.; Siour, G.; Mailler, S.; Pennel, R.; Cholakian, A. Impact of lockdown measures to combat Covid-19 on
air quality over western Europe. Sci. Total Environ. 2020, 741, 140426.
13. Tobías, A.; Carnerero, C.; Reche, C.; Massagué, J.; Via, M.; Minguillón, M.C.; Alastuey, A.; Querol, X. Changes in air quality
during the lockdown in Barcelona (Spain) one month into the SARS-CoV-2 epidemic. Sci. Total Environ. 2020, 726, 138540.
14. Berman, J.D.; Ebisu, K. Changes in US air pollution during the COVID-19 pandemic. Sci. Total Environ. 2020, 739, 139864.
15. Dantas, G.; Siciliano, B.; França, B.B.; da Silva, C.M.; Arbilla, G. The impact of COVID-19 partial lockdown on the air quality of
the city of Rio de Janeiro, Brazil. Sci. Total Environ. 2020, 729, 139085.
16. Nakada, L.Y.K.; Urban, R.C. COVID-19 pandemic: Impacts on the air quality during the partial lockdown in São Paulo state,
Brazil. Sci. Total Environ. 2020, 730, 139087.
17. Pacheco, H.; Díaz-López, S.; Jarre, E.; Pacheco, H.; Méndez, W.; Zamora-Ledezma, E. NO2 levels after the COVID-19 lockdown
in Ecuador: A trade-off between environment and human health. Urban Clim. 2020, 34, 100674.
18. Huang, L.; Liu, Z.; Li, H.; Wang, Y.; Li, Y.; Zhu, Y.; Ooi, M.C.G.; An, J.; Shang, Y.; Zhang, D.; et al. The silver lining of COVID-
19: Estimation of short-term health impacts due to lockdown in the Yangtze River Delta region, China. GeoHealth. 2020, 4,
e2020GH000272.
19. Lal, P.; Kumar, A.; Kumar, S.; Kumari, S.; Saikia, P.; Dayanandan, A.; Adhikari, D.; Khan, M.L. The dark cloud with a silver
lining: Assessing the impact of the SARS COVID-19 pandemic on the global environment. Sci. Total Environ. 2020, 732, 139297.
20. Ramasamy, D.; Jayakumar, S.; Somasundaram, M. Enchanted Improvements in Air Quality across India-A Study from COVID-
19 Lockdown Perspective. Adalya 2020, 9, doi:10.37896/aj9.5/013.
21. Schiermeier, Q. Why pollution is plummeting in some cities-but not others? Nature 2020, 580, 313.
22. Rodríguez-Urrego, D.; Rodríguez-Urrego, L. Air quality during the COVID-19: PM2. 5 analysis in the 50 most polluted capital
cities in the world. Environ Pollut. 2020, 266, 115042.
23. Shrestha, A.M.; Shrestha, U.B.; Sharma, R.; Bhattarai, S.; Tran, H.N.T.; Rupakheti, M. Lockdown caused by COVID-19 pandemic
reduces air pollution in cities worldwide. Eartharxi 2020, doi:10.31223/osf.io/edt4j.
24. Karuppasamy, M.B.; Seshachalam, S.; Natesan, U.; Ayyamperumal, R.; Karuppannan, S.; Gopalakrishnan, G.; Nazir, N. Air
pollution improvement and mortality rate during COVID-19 pandemic in India: Global intersectional study. Air. Qual. Atmos.
Health. 2020, 13, 1–10.
25. Ezani, E.; Brimblecombe, P.; Asha’ari, Z.H.; Fazil, A.A.; Ismail, S.N.S.; Ramly, Z.T.A.; Khan, M.F. Indoor exposure to PM2.5
during COVID-19 lockdown in suburban Malaysia, Aerosol Air Qual. Res. 2020, 20, doi:10.4209/aaqr.2020.07.0476.
26. Nwanaji-Enwerem, J.C.; Allen, J.G.; Beamer, P.I. Another invisible enemy indoors: COVID-19, human health, the home, and
United States indoor air policy. J. Expo. Sci. Environ. Epidemiol. 2020, 30, 773–775. doi:10.1038/s41370-020-0247-x.
27. Saha, J.; Chouhan, P. Indoor air pollution (IAP) and pre-existing morbidities among under-5 children in India: Are risk factors
of coronavirus disease (COVID-19)? Environ. Pollut. 2020, 266, 115250.
28. Heederik, D.J.; Smit, L.A.; Vermeulen, R.C. Go slow to go fast: A plea for sustained scientific rigour in air pollution research
during the COVID-19 pandemic. Eur Respir. J. 2020, 56, 2001361.
29. Zhu, S.; Wang, Q.; Qiao, L.; Zhou, M.; Wang, S.; Lou, S.; Huang, D.; Wang, Q.; Jing, S.; Wang, H.; et al. Tracer-based characteri-
zation of source variations of PM2. 5 and organic carbon in Shanghai influenced by the COVID-19 Lockdown. Faraday Discuss.
2020, doi:10.1039/D0FD00091D.
30. Higham, J.E.; Ramírez, C.A.; Green, M.A.; Morse, A.P. UK COVID-19 lockdown: 100 days of air pollution reduction? Air Qual.
Atmos. Health. 2020, 1–8, doi:10.1007/s11869-020-00937-0.
31. Huang, Y.; Zhou, J.L.; Yu, Y.; Mok, W.C.; Lee, C.F.; Yam, Y.S. Uncertainty in the impact of the COVID-19 pandemic on air quality
in Hong Kong, China. Atmosphere. 2020, 11, 914; doi:10.3390/atmos11090914.
32. Wang, P.; Chen, K.; Zhu, S.; Wang, P.; Zhang, H. Severe air pollution events not avoided by reduced anthropogenic activities
during COVID-19 outbreak. Resour. Conserv. Recy. 2020, 158, 104814.
33. Huang, X.; Ding, A.; Gao, J.; Zheng, B.; Zhou, D.; Qi, X.; Tang, R.; Wang, J., Ren, C.; Nie, W.; et al. Enhanced secondary pollution
offset reduction of primary emissions during COVID-19 lockdown in China. Natl. Sci. Rev. 2020. doi:10.1093/nsr/nwaa137
34. Lai, I.-C.; Brimblecombe, P. Long range transport of air pollutants to Taiwan during the COVID-19 lockdown in Hubei Province.
Aerosol Air Qual. Res. 2020. doi:10.4209/aaqr.2020.07.0392.
35. Shi, X.; Brasseur, G.P. Response in air quality to the reduction of Chinese economic activities during the COVID-19 Outbreak.
Geophys. Res. Letters. 2020, 47, 1–8.
36. Chen, Z.; Hao, X.; Zhang, X.; Chen, F. Have traffic restrictions improved air quality? A shock from COVID-19. J. Clean. Prod.
2020, 279, 123622.Environments 2021, 8, 2 15 of 16
37. Hannam, P. The Sydney Morning Herald. Virus and favourable weather deliver clear skies over Sydney. Available online:
https://www.smh.com.au/environment/sustainability/virus-and-favourable-weather-delivers-clear-skies-over-sydney-
20200422-p54m6z.html (accessed on 1 January 2021).
38. Khaykin, S.; Legras, B.; Bucci, S.; Sellitto, P.; Isaksen, L.; Tencé, F.; Bekki, S.; Bourassa, A.; Rieger, L.; Zawada, D.; et al. The
2019/20 Australian wildfires generated a persistent smoke-charged vortex rising up to 35 km altitude. Comm. Earth Environ.
2020, 1, 1–12.
39. Sánchez-García, E.; Leon, J. The Conversation. These 5 images show how air pollution changed over Australia’s major cities
before and after lockdown. Available online: https://theconversation.com/these-5-images-show-how-air-pollution-changed-
over-australias-major-cities-before-and-after-lockdown-136723 (accessed on 1 January 2021).
40. WessaNet, version 1.2.1, Free Statistics Software, Wessa, P., Office for Research Development and Education, 2020. Available
online: https://www.wessa.net/ (accessed on 1 January 2021).
41. Silver, B.; He, X.; Arnold, S.R.; Spracklen, D.V. The impact of COVID-19 control measures on air quality in China. Environ. Res.
Lett. 2020, 15, 084021.
42. Brimblecombe, P.; Lai, Y. Diurnal and weekly patterns of primary pollutants in Beijing under COVID-19 restrictions. Faraday
Discuss. 2020. doi:10.1039/D0FD00082E.
43. Ulpiani, G.; Ranzi, G.; Santamouris, M. Experimental evidence of the multiple microclimatic impacts of bushfires in affected
urban areas: The case of Sydney during the 2019/2020 Australian season. Environ. res. commun. 2020, 2, 065005.
44. Bauwens, M.; Compernolle, S.; Stavrakou, T.; Müller, J.F.; van Gent, J.; Eskes, H.; Levelt, P.F.; van der A, R.; Veefkind, J.P.;
Vlietinck, J.; et al. Impact of coronavirus outbreak on NO2 pollution assessed using TROPOMI and OMI observations.
Geophysical Research Letters. 2020, 47, e2020GL087978.
45. Lamsal, L.N.; Krotkov, N.A.; Vasilkov, A.; Marchenko, S.; Qin, W.; Yang, E.-S.; Fasnacht, Z.; Joiner, J.; Choi, S.; Haffner, D.; et
al. OMI/Aura nitrogen dioxide standard product with improved surface and cloud treatments. Atmos. Meas. Tech. Discuss.2020,
1-56.
46. Kumar, P.; Hama, S.; Omidvarborna, H.; Sharma, A.; Sahani, J.; Abhijith, K.V.; Debele, S.E.; Zavala-Reyes, J.C.; Barwise, Y.;
Tiwari, A. Temporary reduction in fine particulate matter due to ‘anthropogenic emissions switch-off’during COVID-19 lock-
down in Indian cities. Sustain. Cities and Society. 2020, 62, 102382. doi:10.1016/j.scs.2020.102382.
47. Li, L.; Li, Q.; Huang, L.; Wang, Q.; Zhu, A.; Xu, J.; Liu, Z.; Li, H.; Shi, L.; Li, R.; Azari, M. Air quality changes during the COVID-
19 lockdown over the Yangtze River Delta Region: An insight into the impact of human activity pattern changes on air pollution
variation. Sci. Total Environ. 2020, 732, 139282. doi:10.1016/j.scitotenv.2020.139282.
48. EPA 2019: Air Emissions Inventory for the Greater Metropolitan Region in New South Wales, EPA 2019P1917; NSW Environment
Protection Authority: Sydney, Australia, 2019.
49. Wan, S.; Cui, K.; Wang, Y.-F.; Wu, J.-L.; Huang, W.-S.; Xu, K.; Zhang, J. Impact of the COVID-19 event on trip intensity and air
quality in Southern China. Aerosol Air Qual. Res. 2020, 20, pp. 1727–1747.
50. Brimblecombe, P.; Lai, Y. Effect of sub-urban scale lockdown on air pollution in Beijing. Urban Clim. 2020, 34, 100725.
51. Scott, K. ABC Life. Surprising facts about how we spend our time. Available online: https://www.abc.net.au/life/surprising-
facts-about-how-we-spend-our-time/10188202 (accessed on 1 January 2021).
52. Sekar, A.; Jasna, R.S.; Binoy, B.V.; Mohan, P.; Varghese, G.K. Air quality change due to COVID-19 lockdown in India and its
perception by public. Research Square. 2020. doi:10.21203/rs.3.rs-74610/v1
53. Chen, K.; Wang, M.; Huang, C.; Kinney, P.L.; Anastas, P.T. Air pollution reduction and mortality benefit during the COVID-19
outbreak in China. Lancet Planet. Health 2020, 4, e210–e212.
54. Achebak, H.; Petetin, H.; Quijal-Zamorano, M.; Bowdalo, D.; García-Pando, C.P.; Ballester, J. Reduction in air pollution and
attributable mortality due to COVID-19 lockdown. Lancet Planet. Health 2020, 4, e268.
55. Cori, L.; Bianchi, F. Covid-19 and air pollution: Communicating the results of geographic correlation studies. Epidemiol. Prev.
2020, 44, 120–123.
56. Cicala, S.; Holland, S.P.; Mansur, E.T.; Muller, N.Z.; Yates, A.J. Expected health effects of reduced air pollution from COVID-19
social distancing. In NBER Working Papers 27135; National Bureau of Economic Research, Inc: Cambridge, MA, USA, 2020.
doi:10.3386/w27135.
57. Cartea, P.Á .M. Is there a hole in the ozone layer of your climate change? From scientific culture to popular culture. Mètode Sci.
Stud. J. 2016, 6, 57–62.
58. Svatonova, H.; Rybansky, M. Children observe the digital earth from above: How they read aerial and satellite images. IOP
Conf. Ser.: Earth Environ. Sci. 2014, 18, 012071.
59. Brimblecombe, P.; Zong, H. Citizen perception of APEC Blue and air pollution management. Atmos. Environ. 2019, 214, 116853.
60. Brimblecombe, P. A Journal in a Plague Year. City Environ. Interactions 2020, 4, 100028.Environments 2021, 8, 2 16 of 16
61. Manenti, R.; Mori, E.; Di Canio, V.; Mercurio, S.; Picone, M.; Caffi, M.; Brambilla, M.; Ficetola, G.F.; Rubolini, D. The good, the
bad and the ugly of COVID-19 lockdown effects on wildlife conservation: Insights from the first European locked down country.
Biol. Conserv. 2020, 249, 108728.
62. Geard, N.; Cromer, D. The Conversation. Sydney’s second wave: Can it avoid a Melbourne-style lockdown? Available online:
https://theconversation.com/sydneys-second-wave-can-it-avoid-a-melbourne-style-lockdown-142652 (accessed on 1 January
2021).
63. Barbieri, D.M.; Lou, B.; Passavanti, M.; Hui, C.; Lessa, D.A.; Maharaj, B.; Banerjee, A.; Wang, F.; Chang, K.; Naik, B.; et al. Survey
data regarding perceived air quality in Australia, Brazil, China, Ghana, India, Iran, Italy, Norway, South Africa, United States
before and during Covid-19 restrictions. Data Brief. 2020, 32, 106169. doi:10.1016/j.dib.2020.106169.
64. Tangren, C.D. Scattering coefficient and particulate matter concentration in forest fire smoke. J. Air. Pollut. Control. Assoc. 1982,
32, 729–732.You can also read