Exploring the severe winter haze in Beijing: the impact of synoptic weather, regional transport and heterogeneous reactions
←
→
Page content transcription
If your browser does not render page correctly, please read the page content below
Atmos. Chem. Phys., 15, 2969–2983, 2015
www.atmos-chem-phys.net/15/2969/2015/
doi:10.5194/acp-15-2969-2015
© Author(s) 2015. CC Attribution 3.0 License.

Exploring the severe winter haze in Beijing: the impact of synoptic
weather, regional transport and heterogeneous reactions
G. J. Zheng1 , F. K. Duan1 , H. Su2 , Y. L. Ma1 , Y. Cheng1 , B. Zheng1 , Q. Zhang3,6 , T. Huang4 , T. Kimoto4 , D. Chang2 ,
U. Pöschl2 , Y. F. Cheng2 , and K. B. He1,5,6
1 State Key Joint Laboratory of Environment Simulation and Pollution Control,
School of Environment, Tsinghua University, Beijing 100084, China
2 Multiphase Chemistry Department, Max Planck Institute for Chemistry, 55128,

Mainz, Germany
3 Ministry of Education Key Laboratory for Earth System Modeling,

Center for Earth System Science, Tsinghua University, Beijing 100084, China
4 Kimoto Electric Co., Ltd, 3-1 Funahashi-cho Tennoji-ku, Osaka 543-0024, Japan
5 State Environmental Protection Key Laboratory of Sources and Control of

Air Pollution Complex,Beijing 100084, China
6 Collaborative Innovation Center for Regional Environmental Quality,

Beijing 100084, China

Correspondence to: K. B. He (hekb@mail.tsinghua.edu.cn) and Y. F. Cheng (yafang.cheng@mpic.de)

Received: 16 April 2014 – Published in Atmos. Chem. Phys. Discuss.: 3 July 2014
Revised: 6 January 2015 – Accepted: 14 January 2015 – Published: 17 March 2015

Abstract. Extreme haze episodes repeatedly shrouded Bei-          nomenon. The accumulation process of aerosol particles oc-
jing during the winter of 2012–2013, causing major envi-          curred successively from cities southeast of Beijing. The ap-
ronmental and health problems. To better understand these         parent sharp increase in PM2.5 concentration of up to several
extreme events, we performed a model-assisted analysis of         hundred µg m−3 per hour recorded in Beijing represented
the hourly observation data of PM2.5 and its major chemical       rapid recovery from an interruption to the continuous pol-
compositions. The synthetic analysis shows that (1) the se-       lution accumulation over the region, rather than purely local
vere winter haze was driven by stable synoptic meteorologi-       chemical production. This suggests that regional transport of
cal conditions over northeastern China, and not by an abrupt      pollutants played an important role during these severe pol-
increase in anthropogenic emissions. (2) Secondary species,       lution events.
including organics, sulfate, nitrate, and ammonium, were the
major constituents of PM2.5 during this period. (3) Due to the
dimming effect of high loading of aerosol particles, gaseous      1   Introduction
oxidant concentrations decreased significantly, suggesting a
reduced production of secondary aerosols through gas-phase        Severe haze episodes in the winter of 2012–2013 engulfed
reactions. Surprisingly, the observational data reveals an en-    Beijing, as well as other cities in southeastern China, caus-
hanced production rate of secondary aerosols, suggesting an       ing one of the worst atmospheric pollution events in his-
important contribution from other formation pathways, most        tory. With hourly fine particle (PM2.5 ) concentrations up to
likely heterogeneous reactions. These reactions appeared to       ∼ 900 µg m−3 , outdoor exposure caused adverse health ef-
be more efficient in producing secondary inorganics aerosols      fects (Nel, 2005; Pöschl, 2005; Peplow, 2014), including se-
than organic aerosols resulting in a strongly elevated fraction   vere respiratory system related symptoms and deceases (Cao
of inorganics during heavily polluted periods. (4) Moreover,      et al., 2014; Ouyang, 2013). Meanwhile the visibility was
we found that high aerosol concentration was a regional phe-      reduced down to 100 m, which disrupted traffic with can-

Published by Copernicus Publications on behalf of the European Geosciences Union.
2970                                                           G. J. Zheng et al.: Exploring the severe winter haze in Beijing

celed flights and closed highways. The government had to           Ring Road, without any major pollution sources nearby. All
adopt emergency response measures to deal with these pol-          observation data are hourly unified data.
lution episodes (http://english.sina.com/china/p/2013/0113/          Mass concentrations of fine (PM2.5 ) and coarse
548263.html). In addition to massive amounts of primary            (PM2.5−10 ) particles were simultaneously measured
particulate matter, high emissions in China provided plenty        based on the β-ray absorption method by a PM-712 Monitor
of gas pollutants to serve as precursors for secondary aerosols    (Kimoto Electric Co., Ltd., Japan), which was equipped
(Zhang et al., 2009). Densely distributed mega-cities (i.e.,       with a US-EPA PM10 inlet and a PM2.5 virtual impactor
city clusters) have worsened this situation, contributing to       (Kimoto Electric Co., Ltd., 2012; Kaneyasu et al., 2014).
regional air pollution. Once the regional pollution is formed,     Dehumidification was achieved with the hygroscopic growth
the advection becomes less effective in scavenging local pol-      correction formula:
lutants (no clean air from upwind). Thus, the regional pol-
lution is more persistent compared with air pollution within       Dehumidified PM2.5 mass conc.                                  (1)
a specific city. Moreover, cities within this region could not                                                 1
eliminate their pollution solely by reducing local emissions        = Measured PM2.5 mass conc. ×                       RH
                                                                                                                              ,
                                                                                                     1 + 0.010 × e6.000 100
(Chan and Yao, 2008; Cheng et al., 2008a).
   These extreme haze episodes attracted great scientific in-      where the 0.010 and 6.000 are localized coefficients, and RH
terest. The visibility impairment has been attributed to scat-     is relative humidity in %. All PM2.5 hereinafter refer to the
tering and absorption of solar radiation by aerosol particles      dehumidified PM2.5 data.
(mostly PM2.5 ) and their hygroscopic growth under high rel-          A Sunset Model 4 Semi-Continuous Carbon Analyzer
ative humidity (Cheng et al., 2006, 2008b, c). Regional trans-     (Beaverton, OR, USA) was used to measure hourly organic
port of pollutants was found to contribute considerably to         carbon (OC) and elemental carbon (EC) concentrations in
concentrations of PM2.5 (Z. Wang et al., 2014; L. T. Wang          PM2.5 . A NIOSH (National Institute for Occupational Safety
et al., 2014), dust (Yang et al., 2013; Y. Wang et al., 2014),     and Health) temperature protocol was used and the calcula-
and SO2 (Yang et al., 2013) in Beijing. Atmospheric dy-            tion discrepancy under high ambient concentrations was cor-
namic processes during hazy conditions were different from         rected accordingly (G.J. Zheng et al., 2014). Organic mat-
clean conditions, with a significant two-way feedback be-          ter (OM) was estimated as 1.6·OC, based on previous re-
tween PM2.5 and boundary layer evolution (Z. Wang et al.,          sults (Zhang et al., 2014; Xing et al., 2013). The use of
2014). Secondary inorganic aerosol species were suggested          fixed OM / OC ratio requires caveats because the ratio might
to be the major contributor to severe haze, based on offline       change due to the variable oxidation degree of OM under dif-
PM2.5 analysis (Quan et al., 2014), and online non-refractory      ferent conditions.
PM1 analysis by an Aerosol Chemical Speciation Monitor                Hourly sulfate and nitrate concentrations in PM2.5 were
(Sun et al., 2014). In addition, some studies described un-        measured using an ACSA-08 Monitor (Kimoto Electric Co.,
usual atmospheric phenomena taking place under heavily             Ltd., Japan). The ACSA-08 Monitor measured nitrates us-
polluted conditions, such as extremely low ozone concen-           ing an ultraviolet spectrophotometric method, and quantified
tration (less than 5 ppb) in the absence of diurnal variation      sulfates with the BaSO4 -based turbidimetric method after ad-
(Zhao et al., 2013) and the synergistic oxidation of SO2 and       dition of BaCl2 dissolved in polyvinyl pyrrolidone solution
NO2 (He et al., 2014). These findings suggest need for a bet-      (Kimoto et al., 2013). Ammonium was predicted under the
ter understanding on the haze formation mechanisms.                assumption that it existed as NH4 NO3 and (NH4 )2 SO4 (He
   In this study, we address the following questions for the       et al., 2012), which might be an overestimation based on the
winter haze episodes aforementioned: (1) the relative im-          non-refractory PM1 results (Sun et al., 2014). Thus the pre-
portance of enhanced emission versus meteorology; (2) the          dicted ammonium given here should be regarded as an upper
cause of the sharp PM2.5 increase during the haze episodes in      limit.
Beijing, whether it was mainly driven by an extremely rapid           An automatic meteorological observation instrument (Mi-
local chemical production or by regional transport; and (3)        los520, VAISALA Inc., Finland) was used to obtain mete-
the dominant chemical mechanisms of haze formation.                orological parameters, including atmospheric pressure, tem-
                                                                   perature, RH, wind speed, and wind direction. Specific hu-
                                                                   midity was calculated from these measured parameters (http:
2   Experimental methods                                           //www.srh.noaa.gov/epz/?n=wxcalc).
                                                                      SO2 and NO2 concentrations in Beijing, and PM2.5 con-
Online ambient observation was conducted from 1–31 Jan-            centrations in other cities were acquired from the At-
uary 2013 on the campus of Tsinghua University. The ob-            mospheric Environment Monitoring Network (Tang et al.,
servation site is situated on the rooftop of the Environmen-       2012). Daily averaged solar radiation reaching ground data
tal Science Building (40◦ 000 1700 N, 116◦ 190 3400 E), approxi-   were downloaded from the China Meteorological Data
mately 10 m above ground. Tsinghua University is located in        Sharing Service System (http://cdc.cma.gov.cn). Planetary
the northwest part of urban Beijing, close to the North 4th        boundary layer (PBL) height was simulated with the Weather

Atmos. Chem. Phys., 15, 2969–2983, 2015                                            www.atmos-chem-phys.net/15/2969/2015/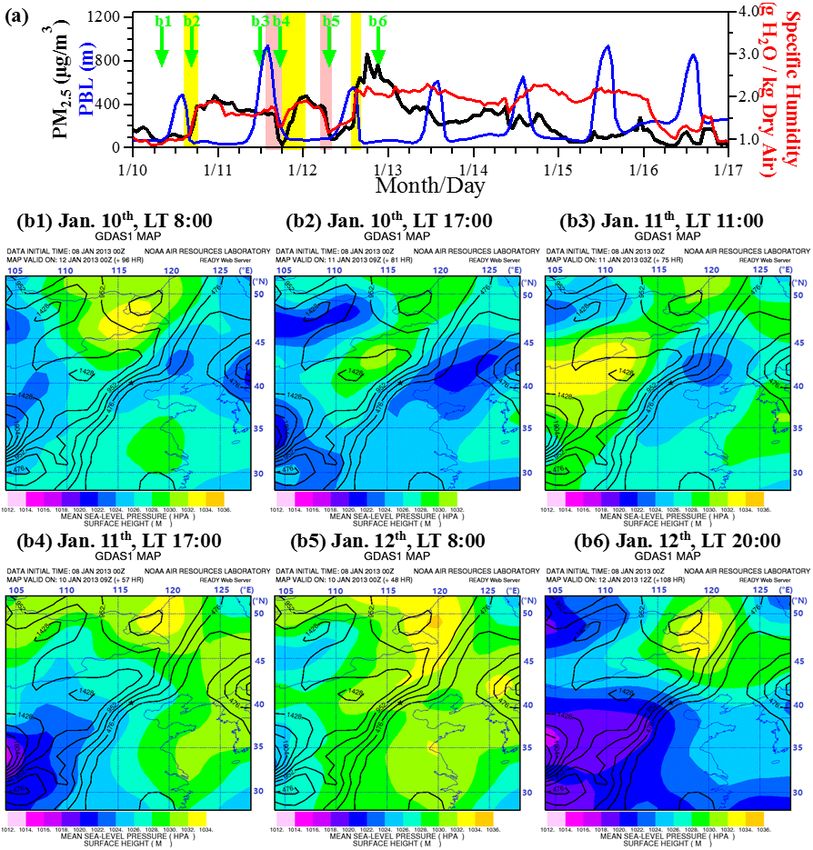
G. J. Zheng et al.: Exploring the severe winter haze in Beijing                                                               2971

Research & Forecasting (WRF) Model (B. Zheng et al.,               during polluted periods concerning their contribution to the
2014).                                                             PM2.5 . A similar trend was observed for NR-PM1 (Sun et
                                                                   al., 2014) and off-line samples (Cheng et al., 2015). On
                                                                   average, OC, EC, nitrate, and sulfate comprised 21, 3, 19
3   General characteristics of Beijing winter haze                 and 22 % of PM2.5 (Fig. 2b). Good correlations with PM2.5
                                                                   were observed for OC, EC and nitrate (R 2 >0.8 for these
Primary atmospheric pollutant in Beijing during the win-           three species) for all data in January 2013, while for sulfate
ter of 2012–2013 was PM2.5 , which constituted about 70 %          the correlation became weaker, reflecting larger episodic
of PM10 . This ratio increased when PM2.5 pollution be-            variations (Fig. 2b). In Episode III, NO2 exceeded SO2
came worse (Fig. 1b). Monthly average PM2.5 concentration          by 50 % (Table 1), generally in accordance with previous
reached 121.0 µg m−3 in January 2013, and hourly PM2.5             studies (Meng et al., 2009). In contrast, concentration of
concentrations peaked at 855.10 µg m−3 , which was the high-       SO2 exceeded NO2 in Episodes I and II. Compared with
est ever reported in Beijing (Zhao et al., 2009, 2011, 2013;       Episode II, Episode I was much drier, which is unfavorable
Zhang et al., 2014). The severe PM2.5 pollution lasted nearly      to the sulfate formation. The relatively high SO2 but low
the whole month, characterized by frequent and long-lasting        NO2 concentrations in Episodes I and II may indicate the
pollution episodes. Here, we define an episode as a set            significance of stationary sources (coal combustion, etc.) in
of continuous days with daily PM2.5 averages exceeding             local emissions or regional SO2 -rich air masses transported
75 µg m−3 . In total, four episodes were identified in Jan-        to Beijing.
uary 2013 (Fig. 1a): 4–8 January (Episode I), 10–16 January
(Episode II), 18–23 January (Episode III), and 25–31 Jan-
uary (Episode IV). Maximum episode-averaged PM2.5 con-
centrations reached 245.4 µg m−3 in Episode II (see Table 1        4   Emission enhancement vs. synoptic conditions
for comparative information on Episodes I to III; Episode
IV was not included because of missing data). In addition          Haze episodes were much more severe and frequent in win-
to the high average concentrations, these episodes were fre-       ter 2013 than in 2012. One possible explanation is that there
quent (intervals between episodes were all ∼ 1 day) and long-      was an abrupt emission enhancement during 2013. How-
lasting (5–7 days) compared with typical durations (5 days)        ever, we didn’t find such change in the emission inventory
and frequencies (1–3 days) of previous Beijing winter haze         (http://www.meicmodel.org/). Annual average emissions of
episodes (Jia et al., 2008).                                       primary PM2.5 , SO2 and NOx show slight differences be-
   Another unique feature of the PM2.5 mass concentrations         tween 2013 and 2012 (1.2, −1.3 and 0.8 %, respectively) for
during this winter haze period was their dramatic hourly fluc-     the Beijing–Tianjin–Hebei region. The changes of monthly
tuation. The maximum daily variation was 778.6 µg m−3 on           averaged emissions in January were higher than the annual
12 January. Hourly PM2.5 changes of over 100 µg m−3 (in-           average changes in rates, i.e., 2.1, 1.5 and 2.5 % for primary
creases or decreases) were observed over 40 times during           PM2.5 , SO2 , and NOx , respectively; but they are still not sig-
this haze period. Hourly increases or decreases could reach        nificant compared to the changes in pollutant concentrations.
up to 351.8 µg m−3 and −217.7 µg m−3 , respectively. Causes        Thus, we suspect that these haze episodes arose from the un-
of these sharp transitions are discussed in Sect. 5.               favorable synoptic conditions in January 2013.
   The variation of chemical composition with PM2.5 pollu-            The relative importance of enhanced emission versus un-
tion level, and among episodes, was also explored. We classi-      favorable meteorology in PM2.5 concentration of January
fied PM2.5 pollution into four categories according to the Air     2013 was estimated by model simulations with three scenar-
Quality Index (http://kjs.mep.gov.cn/hjbhbz/bzwb/dqhjbh/           ios (Fig. 3). Base scenario (a) was designed to simulate the
jcgfffbz/201203/t20120302_224166.htm?COLLCC=                       actual situation, i.e., with both input emission inventory and
2906016564&) (Fig. 1b): clean (PM2.5 ≤ 35 µg m−3 ),                meteorology for January 2013. In scenarios (b) and (c), Jan-
slightly polluted (35 < PM2.5 ≤ 115 µg m−3 ), polluted             uary 2012 meteorology and January 2012 emission inventory
(115 < PM2.5 ≤ 350 µg m−3 ),       and     heavily      polluted   data were used, respectively. Since the original WRF-CMAQ
(PM2.5 >350 µg m−3 ), where PM2.5 refers to the hourly             (Weather Research and Forecasting – Community Multiscale
concentration. Under this classification, the slightly polluted,   Air Quality) modeling system cannot reproduce the observed
polluted, and heavily polluted levels generally correspond         concentrations under heavily polluted conditions (B. Zheng
to small, moderate, and large PM2.5 peaks in Fig. 1b. Mean         et al., 2014), a revised WRF-CMAQ system with enhanced
percentile compositions of major components in PM2.5               heterogeneous reactions (Wang et al., 2012) was adopted to
under different pollution levels were shown in Fig. 2a. With       improve the model performance. The revised model could ef-
increasing pollution level, the EC fraction decreased slightly,    fectively capture the measured concentrations of total PM2.5
OC fraction decreased significantly, while sulfate and nitrate     (with normalized mean biases (NMBs) being 0.4 %) and its
contributions increased sharply (Fig. 2a). It suggests that        different chemical compositions for both clean and heavily
secondary inorganic aerosol species become more important          polluted haze days (B. Zheng et al., 2014). Details of the

www.atmos-chem-phys.net/15/2969/2015/                                               Atmos. Chem. Phys., 15, 2969–2983, 2015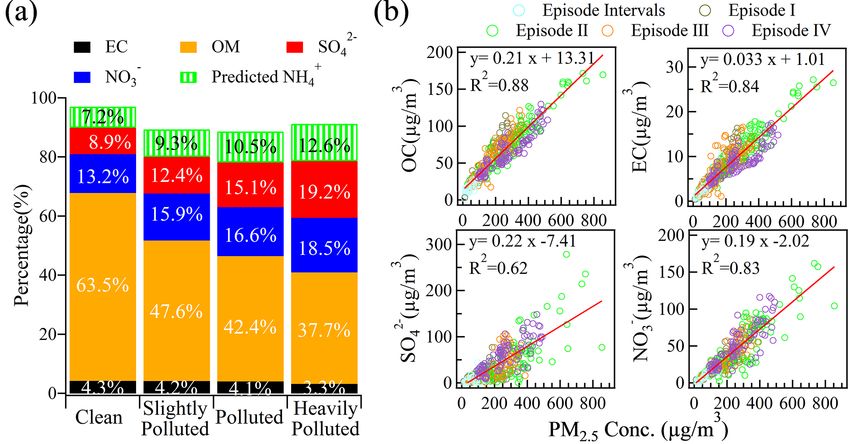
2972                                                                      G. J. Zheng et al.: Exploring the severe winter haze in Beijing

Figure 1. Time series of PM10 , PM2.5 , and its major components (OC, EC, SO2−      −
                                                                            4 and NO3 ), and meteorological data (wind speed, wind
direction, temperature and relative humidity) for January 2013.

Table 1. General information on severe haze episodes in January 2013.

                                                 Episode I                     Episode II                      Episode III                     January
                                          Ave.       min       max      Ave.      min          max      Ave.       min         Max      Ave.      min       max
  Meteorology data   Temperature (◦ )   −4.63    −11.10        1.40   −2.79     −8.30          2.80   −1.26      −6.60         5.00   −2.94    −12.50       5.00
                     RH(%)              31.16     13.50       58.50   56.59     27.20         77.60   55.05      27.10        79.70   47.97     13.50      88.30
                     WS(m s−1 )          2.10      0.90        4.40    2.08      1.00          3.40    1.96       0.90         3.60    2.18      0.90       4.50
  PM2.5 and PM10     PM2.5 (µg m3 )     112.50     11.00     311.50   245.37     21.10       855.10   167.66      35.40      387.30   161.77     4.40     855.10
                     PM10 (µg m3 )      152.17     28.80     411.00   327.17     31.60      1157.50   214.03      41.50      479.80   223.53    13.90    1157.50
                     PM2.5 /PM10 (%)      0.69                          0.75                            0.79                            0.70
  Gas data           NO2                 76.39                        109.44                           95.86                           86.09
                     SO2                 79.73                        123.35                           63.86                           77.54

model configuration, modifications, and validation are de-                        within ±10 µg m−3 (Fig. 3e). Simulation results of Scenario
scribed in B. Zheng et al. (2014).                                                (a) and (c) were not only similar in average concentration
   As expected, the influence of emission difference was neg-                     levels, but also in temporal variations. For example, in Bei-
ligible (Fig. 3a and 3c). For the whole simulation domain                         jing, simulated hourly PM2.5 concentration results under this
of the North China Plain (NCP), both simulation with Jan-                         two scenarios presented not only similar concentration (be-
uary 2012 meteorology (Scenario (c) and January 2013 me-                          ing 279.1 ± 170.2 µg m−3 and 278.8 ± 168.9 µg m−3 , respec-
teorology (Scenario (a) resulted in similar PM2.5 concen-                         tively) but also excellent correlation with R 2 reaching 0.97.
tration ranges (∼ 50 to ∼ 500 µg m−3 ) and spatial distri-                           In contrast, stable synoptic conditions in January 2013,
butions. Difference of PM2.5 concentration at any site was                        which favored accumulation of emitted pollutants, were es-

Atmos. Chem. Phys., 15, 2969–2983, 2015                                                                  www.atmos-chem-phys.net/15/2969/2015/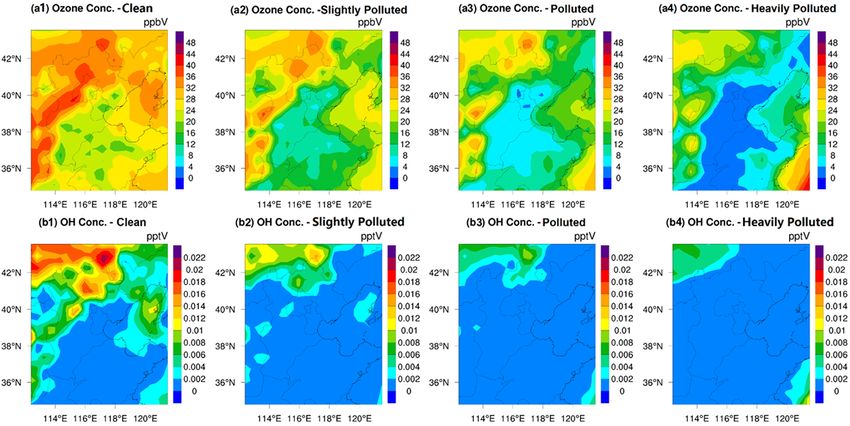
G. J. Zheng et al.: Exploring the severe winter haze in Beijing 2973
Figure 2. Major composition of PM2.5 with respect to pollution level. (a) Mean percentile composition and (b) hourly concentration of
individual species plotted against PM2.5 mass concentration. Values showed in (a) were derived as average of ratios.
Figure 3. Revised WRF-CMAQ simulated monthly averaged PM2.5 concentration (µg m3 ) under different scenarios. (a) Base scenario.
Actual January 2013 emission and January 2013 meteorology data were used. (b) January 2012 meteorology data were used, and (c) January
2012 emissions were used. The different PM2.5 concentrations (µg m3 ) caused by meteorology (d; equivalent to a–b) and emission (e,
equivalent to a–c) are also shown.
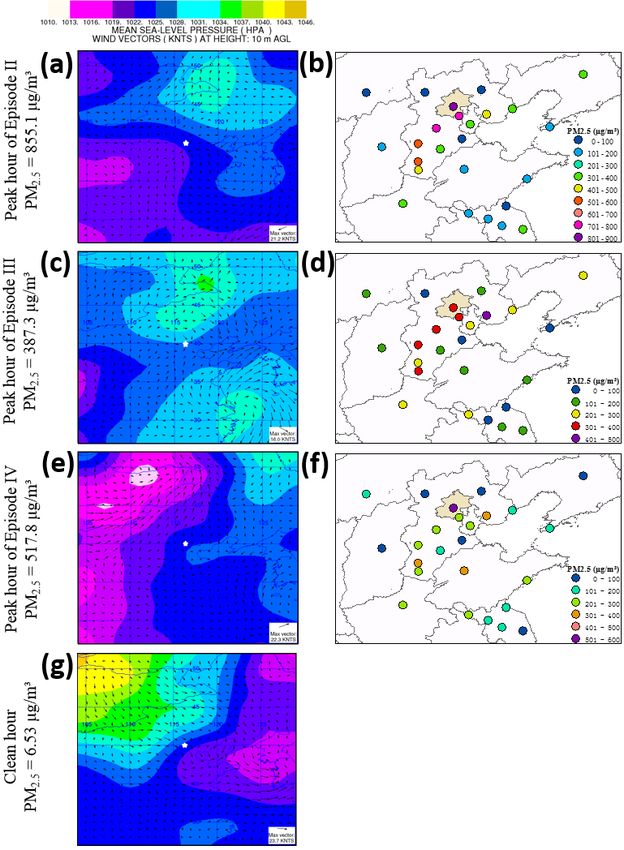
sential to the formation of the severe regional haze. Under Figure 4 compares peak PM2.5 concentrations in the NCP
the same emission level, changing the meteorological con- region during Episodes II to IV and their corresponding
ditions from 2012 to 2013 resulted in a monthly average surface weather maps, together with surface weather map
PM2.5 increase of 10–40 µg m−3 in the Beijing area, and up from a clean hour (Fig. 4g). During severe haze episodes,
to 120 µg m−3 over the whole NCP (Fig. 3a, b, d). This sug- the regional pollution covered most of the Hebei and north-
gests that the severe haze episodes in January 2013 were ern Henan provinces. In general, Shandong Province was
most likely due to unfavorable meteorology, rather than an less polluted, except during Episode IV. Beijing borders this
abrupt increase in emissions (Fig. 3d, e). polluted region with mountains to the northwest. Surface
weather maps from polluted periods were generally char-
www.atmos-chem-phys.net/15/2969/2015/ Atmos. Chem. Phys., 15, 2969–2983, 2015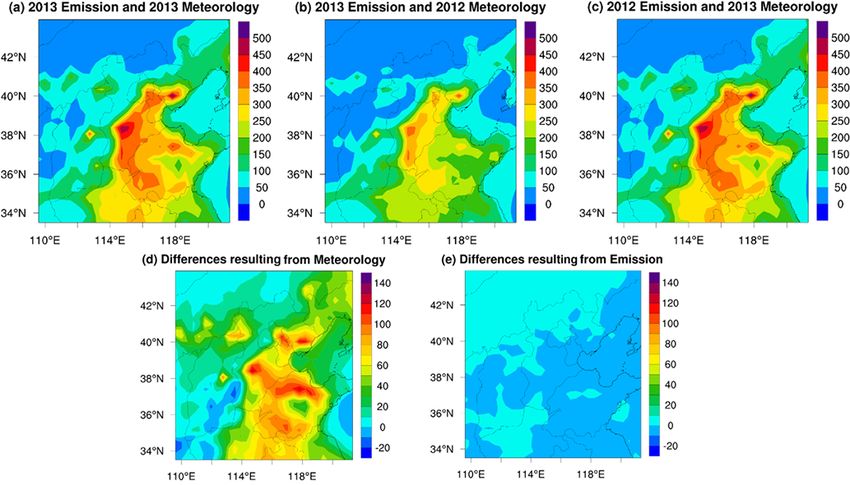
2974                                                              G. J. Zheng et al.: Exploring the severe winter haze in Beijing

                                                                      speed and PBL, and higher temperature and RH (Fig. 5). Be-
                                                                      sides changes in the average level, diurnal pattern of temper-
                                                                      ature in polluted periods could also differ from clean periods,
                                                                      with diminished overnight (00:00 to 06:00 a.m.) temperature
                                                                      drop.

                                                                      5   Local chemical production vs. regional transport

                                                                      As shown in Fig. 6, Episode II consists of several sharp-
                                                                      increase events, in which PM2.5 concentrations increased by
                                                                      over 400 µg m−3 within 1–3 hours (maximum mass growth
                                                                      rate up to 351.8 µg m−3 h−1 ). Earlier studies have attributed
                                                                      this dramatic rate of increase to fast local chemical produc-
                                                                      tion (Y. Wang et al., 2014). However, we found that the ap-
                                                                      parent rapid changes are more likely to be caused by the re-
                                                                      gional transport of clean/polluted air masses. In winter, the
                                                                      Siberian anticyclone could bring clean air masses into NCP
                                                                      (Jia et al., 2008; Liu et al., 2013) while southerly winds
                                                                      refill the areas with polluted air masses. The transition be-
                                                                      tween clean and polluted air masses may result in an appar-
                                                                      ent sharp build-up of particle concentrations. In other words,
                                                                      these events reflected interruption and rapid recovery of pol-
                                                                      lution from adjacent areas, rather than merely local chemical
                                                                      production.
                                                                         The impact of transport is supported by the temporal vari-
                                                                      ations in the regional distribution of PM2.5 concentrations,
                                                                      the surface weather maps, and the specific humidity (Fig. 6
Figure 4. Surface weather maps (a, c, e, g) and PM2.5 concentra-      and 7). The first evidence is that these sharp PM2.5 build-
tions (b, d, f) of the North China Plain on 12 January LT 18:00       up events were unique to Beijing among all the eight cities
(a, b), 18 January LT 20:00 (c, d), 29 January LT 13:00 (e, f), and   around/in the NCP (Fig. 6). Chengde and Zhangjiakou are
1 January LT 08:00 (g). The location of Beijing is indicated as a
                                                                      situated to the north of NCP with mountains in between
white star on the weather maps, and as the shaded area on the PM2.5
concentration maps. PM2.5 concentrations in Beijing at the four se-
                                                                      (Fig. 6a). Among the NCP cities, Beijing is located at the
lected time points are also shown on the left for reference.          northern tip, with mountains to the north and west shielding
                                                                      the city (Fig. 6(a2)). When conditions favor transport of clean
                                                                      air from north or northwest (i.e., with the advent of a cold
                                                                      air current), Beijing is the first one among NCP cities to be
acterized by a weak high-pressure center (1034–1037 hPa)              scavenged, which resulted in a sharp drop of PM2.5 concen-
northeast of Beijing, which could result in low surface wind          trations. In this case, PM2.5 levels in Beijing became similar
speed and prevent the influx of northwest clean air (Xu et al.,       to the upwind cities, i.e., Chengde and Zhangjiakou (yellow
2011; Zhao et al., 2013). During the peak hours of Episode            solid circles; Fig. 6(b1)). However, these cold air currents
II, Beijing was located near a low-pressure trough, where             were too weak to go further, leaving the rest NCP cities un-
air masses from south, west and northeast converged. Dur-             affected. Not surprisingly, the influence of these weak cold
ing Episode III, Beijing was located in a saddle between two          air currents soon receded and the polluted air parcels were
pairs of high- and low-pressure centers, which also led to en-        transported back to Beijing, which lead to a sharp increase
hanced stability. In contrast, weather patterns for the clean         in the PM2.5 level similar as the rest NCP cities (e.g., Shiji-
hours were characterized by strong high-pressure centers (up          azhuang, Baoding, Tianjin, Langfang, and Tangshan) (yellow
to 1046 hPa) northwest of Beijing, i.e., the Siberian anticy-         solid circles; Fig. 6(b2 and b3)).
clone. With sharp pressure gradient, synoptic conditions pro-            In accordance with the above description, surface weather
duce effective convection and strong northerly winds, bring-          maps showed that the sharp PM2.5 increase/decrease events
ing dry and clean air masses into Beijing.                            in Beijing during January 2013 were always accompanied
   Local meteorology, controlled by synoptic conditions,              with quick transition between low/high pressure systems. As
could have “deterministic impacts” on air pollution levels            shown in Fig. 7b, the two sharp drops in PM2.5 concentra-
(Xu et al., 2011). Compared with the clean periods, the pol-          tion on 11 and 12 January corresponded to a weak high-
luted periods were associated with significantly lower wind           pressure system developed in the mountains northwest of

Atmos. Chem. Phys., 15, 2969–2983, 2015                                                www.atmos-chem-phys.net/15/2969/2015/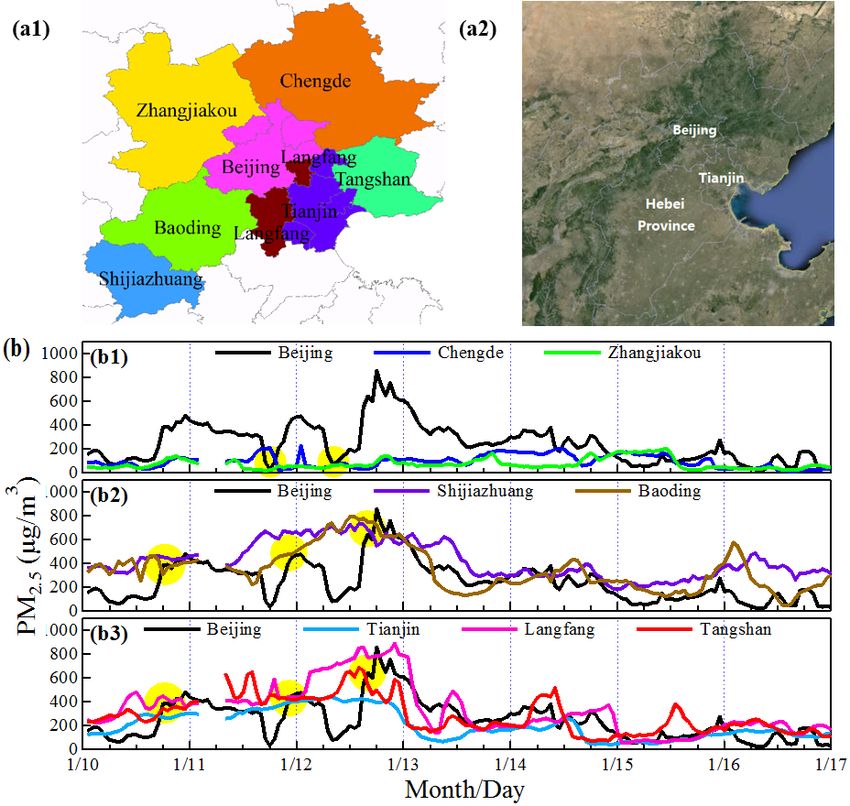
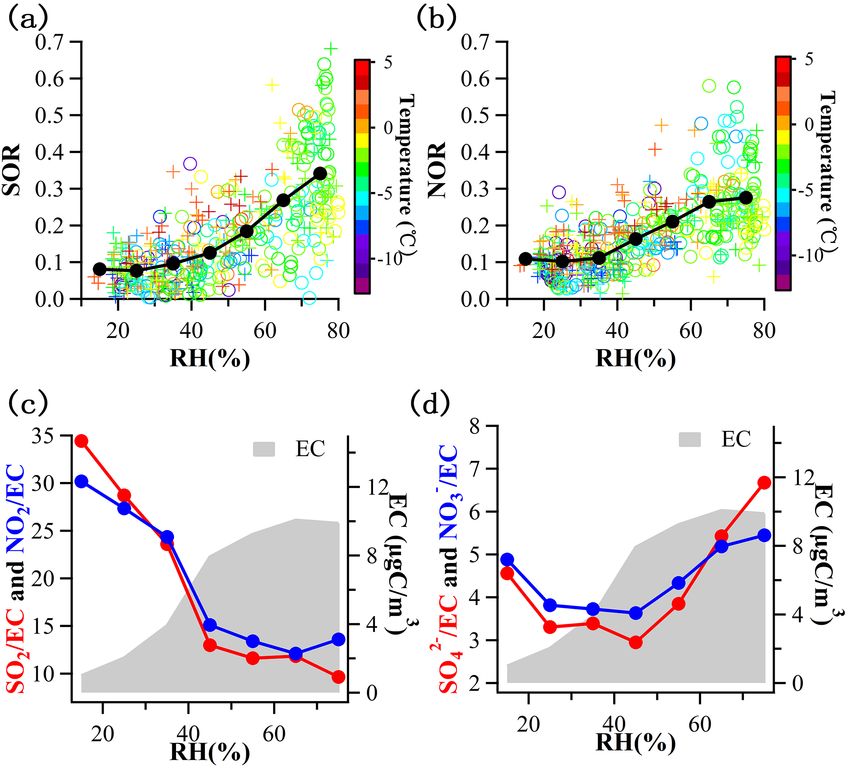
G. J. Zheng et al.: Exploring the severe winter haze in Beijing                                                                           2975

Figure 5. Mean diurnal variation in meteorological parameters for different pollution levels.

Figure 6. (a1) The location of all cities shown below, and (a2) topographic map around Beijing. (b) PM2.5 concentrations of Beijing and
its (b1) northern cities, (b2) southwest cities, and (b3) southeast cities for the period 10–17 January 2013. Yellow solid circles indicated the
time periods when the sharp drops (b1) and sharp increases (b2 and b3) of PM2.5 concentration occurred.

Beijing, which brought clean air mass into the city. When                 were usually warmer and wetter than the northern air masses,
the high-pressure systems diminished, a low-pressure system               thus possessing a higher specific humidity. During the rapid
developed southwest of Beijing, and the air mass in Beijing               changes of PM2.5 , the trend of specific humidity nicely fol-
was again affected by the regional background pollution, re-              lowed the variations of PM2.5 (Fig. 7a, pink and yellow
sulting in a sharp increase in PM2.5 concentration.                       rectangles marked periods), which reflected the quick tran-
   The observed variation of the specific humidity, an indi-              sition of air parcel origins. It has been suggested that the
cator for the origin of air masses (Jia et al., 2008), also sup-          decrease of PBL height will compress air pollutants into a
ports our explanation (Fig. 7a). Air masses from the south                shallow layer, resulting in elevated pollution levels (Liu et

www.atmos-chem-phys.net/15/2969/2015/                                                        Atmos. Chem. Phys., 15, 2969–2983, 2015
2976                                                               G. J. Zheng et al.: Exploring the severe winter haze in Beijing

Figure 7. Evidence for regional transport of pollutants as a major factor contributing to sharp concentration increases in Beijing. (a) PM2.5
concentration, PBL height, and specific humidity in Beijing for 10–17 January 2013. Pink and yellow rectangles indicated the sharp drop
and sharp increase periods of PM2.5 , respectively. Note how nicely specific humidity and PM2.5 followed each other during these periods.
(b) Weather patterns before and after the sharp increases events. Corresponding time point of (b1) to (b6) was indicated by arrows in (a).
The topography map (elevation) is also shown for reference. Location of Beijing was indicated by the black star in center of each graph.

al., 2013). However, our results indicated that the compres-             the synoptic conditions while the radiation reduction is due
sion was not really happening. Rather, the decrease of PBL               to the direct radiative effects of aerosol particles (Crutzen
height hindered the vertical mixing of pollutants, resulting in          and Birks, 1982; Ramanathan and Carmichael, 2008; Ra-
a faster accumulation and higher concentrations. As shown                manathan et al., 2001; Cheng et al., 2008b; Wendisch et al.,
in Fig. 7a, the time lag between variations in PBL and its ef-           2008). Secondary aerosols (inorganic and organic) are major
fects on PM2.5 concentration is a clear evidence demonstrat-             components in fine particles in China (Yang et al., 2011). In
ing that the PBL was not “compressing” air pollutants into               this section, we will evaluate the impact of changes in radia-
a shallower layer. Otherwise, concurrent increase in PM2.5               tion and RH on the formation of secondary aerosols.
will be found during the decrease of PBL height.                            To evaluate the role of chemical productions, we analyzed
                                                                         the EC-scaled concentrations for individual compounds. The
                                                                         purpose of using EC-scaled concentration is to eliminate the
6   Formation of secondary aerosols                                      influence of different dilution/mixing conditions on the varia-
                                                                         tion of observed pollutant concentrations. The observed vari-
Compared with clean conditions, the hazy days are character-             ations of pollutant concentrations are not only controlled by
istic of weaker radiation and higher RH. The RH depends on               the chemical reactions but are also subject to the influence

Atmos. Chem. Phys., 15, 2969–2983, 2015                                                    www.atmos-chem-phys.net/15/2969/2015/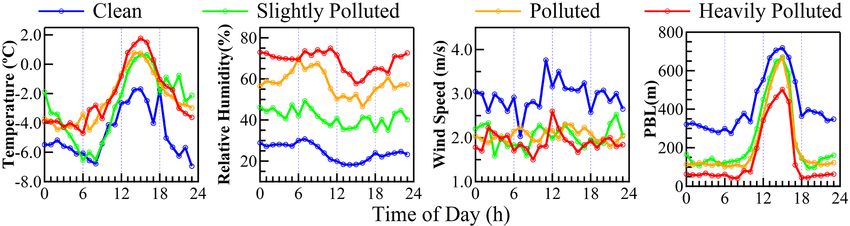
G. J. Zheng et al.: Exploring the severe winter haze in Beijing                                                                 2977

of boundary layer developments. For the same emission rate             2002). Briefly, SOC was estimated using these formulae:
and chemical production rate, different mixing conditions
will result in different levels of air pollutants. It is thus highly   Primary OC = EC · (OC/EC)pri + N                           (2)
uncertain to conclude a stronger/weaker chemical production            SOC = OC − Primary OC                                      (3)
based on purely concentration data without considering the
boundary layer effect. Since EC is an aerosol species com-             The basic assumptions and underlying principles of this
ing from only primary emission and quite inertial to chem-             method are discussed in Lim and Turpin (2002) and Lin
ical reactions, its variations well reflect the influence of at-       et al. (2009). Only daytime (07:00–18:00) carbonaceous
mospheric physical processes (dilution/mixing effect). The             aerosol data were used here to exclude possible interference
ratio of other species to EC will to a large extent eliminate          from day–night source variations (such as the heavy-duty
the variations due to mixing/dilution and better represent the         diesel truck traffic which is allowed only during nighttime
contribution from chemical reactions.                                  in Beijing). In our study, data pairs with the lowest 10 % per-
                                                                       centile of ambient OC/EC ratios were used to estimate the
6.1   Weakened importance of photochemistry                            primary OC/EC ratio (Fig. 9a). York regression (York et al.,
                                                                       2004) was used to estimate the intercept N and the slope,
The radiative reduction imposed by aerosol particles is                i.e., values of (OC/EC) pri, according to Saylor et al. (2006).
particularly strong during haze episodes because of ex-                Our analysis shows that SOC constituted ∼ 28 % of total OC,
tremely high particle concentrations. Take Beijing for ex-             consistent with earlier studies in the winter of 2009-2012
ample: during haze episodes, the amount of solar radiation             (∼ 30 %, Cheng et al., 2011; Sun et al., 2013b).
reaching the ground was significantly lower (e.g., down to                High concentration of aerosol particles can reduce solar
2.77 MJ m−2 d−1 , 13 January) than it was on clean days (av-           radiation and atmospheric photochemistry. Since SOC is a
eraging 9.36 ± 0.60 MJ m−2 d−1 for all the 6 clean days),              product of photochemical reactions, we would expect a re-
rendering high photochemical activity impossible. The re-              duced SOC production rate under heavily polluted condi-
duction of radiation intensities will change the atmospheric           tions. This is confirmed by the measured SOC concentra-
photochemistry and oxidant concentrations (hydroxyl radical            tions shown in Fig. 9. Here again the EC-scaled SOC was
(OH) and ozone (O3 )), which will consequently change the              used to account for the different boundary layer effect (di-
production and aging of secondary organic aerosols (SOAs)              lution/mixing) on the aerosol concentrations. Both SOC/EC
(Hallquist et al., 2009; Jimenez et al., 2009).                        and the accumulated SOC/EC (afternoon – morning values)
   As the haze pollution spread over most of the NCP, a                decrease when it changed from clean to heavily polluted pe-
weakening of photochemistry was expected on the regional               riods. The accumulated SOC/EC is used to better represent
scale, which is confirmed by both observations and model               the production during the daytime.
simulations. Extremely low ozone concentration (less than                 Reduction in photochemistry-related PM2.5 production is
10 ppb) in the absence of diurnal variation was observed dur-          further supported by model simulation results. In our model
ing heavy pollution episodes for all of the three major cities         configurations, the photolysis rate is calculated online using
in Jing–Jin–Ji Area (i.e., Beijing, Tianjin and Shijiazhuang)          simulated aerosols and ozone concentrations (B. Zheng et al.,
in January 2013 (Y. Wang et al., 2014). Similar phenomenon             2014). As a result, with the enhanced PM2.5 concentration,
was observed before in another heavy pollution episode in              the photolysis rate will be reduced, and so will the concen-
winter Beijing (Zhao et al., 2013). In accordance with the             trations of photochemical oxidants (Fig. 8) and secondary
observed low ozone concentration, model simulations also               aerosol particles. During the haze events, this effect can be
showed a regional-scale reduction in the concentrations of             counteracted by the enhanced heterogeneous reactions and it
ozone and OH (Fig. 8). Average daytime concentrations of               is difficult to unravel them from the measurement data.
oxidants were significantly lower during polluted periods                 In order to demonstrate the influence of reduced photo-
than clean periods. For most areas in the NCP, O3 and OH               chemistry, we adopted the original WRF-CMAQ model setup
dropped from 12∼ 44 ppbV and 0.004 ∼ 0.020 pptV to less                and excluded the enhanced heterogeneous reactions. In this
than 12 ppbV and 0.004 pptV, respectively, as the air qual-            case, only gas-phase oxidations are counted for the forma-
ity changed from clean to heavily polluted conditions. This            tion of sulfate and organics (aqueous-phase reactions in the
regional drop in oxidant concentrations demonstrates the im-           original WRF-CMAQ only happen in clouds and don’t ap-
pact of air pollution on the photochemistry.                           ply for the aerosol phase) (B. Zheng et al., 2014) and their
   Ozone and OH radicals are known as crucial oxidants                 simulated concentrations will directly reflect the influence of
in the formation of secondary organics aerosols (SOAs)                 reduced photochemistry. As shown in Table S1, the simu-
(Jimenez et al. 2009). Weakened photochemistry is therefore            lated PM2.5 /EC ratios decreased from 16.05 to 11.72 when
expected to reduce the SOA production and concentrations.              the pollution level changed from the clean to the heavily pol-
To have a semi-quantitative estimation on the contribution of          luted case, reflecting the reduced gas-phase photochemical
photochemistry, secondary organic carbon (SOC) was esti-               production. Note that PM2.5 concentration is normalized by
mated (Fig. 9a) using the EC-tracer method (Lim and Turpin,            EC to counteract the influence of reduced boundary layer.

www.atmos-chem-phys.net/15/2969/2015/                                                   Atmos. Chem. Phys., 15, 2969–2983, 2015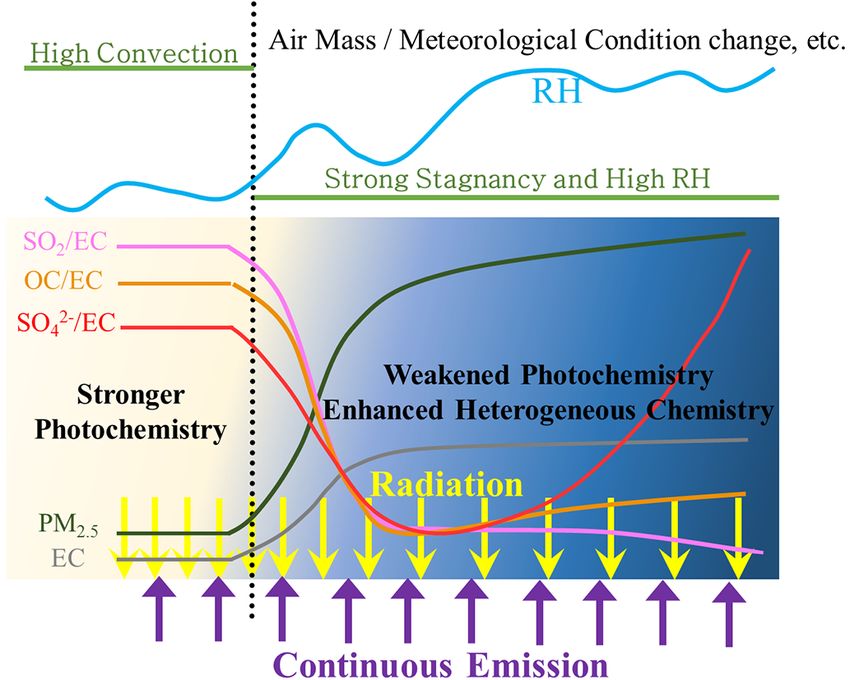
2978                                                          G. J. Zheng et al.: Exploring the severe winter haze in Beijing

Figure 8. Revised WRF-CMAQ simulated regional distribution of daytime (07:00 ∼ 18:00) concentration of (a) O3 (ppbV) and (b) OH
(pptV) at different pollution level.

Otherwise, the reduced boundary layer itself could lead to        The fact that SOR and NOR increased much more rapidly
a tremendous increase in the pollutant concentration under        than SO2 and NO2 as pollution events became more severe
heavily polluted conditions, and thus cover the real effect of    (Column 4 in Fig. 10) is further evidence of elevated sec-
reduced photochemistry.                                           ondary formations of sulfate and nitrate during severe haze
   The simulated individual components of PM2.5 also re-          events.
flected the influence of photochemistry. As shown in Table           Both gas-phase and heterogeneous reactions could con-
S1, although primary organic matter (POM) to EC ratios kept       tribute to the formation of sulfate and nitrate from SO2 and
nearly constant during all pollution levels, the normalized       NO2 , thus elevating the SOR and NOR. Sulfate is formed
secondary species all showed a decreasing trend, reflecting       through oxidation of SO2 by gas-phase reactions with OH
the reduced photochemical production. SOA/EC, SO2−      4 /EC,    (Stockwell and Calvert, 1983; Blitz et al., 2003) and sta-
and NO−  3 / EC  ratios decreased by 53.3, 51.9 and 28.6 %, re-   bilized Criegee intermediate (which is formed by O3 and
spectively from clean to heavily polluted periods. For the for-   alkenes) (Mauldin et al., 2012), and by heterogeneous re-
mation of NO−   3 , two heterogeneous reactions have been in-
                                                                  actions with dissolved H2 O2 or with O2 under the catal-
cluded in the original WRF-CMAQ model and therefore the           ysis of transition metal (Seinfeld and Pandis, 2006). Ni-
NO− 3 / EC shows relatively less reduction than SOA/EC and
                                                                  trate formation is dominated by the gas-phase reaction of
    2−
SO4 /EC.                                                          NO2 with OH during daylight, and the heterogeneous re-
                                                                  actions of nitrate radical (NO3 ) during nighttime (Seinfeld
6.2    Enhanced heterogeneous chemistry                           and Pandis, 2006). Since gas-phase production of secondary
                                                                  aerosols is expected to decrease under heavily polluted peri-
                                                                  ods (Sect. 6.1), the increase of SO2−             −
                                                                                                     4 /EC and NO3 / EC ratios
Unlike OM, relative contributions of sulfate and nitrate to
                                                                  is a clear evidence for the dominant contribution from other
PM2.5 were increasing during the haze events (Fig. 2). Again,
                                                                  pathways, most probably from the heterogeneous reactions.
we used their ratios to EC to account for the boundary layer
                                                                     If we assume heterogeneous chemistry to be the answer to
effect. An increasing trend of SO2−              −
                                  4 /EC and NO3 / EC ratios       the high SO2−             −
                                                                                4 and NO3 concentrations, there is a problem
was found (Column 1 in Fig. 10) from clean periods (3.03
                                                                  because heterogeneous chemistry still requires oxidation by
and 3.33, respectively) to heavily polluted periods (6.35 and
                                                                  oxidizing agents, e.g., OH, O3 , etc., which were indeed sig-
5.89, respectively), suggesting enhanced chemical produc-
                                                                  nificantly reduced (Sect. 6.1). Our explanation for this puz-
tions. The SOR and NOR (molar ratio of sulfate or nitrate to
                                                                  zle is that despite reduced oxidant concentrations, the aerosol
sum of sulfate and SO2 or nitrate and NO2 ) have been used
                                                                  volume/surface increases so much (due to elevated aerosol
as indicators of secondary transformation (Sun et al., 2006).

Atmos. Chem. Phys., 15, 2969–2983, 2015                                            www.atmos-chem-phys.net/15/2969/2015/
G. J. Zheng et al.: Exploring the severe winter haze in Beijing 2979
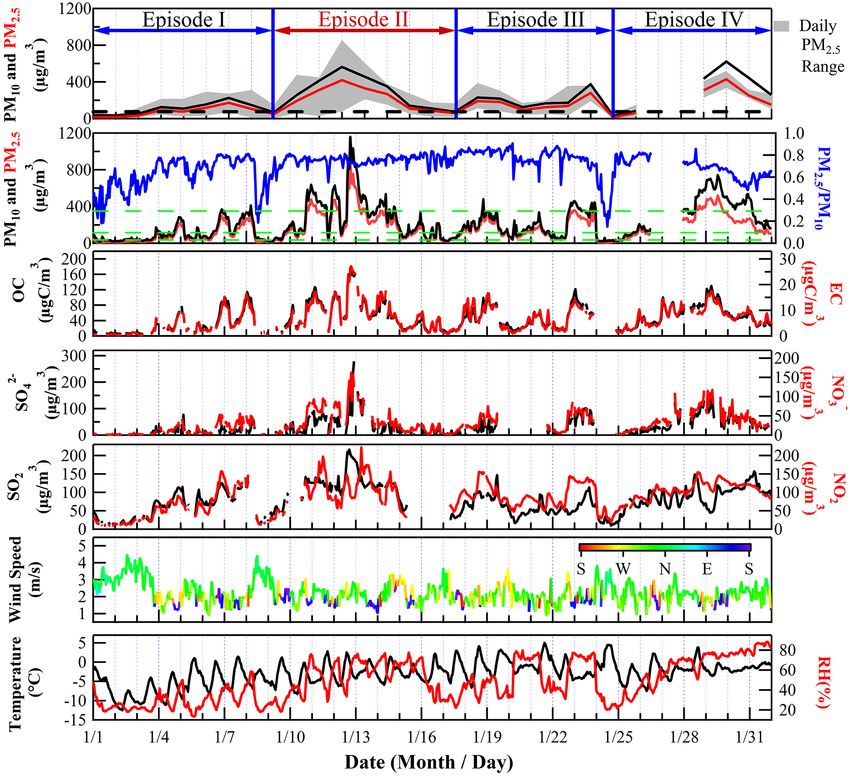
Figure 10. Variation of SO2− −
4 /EC, NO3 / EC, SO2 , NO2 , SOR and
NOR with pollution level. “C”, “S”, “P”, “H” refer to “clean”,
“slightly polluted”, “polluted” and “heavily polluted”, respectively.
Normalized X in Column 4 refers to the average concentration of
X in any pollution level, scaled by its average concentration dur-
ing clean periods. In the box-whisker plots, the boxes and whiskers
indicated the 95th, 75th, 50th (median), 25th and 5th percentiles,
respectively.
dropped significantly from ∼ 78 ppbV to ∼ 11 ppbV. Thus
we assume an upper limit of 90 % reduction in [oxidants
Figure 9. Evaluation of SOC formation. (a) Estimation of SOC with (aq)]. Vaerosol depends on the dry aerosol concentrations Vdry
EC-tracer method. Squares indicate data used to calculate primary and its hygroscopic growth factor (GF) of particle size, which
OC/EC, while open circles indicate other OC/EC data. (b) Change is a function of RH. Assuming a constant aerosol dry den-
of SOC, OC and SOC/EC with RH. Data points shown in (a) and sity, Vdry is proportional to the mass concentration. From
(b) referred to hourly concentrations in daytime (07:00–18:00). (c– the clean case to the heavily polluted case, average PM2.5
d) Variation of SOC, SOC/OC and SOC/EC (c) in the morning mass concentration increased by 25 time, changing from
(07:00∼ 12:00) and (d) in the afternoon (13:00∼ 18:00) with pol- 18 µg m−3 to 450 µg m−3 while average RH increased from
lution level. “C”, “S”, “P”, “H” refer to “clean”, “slightly polluted”, dry (∼ 20 %) to ∼ 70 %. Thus we have
“polluted” and “heavily polluted”, respectively. In the box-whisker
plots, the boxes (b, c, d) and whiskers (c, d) indicated the 95th, 75th,
oxidants(aq) HP (Vaerosol )HP
50th (median), 25th and 5th percentiles, respectively. × (5)
oxidants(aq) Clean (Vaerosol )Clean
oxidants(aq) HP (Vdry )HP
concentration and the accompanied high RH, Fig. 1) that it is = × × (GFHP/Clean )3
oxidants(aq) Clean (V dry )Clean
enough to compensate its influence, and moreover, leads to a
net increase in the formation of secondary aerosols. ≈ 0.1 × 25 × (1.1)3 = 3.33,
A simplified case study could show how aerosol vol-
ume/surface increases could compensate the effect of oxidant where HP and Clean indicate heavily polluted and clean peri-
reduction, and even lead to a net increase in the formation of ods, respectively. A GF of 1.1 was taken from previous mea-
secondary aerosols. Take sulfate for example: the production surements in Beijing (Meier et al., 2009).
rate of sulfate (S(VI)) through heterogeneous reactions can Equation (2) shows that the increase of aerosol volume
be estimated by concentrations could sufficiently compensate the effect of
oxidant reduction, resulting in a net increase of sulfate pro-
dCS(VI) /dt ≈ k[S(IV)(aq)] · [oxidants (aq)] · Vaerosol , (4) duction.
Similarly, for NO− 3 , the influence of oxidant reduction
in which CS(VI) is the sulfate concentration, k is the effective could also be compensated by the increase of aerosol vol-
rate coefficient, [S(IV)(aq)] is the S(IV) concentration in the ume concentrations. There might be other oxidants associ-
aqueous phase of aerosols, [oxidants (aq)] is the concentra- ated with heterogeneous reactions, such as O2 (especially
tion of oxidants in the aqueous phase of aerosols, and Vaerosol under the catalysis of mineral metals) and other oxidants ex-
is the volume concentration of humidified aerosol at ambient isted in aerosol phase such as organic peroxides (Seinfeld et
RH. al., 2006).
Equation (4) shows that the oxidants and Vaerosol are both In accordance with above discussions, both observation
essential for the heterogeneous reactions. From the clean to and model simulation supported the importance of hetero-
the heavily polluted case, O3 is reduced by 80 %, dropping geneous reactions. Observed SOR and NOR showed an ob-
from > 50 µg m3 < 10 µg m−3 (Y. Wang et al., 2014). Based vious dependence on RH (Fig. 11). Both SOR and NOR
on our model simulation results, H2 O2 concentration also were constant under dry conditions (RH < 50 %) (Fig. 11a,
www.atmos-chem-phys.net/15/2969/2015/ Atmos. Chem. Phys., 15, 2969–2983, 20152980 G. J. Zheng et al.: Exploring the severe winter haze in Beijing
Figure 12. Conceptual model of atmospheric chemistry during the
heavy pollution events. The dotted black line indicated the meteo-
Figure 11. Importance of heterogeneous chemistry in sulfate and rology changed from a convection-favoring condition to a stagnant
nitrate formation. (a–b) Hourly SOR and NOR plotted against RH, condition.
colored with temperature. (c–d) EC-scaled precursors (SO2 and
NO2 ) and products (SO2− −
4 and NO3 ) plotted against RH. EC con-
centrations at different RH levels were shown for reference. 7 Conclusions
b); however, started increasing when RH > 50 %, resulting in The severe haze pollution during January 2013 was not
average values around 0.34 and 0.28 at RH 70–80 %, respec- a Beijing-localized phenomenon. Rather, it was the result
tively. This suggests important contributions from heteroge- of local pollutants superposed on background regional pol-
neous reactions with abundant aerosol water under wet con- lution, which affected the whole NCP. Although pollutant
ditions (Sun et al., 2013a). The observed SOR value was high emissions were high, there was no abrupt enhancement in
compared with previously reported values of 0.24 (Wang et 2013. The occurrence of the severe winter haze resulted from
al., 2006) and 0.29 (Zhao et al., 2013) during hazy days in stable synoptic meteorological conditions over a large area of
Beijing. The NOR value for this study was higher than for northeastern China. Surface weather maps from hazy periods
spring hazy days in 2001–2004 (0.22; Wang et al., 2006), but were characterized by a weak high-pressure center northeast
significantly lower than for the hazy episode in January 2010 of Beijing, while the termination of a haze episode was al-
(0.51; Zhao et al., 2013). Our model simulation results (B. ways accompanied by the Siberian anticyclone (Xu et al.,
Zheng et al., 2014) also supported the importance of hetero- 2011; Jia et al., 2008; Liu et al., 2013). Atmospheric chem-
geneous chemistry in sulfate and nitrate productions (Figure istry and physics during severe haze pollution events are il-
R1). With the addition of the heterogeneous reactions, the lustrated in a conceptual model (Fig. 12). With the onset of
revised CMAQ showed much better performance in the pol- stable synoptic conditions, RH rises, primary pollutants be-
luted periods (B. Zheng et al., 2014), which demonstrated gin to accumulate and regional pollution begins to form. If
the importance of heterogeneous reaction in the production the stable conditions last long enough, PM2.5 build-up oc-
of secondary aerosols. curs, and as a consequence, solar radiation is reduced at the
Concerning the SOA formation, the contribution of hetero- ground level. This inhibits surface temperature fluctuation,
geneous reactions might be possible, but it should be much making the formation of the inversed layer easier and rend-
less significant than for sulfate and nitrate. For RH > 50 %, ing the atmosphere into a more stable condition. Meanwhile,
SO2− −
4 /EC and NO3 / EC ratios rose significantly (Fig. 11d)
photochemical activity is weakened under low solar radia-
while SOC/EC ratios remained constant (Fig. 9b). By using tion, and secondary aerosol formation via this pathway be-
HOA (hydrocarbon-like organic aerosol) instead of EC, Sun comes less important. However, under high RH, heteroge-
et al. (2013a) found similar phenomena. Apparently, SOC neous reactions may play a more important role, especially
doesn’t have a heterogeneous formation pathway as effective those associated with the aerosol aqueous phase. This results
as those of sulfate and nitrate. in the rapid build-up of secondary aerosols, especially sul-
fates and nitrates, enhancing PM2.5 pollution. The accumu-
lation of aerosol particles terminates with the incursion of a
strong cold front, usually the Siberian anticyclone.
Atmos. Chem. Phys., 15, 2969–2983, 2015 www.atmos-chem-phys.net/15/2969/2015/G. J. Zheng et al.: Exploring the severe winter haze in Beijing 2981
Our analysis also reveals that the regional transport can be Chan, C. K. and Yao, X.: Air pollution in mega cities in China,
a key process controlling the variations of local air pollutant Atmos. Environ., 42, 1–42, 2008.
concentrations. Take the sharp increases of aerosol concen- Chen, Y., Sheng, G., Bi, X., Feng, Y., Mai, B., and Fu, J.: Emission
trations on 11–13 January for example: Beijing pollution was factors for carbonaceous particles and polycyclic aromatic hy-
temporarily flushed away by strong winds associated with the drocarbons from residential coal combustion in China, Environ.
Sci. Technol., 39, 1861–1867, 2005.
arrival of a weak cold air current; as its influence weakened,
Cheng, Y. F., Eichler, H., Wiedensohler, A., Heintzenberg, J.,
the polluted regional air mass readily reoccupied the Beijing Zhang, Y. H., Hu, M., Herrmann, H., Zeng, L. M., Liu, S., Gnauk,
area, resulting in an apparent rapid build-up of PM2.5 . This T., Brüggemann, E., and He, L. Y.: Mixing state of elemental car-
was supported by data on the PM2.5 levels around Beijing, bon and non-light-absorbing aerosol components derived from in
specific humidity and PBL height, as well as surface weather situ particle optical properties at Xinken in Pearl River Delta of
maps. Our results reveal that the apparent formation rate (the China, J. Geophys. Res., 111, doi:10.1029/2005JD006929, 2006.
rate of change in PM2.5 or other air pollutants) is not only Cheng, Y. F., Heintzenberg, J., Wehner, B., Wu, Z. J., Su, H., Hu,
due to chemical reactions but also controlled by the regional M., and Mao, J. T.: Traffic restrictions in Beijing during the
transport along with other processes. It requires caveats to Sino-African Summit 2006: aerosol size distribution and visibil-
derive a real chemical production rate based on a single-site ity compared to long-term in situ observations, Atmos. Chem.
measurement. Our results also show a clear impact of re- Phys., 8, 7583–7594, doi:10.5194/acp-8-7583-2008, 2008a.
Cheng, Y., Wiedensohler, A., Eichler, H., Heintzenberg, J., Tesche,
gional transport on the local air pollution, suggesting the im-
M., Ansmann, A., Wendisch, M., Su, H., Althausen, D., and
portance of regional-scale emission control measures in the Herrmann, H.: Relative humidity dependence of aerosol optical
local air quality management of Beijing. properties and direct radiative forcing in the surface boundary
layer at Xinken in Pearl River Delta of China: An observation
based numerical study, Atmos. Environ., 42, 6373–6397, 2008b.
The Supplement related to this article is available online Cheng, Y. F., Wiedensohler, A., Eichler, H., Su, H., Gnauk,
at doi:10.5194/acp-15-2969-2015-supplement. T., Brüggemann, E., Herrmann, H., Heintzenberg, J., Slan-
ina, J., Tuch, T., Hu, M., and Zhang, Y. H.: Aerosol opti-
cal properties and related chemical apportionment at Xinken in
Pearl River Delta of China, Atmos. Environ., 42, 6351–6372,
Acknowledgements. This work was supported by the National doi:10.1016/j.atmosenv.2008.02.034, 2008c.
Natural Science Foundation of China (21190054, 21221004, Cheng, Y., He, K.-b., Duan, F.-k., Zheng, M., Du, Z.-y.,
21107061, 41222036 and 41330635), China’s National Basic Ma, Y.-l., and Tan, J.-h.: Ambient organic carbon to ele-
Research Program (2010CB951803), China’s Public Program mental carbon ratios: Influences of the measurement meth-
of Ministry of Environmental Protection (201209007), and the ods and implications, Atmos. Environ., 45, 2060–2066,
Japan International Cooperation Agency. F. K. Duan acknowledges doi:10.1016/j.atmosenv.2011.01.064, 2011.
support from a National Excellent Doctoral Dissertation of China Crutzen, P. J. and Birks, J. W.: Atmosphere after a nuclear war:
Award (2007B57). Y. Cheng was supported by the China Postdoc- Twilight at noon, Ambio (Allen Press), 11(2/3), 114–125, 1982.
toral Science Foundation (2013T60130 and 2013M540104). D. Docherty, K. S., Stone, E. A., Ulbrich, I. M., DeCarlo, P. F., Snyder,
Chang, H. Su and Y. F. Cheng were supported by the Max Planck D. C., Schauer, J. J., Peltier, R. E., Weber, R. J., Murphy, S. M.,
Society (MPG) and the EU project PEGASOS (265148). Seinfeld, J. H., Grover, B. D., Eatough, D. J., and Jimenez, J. L.:
Apportionment of Primary and Secondary Organic Aerosols in
Edited by: M. Shao Southern California during the 2005 Study of Organic Aerosols
in Riverside (SOAR-1), Environ. Sci. Technol., 42, 7655–7662,
doi:10.1021/es8008166, 2008.
Duan, J., Tan, J., Yang, L., Wu, S., and Hao, J.: Concentration,
sources and ozone formation potential of volatile organic com-
References pounds (VOCs) during ozone episode in Beijing, Atmos. Res.,
88, 25–35, doi:10.1016/j.atmosres.2007.09.004, 2008.
Blitz, M. A., Hughes, K. J., and Pilling, M. J.: Determination Hallquist, M., Wenger, J. C., Baltensperger, U., Rudich, Y., Simp-
of the high-pressure limiting rate coefficient and the enthalpy son, D., Claeys, M., Dommen, J., Donahue, N. M., George, C.,
of reaction for OH+SO2 , J. Phys. Chem. A, 107, 1971–1978, Goldstein, A. H., Hamilton, J. F., Herrmann, H., Hoffmann, T.,
doi:10.1021/jp026524y, 2003. Iinuma, Y., Jang, M., Jenkin, M. E., Jimenez, J. L., Kiendler-
Cao, C., Jiang, W., Wang, B., Fang, J., Lang, J., Tian, G., Jiang, Scharr, A., Maenhaut, W., McFiggans, G., Mentel, T. F., Monod,
J., and Zhu, T. F.: Inhalable Microorganisms in Beijing’s PM2.5 A., Prévôt, A. S. H., Seinfeld, J. H., Surratt, J. D., Szmigiel-
and PM10 Pollutants during a Severe Smog Event, Environ. Sci. ski, R., and Wildt, J.: The formation, properties and impact
Technol., 48, 1499–1507, 2014. of secondary organic aerosol: current and emerging issues, At-
Carmichael, G. R., Streets, D. G., Calori, G., Amann, M., Ja- mos. Chem. Phys., 9, 5155–5236, doi:10.5194/acp-9-5155-2009,
cobson, M. Z., Hansen, J., and Ueda, H.: Changing trends in 2009.
sulfur emissions in Asia: Implications for acid deposition, air He, H., Wang, Y., Ma, Q., Ma, J., Chu, B., Ji, D., Tang, G., Liu,
pollution, and climate, Environ. Sci. Technol., 36, 4707–4713, C., Zhang, H., and Hao, J.: Mineral dust and NOx promote the
doi:10.1021/es011509c, 2002.
www.atmos-chem-phys.net/15/2969/2015/ Atmos. Chem. Phys., 15, 2969–2983, 20152982 G. J. Zheng et al.: Exploring the severe winter haze in Beijing conversion of SO2 to sulfate in heavy pollution days, Sci. Rep., and evolution mechanism of regional haze: a case study in the 4, 4172, doi:10.1038/srep04172, 2014. megacity Beijing, China, Atmos. Chem. Phys., 13, 4501–4514, He, K., Zhao, Q., Ma, Y., Duan, F., Yang, F., Shi, Z., and Chen, G.: doi:10.5194/acp-13-4501-2013, 2013. Spatial and seasonal variability of PM2.5 acidity at two Chinese Lu, K. D., Hofzumahaus, A., Holland, F., Bohn, B., Brauers, T., megacities: insights into the formation of secondary inorganic Fuchs, H., Hu, M., Häseler, R., Kita, K., Kondo, Y., Li, X., Lou, aerosols, Atmos. Chem. Phys., 12, 1377–1395, doi:10.5194/acp- S. R., Oebel, A., Shao, M., Zeng, L. M., Wahner, A., Zhu, T., 12-1377-2012, 2012. Zhang, Y. H., and Rohrer, F.: Missing OH source in a suburban Jia, Y., Rahn, K. A., He, K.,Wen, T., andWang, Y.: A novel tech- environment near Beijing: observed and modelled OH and HO2 nique for quantifying the regional component of urban aerosol concentrations in summer 2006, Atmos. Chem. Phys., 13, 1057– solely from its sawtooth cycles, J. Geophys. Res., 113, D21309, 1080, doi:10.5194/acp-13-1057-2013, 2013. doi:10.1029/2008jd010389, 2008. Mauldin, R. L., Berndt, T., Sipila, M., Paasonen, P., Petaja, T., Kim, Jimenez, J. L., Canagaratna, M. R., Donahue, N. M., Prevot, A. S. S., Kurten, T., Stratmann, F., Kerminen, V. M., and Kulmala, M.: H., Zhang, Q., Kroll, J. H., DeCarlo, P. F., Allan, J. D., Coe, A new atmospherically relevant oxidant of sulphur dioxide, Na- H., Ng, N. L., Aiken, A. C., Docherty, K. S., Ulbrich, I. M., ture, 488, 193–196, doi:10.1038/nature11278, 2012. Grieshop, A. P., Robinson, A. L., Duplissy, J., Smith, J. D., Wil- Meier, J., Wehner, B., Massling, A., Birmili, W., Nowak, A., Gnauk, son, K. R., Lanz, V. A., Hueglin, C., Sun, Y. L., Tian, J., Laak- T., Brueggemann, E., Herrmann, H., Min, H., and Wiedensohler, sonen, A., Raatikainen, T., Rautiainen, J., Vaattovaara, P., Ehn, A.: Hygroscopic growth of urban aerosol particles in Beijing M., Kulmala, M., Tomlinson, J. M., Collins, D. R., Cubison, M. (China) during wintertime: a comparison of three experimental J., Dunlea, E. J., Huffman, J. A., Onasch, T. B., Alfarra, M. R., methods, Atmos. Chem. Phys., 9, 6865–6880, doi:10.5194/acp- Williams, P. I., Bower, K., Kondo, Y., Schneider, J., Drewnick, 9-6865-2009, 2009. F., Borrmann, S., Weimer, S., Demerjian, K., Salcedo, D., Cot- Meng, Z. Y., Xu, X. B., Yan, P., Ding, G. A., Tang, J., Lin, W. L., trell, L., Griffin, R., Takami, A., Miyoshi, T., Hatakeyama, S., Xu, X. D., and Wang, S. F.: Characteristics of trace gaseous pol- Shimono, A., Sun, J. Y., Zhang, Y. M., Dzepina, K., Kimmel, lutants at a regional background station in Northern China, At- J. R., Sueper, D., Jayne, J. T., Herndon, S. C., Trimborn, A. mos. Chem. Phys., 9, 927–936, 2009, M., Williams, L. R., Wood, E. C., Middlebrook, A. M., Kolb, http://www.atmos-chem-phys.net/9/927/2009/. C. E., Baltensperger, U., and Worsnop, D. R.: Evolution of Or- Nel, A.: Air pollution-related illness: effects of particles, Science, ganic Aerosols in the Atmosphere, Science, 326, 1525–1529, 308, 804–806, 2005. doi:10.1126/science.1180353, 2009. Ouyang, Y.: China wakes up to the crisis of air pollution, The Kaneyasu, N., Yamamoto, S., Sato, K., Takami, A., Hayashi, M., Lancet Respiratory Medicine, 1, p. 12, doi:10.1016/S2213- Hara, K., Kawamoto, K., Okuda, T., and Hatakeyama, S.: Impact 2600(12)70065-6, 2013. of long-range transport of aerosols on the PM2.5 composition at Peplow, M.: Beijing smog contains witches’ brew of microbes, Na- a major metropolitan area in the northern Kyushu area of Japan, ture, doi:10.1038/nature.2014.14640, 2014. Atmos. Environ., doi:10.1016/j.atmosenv.2014.01.029, in press, Pöschl, U.: Atmospheric aerosols: Composition, transformation, 2014. climate and health effects, Angew. Chem. Int. Edit., 44, 75200- Khalil, M. A. K. and Rasmussen, R. A.: Tracers of wood 7540, 2005. smoke, Atmos. Environ., 37, 1211–1222, doi:10.1016/s1352- Plaza, J., Gomez-Moreno, F. J., Nunez, L., Pujadas, M., and 2310(02)01014-2, 2003. Artinano, B.: Estimation of secondary organic aerosol for- Kimoto Electric Co., Ltd.: Technical Notes for Continuous Measur- mation from semicontinuous OC-EC measurements in a ing Methods for Atmospheric Suspended Particulate Matters, 3rd Madrid suburban area, Atmos. Environ., 40, 1134–1147, edn., March 2012, Osaka, Japan, 2012 (in Japanese). doi:10.1016/j.atmosenv.2005.11.007, 2006. Kimoto, H., Ueda, A., Tsujimoto, K., Mitani, Y., Toyazaki, Y., and Quan, J., Tie, X., Zhang, Q., Liu, Q., Li, X., Gao, Y., and Zhao, Kimoto, T.: Development of a Continuous Dichotomous Aerosol D.: Characteristics of heavy aerosol pollution during the 2012– Chemical Speciation Analyzer, Clean Technology, 23, 49–52, 2013 winter in Beijing, China, Atmos. Environ., 88, 83–89, 2013 (in Japanese). doi:10.1016/j.atmosenv.2014.01.058, 2014. Li, W. and Shao, L.: Transmission electron microscopy study of Ramanathan, V., Crutzen, P. J., Lelieveld, J., Mitra, A., Althausen, aerosol particles from the brown hazes in northern China, J. Geo- D., Anderson, J., Andreae, M., Cantrell, W., Cass, G., and Chung, phys. Res.-Atmos., 114, D09302, doi:10.1029/2008jd011285, C.: Indian Ocean Experiment: An integrated analysis of the cli- 2009. mate forcing and effects of the great Indo-Asian haze, J. Geo- Lim, H.-J., and Turpin, B. J.: Origins of primary and secondary or- phys. Res., 106, 28371–28398, 2001. ganic aerosol in Atlanta: Results of time-resolved measurements Ramanathan, V. and Carmichael, G.: Global and regional climate during the Atlanta supersite experiment, Environ. Sci. Technol., changes due to black carbon, Nat. Geosci., 1, 221–227, 2008. 36, 4489–4496, 2002. Saylor, R. D., Edgerton, E. S., and Hartsell, B. E.: Linear regres- Lin, P., Hu, M., Deng, Z., Slanina, J., Han, S., Kondo, Y., Takegawa, sion techniques for use in the EC tracer method of secondary N., Miyazaki, Y., Zhao, Y., and Sugimoto, N.: Seasonal and di- organic aerosol estimation, Atmos. Environ., 40, 7546–7556, urnal variations of organic carbon in PM2.5 in Beijing and the doi:10.1016/j.atmosenv.2006.07.018, 2006. estimation of secondary organic carbon, J. Geophys. Res., 114, Seinfeld, J. H. and Pandis, S. N.: Atmospheric Chemistry and D00G11, doi:10.1029/2008jd010902, 2009. Physics: from air pollution to climate change, 2nd Edition, John Liu, X. G., Li, J., Qu, Y., Han, T., Hou, L., Gu, J., Chen, C., Yang, Wiley and Sons, Inc., Hoboken, New Jersey, 2006. Y., Liu, X., Yang, T., Zhang, Y., Tian, H., and Hu, M.: Formation Atmos. Chem. Phys., 15, 2969–2983, 2015 www.atmos-chem-phys.net/15/2969/2015/
You can also read