High-resolution optical constants of crystalline ammonium nitrate for infrared remote sensing of the Asian Tropopause Aerosol Layer
←
→
Page content transcription
If your browser does not render page correctly, please read the page content below
Atmos. Meas. Tech., 14, 1977–1991, 2021
https://doi.org/10.5194/amt-14-1977-2021
This work is distributed under
the Creative Commons Attribution 4.0 License.

High-resolution optical constants of crystalline ammonium
nitrate for infrared remote sensing of the Asian
Tropopause Aerosol Layer
Robert Wagner1 , Baptiste Testa2 , Michael Höpfner1 , Alexei Kiselev1 , Ottmar Möhler1 , Harald Saathoff1 ,
Jörn Ungermann3 , and Thomas Leisner1
1 Institute of Meteorology and Climate Research, Karlsruhe Institute of Technology, Karlsruhe, Germany
2 Department    of Physics and Chemistry, University of Lyon, Lyon, France
3 Institute of Energy and Climate Research, Stratosphere, Forschungszentrum Jülich, Jülich, Germany

Correspondence: Robert Wagner (robert.wagner2@kit.edu)

Received: 29 June 2020 – Discussion started: 12 August 2020
Revised: 19 January 2021 – Accepted: 22 January 2021 – Published: 11 March 2021

Abstract. Infrared spectroscopic observations have shown          the Asian summer monsoon (Vernier et al., 2011). The for-
that crystalline ammonium nitrate (AN) particles are an           mation of the ATAL is related to the strong convection within
abundant constituent of the upper tropospheric aerosol layer      the Asian monsoon system, leading to the transport of bound-
which is formed during the Asian summer monsoon period,           ary layer pollutants to the tropical tropopause layer (Vernier
the so-called Asian Tropopause Aerosol Layer (ATAL). At           et al., 2018). Since its original discovery, the ATAL has been
upper tropospheric temperatures, the thermodynamically sta-       investigated by a variety of balloon-borne, aircraft-borne,
ble phase of AN is different from that at 298 K, meaning          and long-term satellite measurements (Höpfner et al., 2019;
that presently available room-temperature optical constants       Lau et al., 2018; Thomason and Vernier, 2013; Vernier et
of AN, that is, the real and imaginary parts of the complex       al., 2018, 2015; Yu et al., 2017). Additionally, chemical
refractive index, cannot be applied for the quantitative analy-   transport models have been used to simulate the chemical
sis of these infrared measurements. In this work, we have re-     composition and concentration of aerosol particles lifted to
trieved the first low-temperature data set of optical constants   and formed in the ATAL (Fairlie et al., 2020; Gu et al., 2016).
for crystalline AN in the 800–6000 cm−1 wavenumber range             The model simulations predicted that nitrate aerosol is
with a spectral resolution of 0.5 cm−1 . The optical constants    a prominent constituent of the ATAL. Ion chromatographic
were iteratively derived from an infrared extinction spectrum     analyses of filter samples collected during the BATAL cam-
of 1 µm sized AN particles suspended in a cloud chamber at        paigns (balloon measurements of the ATAL) (Vernier et
223 K. The uncertainties of the new data set were carefully       al., 2018), as well as in situ aerosol mass spectrometer
assessed in a comprehensive sensitivity analysis. We show         measurements during high-altitude research aircraft flights
that our data accurately fit aircraft-borne infrared measure-     within the StratoClim project (stratospheric and upper tropo-
ments of ammonium nitrate particles in the ATAL.                  spheric processes for better climate predictions) (Höpfner et
                                                                  al., 2019), confirmed the presence of nitrate aerosol particles.
                                                                  Another important step forward in understanding the chemi-
                                                                  cal composition of the ATAL was made by the analysis of in-
1   Introduction                                                  frared limb observations from various satellite missions dat-
                                                                  ing back as far as 1997 and from the abovementioned Strato-
The term “Asian Tropopause Aerosol Layer” (ATAL) was              Clim research flights over Nepal and India in 2017 (Höpfner
established in 2011 when analyses of CALIPSO lidar mea-           et al., 2019). A distinct infrared signature at 831 cm−1 with
surements revealed the existence of a layer of enhanced           a width of about 3 cm−1 , consistently observed for spectra
aerosol concentrations at altitudes from 13 to 18 km during

Published by Copernicus Publications on behalf of the European Geosciences Union.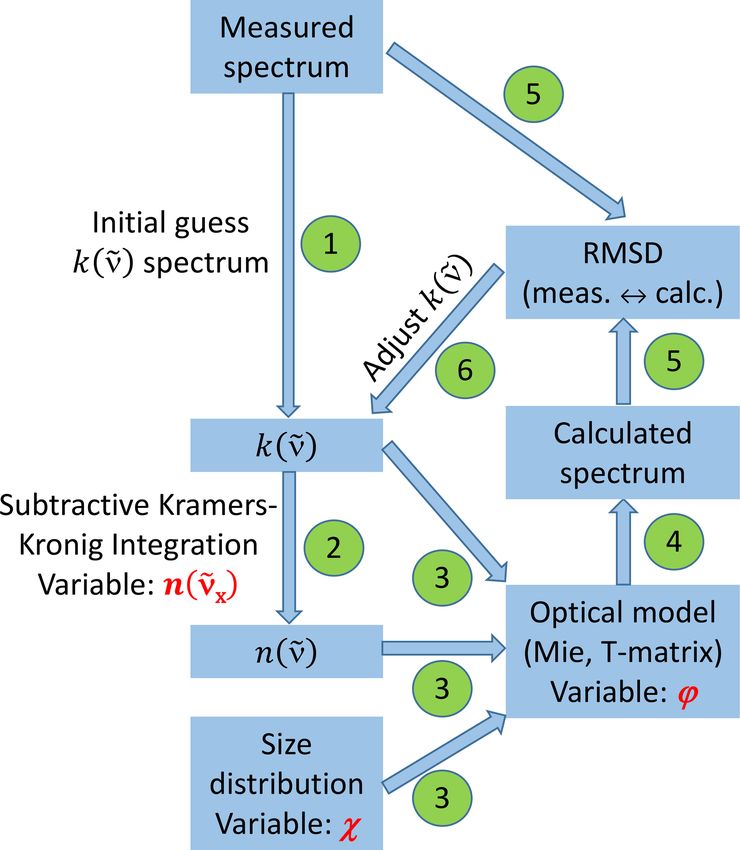
1978                                                    R. Wagner et al.: Optical constants of crystalline ammonium nitrate

recorded in the ATAL during the Asian summer monsoon,              AN is known to undergo various thermal phase transitions
was ascribed to the ν2 (NO− 3 ) mode of crystalline ammonium       (Chellappa et al., 2012; Herrmann and Engel, 1997). Specif-
nitrate (AN), suggesting that AN is a ubiquitous part of the       ically, there are different thermodynamically stable phases at
ATAL. The presence of NH3 in the upper troposphere during          room temperature (phase IV) and upper tropospheric tem-
the Asian summer monsoon, as required for the neutraliza-          peratures (phase V, stable below 255 K), going along with
tion of nitric acid and the formation of AN particles (Wang        marked changes of the habitus of the corresponding infrared
et al., 2020), had already been detected by previous satellite     spectra in certain wavenumber regimes, e.g., in the region
observations (Höpfner et al., 2016).                               between 1300 and 1500 cm−1 with contributions from the
   To support the interpretation of the satellite and aircraft-    ν4 (NH+                  −
                                                                            4 ) and ν3 (NO3 ) modes (Fernandes et al., 1979; Koch
based infrared measurements, laboratory infrared extinction        et al., 1996; Shen et al., 1993; Théorêt and Sandorfy, 1964).
spectra of crystalline AN particles and supercooled aque-             In this work, we have derived the first data set of com-
ous AN solution droplets have been recorded at tempera-            plex refractive indices of crystalline AN at low temperature
ture conditions of the upper troposphere in the aerosol and        (223 K) with a sufficient spectral resolution (0.5 cm−1 ) to
cloud simulation chamber AIDA (Aerosol Interaction and             resolve the ν2 (NO−   3 ) mode. The optical constants were de-
Dynamics in the Atmosphere) (Höpfner et al., 2019). These          duced for the wavenumber range from 800 to 6000 cm−1 , so
measurements confirmed that the signature at 831 cm−1 is           they can be employed for the analysis of measurements in
due to AN particles in the crystalline state, because the re-      any appropriate region in the mid-infrared not too strongly
spective ν2 (NO−  3 ) mode of supercooled aqueous AN solu-         affected by trace gas signatures. The complex refractive in-
tion droplets is shifted to 829 cm−1 and has a larger width        dices were iteratively derived from an infrared extinction
of about 6 cm−1 (Höpfner et al., 2019). The crystallization        spectrum of about 1 µm sized, almost pure crystalline AN
of AN from aqueous AN solution droplets can be induced             particles suspended in the AIDA chamber at 223 K (Sects. 2
by various heterogeneous mechanisms, including contact ef-         and 3.1). A comprehensive sensitivity analysis shows the
florescence (Davis et al., 2015), inclusion of insoluble dust      effect of measurement uncertainties and different assump-
grains (Han et al., 2002), or admixing small amounts of am-        tions regarding the shape of the AN particles (spherical or
monium sulfate (AS), which precipitates first and triggers         aspherical particle habits) on the optical constants deduced
the crystallization of AN (Schlenker et al., 2004; Schlenker       (Sect. 3.2). We demonstrate that this new data set is appro-
and Martin, 2005). The phase state of AN is crucial for pre-       priate to accurately fit infrared limb observations of AN in
dicting the impact that particles will have on cloud forma-        the ATAL (Sect. 3.3).
tion in the upper troposphere. Whereas supercooled aqueous
AN solution droplets only favor cirrus formation by homo-
geneous ice nucleation (Cziczo and Abbatt, 2001; Koop et           2     Methods
al., 2000), crystalline AN particles induce heterogeneous ice
formation at much lower relative humidities compared to ho-        2.1    Experimental setup
mogeneous freezing conditions (Shilling et al., 2006; Wagner
et al., 2020).                                                     The experimental setup has been described in detail in our
   To enable the quantitative analysis of the infrared limb        preceding articles (Höpfner et al., 2019; Wagner et al., 2020)
observations with respect to the total mass of AN, the in-         and will only briefly be summarized here. Figure 1 shows
frared ν2 (NO− 3 ) mode recorded in the AIDA chamber has           a scheme of the AIDA aerosol and cloud chamber facil-
been scaled by the particles’ mass concentration to yield          ity with the instrumentation employed in the present study
mass-specific absorption coefficients (Höpfner et al., 2019).      (Möhler et al., 2003; Wagner et al., 2006b, 2009). The 84 m3
More versatile input parameters for the accurate retrieval of      sized aerosol vessel, placed inside a temperature-controlled
aerosol parameters from infrared remote sensing measure-           housing, was cooled to a temperature of 223 K to record the
ments are the so-called optical constants, that is, the real and   low-temperature infrared extinction spectrum of crystalline
imaginary parts of the complex refractive index (Bohren and        AN particles in their thermodynamic phase V. The mean gas
Huffman, 1983; Zasetsky et al., 2007). To date, there exists       temperature was recorded by averaging the measurements of
only one data set of the complex refractive index of solid         four vertically oriented thermocouple sensors mounted at dif-
ammonium nitrate at infrared wavelengths (Jarzembski et            ferent heights of the chamber with an uncertainty of ±0.3 K.
al., 2003). The data were derived from the analysis of room-       The RHw (relative humidity with respect to supercooled wa-
temperature infrared spectra of AN compiled in a spectro-          ter) was controlled to 22 % by evaporating an equivalent
scopic library, measured using powders dispersed in an inert       amount of purified water (GenPure Pro UV ultrapure water
paraffin oil. For two reasons, however, this data set cannot       system, Thermo Scientific) into the chamber. The resulting
be applied for the analysis of the infrared limb observations      water vapor partial pressure, as measured by scanning the in-
of the ATAL. First, the optical constants are not provided         tensity of the rotational vibrational water vapor absorption
at sufficient spectral resolution to mimic the relatively nar-     line at 1.37 µm with a tunable diode laser (TDL) (Fahey et
row ν2 (NO−                            −1
            3 ) mode of AN at 831 cm . Second, crystalline         al., 2014), was divided by the saturation water vapor pressure

Atmos. Meas. Tech., 14, 1977–1991, 2021                                             https://doi.org/10.5194/amt-14-1977-2021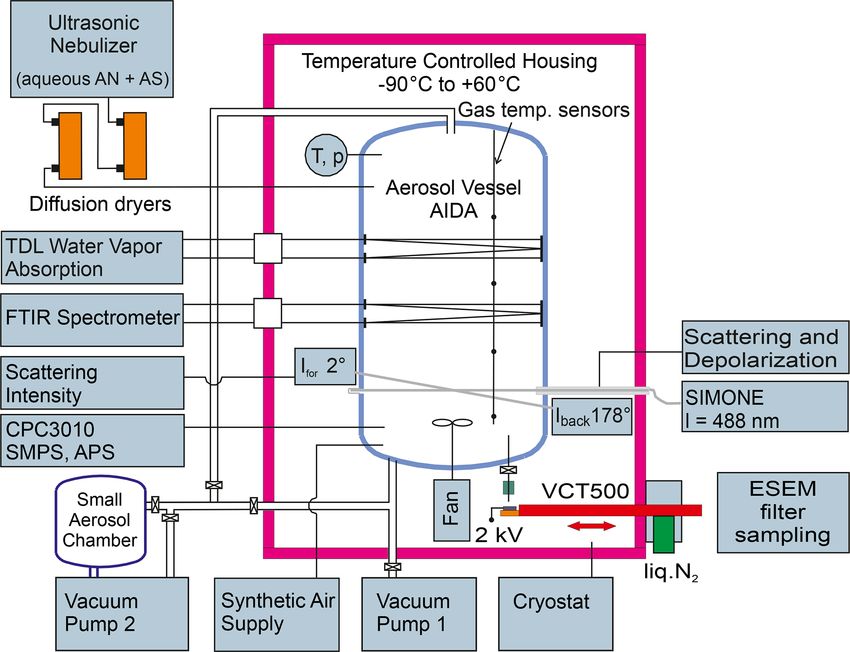
R. Wagner et al.: Optical constants of crystalline ammonium nitrate                                                            1979

over liquid supercooled water to compute RHw (Murphy and            crystallized within a period of 1 h after aerosol injection (see
Koop, 2005).                                                        Fig. 2a in Wagner et al., 2020). The infrared extinction spec-
   After the AIDA chamber was set to the desired temper-            trum of the almost pure, crystallized AN particles is shown
ature and relative humidity conditions, the injection of the        in Fig. 2a of our article, including the AN vibrational as-
mixed AN/AS aerosol particles was started. As described             signment according to Fernandes et al. (1979). The minor
above, a small admixture of AS was needed to catalyze               fraction of AS likely crystallizes as one of the double salts
the crystallization of AN. We prepared an aqueous solu-             2AN · AS or 3AN · AS (Bothe and Beyer, 2007; Schlenker
tion of 99.4 mol % AN and 0.6 mol % AS with an overall              and Martin, 2005), but their specific extinction signatures,
solute concentration of about 9 g per 100 mL by dissolv-            e.g., the additional sulfate mode at about 1100 cm−1 (Wag-
ing respective amounts of AN (99 %, VWR Chemicals) and              ner et al., 2020), are barely visible. We can therefore treat the
AS (99.5 % Merck) in purified water. The aqueous solu-              infrared measurement to a good approximation as a pure AN
tion was aerosolized with an ultrasonic nebulizer (GA 2400,         spectrum.
SinapTec). The particle flow of the mixed AN/AS solution               Concomitantly with their infrared spectrum, we measured
droplets was first dried to RHw ≤ 3 % with a set of silica          the particle number size distributions by combining the
gel diffusion dryers (Topas GmbH) and then injected into the        size spectra from a scanning mobility particle sizer (SMPS,
cooled AIDA chamber.                                                model 3071A, TSI, mobility diameter range 0.014–0.82 µm)
   In our preceding studies, we have analyzed in detail             and an aerodynamic particle spectrometer (APS, model
the composition-dependent crystallization behavior of the           3321, TSI, aerodynamic diameter range 0.523–19.81 µm). To
mixed AN/AS solution droplets by varying the amount of              convert the mobility diameter of the crystalline AN particles
AS and have found three different scenarios (Höpfner et             from the SMPS measurement into the equal-volume sphere
al., 2019; Wagner et al., 2020). (i) Pure 100 mol % AN so-          diameter, dp , we adopted a dynamic shape factor, χ, of 1.1 to
lution droplets did not crystallize at all and could be main-       account for the slightly aspherical particle habits of the AN
tained for at least 4 h in the supercooled liquid state at 223 K.   crystals (Hinds, 1999). The same value for χ as well as the
(ii) Mixed AN/AS solution droplets with an AS admixture             particle density of AN, ρ(AN) = 1.72 g cm−3 , were chosen
of ≥ 10 mol % already crystallized during the short tran-           to transform the aerodynamic diameter from the APS mea-
sit time through the diffusion dryers and were immediately          surement into dp (Hinds, 1999; Kelly and McMurry, 1992).
present as crystalline particles upon injection into the AIDA       The resulting number size distribution as a function of dp is
chamber. (iii) Mixed AN/AS solution droplets with smaller           shown in Fig. 2b. The dominant particle mode mostly falls
AS admixtures of 0.6 mol % and 2.9 mol % gradually crys-            into the measurement range of the APS instrument and is
tallized at low temperature inside the AIDA chamber, with           centered at dp = 0.98 µm. The integrated total number con-
the crystallization rate depending on RHw . We used two in          centration of the AN particles, Naer , is 985 cm−3 and is in
situ techniques to monitor the ongoing crystallization of the       good agreement with an independent measurement of Naer
AN/AS solution droplets in the AIDA chamber, namely, in-            with a condensation particle counter (CPC, model 3010,
frared extinction spectroscopy and laser light scattering with      TSI). The particle size measurement from Fig. 2b and the in-
depolarization measurements. A Fourier transform infrared           frared spectrum from Fig. 2a are the basic input parameters
(FTIR) spectrometer (IFS66v, Bruker) was coupled to an in-          for the retrieval scheme of the optical constants (Sect. 2.2).
ternal multiple reflection cell to measure aerosol infrared ex-     Note that these two measurements were carried out in an
tinction spectra over an optical path length of 166.8 m at          overlapping time range and lasted about 6 min. During this
wavenumbers between 800 and 6000 cm−1 with a resolu-                time, Naer varied by less than 0.5 %.
tion of 0.5 cm−1 (Wagner et al., 2006a). Five-hundred in-              Another important parameter for the implementation of
dividual scans were averaged for each spectrum. The grad-           the retrieval approach is the shape of the crystalline AN par-
ual crystallization of the AN/AS solution droplets was indi-        ticles. We have therefore recorded electron microscope im-
cated by the continuous decrease of the liquid water extinc-        ages of filter-collected AN particles from the AIDA chamber
tion band at about 3500 cm−1 . The near backscattering lin-         (Fig. 2c). Note that these images were obtained from a dif-
ear depolarization ratio, δ, of the aerosol particles at a scat-    ferent experiment with crystallized particles from 97.1 mol %
tering angle of 178◦ and a wavelength of 488 nm was mea-            AN and 2.9 mol % AS, but we do not expect that the slightly
sured by the light-scattering instrument SIMONE (Schnaiter          higher AS content significantly alters the particle shape. For
et al., 2012). A continuous increase of δ over time was indica-     particle sampling from the AIDA chamber, we have de-
tive of the formation of aspherical, crystalline AN particles       veloped a method to collect aerosol particles in the cryo-
and the concomitant loss of spherical, non-depolarizing so-         preserved state (Wagner et al., 2017). For that purpose, we
lution droplets. The crystallization of the aerosol population      used a vacuum cryo-transfer system (EM VCT500, Leica) to
was completed when a steady-state δ value was reached.              ensure an unbroken chain of cryogenic transfer steps from
   With regard to the crystallization experiment with the           particle sampling to electron microscopic analysis (Fig. 1).
99.4 mol % AN and 0.6 mol % AS solution droplets, the time          This avoids the polymorphic phase change of the solid AN
series of δ indicated that the entire particle population had       particles from phase V to IV, which might induce a change

https://doi.org/10.5194/amt-14-1977-2021                                              Atmos. Meas. Tech., 14, 1977–1991, 2021
1980                                                     R. Wagner et al.: Optical constants of crystalline ammonium nitrate

Figure 1. Scheme of the instrumentation of the AIDA aerosol and cloud chamber facility employed in the present study. The abbreviations
are explained in Sect. 2.1.

of particle morphology. The cryo-transfer unit includes a             2.2   Retrieval scheme for deriving the optical constants
liquid-nitrogen-cooled transfer shuttle with a silicon sub-
strate mounted on a copper sample holder. For particle sam-           The retrieval scheme, as sketched in Fig. 3, follows stan-
pling, the Si substrate was introduced through a pneumatic            dard procedures for the derivation of optical constants from
air lock into a sampling chamber located inside the isolat-           aerosol infrared extinction spectra (Dohm and Niedziela,
ing containment of the AIDA chamber. The sampling of the              2004; Earle et al., 2006; Norman et al., 1999; Segal-
AN particles was electrostatically assisted by directing the          Rosenheimer et al., 2009; Signorell and Luckhaus, 2002;
aerosol flow from the AIDA chamber through a polonium                 Zasetsky et al., 2005). Briefly, an initial guess for the
neutralizer (model 3077A, TSI) onto the sampling substrate            wavenumber-dependent spectrum of the imaginary part of
connected to a high-voltage power supply set to 2 kV. Af-             the complex refractive index, k(ν̃), was derived by sub-
ter sampling, the substrate was retracted into the pre-cooled         tracting the scattering contribution from the measured in-
shuttle without exposing it to the ambient air. Thereafter,           frared extinction spectrum (step 1). Using the subtractive
the shuttle was detached from the AIDA air lock and trans-            Kramers–Kronig transformation (Ahrenkiel, 1971; Milham
ferred under continuous supply of liquid nitrogen to the              et al., 1981), we then computed the real part of the com-
ESEM (environmental scanning electron microscope) labo-               plex refractive index, n(ν̃), for each wavenumber grid point
ratory, where it was introduced through the air lock into the         of the measured spectrum (step 2). In its subtractive form,
microscope (Quattro S, FEI, Thermo Fisher Scientific). The            the Kramers–Kronig relation needs a so-called anchor point,
sample imaging was conducted in the N2 atmosphere, thus               which is a known value for the real index of refraction at
avoiding sputtering of the particle surface normally required         some reference wavenumber, n (ν̃x ). As a reasonable esti-
for high-resolution imaging in an SEM. The electron micro-            mate for the anchor point, we employed a value of n = 1.56
scope images shown in Fig. 2c reveal that the crystalline AN          at 4600 cm−1 from the tabulated room-temperature refractive
particles are of rather compact shape with aspect ratios pre-         indices by Jarzembski et al. (2003). The anchor point value
dominantly in the range from 0.80 to 1.25. Similar morpholo-          was included as one of three parameters in our sensitivity
gies have been reported for crystallized AS particles (Earle et       analysis to investigate the variability of the retrieval results
al., 2006).                                                           for the optical constants on the uncertainty ranges of the in-
                                                                      put parameters (Sect. 3.2). In this analysis, we also consid-
                                                                      ered two other input values for n (ν̃x ), namely, 1.52 and 1.60.

Atmos. Meas. Tech., 14, 1977–1991, 2021                                                https://doi.org/10.5194/amt-14-1977-2021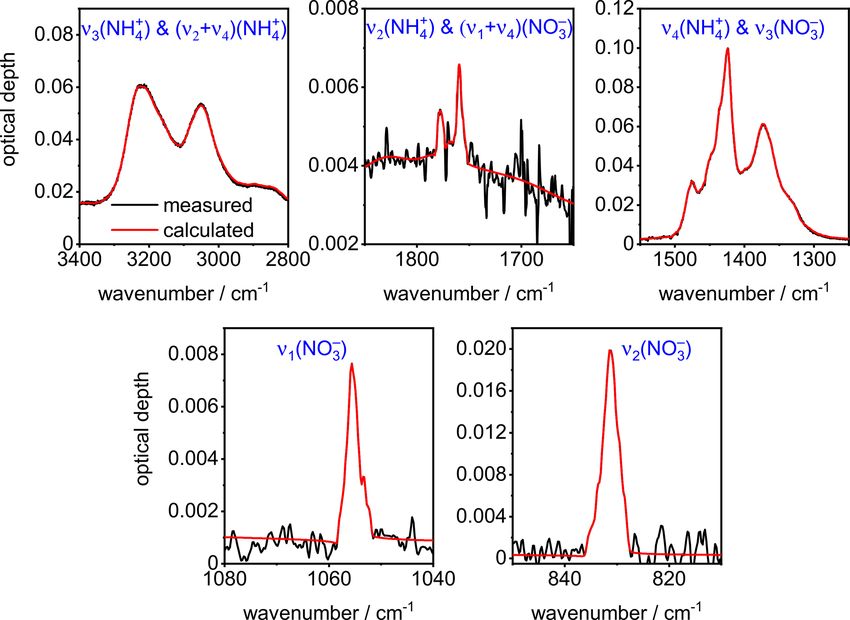
R. Wagner et al.: Optical constants of crystalline ammonium nitrate                                                                1981

                                                                       Figure 3. Flowchart of the retrieval scheme to deduce the optical
                                                                       constants of the crystalline AN particles. All abbreviations, sym-
                                                                       bols, and steps in the procedure (numbered green circles) are ex-
                                                                       plained in Sect. 2.2.

                                                                          In step 3 of the retrieval scheme, the n(ν̃) and k(ν̃) spec-
                                                                       tra as well as the size distribution of the AN particles were
                                                                       fed into the optical model to compute the extinction spec-
                                                                       trum. The size distribution measurement involved another
                                                                       sensitivity parameter, namely, the dynamic shape factor χ
                                                                       (Hinds, 1999). As explained in Sect. 2.1, this parameter was
                                                                       needed to account for the effect of shape on particle motion
                                                                       when converting the measured mobility and aerodynamic di-
                                                                       ameters of the crystalline AN particles into equal-volume
                                                                       sphere diameters as input for the optical model (Fig. 2b). Our
                                                                       best estimate for χ was a value of 1.1, as representative for
                                                                       slightly aspherical particle habits (Hinds, 1999). For χ = 1.1,
                                                                       we obtained a median particle diameter of 0.98 µm and a to-
Figure 2. (a) Infrared extinction spectrum of crystalline AN parti-    tal aerosol volume concentration, Vaer , of 410 µm3 cm−3 . In
cles recorded at 223 K. The notation of the AN vibrational modes       our sensitivity analysis (Sect. 3.2), we have repeated the re-
is according to Fernandes et al. (1979). (b) Concomitant number        trieval procedure of the optical constants with two other χ
size distribution of the almost pure AN particles crystallized from    values, namely, 1.05 and 1.15, in order to test the impact
solution droplets with 99.4 mol % AN and 0.6 mol % AS. The data        of the uncertainty of χ on the deduced refractive indices.
are shown as a function of the equal-volume sphere diameter, dp , as   For χ = 1.05, the median diameter of the dominant particle
obtained by converting the mobility and aerodynamic size spectra       mode is shifted to 0.96 µm, decreasing Vaer by about 7 % to
from the SMPS and APS measurements with ρ(AN) = 1.72 g cm−3            380 µm3 cm−3 , whereas for χ = 1.15, it is shifted to 1.00 µm,
and χ = 1.1. (c) Exemplary electron microscope images of filter-       increasing Vaer by about 7 % to 440 µm3 cm−3 .
sampled, continuously cooled AN crystals from a crystallization ex-
                                                                          The third sensitivity parameter was the particle aspect ra-
periment with 97.1 mol % AN and 2.9 mol % AS.
                                                                       tio, ϕ, employed in the optical model. We first derived the
                                                                       optical constants using Mie theory under the assumption of

https://doi.org/10.5194/amt-14-1977-2021                                                 Atmos. Meas. Tech., 14, 1977–1991, 2021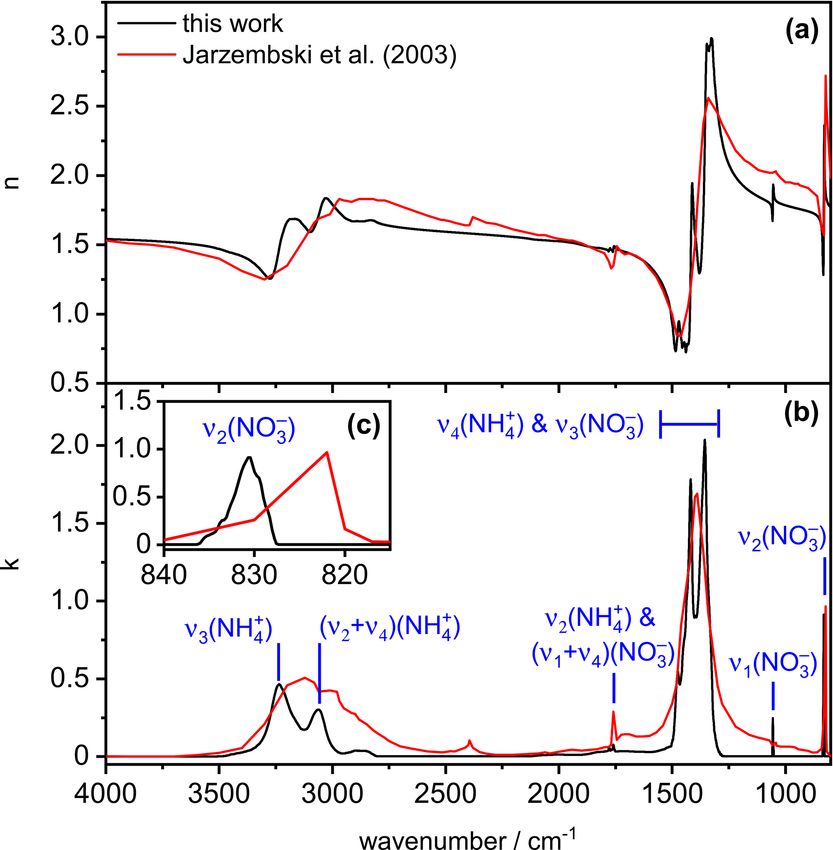
1982 R. Wagner et al.: Optical constants of crystalline ammonium nitrate
spherical particles (ϕ = 1). In the sensitivity analysis, we ad-
ditionally used the T-matrix code to model the AN particles
as randomly oriented spheroids with six different aspect ra-
tios between ϕ = 0.5 and 2.0 (Mishchenko and Travis, 1998).
After the computation of the extinction spectrum (step 4), we
calculated the root-mean-square deviation (RMSD) between
calculated and measured infrared spectrum (step 5), and we
finished the loop by iteratively adjusting the initial guess k(ν̃)
spectrum to minimize the RMSD (step 6). The computational
details of the retrieval scheme are described in Appendix A.
Figure A1 therein shows the good agreement between calcu-
lated and measured infrared spectrum after the minimization
procedure.
3 Results and discussion
3.1 The new low-temperature data set of optical
constants for crystalline AN
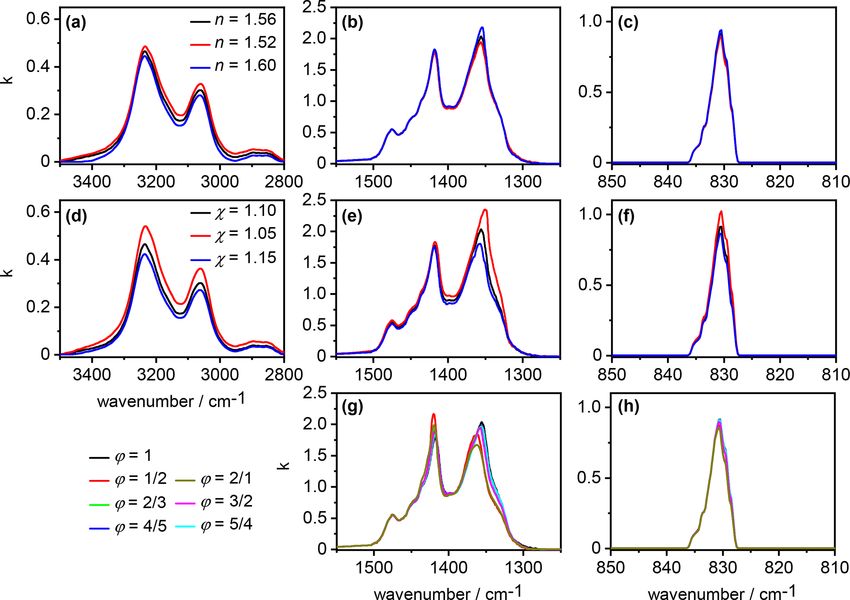
Figure 4 shows our newly derived, low-temperature com-
plex refractive index data set for crystalline AN, as ob-
Figure 4. Real (a) and imaginary (b) parts of the complex refractive
tained when employing the parameter values n (ν̃x ) = 1.56,
for solid AN at 223 K derived from this work (black lines) in com-
χ = 1.1, and ϕ = 1 in the retrieval scheme (black line). In parison with room-temperature data from Jarzembski et al. (2003)
comparison with the room-temperature data from Jarzembski (red lines). The insert (c) shows an expanded view of the k spectrum
et al. (2003) (red line), the general magnitude of the imagi- in the regime of the ν2 (NO− 3 ) mode.
nary indices in the various absorption regimes is similar, with
maximum k values of about 0.5, 2, and 1 in the wavenum-
ber regimes 2800–3500, 1250–1500, and 820–840 cm−1 , re- tributes to the observed frequency and intensity shifts with
spectively. The low-temperature k(ν̃) spectrum reveals more respect to the infrared spectrum of the AN film in that re-
fine structure in the 2800–3500 and 1250–1500 cm−1 absorp- gion. With regard to the ν2 (NO− 3 ) mode of AN, Koch et
tion regions compared to the room-temperature data set. Very al. (1996) did not observe any frequency shift upon cooling
similar temperature-dependent spectral changes have been from 270 to 90 K. Also, room-temperature infrared measure-
observed between the infrared spectra of AN films recorded ments of solid AN particles pointed to the same band position
at 270 and 90 K (Koch et al., 1996; see spectra B and C in at 831 cm−1 as in our low-temperature spectrum (Schlenker
their Fig. 4) and were attributed to the temperature-induced and Martin, 2005). The apparent shift of this band in the k
polymorphic phase change of AN between phase IV and spectrum reported by Jarzembski et al. (2003) (Fig. 4c) might
phase V. The peak positions of the infrared absorption bands therefore be related to the insufficient spectral resolution of
in our low-temperature k(ν̃) spectrum, that is, 3235 cm−1 the underlying infrared spectrum used for the retrieval of the
for ν3 (NH+ 4 ), 3062 cm
−1 for (ν + ν )(NH+ ), 1760 cm−1
2 4 4 optical constants.
for ν2 (NH4 ), 1055 cm for ν1 (NO−
+ −1
3 ), and 831 cm
−1 for
−
ν2 (NO3 ), are in good agreement with the tabulated val- 3.2 Sensitivity analysis
ues for ammonium nitrate films probed at 90 K (Koch et
al., 1996). In contrast, we observed a different spectral pat- An overview about our sensitivity analysis regarding the ef-
tern in the 1250–1500 cm−1 regime, with band maxima cen- fect of different values for the parameters n (ν̃x ), χ, and ϕ on
tered at 1356, 1418, and 1476 cm−1 , whereas peak posi- the retrieved k(ν̃) spectrum of the AN particles is shown in
tions at 1320, 1367, 1397, 1462, and 1492 cm−1 were re- Fig. 5. In the first part (panels a–c), we varied n (ν̃x ) between
ported by Koch et al. (1996). They emphasized that this par- 1.52 and 1.60 while keeping χ and ϕ constant at 1.1 and
ticular wavenumber region was very sensitive to the proce- 1, respectively. The associated changes in k(ν̃) were small;
dure by which the AN films were deposited, arguing that most notably, an increasing value for the real refractive in-
the ν4 (NH+ −
4 ) and ν3 (NO3 ) modes are prone to site-sensitive dex at the anchor point of 4600 cm−1 led to slightly decreas-
coupling due to their similar frequencies. Regarding our k(ν̃) ing intensities of the k(ν̃) spectrum in the N–H stretching
spectrum, we will show in Sect. 3.2 that the 1250–1500 cm−1 mode regime between 2800 and 3500 cm−1 , whereas the k
wavenumber regime is also particularly sensitive to the vari- values of the ν2 (NO− 3 ) mode at 831 cm
−1 almost remained
ation of the parameter values n (ν̃x ), χ, and ϕ, which con- unaffected. Different values for χ (panels d–f) immediately
Atmos. Meas. Tech., 14, 1977–1991, 2021 https://doi.org/10.5194/amt-14-1977-2021R. Wagner et al.: Optical constants of crystalline ammonium nitrate 1983
Figure 5. Sensitivity of the retrieved k(ν̃) spectrum on the parameters n(ν̃x ), χ , and ϕ in different wavenumber regimes. (a–c) Variation of
n(ν̃x ) with χ = 1.1 and ϕ = 1. (d–f) Variation of χ with n(ν̃x ) = 1.56 and ϕ = 1. (g, h) Variation of ϕ with n(ν̃x ) = 1.56 and χ = 1.1.
affected the size distribution and thereby the overall volume in the retrieved k(ν̃) spectrum as in the other wavenumber
concentration of the AN particles, Vaer , with lower values for regimes with the less intense absorption bands. The varia-
χ giving rise to lower values for Vaer (see Sect. 2.2). Within tion of χ only affected a certain wavenumber region between
the approximation that particle absorption is primarily gov- 1320 and 1370 cm−1 in the retrieval result for k(ν̃) (Fig. 5e).
erned by the magnitude of the imaginary index k, a lower In Appendix B and the associated Figs. B1 and B2, we pro-
value for χ , that is, Vaer , must be balanced by higher k val- vide an extended description of the peculiar signature of the
ues in the retrieved k(ν̃) spectrum. Such behavior was indeed AN infrared spectrum in the 1200–1500 cm−1 regime.
observed in the wavenumber regimes of the moderately in- Frequency and intensity of the surface modes are strongly
tense absorption bands of AN between 2800 and 3500 cm−1 dependent on the particle shape (Bohren and Huffman, 1983;
as well as 810 and 850 cm−1 . In particular, the k values were Clapp and Miller, 1993). We therefore obtained pronounced,
regularly increased or decreased over the whole wavenum- shape-dependent variations in the retrieval results for the
ber region of the absorption bands when χ was decreased or k(ν̃) spectrum in the 1200–1500 cm−1 regime when modify-
increased, respectively. ing the aspect ratio of the crystalline AN particles (Fig. 5g).
The above approximation breaks down in the regime of For spherical particles with ϕ = 1, the two most intense
the very intense vibrational modes of AN between 1200 maxima in the retrieved k(ν̃) spectrum were at 1418 and
and 1500 cm−1 . With high values for the imaginary index 1356 cm−1 , with the latter having the higher intensity. An
(k > 1), going along with high-amplitude anomalous disper- increasing degree of asphericity inverted the intensities of
sion signals in the n spectrum (Fig. 4), the resonance condi- these two maxima, with the 1418 cm−1 band slightly shifted
tion for inducing so-called Fröhlich or surface modes can be to higher wavenumbers and becoming the more intense one
fulfilled,
√ meaning that n approaches zero and k adopts a value and the 1356 cm−1 band, also slightly shifted to higher
of 2 (Bohren and Huffman, 1983; Clapp and Miller, 1993; wavenumbers, becoming the less intense one. These shape-
Leisner and Wagner, 2011). In such a case, there will be an dependent absorption signatures induce a further degree of
enhanced cross section in the absorption spectrum of small complexity to the infrared spectrum of AN in the 1200–
spherical particles, and the spectral habitus of an absorption 1500 cm−1 wavenumber regime, in addition to the variabil-
band (including, for example, band intensity and peak po- ity already highlighted by Koch et al. (1996) regarding the
sition) can strongly differ from the k(ν̃) spectrum. Regard- thin-film AN spectra. In contrast, the shape-dependent vari-
ing our sensitivity analysis, this meant that the variation of ations of the retrieved k(ν̃) spectrum in the regime of the
χ, that is, Vaer , did not lead to a regular, predictable change ν2 (NO− 3 ) mode were small (Fig. 5h). The maximum value
https://doi.org/10.5194/amt-14-1977-2021 Atmos. Meas. Tech., 14, 1977–1991, 20211984 R. Wagner et al.: Optical constants of crystalline ammonium nitrate
for k at 831 cm−1 varied by at most 6 % between the retrieval
results for the various aspect ratios, with a trend of decreas-
ing maximum value with increasing degree of asphericity.
The shape-related spectral changes in the 2800–3500 cm−1
regime of the k(ν̃) spectrum were insignificant and are there-
fore not shown.
3.3 Application of the new refractive index data set
We consider the refractive index data set derived for n (ν̃x ) =
1.56, χ = 1.1, and ϕ = 1 as our current best estimate for the
optical constants of crystalline AN at 223 K (Fig. 4). How-
ever, we also provide the data sets retrieved for all sensi-
tivity studies described in Sect. 3.2 and strongly encourage
any modelers who apply our data to take into account these
uncertainties of n and k in their own spectral analyses. Re-
garding the influence of particle asphericity investigated by
the T-matrix calculations, we have considered aspect ratios
partly exceeding the actual particle eccentricities as revealed
by the electron microscope images (Fig. 2c) to ensure that
we derived a valid upper estimate for the uncertainty of n
and k related to the shape dependency of the infrared extinc-
tion signatures of AN. As each individual n and k data set
relies on an idealized representation for the shape of the AN
particles (either spherical or spheroidal with a fixed aspect
ratio), modelers might also consider using a shape-averaged
n and k data set in their analyses (Mishchenko et al., 1997).
We used the new refractive index data set of AN to re-
analyze infrared limb observations of the ATAL with the
airborne GLORIA (Gimballed Limb Observer for Radiance
Imaging of the Atmosphere) instrument during the Strato-
Clim research flight on 31 July 2017 (Fig. 6a). The AN mass
concentrations derived with the n (ν̃x ) = 1.56, χ = 1.1, and
ϕ = 1 data set agree within 0.01 ± 0.06 µg m−3 (3σ ) with
those previously estimated using the mass-specific absorp-
tion coefficients (see Fig. 3b in Höpfner et al., 2019). Maxi-
mum deviations of about ±0.04 µg m−3 for the retrieved AN
Figure 6. (a) AN mass concentrations retrieved from GLORIA
mass concentrations are obtained in the sensitivity analysis measurements during the StratoClim research flight on 31 July 2017
when considering the uncertainties of the n and k values. using the n(ν̃x ) = 1.56, χ = 1.1, and ϕ = 1 refractive index data
The measured infrared spectrum of the ν2 (NO− 3 ) mode of set (see Fig. 3b in Höpfner et al., 2019, as a comparison). Red
the AN particles (blue line in Fig. 6b), showing the differ- line: aircraft altitude. (b) Difference of mean GLORIA spectra be-
ence of mean GLORIA spectra recorded in periods of high tween 04:15–04:21 and 04:35–04:43 UTC at 16.5–16.75 km alti-
and low AN mass concentrations, is accurately reproduced in tude (blue) and best spectral fit with the AN optical constants (or-
the spectral fit with the new optical constants (orange line). ange) in the range of the ν2 (NO− 3 ) mode.
Apart from the ν2 (NO− 3 ) mode, our new data set of refractive
indices also opens the possibility to exploit bands in other
spectral regimes for the detection and quantification of AN
in remote sensing observations of the atmosphere.
Atmos. Meas. Tech., 14, 1977–1991, 2021 https://doi.org/10.5194/amt-14-1977-2021R. Wagner et al.: Optical constants of crystalline ammonium nitrate 1985
Appendix A: Computational details of the retrieval in the version of the subtractive Kramers–Kronig transfor-
scheme mation to minimize the effect of truncation errors due to
the unknown behavior of k(ν̃) beyond the experimentally
Here, we describe the computational details of the indi- accessible wavenumber range (Ahrenkiel, 1971; Milham et
vidual steps in the retrieval scheme for deriving the in- al., 1981; Segal-Rosenheimer and Linker, 2009).
frared complex refractive indices of AN (Fig. 3). The Z∞
wavenumber-dependent complex refractive index, N (ν̃), is 2 ν̃k2 − ν̃x2 k (ν̃) ν̃
n (ν̃k ) = n (ν̃x ) + P dν̃ (A3)
ν̃ 2 − ν̃k2 ν̃ 2 − ν̃x2
given as N (ν̃) = n(ν̃) + ik(ν̃), with the real (n) and imag- π
0
inary (k) parts called the optical constants. Our retrieval
approach takes advantage of the Kramers–Kronig relation As described in Sect. 2.2, the anchor point value, n (ν̃x ),
(Bohren and Huffman, 1983), by which the real refractive was set to 1.56 at 4600 cm−1 . Two other values for n (ν̃x ),
index can be computed at any given wavenumber ν̃k from namely, 1.52 and 1.60, were adopted in our sensitivity
the full wavenumber spectrum of k(ν̃) (Eq. A1). analysis (Sect. 3.2). Prior to performing the Kramers–
Kronig integration, we extended the k(ν̃) spectrum below
Z∞ the 800 cm−1 cutoff of our infrared measurements with
2 k(ν̃)ν̃
n(ν̃k ) − 1 = P dν̃ (A1) the room-temperature k values reported by Jarzembski et
π ν̃ 2 − ν̃k2
0 al. (2003). These data are available down to 500 cm−1 but
just show one further, spectrally narrow absorption band at
In step 1 of our retrieval approach, where we derived 717 cm−1 with a maximum k value of about 0.1. To fully
an initial guess for the optical constants of AN from the capture this mode, it was sufficient to consider the range
measured infrared extinction spectrum, we made use of a from 800 to 690 cm−1 for the extension. We interpolated the
different form of the Kramers–Kronig relation, linking the Jarzembski et al. (2003) k data in this range to the resolu-
real and imaginary parts of the composite function f = tion of our measurements and added them to the k(ν̃) spec-
N 2 (ν̃) − 1 / N 2 (ν̃) + 2 (Rouleau and Martin, 1991).
trum below 800 cm−1 before the Kramers–Kronig integra-
Z∞ tion. The integral was computed with Maclaurin’s formula
2 Im {f } (ν̃) ν̃ method (Ohta and Ishida, 1988).
Re {f } (ν̃k ) = P dν̃ (A2)
π ν̃ 2 − ν̃k2 For the Mie calculations, modeling the crystalline AN par-
0 ticles as spheres with an aspect ratio, ϕ, of one, we extended
For the initial estimate of k(ν̃), we analyzed the extinction the Mie code provided by Bohren and Huffman (1983) to av-
spectrum of the 1 µm sized AN crystals in the framework of erage the computed extinction cross sections over the mea-
Rayleigh theory (Bohren and Huffman, 1983). The scattering sured number distribution of particle sizes. Due to their com-
contribution to extinction was subtracted from the measure- putational efficiency, the Mie computations were explicitly
ment by assuming its intensity to be proportional to ν̃ 4 (Nor- included in each iteration, meaning that for each new adjust-
man et al., 1999). In the Rayleigh limit, the so-derived ab- ment of the k(ν̃) and n(ν̃) spectra, a new Mie calculation
sorption spectrum is directly proportional to the total aerosol of the extinction spectrum was executed. In order to investi-
volume concentration, Vaer , and to the imaginary part of the gate the effect of particle shape on the retrieval results for the
composite function f , Im {f } (Ossenkopf et al., 1992). With optical constants, we also modeled the AN particles as ran-
Vaer given by the SMPS and APS size distribution measure- domly oriented spheroids, considering both oblate (ϕ > 1)
ments as discussed in Sect. 2.1, we could thus derive the full and prolate (ϕ < 1) particle shapes. To compute the extinc-
wavenumber spectrum of Im {f } from the estimated absorp- tion cross sections, we used the extended precision T-matrix
tion spectrum, perform the Kramers–Kronig integration in code for randomly oriented particles by Mishchenko and
Eq. (A2) to obtain the spectrum of Re {f }, and calculate the Travis (1998), choosing six different aspect ratios, namely,
initial guess for k(ν̃) from Re {f } and Im {f } (Leisner and ϕ = 1/2, ϕ = 2/3, ϕ = 4/5, ϕ = 5/4, ϕ = 3/2, and ϕ = 2.
Wagner, 2011; Segal-Rosenheimer et al., 2009). Here, the computational burden would have been too high
The initial guess k(ν̃) spectrum had to be iteratively ad- to perform a complete T-matrix computation of the size-
justed using Mie theory or the T-matrix method, because averaged extinction spectrum of the AN particles each time
the generic requirement for the validity of the Rayleigh ap- the k(ν̃) and n(ν̃) spectra were newly adjusted during the
proximation, that is, the AN particles have to be very small optimization procedure. We therefore computed a priori for
compared to any of the wavelengths (Bohren and Huffman, each aspect ratio an extinction cross section database on a
1983), was not fulfilled for the entire measurement range three-dimensional parameter space, which served as a look-
in the mid-infrared. The Kramers–Kronig integration in its up table in the retrieval procedure. Specifically, the extinction
form of Eq. (A2) was therefore only applied once in step 1 of cross sections were computed for
the retrieval scheme. In step 2, which was part of the loop – 27 equal-volume sphere size parameters xp (xp =
for the iterative adjustment of k(ν̃), we employed the di- π dp /λ) between 0.005 and 5 (0.005, 0.01, 0.03, 0.05,
rect relation between n(ν̃) and k(ν̃), implementing Eq. (A1) 0.1, 0.2–4.0 with 1xp = 0.2, 4.5, and 5),
https://doi.org/10.5194/amt-14-1977-2021 Atmos. Meas. Tech., 14, 1977–1991, 20211986 R. Wagner et al.: Optical constants of crystalline ammonium nitrate
– 30 values for the real refractive index n between 0.4 and – For wavenumber region 1500–2800 cm−1 , this regime
3.3 with 1n = 0.1, and includes two very weak but spectrally narrow absorp-
tion signatures between about 1750 and 1785 cm−1 ,
– 29 values for the imaginary refractive index k between presumably due to the ν2 (NH+ −
4 ) and (ν1 + ν4 )(NO3 )
0.0001 and 2.5 (0.0001, 0.025, 0.05, 0.075, 0.1–2.5 with modes (Fernandes et al., 1979; Koch et al., 1996). In
1k = 0.1), that part, we optimized all k(ν̃) values without any
smoothing filter. Outside the 1750–1785 cm−1 region,
summing up to 23 490 individual calculations for each as-
the residual absorption is spectrally broad and very
pect ratio. In the iterative loop of the retrieval scheme, the T-
small, so we either used a strong smoothing filter or
matrix computed extinction spectrum for a new adjustment
set the k values to a small, constant background value
of k(ν̃) and n(ν̃) was then simply obtained by spline in-
of 0.002. Note that Fernandes et al. (1979) have as-
terpolation from the pre-computed extinction cross section
signed further, very weak infrared bands of AN, mostly
database. We have validated the accuracy of the interpolation
combination modes, in the region between 2000 and
scheme with the denoted number of grid points in the (xp , n,
2800 cm−1 . We were not able to detect these signatures
k) space by the comparison between directly computed and
in our measured spectrum; hence, these bands are not
interpolated extinction cross sections.
represented in our retrieved k(ν̃) spectrum.
To minimize the root-mean-square deviation between
measured and calculated extinction spectrum, we used the – For wavenumber region 2800–3500 cm−1 , this regime
downhill simplex algorithm as the optimization technique comprises the intense N–H stretching modes and was
in the iterative adjustment of the k(ν̃) spectrum (Press et treated in the same way as the 1250–1500 cm−1
al., 1992). The measured spectrum is provided in a digital wavenumber region.
resolution of about 0.24 cm−1 , resulting from an approxi-
mately doubled size of the original interferogram due to zero- – For wavenumber region 3500–6000 cm−1 , in this non-
filling with a factor of 2 (Aroui et al., 2012). Overall, this absorbing regime, all k(ν̃) values were set to zero.
amounts to 21 572 wavenumber grid points for the k(ν̃) spec-
trum in the wavenumber range between 800 and 6000 cm−1 . A comparison between the measured (black lines) and the
The k(ν̃) spectrum of AN features regimes with vastly vary- computed (red lines) infrared extinction spectrum of crys-
ing types of absorption signatures, including, for exam- talline AN particles in five different wavenumber regimes
ple, completely non-absorbing regions, regimes of spectrally after convergence of the optimization algorithm is shown
broad but weak absorption, and regimes with strong absorp- in Fig. A1. The above description specifically relates to
tion bands, either spectrally broad or narrow. In the retrieval the retrievals performed with Mie theory. Regarding the T-
scheme, the various spectral regimes were treated differently matrix computations, the analysis of the extinction cross
and not all wavenumber grid points were included as opti- section database showed that the wavenumber region above
mization parameters. 1500 cm−1 was only prone to minor shape-related changes
for the considered range of aspect ratios. Therefore, the anal-
– For wavenumber region 800–1250 cm−1 , this regime ysis of the shape-dependent variations in the retrieval results
includes the spectrally narrow ν2 (NO− −
3 ) and ν1 (NO3 ) for the optical constants of AN was confined to the 800–
−1
modes at 831 and 1055 cm . Apart from these two pro- 1500 cm−1 regime (see Fig. 5g and h).
nounced bands, the absorption is very low. We therefore
optimized the k(ν̃) values in the regimes 826–836 and
1050–1060 cm−1 with the full spectral resolution. All Appendix B: Analysis of the infrared extinction
other k values were set to a small, constant background signature of the AN particles between 1200 and
value of 0.002 in order to not transfer the noise from the 1500 cm−1
baseline in the experimental spectrum to the k(ν̃) spec-
trum. In order to better understand the signature of the infrared
extinction spectrum of the crystalline AN particles in the
– For wavenumber region 1250–1500 cm−1 , this regime 1200–1500 cm−1 wavenumber regime, we show in Fig. B1
comprises the intense, spectrally broad absorption the comparison between the measured extinction spectrum
bands due to the ν4 (NH+ −
4 ) and ν3 (NO3 ) modes. (panel a) and the retrieved optical constants for n (ν̃x ) =
All k(ν̃) values were included in the optimization, 1.56, χ = 1.1, and ϕ = 1 (panel b). It is obvious that the
but we applied a weak smoothing function prior to spectral signature of the measured extinction bands of the
the Kramers–Kronig transformation to improve the AN particles is clearly different from that of the underlying
convergence behavior of the optimization algorithm k(ν̃) spectrum, that is, different from a bulk absorption spec-
(Savitzky–Golay smoothing filter, quadratic polynomial trum of AN whose intensity would be proportional to k(ν̃) · ν̃
fit with five data points in the moving window) (Press et (Bohren and Huffman, 1983). The two most intense max-
al., 1992). ima in the k(ν̃) spectrum at 1418 and 1356 cm−1 (dashed
Atmos. Meas. Tech., 14, 1977–1991, 2021 https://doi.org/10.5194/amt-14-1977-2021R. Wagner et al.: Optical constants of crystalline ammonium nitrate 1987
Figure A1. Comparison between the measured (black lines) and the computed (red lines) infrared extinction spectrum of crystalline AN
particles in five different wavenumber regimes after convergence of the minimization algorithm with n(ν̃x ) = 1.56, χ = 1.1, and ϕ = 1. The
notation of the AN vibrational modes is according to Fernandes et al. (1979).
red lines) are shifted to higher wavenumbers in the mea-
sured particle spectrum (1424 and 1373 cm−1 , dashed blue
lines), accompanied by significant changes in their relative
intensities. The intensity of the 1424 cm−1 band is dispro-
portionately high compared to that of the 1373 cm−1 band,
considering that the value of the imaginary refractive index
is almost identical at both frequencies (k ∼ 1.4). However,
the real refractive index at 1424 cm−1 is much lower than at
1373 cm−1 , thereby better fulfilling the resonance condition
for the manifestation of a Fröhlich,
√ or surface mode, in the
particle spectrum (n ≈ 0 and k ≈ 2) (Bohren and Huffman,
1983; Clapp and Miller, 1993). The same reasoning explains
the frequency shift of the particle extinction bands towards
higher wavenumbers compared to the maxima in the k(ν̃)
spectrum. Although this frequency shift leads to a reduction
of the magnitude of the imaginary index k, the intensity of
the particle extinction bands is enhanced due to the simulta-
neous decrease of the value for the real refractive index n,
yielding a higher cross section due to a better match with
the resonance condition. For a less intense absorption band Figure B1. Comparison between the measured infrared extinction
like the ν2 (NO− −1
3 ) mode at 831 cm , the amplitude of the
spectrum of crystalline AN particles (a) and the retrieved optical
anomalous dispersion feature in the n(ν̃) spectrum is reduced constants (b) in the 1200–1600 cm−1 wavenumber range. The re-
and there are no explicit frequencies where the optical con- trieval was performed with the parameters n(ν̃x ) = 1.56, χ = 1.1,
and ϕ = 1. Vertical dashed lines indicate peak positions in the par-
stants match the resonance condition. Therefore, the particle
ticle extinction spectrum (blue) and the k(ν̃) spectrum (red).
extinction band only experiences a minor frequency shift of
about 0.4 cm−1 compared to the location of the absorption
peak in the k(ν̃) spectrum (Fig. B2).
https://doi.org/10.5194/amt-14-1977-2021 Atmos. Meas. Tech., 14, 1977–1991, 20211988 R. Wagner et al.: Optical constants of crystalline ammonium nitrate Figure B2. Comparison between the measured infrared extinction spectrum of crystalline AN particles (a) and the retrieved optical constants (b) in the 800–860 cm−1 wavenumber range. The re- trieval was performed with the parameters n(ν̃x ) = 1.56, χ = 1.1, and ϕ = 1. Vertical dashed lines indicate the peak position in the particle extinction spectrum (blue) and the k(ν̃) spectrum (red). In our sensitivity analysis (Sect. 3.2), we have investigated the response of the retrieved k(ν̃) spectrum for the AN parti- cles to a change of the parameter χ , which controls the over- all aerosol volume concentration, Vaer . We have observed that in the 1200–1500 cm−1 regime, the variation of χ did not induce a regular increase or decrease of the k values over the whole frequency range (Fig. 5e). Obviously, the peak at 1418 cm−1 in the retrieved k(ν̃) spectrum is much less influenced by a change in Vaer than the absorption band at 1356 cm−1 . As a tentative explanation, one might argue that the particle extinction band at 1424 cm−1 , resulting from the k maximum at 1418 cm−1 , is less affected by Vaer , because its intensity is primarily governed by the strongly enhanced cross sections resulting from the match of the optical con- stants with the resonance condition. At 1356 cm−1 , the reso- nance condition is of much less importance for the band in- tensity, meaning that the magnitude of the retrieved k values at this frequency are more directly influenced by a change of χ, that is, Vaer . Atmos. Meas. Tech., 14, 1977–1991, 2021 https://doi.org/10.5194/amt-14-1977-2021
R. Wagner et al.: Optical constants of crystalline ammonium nitrate                                                                   1989

Data availability. All refractive index data sets derived in this      Clapp, M. L. and Miller, R. E.: Shape Effects in the Infrared Spec-
work can be downloaded from the KITopen repository, the cen-             trum of Ammonia Aerosols, Icarus, 105, 529–536, 1993.
tral publication platform for KIT (Karlsruhe Institute of Technol-     Cziczo, D. J. and Abbatt, J. P. D.: Ice nucleation in NH4 HSO4 ,
ogy) scientists, at https://doi.org/10.5445/IR/1000128813 (Wagner        NH4 NO3 , and H2 SO4 aqueous particles: Implications for cirrus
et al., 2021).                                                           cloud formation, Geophys. Res. Lett., 28, 963–966, 2001.
                                                                       Davis, R. D., Lance, S., Gordon, J. A., Ushijima, S. B., and Tolbert,
                                                                         M. A.: Contact efflorescence as a pathway for crystallization of
Author contributions. RW and MH conceptualized and supervised            atmospherically relevant particles, P. Natl. Acad. Sci. USA, 112,
the project. RW, BT, AK, MH, HS, and JU performed the experi-            15815–15820, 2015.
ments. BT, MH, and RW analyzed the data. OM and TL were re-            Dohm, M. T. and Niedziela, R. F.: Infrared complex refrac-
sponsible for the project administration. BT, MH, and RW devel-          tive indices for nopinone, Geophys. Res. Lett., 31, L14109,
oped software and implemented computer codes for the data anal-          https://doi.org/10.1029/2004gl019737, 2004.
ysis. RW, BT, AK, and MH created the graphs for this article. RW       Earle, M. E., Pancescu, R. G., Cosic, B., Zasetsky, A. Y., and Sloan,
and MH wrote the original manuscript draft. All authors contributed      J. J.: Temperature-dependent complex indices of refraction for
to review and editing.                                                   crystalline (NH4 )2 SO4 , J. Phys. Chem. A, 110, 13022–13028,
                                                                         2006.
                                                                       Fahey, D. W., Gao, R.-S., Möhler, O., Saathoff, H., Schiller, C.,
Competing interests. The authors declare that they have no conflict      Ebert, V., Krämer, M., Peter, T., Amarouche, N., Avallone, L. M.,
of interest.                                                             Bauer, R., Bozóki, Z., Christensen, L. E., Davis, S. M., Durry, G.,
                                                                         Dyroff, C., Herman, R. L., Hunsmann, S., Khaykin, S. M., Mack-
                                                                         rodt, P., Meyer, J., Smith, J. B., Spelten, N., Troy, R. F., Vömel,
                                                                         H., Wagner, S., and Wienhold, F. G.: The AquaVIT-1 intercom-
Acknowledgements. We gratefully acknowledge the continuous
                                                                         parison of atmospheric water vapor measurement techniques, At-
support by all members of the Engineering and Infrastructure
                                                                         mos. Meas. Tech., 7, 3177–3213, https://doi.org/10.5194/amt-7-
group of IMK-AAF, in particular by Olga Dombrowski, Rainer
                                                                         3177-2014, 2014.
Buschbacher, Tomasz Chudy, Steffen Vogt, and Georg Scheurig.
                                                                       Fairlie, T. D., Liu, H. Y., Vernier, J. P., Campuzano-Jost, P.,
This work has been funded by the Helmholtz-Gemeinschaft
                                                                         Jimenez, J. L., Jo, D. S., Zhang, B., Natarajan, M., Avery, M.
Deutscher Forschungszentren as part of the program “Atmosphere
                                                                         A., and Huey, G.: Estimates of Regional Source Contributions to
and Climate”. Additional funding has been received by the French
                                                                         the Asian Tropopause Aerosol Layer Using a Chemical Trans-
Erasmus+ agency.
                                                                         port Model, J. Geophys. Res.-Atmos., 125, e2019JD031506,
                                                                         https://doi.org/10.1029/2019JD031506, 2020.
                                                                       Fernandes, J. R., Ganguly, S., and Rao, C. N. R.: Infrared Spec-
Financial support. The article processing charges for this open-         troscopic Study of the Phase-Transitions in CsNO3 , RbNO3 and
access publication were covered by a Research Centre of the              NH4 NO3 , Spectrochim. Acta A, 35, 1013–1020, 1979.
Helmholtz Association.                                                 Gu, Y., Liao, H., and Bian, J.: Summertime nitrate aerosol in
                                                                         the upper troposphere and lower stratosphere over the Tibetan
                                                                         Plateau and the South Asian summer monsoon region, Atmos.
Review statement. This paper was edited by Andreas Macke and             Chem. Phys., 16, 6641–6663, https://doi.org/10.5194/acp-16-
reviewed by two anonymous referees.                                      6641-2016, 2016.
                                                                       Han, J. H., Hung, H. M., and Martin, S. T.: Size effect of
                                                                         hematite and corundum inclusions on the efflorescence relative
                                                                         humidities of aqueous ammonium nitrate particles, J. Geophys.
                                                                         Res.-Atmos., 107, 4086, https://doi.org/10.1029/2001JD001054,
References                                                               2002.
                                                                       Herrmann, M. J. and Engel, W.: Phase transitions and lattice dynam-
Ahrenkiel, R. K.: Modified Kramers–Kronig Analysis of Optical            ics of ammonium nitrate, Propellants Explos. Pyrot., 22, 143–
  Spectra, J. Opt. Soc. Am., 61, 1651–1655, 1971.                        147, 1997.
Aroui, H., Orphal, J., and Tchana, F. K.: Fourier Transform Infrared   Hinds, W. C.: Aerosol Technology, John Wiley & Sons, Inc., New
  Spectroscopy for the Measurement of Spectral Line Profiles, in:        York, 1999.
  Fourier Transform – Materials Analysis, edited by: Salih, S. M.,     Höpfner, M., Volkamer, R., Grabowski, U., Grutter, M., Orphal,
  InTech, New York, 69–102, 2012.                                        J., Stiller, G., von Clarmann, T., and Wetzel, G.: First de-
Bohren, C. F. and Huffman, D. R.: Absorption and Scattering of           tection of ammonia (NH3 ) in the Asian summer monsoon
  Light by Small Particles, John Wiley & Sons, Inc., New York,           upper troposphere, Atmos. Chem. Phys., 16, 14357–14369,
  1983.                                                                  https://doi.org/10.5194/acp-16-14357-2016, 2016.
Bothe, J. R. and Beyer, K. D.: Experimental determination of the       Höpfner, M., Ungermann, J., Borrmann, S., Wagner, R., Spang, R.,
  NH4 NO3 /(NH4 )2 SO4 /H2 O phase diagram, J. Phys. Chem. A,            Riese, M., Stiller, G., Appel, O., Batenburg, A. M., Bucci, S.,
  111, 12106–12117, 2007.                                                Cairo, F., Dragoneas, A., Friedl-Vallon, F., Hünig, A., Johansson,
Chellappa, R. S., Dattelbaum, D. M., Velisavljevic, N., and              S., Krasauskas, L., Legras, B., Leisner, T., Mahnke, C., Möhler,
  Sheffield, S.: The phase diagram of ammonium nitrate, J. Chem.         O., Molleker, S., Müller, R., Neubert, T., Orphal, J., Preusse, P.,
  Phys., 137, 064504, https://doi.org/10.1063/1.4733330, 2012.

https://doi.org/10.5194/amt-14-1977-2021                                                  Atmos. Meas. Tech., 14, 1977–1991, 2021
1990 R. Wagner et al.: Optical constants of crystalline ammonium nitrate Rex, M., Saathoff, H., Stroh, F., Weigel, R., and Wohltmann, I.: Rouleau, F. and Martin, P. G.: Shape and Clustering Effects on the Ammonium nitrate particles formed in upper troposphere from Optical Properties of Amorphous Carbon, Astrophys. J., 377, ground ammonia sources during Asian monsoons, Nat. Geosci., 526–540, 1991. 12, 608–612, https://doi.org/10.1038/s41561-019-0385-8, 2019. Schlenker, J. C., Malinowski, A., Martin, S. T., Hung, H. M., Jarzembski, M. A., Norman, M. L., Fuller, K. A., Srivastava, V., and Rudich, Y.: Crystals formed at 293 K by aqueous sulfate- and Cutten, D. R.: Complex refractive index of ammonium ni- nitrate-ammonium-proton aerosol particles, J. Phys. Chem. A, trate in the 2-20-µm spectral range, Appl. Opt., 42, 922–930, 108, 9375–9383, 2004. https://doi.org/10.1364/Ao.42.000922, 2003. Schlenker, J. C. and Martin, S. T.: Crystallization pathways of Kelly, W. P. and McMurry, P. H.: Measurement of Particle Density sulfate-nitrate-ammonium aerosol particles, J. Phys. Chem. A, by Inertial Classification of Differential Mobility Analyzer Gen- 109, 9980–9985, 2005. erated Monodisperse Aerosols, Aerosol. Sci. Tech., 17, 199–212, Schnaiter, M., Büttner, S., Möhler, O., Skrotzki, J., Vragel, M., https://doi.org/10.1080/02786829208959571, 1992. and Wagner, R.: Influence of particle size and shape on the Koch, T. G., Holmes, N. S., Roddis, T. B., and Sodeau, J. R.: Low- backscattering linear depolarisation ratio of small ice crystals temperature photochemistry of submicrometer nitric acid and – cloud chamber measurements in the context of contrail and ammonium nitrate layers, J. Phys. Chem., 100, 11402–11407, cirrus microphysics, Atmos. Chem. Phys., 12, 10465–10484, 1996. https://doi.org/10.5194/acp-12-10465-2012, 2012. Koop, T., Luo, B. P., Tsias, A., and Peter, T.: Water activity as the Segal-Rosenheimer, M. and Linker, R.: Impact of the non-measured determinant for homogeneous ice nucleation in aqueous solu- infrared spectral range of the imaginary refractive index on the tions, Nature, 406, 611–614, 2000. derivation of the real refractive index using the Kramers–Kronig Lau, W. K. M., Yuan, C., and Li, Z. Q.: Origin, Maintenance transform, J. Quant. Spectrosc. Ra., 110, 1147–1161, 2009. and Variability of the Asian Tropopause Aerosol Layer (ATAL): Segal-Rosenheimer, M., Dubowski, Y., and Linker, R.: Extraction of The Roles of Monsoon Dynamics, Sci. Rep.-UK, 8, 3960, optical constants from mid-IR spectra of small aerosol particles, https://doi.org/10.1038/s41598-018-22267-z, 2018. J. Quant. Spectrosc. Ra., 110, 415–426, 2009. Leisner, T. and Wagner, R.: Infrared Spectroscopy of Aerosol Shen, Z. X., Kuok, M. H., Tang, S. H., and Sherman, W. F.: Infrared Particles, in: Fundamentals and Applications in Aerosol Spec- Study of Phases III, IV and V of NH4 NO3 , Spectrochim. Acta troscopy, edited by: Signorell, R. and Reid, J. P., CRC Press, A, 49, 21–29, 1993. Boca Raton, 2011. Shilling, J. E., Fortin, T. J., and Tolbert, M. A.: De- Milham, M. E., Frickel, R. H., Embury, J. F., and Anderson, D. positional ice nucleation on crystalline organic and in- H.: Determination of optical constants from extinction measure- organic solids, J. Geophys. Res.-Atmos., 111, D12204, ments, J. Opt. Soc. Am., 71, 1099–1106, 1981. https://doi.org/10.1029/2005JD006664, 2006. Mishchenko, M. I. and Travis, L. D.: Capabilities and limitations of Signorell, R. and Luckhaus, D.: Aerosol spectroscopy of dihydrox- a current FORTRAN implementation of the T-matrix method for yacetone: Gas phase and nanoparticles, J. Phys. Chem. A, 106, randomly oriented, rotationally symmetric scatterers, J. Quant. 4855–4867, 2002. Spectrosc. Ra., 60, 309–324, 1998. Théorêt, A. and Sandorfy, C.: Infrared Spectra and Crystalline Mishchenko, M. I., Travis, L. D., Kahn, R. A., and West, R. A.: Phase Transitions of Ammonium Nitrate, Can. J. Chem., 42, 57– Modeling phase functions for dustlike tropospheric aerosols us- 62, 1964. ing a shape mixture of randomly oriented polydisperse spheroids, Thomason, L. W. and Vernier, J.-P.: Improved SAGE II J. Geophys. Res.-Atmos., 102, 16831–16847, 1997. cloud/aerosol categorization and observations of the Asian Möhler, O., Stetzer, O., Schaefers, S., Linke, C., Schnaiter, M., tropopause aerosol layer: 1989–2005, Atmos. Chem. Phys., 13, Tiede, R., Saathoff, H., Krämer, M., Mangold, A., Budz, P., Zink, 4605–4616, https://doi.org/10.5194/acp-13-4605-2013, 2013. P., Schreiner, J., Mauersberger, K., Haag, W., Kärcher, B., and Vernier, J. P., Thomason, L. W., and Kar, J.: CALIPSO detection Schurath, U.: Experimental investigation of homogeneous freez- of an Asian tropopause aerosol layer, Geophys. Res. Lett., 38, ing of sulphuric acid particles in the aerosol chamber AIDA, L07804, https://doi.org/10.1029/2010GL046614, 2011. Atmos. Chem. Phys., 3, 211–223, https://doi.org/10.5194/acp-3- Vernier, J. P., Fairlie, T. D., Natarajan, M., Wienhold, F. G., Bian, 211-2003, 2003. J., Martinsson, B. G., Crumeyrolle, S., Thomason, L. W., and Murphy, D. M. and Koop, T.: Review of the vapour pressures of ice Bedka, K. M.: Increase in upper tropospheric and lower strato- and supercooled water for atmospheric applications, Q. J. Roy. spheric aerosol levels and its potential connection with Asian Meteor. Soc., 131, 1539–1565, 2005. pollution, J. Geophys. Res.-Atmos., 120, 1608–1619, 2015. Norman, M. L., Qian, J., Miller, R. E., and Worsnop, D. R.: Infrared Vernier, J. P., Fairlie, T. D., Deshler, T., Ratnam, M. V., Gadhavi, complex refractive indices of supercooled liquid HNO3 /H2 O H., Kumar, B. S., Natarajan, M., Pandit, A. K., Raj, S. T. A., Ku- aerosols, J. Geophys. Res.-Atmos., 104, 30571–30584, 1999. mar, A. H., Jayaraman, A., Singh, A. K., Rastogi, N., Sinha, P. Ohta, K. and Ishida, H.: Comparison among Several Numerical In- R., Kumar, S., Tiwari, S., Wegner, T., Baker, N., Vignelles, D., tegration Methods for Kramers–Kronig Transformation, Appl. Stenchikov, G., Shevchenko, I., Smith, J., Bedka, K., Kesarkar, Spectrosc., 42, 952–957, 1988. A., Singh, V., Bhate, J., Ravikiran, V., Rao, M. D., Ravindrababu, Ossenkopf, V., Henning, T., and Mathis, J. S.: Constraints on Cos- S., Patel, A., Vernier, H., Wienhold, F. G., Liu, H., Knepp, T. mic Silicates, Astron. Astrophys., 261, 567–578, 1992. N., Thomason, L., Crawford, J., Ziemba, L., Moore, J., Crumey- Press, W. H., Teukolsky, S. A., Vetterling, W. T., and Flannery, B. rolle, S., Williamson, M., Berthet, G., Jegou, F., and Renard, J. P.: Numerical Recipes in C: The Art of Scientific Computing, B.: BATAL: The Balloon Measurement Campaigns of the Asian Cambridge University Press, Cambridge, 1992. Atmos. Meas. Tech., 14, 1977–1991, 2021 https://doi.org/10.5194/amt-14-1977-2021
You can also read