How to Effectively and Efficiently Communicate Research Results? Experimental Study on the Influence of Interactivity and Presentation
←
→
Page content transcription
If your browser does not render page correctly, please read the page content below
Journal of Education and Learning; Vol. 10, No. 4; 2021
                                                                                   ISSN 1927-5250 E-ISSN 1927-5269
                                                                Published by Canadian Center of Science and Education

    How to Effectively and Efficiently Communicate Research Results?
    Experimental Study on the Influence of Interactivity and Presentation
           form on Knowledge Transfer and Cognitive Activity
                              Andreas Krämer1,2, Sandra Böhrs3 & Susanne Ilemann3
1
    exeo Strategic Consulting AG, Bonn, Germany
2
    Value Research Institute, Iserlohn, Germany
3
    Simpleshow S.A., Luxembourg
Correspondence: Prof. Dr. Andreas Krämer, exeo Strategic Consulting AG, Wittelsbacherring 24, 53115 Bonn,
Germany. E-mail: andreas.kraemer@exeo-consulting.com

Received: May 10, 2021       Accepted: June 17, 2021    Online Published: June 24, 2021
doi:10.5539/jel.v10n4p87          URL: https://doi.org/10.5539/jel.v10n4p87

Abstract
When it comes to presenting research results, the usual approach is to use PowerPoint or similar slide
applications, or to opt for alternative presentation tools. A central question is how well the knowledge is
transferred and to what extent the target audience is addressed emotionally. Based on a 2*2 factorial design, the
effects of presentation form (PowerPoint slide presentation vs. explainer video) and interaction (no interaction vs.
interaction by means of additional questions on the topic) were investigated. Overall, the presentation factor is
more important for learning success than the interaction factor and explainer videos perform significantly better
than the PowerPoint presentation. This applies to the objective and subjective learning success, but also to the
emotional appeal and the increase in engagement, interest and other cognitive activities. The effects of the
interaction factor are relatively low, achieving minor improvements in combination with the PowerPoint
presentation, while no statistically significant and relevant effects were found in combination with the explainer
video.
Keywords: slide presentation, interactivity, explainer video, experimental online survey, learning effects
1. Introduction
In a world with an overabundance of information sources, contradictory statements and increasing complexity,
the efficiency of knowledge transfer is a key challenge. In order to improve the learning process four main
elements are emphasized: learning result (knowledge achievement), content type, learning method and delivery
media (Clark, 2008; Rusli et al., 2014). When it comes to delivery media there are considerable controversies
regarding advantages and disadvantages of different multimedia. Here, the level of interactivity and the type of
visualization are two prominent facettes (Koć-Januchta et al., 2020).
The question of how to communicate research results effectively and efficiently is not only important for the
school or university sector, but also for companies. In this context, two developments concerning the factor
delivery media should be considered. First, traditional forms of knowledge transfer, such as the use of slide
presentations, represent the standard, despite various criticisms, both in the field of education and business.
Second, consumer preferences are changing at a rapid pace in favor of videos (Krämer & Böhrs, 2020) while at
the same time the trend of MOOCs (Massive Open Online Courses) leads to the usage of videos for teaching
(Khalil & Ebner, 2013; Krämer & Böhrs, 2015). Although there are examples of companies abandoning the use
of PowerPoint or similar slide programs altogether—the case of Amazon, where Jeff Bezos banned his
employees from using PowerPoint presentations, is one of the most prominent (Ciriello et al., 2015)—these are
rather isolated cases. For most companies, it is more likely that PowerPoint is judged to be virtually
indispensable in everyday work. In this context, Gabrielle (2010) highlights, “PowerPoint is more than a visual
aid for presenters, it has become one of the business leaders most important tools for winning in the idea market
place (competition for attention, budget and headcount by selling ideas). In this logic, therefore, it is not only a
matter of transmitting information, but also the aspect of persuasion and decision support. Here, a core challenge
is how well the central messages reach the target persons and remain present in their minds.”

                                                        87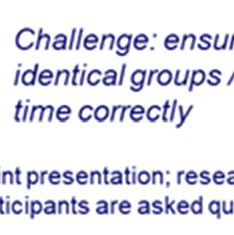
jel.ccsenet.org                            Journal of Education and Learning                       Vol. 10, No. 4; 2021

In recent years the use of videos as a learning tool has been growing steadily, driven by an increasing relevance
of eLearning (Zhang & Nunamaker, 2003) in general and ODL (Open and Distance Learning) in particular
(Fozdar, 2015). Videos play a crucial role since video is by far one of the most powerful and expressive
non-textual media that captures and conveys information in education (Hampapur & Jain, 1998) and enhances
creative problem-solving skills (Mayer, 1997). At the same time, companies use eLearning programs (including
videos as a main element) to take advantage of the possibilities of digitization to achieve economies of scale in
the transfer of knowledge among employees (Derouin, Fritzsche, & Salas, 2005).
2. Focus on Improvements in the Learning Process
2.1 Explainer Videos as a Learning Tool
Explainer videos effectively convey complex facts to a target group within a very short time (Tu, 2015; Sedej,
2019). Characterizing features are storytelling and multisensory elements (Schmelzle, 2014; Wright, 2004).
Explainer videos are usually one to three minutes long. Rather than going into detail, they focus on the most
relevant facts. The visualization includes animated illustrations, graphics, or photos. There are different types of
explainer videos, such as paper cut-out or so-called papermation videos, live scribble, whiteboard animation, or
fully animated explainer videos (Kulgemeyer, 2018). In recent years, a larger number of providers have
established themselves that enable the independent online creation of videos, with explainer videos representing
only one aspect. One particularly prominent example is the DIY platform Powtoon (Graham, 2015). While there
are a range of other DIY animated video creator tools on the market such as Vyond or simpleshow video maker,
the corporate market is still largely serviced by full-service providers, a few of the better known being Switch
Video, Firestarter, epipheo, You-know, explainity and again simpleshow. The simpleshow video maker tool has
a distinct approach: Here, the creation process of a video is text-based, analogous to the first step in a full-service
project approach. Thereafter, the visualization is generated in the tool by artificial intelligence (AI). In an
automated process (image composition, animation and sound), the customer receives an individual video based
on the provided storyline (Krämer & Böhrs, 2015).
Online video has quickly emerged as the preferred content medium for business-to-business (B2B) marketers
around the world (Krämer & Böhrs, 2016; Krämer & Böhrs, 2017a). The scope of application (compliance,
strategic topics, processes in sales and production, IT, new programs, etc.) is extremely broad (Krämer & Böhrs,
2018; Sedej, 2019). Today, explainer videos are used at all stages of the sales cycle to educate, entertain, inspire,
and engage potential customers (Litt, 2014), both in the B2B and B2C market. Another area of application is
education (Laaser & Toloza, 2017; Krämer & Böhrs, 2015). There are different assessments regarding the
performance of explainer videos as a learning tool. While some authors emphasize the innovative character,
other researchers express doubts about the efficient use of such tools. Thus, Laaser and Toloza (2017) point out
that “the fun effect of the animation techniques can also provoke the illusion that learning is extremely easy and
that the content presented is a fast-track to acquiring knowledge”. Gamble (2016) briefly and succinctly
describes: “Animated explainer video shops have been growing like weeds… Here, our concern is quality….”
However, there are also studies that empirically examine the learning effect of different types of explainer videos
and confirm generally positive effects in knowledge transfer, but also considerable differences in the effect
depending on the design (Krämer & Böhrs, 2017b; Kulgemeyer, 2018).
2.2 Slide Presentations as a Learning Tool
PowerPoint, the world-leading presentation software developed by Microsoft, is used for displaying specific
digital content to target audiences. The application establishes an organizational structure in slides, in which a
bulleted presentation of instructional material summarizes the main ideas of instructors in a well-ordered manner
(Susskind, 2008). Slide presentations have become popular because of the option to reduce complex issue to
some basic aspects. As Gabriel (2008) describes: “Instead of having to plough through lengthy reports, busy
business people could quickly skim through a few transparencies and absorb the essential features of a case or an
argument”, indicating that slide presentations are perceived as easier to comprehend compared to information
provided in mere text form.
Although the program enjoys a high level of popularity, its use in education, among other areas, has been
criticized. Basically, it is doubted that the tool is suitable as a learning tool (Lane, 2008). Yet, research on the
effectiveness of PowerPoint as a learning tool is limited (Penciner, 2013). When comparing PowerPoint and
Prezi in a classroom Chou et al. (2015) describe PowerPoint to be a cost-effective approach to delivering
instructional content. In order to improve PowerPoint’s effectiveness in learning success researchers and
academics recommend “employing more relevant images with narration and less text” (Penciner, 2013),
embedding video, audio, and hyperlink documents (Clark, 2008) or using the application as an interactive

                                                          88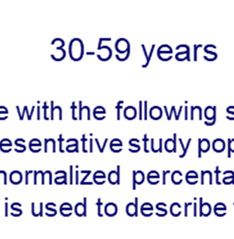
jel.ccsenet.org                          Journal of Education and Learning                       Vol. 10, No. 4; 2021

element of presentations (Jordan & Papp, 2014). Despite these possibilities, the practical use is often not very
innovative, PowerPoint is used by lecturers more text-based and less interactive (Pamadhi & Zulfiati, 2019). The
same applies to the business environment. Hertz, van Woerkum and Kerkhof (2013) confirm that even after
more than one decade of discussion about the deficits of PowerPoint presentations, typical criticisms such as an
overabundance of text or an overly monotonous presentation of results still are valid. Slide presentations can be
used to give a presentation in person, but also to document results or structures. When presenting study results
from market research typically a chart presentation is provided for documenting the findings (Sarstedt & Mooi,
2014). Although the results can be communicated much better in this way than in the context of tabular reports,
enthusiasm is also limited among market researchers and their clients with regard to the usual presentation of
results. For this reason, alternatives have been discussed for quite some time, namely the change from
PowerPoint presentation to the integration of dashboards for result summarization (Zhang et al., 2020) and
substitution by new media (Brewster, 2011).
2.3 Interaction as a Determinant for Learning Success
Interaction is considered to be an important element to increase learning success (Geri, 2017; Koć-Januchta et al.,
2020). Conversely, the absence of interactivity can be a barrier to knowledge transfer. Criticism of the use of
slide presentations, for example, mainly concerns the lack of interaction (Penciner, 2013; Brewster, 2011).
There are different aspects to be considered in the interaction, among others the direction of the interaction and
the form of the interaction. Garrison and Shale (1990) defined various styles of education covering content,
students and teachers. In a digital multimedia environment “student-content interaction” initiated by the
computer system has a particularly high relevance (Schär & Krueger, 2000; Nandi et al., 2015).
A target audience’s interaction may include reading informational texts, using study guides, watching videos,
interacting with computer-based multimedia, and completing assignments and projects. But there are also risks.
For example, animations may disadvantageously increase the cognitive load. The cognitive load theory (van
Merriënboer & Sweller, 2005) is linking cognitive effort to the learning process (Paas et al., 2004). In addition to
images and animations, researchers have also examined the strategies of embedding questions or providing
students with notes/handouts that align with the PowerPoint (Valdez, 2013). One way to reduce mental effort is
to provide learners with a possibility to control the pace and sequence of processing the information (Tabbers &
de Koeijer, 2010). That way, learners have the opportunity to adjust the presentation speed to their needs i.e.,
subjects make use of the possibility to select relevant information and to organize and integrate it into a mental
model (Mayer & Chandler, 2001).
2.4 Background of Study and Objectives
Simpleshow is a media company (founded in 2008) specializing in the provision of tools and services for the
creation of explainer videos, mainly in the business sector. While an accumulated full-service production volume
of approximately 25,000 videos has gained simpleshow the leading position in this worldwide market, the online
DIY tool simpleshow video maker has outgrown the service offering of the company in the past years. Since its
launch in April 2016, a seven-digit number of online videos has been created on the digital platform by its
hundreds of thousands of users. The format approach of simpleshow explainer videos is to summarize
information and improve the learning outcome using empathetic storytelling and a finely tuned interplay of
sound and image. This makes this charming and engaging format a perfect key element for an online course.
The general objective of the study is to explore the future prospects of explainer videos and the learning effects
compared with a traditional slide presentation using a quantitative approach and taking into account different
user segments and variations in video affinity. The goal is also to analyze the effectiveness (learning effect) and
efficiency (ratio learning effect per time of consumed video) of the explainer video as a format to improve the
knowledge base of the user in comparison with a PowerPoint presentation and to investigate moderating effects
of interactive elements while presenting study results.
The basic population for the study comprises customers who have created explainer videos themselves using the
DIY tool on the simpleshow video maker platform or who have commissioned the creation of explainer videos
as corporate customers. Therefore, the sample is not aiming to meet population-representative structures, but to
represent the customer structure of the company simpleshow well. Since Germany is a major market for
simpleshow, the study was conducted in German-speaking countries.
2.5 Research Questions
The study aims to provide answers to the following questions:
     •    How strong are respondents’ preferences for consuming videos on the one hand and texts on the other?

                                                        89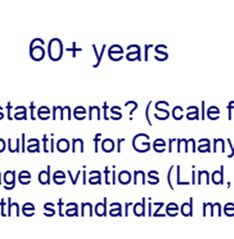
jel.ccsenet.org                                    Journal of Education and Learning                                  Vol. 10, No. 4; 2021

           How do the structures of the sample match the results of representative studies? Can clusters with
           homogeneous media preferences be identified?
     •     How do respondents use explainer videos and slide presentations in their private and professional lives
           in general, and specifically what potential exists for either replacing or expanding slide presentations
           with explainer videos?
     •     How do different presentation styles such as slide presentations and explainer videos (EV) perform in
           terms of knowledge effect (case study: results on the relevance of remote work during the COVID-19
           crisis)? Is the integration of interactive elements (e.g., additional questions about the content shown) a
           key to increase knowledge transfer?
     •     How can the empirical results be classified in the current state of research on the learning effect of
           explainer videos and what recommendations can be made for the practical use of explainer videos as a
           substitute or supplement to a slide presentation?
3. Method
3.1 Procedures and Methodology
In order to answer the research questions, an empirical study was carried out. It provided insights into different
customer segments of simpleshow. In addition to the economic benefits of an online research study, this survey
type also has further substantive advantages for an experimental testing. This is particularly true when different
types of information such as videos and graphics will be presented during the interview (Krämer, 2016).
The online survey—representing two different sample groups—was conducted in March 2021 and was focused
on B2C (Education) and B2B (Corporate) segments (see Table 1). In total 472 interviews could be used for the
analysis. The average time to complete the interview was almost 14 minutes.

Table 1. Sample groups and characteristics
         Sample group*            Interviews (field, 2021)      Respondents              Interview time          Age (years)
         # 1 Education                 March 15th –24th         N=220 (47%)              ∅ 12.6 min              ∅ 45.5 y.
         # 2 Corporations              March 15th –28th         N=252 (53%)              ∅ 14.6 min              ∅ 44.5 y.
         Total                         March 15th –28th         N=472 (100%)             ∅ 13.7 min              ∅ 45.0 y.
Note. * Total contacts: 29,190, net response rate = 1.6%. Respondents with an unrealistic short interview time were eliminated (Note 1).

Segments differ significantly in terms of age groups, creation or commissioning of explainer videos, and
simpleshow video maker (SVM) use (see Appendix A).
3.2 Structure of the Study and the Experiment
The survey consists of a general part in which respondents provide information about how often they use
explainer videos and what their media preferences are (in particular, affinity for consuming texts vs. videos) in
order to be able to cluster interviewees according to their preferences (Riding & Douglas, 1993).
In a special part, an experiment is conducted. The framework conditions for the test groups had been identical.
For the experiment, a popular topic was selected, for which actual market research data were available (Krämer
& Hercher, 2021, published in Feb. 2021). The purpose of the experimental design is to test the effect of the
independent and dependent variables. The independent variable is the type of presentation of actual research
results concerning the relevance of remote work during the COVID-19 pandemic with two kinds of treatment:
presentation (PowerPoint PPTX slides vs. explainer video, EV) and the interaction (yes = additional questions
while presenting the results vs. no = no additional questions while presenting the results) as the moderator
variable. The type of interaction can be described by a “student-content interaction” initiated by the computer
system (Schär & Krueger, 2000, see Note 2). The dependent variable is the result of a knowledge test as well as
the perceived quality of the presentation. The experimental design is ANOVA 2x2 univariat factorial experiment.
Within the online survey, respondents are randomly assigned to test groups. In the final data set, the structural
equality of the test groups was examined and confirmed. Before the experiment started, test subjects were asked
about current employment. On the one hand, this was intended to ensure conditioning for the topic of the
presentation; on the other hand, it was possible to check that, for example, the proportion of subjects with home
office work was equally distributed across the test groups (Figure 1).

                                                                     90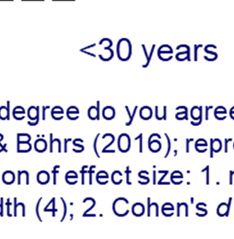
jel.ccsenet.oorg                            Journal of Edducation and Leearning                         Vol. 10, No. 4; 2021

                     Figurre 1. Different steps to conduuct the experim
                                                                      ment and speciific challenges

In additionn to the core arreas of the studdy, there is a sscreening part at the beginninng of the onlinne interview. At
                                                                                                                      A the
end of the interview, dem mographic chaaracteristics weere recorded, w   which later servved as descriptive variables.
3.3 Measuurement of the Learning
                        L        Effecct (Knowledgee Test)
Having woorked through the computer--presented matterial, participants were giveen a post-test ffor overall learrning
performannce. Questions were related tto the core finddings presenteed to the audieence. Immediattely following this,
participantts were asked to
                         t evaluate staatements measuuring the indivvidual perceptiion of the stylee of presentatio
                                                                                                                  on.
Questions to quantify leearning successs were deriveed from the reeference preseentation (PPTX   X, results from
                                                                                                               m the
study OpinnionTRAIN 20020). At the eend of the interrview, particippants from all test groups were given the same
questions, consisting of objective
                         o                                                                       wledge tests were:
                                   quesstions (with staandard answerss). Key elemennts of the know
     •     Inn total, 5 questtions were askked after preseenting the results from the m
                                                                                      market researchh (multiple cho
                                                                                                                   oice).
           These questionss covered mainn topics of the presentation/eexplainer videoo.
           T
     •     C
           Correct answerss were rated ass plus points, w
                                                        wrong answerss were rated ass minus points..
     •     15 optional ansswers were offfered: 7 correcct answers (maaximum resultt: 7 points) andd 8 wrong ansswers
           (m
            minimum resuult: -8 points).
3.4 Data A
         Analysis
To examinne the significaance within thhe two sample groups (as weell as other spliits according tto age group or test
group) andd to statisticallly evaluate bacckground charracteristics, thee repeated meaasures ANOVVA, given its ab bility
to perform m overall com  mparisons, Chii-Square tests and T-test w    were used. In addition to tthe parameters for
                           t effect size is controlled iin order to exaamine the relevvance of meassured differenc
statistical significance, the                                                                                    ces in
knowledgee or perceptioons (Sullivan & Feinn, 20012). K-Meanss-Clustering w          was used for segmentation. All
statistical aanalyses of thee data are baseed on SPSS verrsion 22.
4. Results
4.1 Experiiences with thee Creation of E
                                       Explainer Videeos
In the firstt part of the suurvey, study pparticipants repported on howw they use expllainer videos aand how often they
create themm themselves. More than a qquarter of the rrespondents staated that they hhad not yet creeated any explainer
videos them mselves, and another
                           a        quarterr of the responndents stated thhat they had crreated 6 or moore explainer viideos
themselvess. As Table 2 shows, there aare dependenciies between thee number of exxplainer videoos produced an        nd the
customer ssegment. Resppondents from    m the corporation segment inndicate a loweer number of ccreated videos than
respondennts from the edducation segm   ment (Chi-squaare test; p < 0.001, Cramér’s V of 0.32 inndicates a medium
effect size)).

                                                            91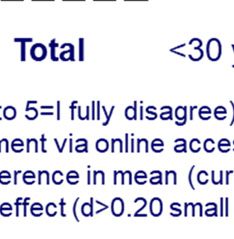
jel.ccsenet.org                                   Journal of Education and Learning                                Vol. 10, No. 4; 2021

 Table 2. Experiences with the creation of explainer videos
                # Explainer videos created*       Segment Education          Segment Corporations         Total**
                None                              12%                        41%                          27%
                1-5                               60%                        39%                          49%
                6+                                28%                        21%                          24%
 Note. * Question: Have you already created an explainer video yourself? ** Chi-square-test: χ²(2)=49.2, p < 0.001, V = 0.32 (medium effect
 size).

 4.2 Statements Concerning the Consumption of Videos
 In order to check the basic affinity of the study participants for videos, an evaluation of different statements on
 the preference and use of videos was carried out. Partially, these statements were already used in an earlier study
 from 2016 (population-representative study for Germany, online, n = 1,000). This allows comparisons between
 the current study (not population-representative, only customers of the company simpleshow) and available
 secondary data. In addition, two statements on the experience and assessment of slide presentations were
 evaluated (Table 3). Around 90% of respondents agreed with the statement “For presentations or lectures I
 mostly use PowerPoint or other slide presentation programs”. This underlines the strong use of slide
 presentations both, in the education as well as the business segment (Zhang et al., 2020). However, 73% of
 respondents consider slide presentations to be monotonous. Employees in larger companies (> 2,000 employees)
 were particularly critical. This reflects a certain dissatisfaction with the tool as a whole or the lack of interaction
 (Penciner, 2013; Brewster, 2011).
 Although there is a period of about 5 years between the studies, similar results emerge regarding the preference
 for consuming videos or texts. In the current study, the statement “I prefer watching videos to reading texts”
 receives a mean agreement of 2.6, while this was 2.7 in the reference study (1 = I fully agree to 5 = I fully
 disagree). A presumed bias in media preference in favor of video (determined by experience with explainer
 videos) cannot be confirmed. Mean values in both samples are similar (effect size below the threshold of 5%
 deviation). A strong age dependence in video preference is also present in both studies (see Appendix B).
 When comparing the effect sizes (Cohens’ d), in most cases values are below the threshold of 0.2. It can
 therefore be assumed that there are no relevant differences. Only in the case of the statement “I prefer reading
 texts to watching a video”, differences between the studies have a low relevance (d = 0.37).

 Table 3. Statements concerning the consumption of videos (mean values, % top-2 agreement in brackets)
Evaluation of statements (rating scale)*                                        Current study:                         Reference study
                                                                                German-speaking customers (2021)       Germany (2016)**
For presentations or lectures I mostly use PowerPoint                           1.67 (90%)                             Not asked
or other slide presentation programs.
Videos that explain something must be short.                                     1.82 (84%)                                Not asked
Many presentations or result reports in slide form are too monotonous for me.    2.08 (73%)                                Not asked
I can remember videos better than text content.                                  2.290.22 (62%)                            2.5 (52%)
I prefer watching videos to reading texts.                                       2.610.07 (49%)                            2.74 (43%)
I often watch videos on my smartphone, because I can’t read texts as well on it. 2.830.11 (43%)                            3.58 (23%)
If I’m searching for information, I often watch a video.                         2.850.11 (43%)                            2.99 (39%)
I prefer reading texts to watching a video.                                      3.440.37(16%)                             2.99 (29%)
 Note. * Question: To what degree do you agree with the following statements? (Scale from 1 = I fully agree to 5 = I fully disagree).
 % top-2 agreement (). Superscripts indicate the value for Cohen’s d referring to the differences in mean values: no effect: d < 0.2, small
 effect d=0.2-0.49.
 ** Krämer & Böhrs (2016); representative study population for Germany 18+ years, recruitment via online access panel.

 4.3 Customer Segments Concerning Text-Video-Orientation
 Based on the statements presented on media orientation, a cluster analysis was carried out in which three
 different groups could be identified. The group of text-oriented people (22%) gives priority to texts over videos
 when searching for and absorbing information (Table 4). Here, the level of agreement with the statement “If I’m
 searching for information, I often watch a video” is low (69% disagreement), while agreement with the statement
 “I prefer to read texts to watching a video” is high (67% agreement). The group of video-oriented subjects (39%)
 shows a high affinity for using videos at the expense of texts. There is no pronounced affinity for video or text

                                                                    92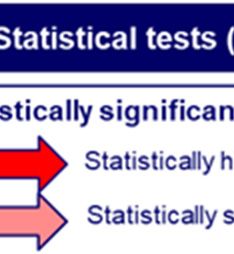
jel.ccsenet.org                                   Journal of Education and Learning                                  Vol. 10, No. 4; 2021

among the third group of individuals (39%, segment “indifferent”).

Table 4. Customer segments according to statement evaluation (media orientation)
                Media-orientation*               Segment Education     Segment Corporations         Total sample**
                Text-oriented                    28%                   17%                          22%
                Text-video indifferent           39%                   39%                          39%
                Video-oriented                   34%                   44%                          39%
Note. * Question: To what degree do you agree with the following statements? (Scale from 1 = I fully agree to 5 = I fully disagree). Cluster
analysis by K-means algorithm.
** Chi-square-test: χ²(2) = 9.8, p = 0.007, V = 0.14 (small effect).

The orientation in favor of video and at the expense of text information is comparatively more pronounced in the
corporate segment (statistically significant, small effect size).
Regardless of a stronger affinity to texts or to videos, the statements on the use of slide presentations do not
strongly differ. For example, more than 96% of respondents assigned to the text-oriented group stated that they
frequently use PowerPoint or other slide presentations for lectures or presentations (86% in the segment of
video-oriented customers). However, differences emerge in the evaluation of PowerPoint presentations. In the
text-oriented segment, only 49% confirm that they regard PPTX presentations as monotonous, whereas this is the
case for more than 80% of the video-oriented users.
4.4 Potential to Substitute or Enhance Slide Presentations by Explainer Videos
In a further step, it was determined how often the respondents create slide presentations and whether they can
imagine either replacing them with explainer videos or enriching them with explainer videos, for example, by
integrating the core results in the form of a video.
On average, respondents create about two slide presentations per month (M = 24.1 p.a., SD 37.0). The number of
slide presentations created varies considerably. On the one hand, 52% of the respondents mention values of up to
ten p.a. (i.e., less than one slide presentation per month), while about 18% put the total number at more than 40
slide presentations per year. Overall, there is a significant potential to replace slide presentations with explainer
videos (M = 3.9 p.a.) or to integrate explainer videos (M = 9.2 p.a.). With regard to the education and corporate
customer segments, there are no significant differences in the average number of slide presentations created per
year, but there are differences with regard to the potential for substitution or expansion with explainer videos.
The educational segment shows higher values in both aspects (Table 5).

Table 5. Usage of slide presentation and potential for substitution/enhancement by explainer videos
                Media-orientation*               Segment Education        Segment Corporations         Total sample
                # slide presentations p.a.       ∅ 23.6 (100%)            ∅ 24.6 (100%)                ∅ 24.1 (100%)
                … # potentially substituted      ∅ 4.6 (20%)              ∅ 3.3 (13%)                  ∅ 3.9 (13%)
                … # potentially enhanced         ∅ 11.1 (47%)             ∅ 7.5 (31%)                  ∅ 9.2 (38%)
Note. * Question: If you think about the last 12 months, how often did you create presentations with PowerPoint (or other slide presentation
programs)? You had indicated that you have created ___ (show: ….) PowerPoint presentations in the last 12 months? For how many
presentations, could you imagine working with or integrating an explainer video instead of slides created with PowerPoint or other slide
presentation programs?

4.5 Experimental Design: Relevance of Remote Work During the COVID-19 Crisis
The research results presented in the experiment are results of a representative survey in 4 European countries
(Krämer & Hercher, 2021). Specifically analyzed was the extent to which respondents had worked in home
office in Nov. 2020, their current experience with working and how relevant home office is seen to be in the near
future. The study results thus relate to a highly topical and very strongly discussed issue during the COVID-19
pandemic. In order to examine the extent to which the study participants are affected by a change in the
organization of work, several statements were presented to describe the current work status. Since the question
design used was identical to the study on the topic of home office, results can be directly compared (Table 6).
When comparing the structure of the responses, it becomes clear that the simpleshow customer sample deviates
significantly from the structures of a representative sample of the German population. While more than 80% of
respondents in the simpleshow sample stated that they work from home more often or completely, only 22% of

                                                                    93
jel.ccsenet.oorg                                  Journal of Edducation and Leearning                                  Vol. 10, No. 4; 2021

respondennts in the refereence study did so (p < 0.001)).
Due to thee specific characteristics of tthe simpleshow  w customers, nnamely on the one hand empployees in the field
of educatiion (school, universities)
                          u               aand on the other hand larrger companiees (often withh a strong service
orientationn), these deviattions are explaainable and plaausible.

Table 6. Sttatements conccerning the currrent status of work
       Evaluuation of statementts*                                      Simpleshoww sample (2021) Reference Germ     many (2020)**
       I still go about my workk                                        41%                            64%
       I go aabout my work, albbeit on short time                       3%                             13%
       I workk more often/comppletely from homee                        81%                            22%
       My w workplace is closedd                                        6%                             5%
       I havee regular contact with
                               w my colleaguees/employees               56%                            9%
       I am ooff work/on vacatiion because of thee Corona crisis        0%                             3%
       Becauuse of the Corona crisis I became unnemployed               0%                             1%
       None of the above stateements apply                              1%                             1%
Note. * Question: Which stattements are true ffor you personallly in   the current ttime of the Coroona crisis? (Multipple answers excep
                                                                                                                                       pt last
position)
** Krämer annd Hercher, 2021..

4.6 Knowlledge Test on Remote
                       R      Work D
                                   During the CO
                                               OVID-19 Crisiss
The resultts for the knowwledge test shhow a considerrable scatter. W
                                                                    While on the one hand aboout 19% of thee test
subjects acchieved the maximum
                         m        resullt of 7 points (25% with 6 or 7 points), 9% of the paarticipants achiieved
                         mber of wrong answers exceeeded the numbber of correct aanswers).
negative reesults (the num
Figure 2 illustrates furthher insights innto the results of the knowleedge test. Herre, the mean ppoint scores fo  or the
knowledgee test are show  wn in the midddle. Additionaally, tests for sstatistical signnificance of thee mean differe
                                                                                                                    ences
and the efffect sizes (Cohhen’s d) as a m
                                        measure of the rrelevance of thhe differences are shown.

                   Figure 2.
                          2 Results from
                                       m experimentall design: know
                                                                  wledge transfer (objective vieew)

Furthermoore, the effectss of the factorss presentation type and interraction (“additiional questionns”) were exam mined
using a tw
         wo-factor analyysis of variancee. Levene’s teest is used to innspect the nulll hypothesis thhat the varianc
                                                                                                                   ces of
the groupss do not differ. In our case, thhe Levene testt is not significcant (p = 0.38)), so that homoogeneous varia
                                                                                                                    ances
can be assumed. The ressults indicate tthat the knowleedge transfer iin the group (##3) with explaiiner video (without

                                                                   94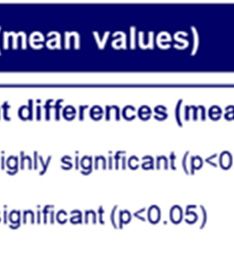
jel.ccsenet.org                                   Journal of Education and Learning                                 Vol. 10, No. 4; 2021

interaction) is best (M = 4.99), the test group (#4) with explainer video and with interaction comes to a slightly
lower level (M = 4.71; differences not statistically significant, no relevant effect size). The smallest effect of
knowledge transfer occurs in the test group (#1) with the presentation via PPTX (without interaction). Here, only
a mean value of 2.19 points is reached. In contrast, the group with presentation via PPTX and additional
interaction achieves a better value (M = 2.79). This difference is statistically significant (p < 0.05) and shows a
small effect size (d = 0.25). At the same time differences between the test groups with presentation via PPTX or
explainer video are statistically highly significant and show larger, partly extremely large, effect sizes (d > 1.0).
The analysis of variance confirms that the factor presentation format has a significantly stronger effect on the
knowledge transfer than the interaction factor. As can be seen in Figure 2, there is a main effect by the
presentation format on the knowledge effect (F(1,470) = 121.19, p < 0.001, ηp2 = 0.21). No main effect is
evident for the interaction factor (F(1,470) = 0.581, p = 0.446, ηp2 = 0.001). Thus, the knowledge effect appears
to be independent of the interaction. The interaction term is statistically significant, but the effect size is rather
low.
4.7 Length of Viewing Time and Resulting Input/Output-Ratios
When interpreting the knowledge transfer, it seems necessary to check whether the different test groups spent the
same amount of time to have the study results explained to them. Finally, it is to be expected that a more
intensive examination of the topic leads to improved effects in knowledge transfer (Krämer & Böhrs, 2016).
Basically, both with the presentation of slides and the video, the participants had the possibility to determine for
themselves how long the presentation should take. The explainer video (EV) was played for a fixed time. In
addition, there was also the possibility to spool the video and to repeat or shorten the video. During the slide
presentation, the test persons had to actively request the insertion of the next page. In the interview, the total time
for viewing the entire presentation was measured. With regard to viewing time, the following results can be
noted (Table 7):
     •    The interaction, i.e., the processing of additional questions on the topic leads to a significant extension
          of the viewing time (including answering additional questions as part of the interaction). For the PPTX
          presentation the viewing time is increased from 84 seconds (without interaction) to 161 seconds (with
          interaction) (+92%; for the explainer video the increase is from 115 to 226 seconds=+97%).
     •    Shortest average viewing time was measured for the PPTX presentation without interaction (“no
          additional questions”; 84 sec.).
     •    The total duration of the explainer video without interaction was 110 seconds. The mean effective
          viewing time was on a similar level, i.e., participants with video generally accepted the pacing of the
          video and watched the video in its entirety.
     •    Group #3 does not only achieve the absolute best result in knowledge transfer, but also the relatively
          best result of the four test groups when the knowledge effect is evaluated in relation to the viewing
          time.

Table 7. Knowledge improvement related to time spent to watch the video
 Mean parameters                           #1 PPTX format / no            #2 PPTX format /       #3 EV format / no #4 EV format /
                                           interaction                    interaction            interaction          interaction
  Knowledge post-level (mean points)       ∅ 2.19                         ∅ 2.79                 ∅ 4.99               ∅ 4.72
  Viewing time (sec.)                      ∅ 84                           ∅ 161                  ∅ 115                ∅ 226
  Efficiency index*                        100                            65                     165                  78
Note. * Index=100 for PPTX presentation without interaction (improved knowledge level in relation to time spend to watch the video (sec.)).
Interaction=additional questions.

4.8 Customer Evaluation: Subjective Perspective of the Participants
In addition to the objective recording of the effects on knowledge transfer (knowledge test), the respondents
were also asked to directly give a subjective assessment on the presentation they regarded. Ten different
statements were used for this purpose (rating scale from 1 = I fully agree to 5 = I fully disagree). Also here,
considerable differences in level between PPTX and the EV are apparent, with a significantly more positive
rating in each case for the EV (Table 8). In the Table, in addition to the mean values of the rating scale scores,
the normalized percentage deviations compared to test group 3 are given in parentheses. Main results are:
     •    30−35% of test group members with PPTX (#1/2) agreed with the statement “I understood the content

                                                                    95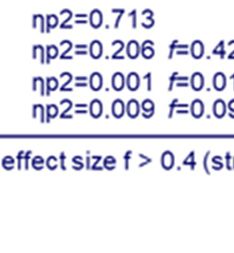
jel.ccsenet.oorg Journal of Edducation and Leearning Vol. 10, No. 4; 2021
w −89%
well” (35−49% disagreed, M = 3.0−3.3), att the same timee groups with explainer videeo reached 88−
(33−4% disagreeed, M = 1.7−1.8).
• From the subjeects’ point of view, the presentation of thhe results via explainer viddeo is judged to t be
ovverwhelminglyy entertainingg (M = 2.0−22.1), while this is not truee in case of slide presenta ations
(jjudgement in test group #1 ddiffers more thaan 50% from ttest group #3, iindicating a larrge effect size).
• T
The statement “Took
“ me a loong time to grrasp the contennt” is agreed w
with more stroongly in the grroups
w
with PPTX presentation (61−−69% M = 2.11−2.3), and onnly to a lesser extent in subjeects with explainer
viideo (7-15%, M=4.0).
M
Table 8. Sttatements conccerning the preesentation of sstudy results onn relevance off home office (m
mean values)
Evaluation off statements basedd on #1 PPTX format / #2 PPPTX format / #3 EV formatt / #4 EV form mat /
a 5-point ratinng scale* no interacction inteeraction no interactionn interaction
I understood tthe content well 3.27 (37%%)** 3.022 (31%) 1.80 1.71 (-2%)
The presentattion was well donee 3.27 (36%%) 3.033 (30%) 1.84 1.76 (-2%)
The content w was well structuredd 3.30 (37%%) 3.033 (30%) 1.84 1.91 (2%)
I liked the styyle and the way it was
w done 3.79 (48%%) 3.433 (39%) 1.89 2.01 (3%)
The presentattion was entertainiing 4.24 (53%%) 3.711 (40%) 2.12 1.98 (-4%)
I can remembber the content well 3.85 (38%%) 3.500 (29%) 2.34 2.16 (-4%)
The presentattion appeals to mee emotionally 4.19 (41%%) 3.866 (33%) 2.56 2.52 (-1%)
The presentattion increased my interest in the toppic 3.88 (24%%) 3.644 (18%) 2.91 2.80 (-3%)
It motivated m me to engage moree with the topic 3.87 (19%%) 3.777 (17%) 3.11 2.97 (-3%)
Took me a lonng time to grasp thhe content 2.06 (-49%%) 2.288 (-44%) 4.02 3.95 (-2%)
Note. * Quesstion: What do youu think of the presentation of the stuudy results that youu just saw? Pleasese use a scale from
m 1 = I fully agree to 5 =
I fully disagrree.
** In parenthheses normalized percentage
p deviatiions: absolute diffe
ference (group – grroup 3) in relationon to scale width (4); (Note 3). Interraction
= additional qquestions.
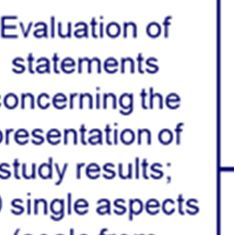
The main findings show w structurally similar resultts to the prevviously measurred knowledgge effect (obje ective
view). Parrticipants in thhe explainer viideo test groupps (#3/4) confi firmed a compaaratively betteer absorption of
o the
informatioon (“I understoood the contennt well”), a beetter ability too reproduce thhe core resultss presented (“II can
remember the content well”)
w and a stroonger activatioon (“It motivatted me to engaage more with the topic”). Figure
3 illustratees the statistically significannt and relevant results in terrms of effect ssize. A meaninngful effect duue to
interactionn - albeit smalll (d>0.2) - can be identified iin the test grouups with PPTX
X (#1-2).
Figure 3. Results
R from experimental deesign: evaluatiion of statemennts/subjective view
96jel.ccsenet.org Journal of Education and Learning Vol. 10, No. 4; 2021
5. Discussion
In the following, some interrelations will be examined in more detail. This concerns different aspects: (a) the
dependencies between presentation form, viewing time (pacing) and learning success, (b) the link between
objective learning success and the subjective evaluation and (c) the aspect of the verbalization or the missing
speaker in the PowerPoint presentation.
The experimental design leads to relatively clear results with regard to the target variable of knowledge transfer
for the test groups with explainer video. To the authors’ knowledge, this is the first study to investigate and
quantify the learning effects of slide presentations and explainer videos in a direct comparison (in a
non-educational environment). The results remain unambiguous when considering the better results on
knowledge transfer in relation to time spent. Krämer and Böhrs (2016) introduced this approach in order to
measure efficiency of knowledge transfer. However, the question arises how the comparatively short viewing
time in the test group PPTX presentation without interaction can be explained. One explanation is that in the case
of the explainer video, the test subjects accept the timing of the video shown (they likely perceive it as a system
pacing, although they had the opportunity for an individualized pacing), whereas in the case of the slide
presentation, the timing/pacing is perceived flexible (learner pacing). Obviously, during the experiment some
subjects cut short the viewing time in this case. The state of academic research to date would lead one to expect
that learning speed meant mainly an extension of the viewing time, i.e., subjects make use of the possibility to
select relevant information and to organize and integrate it into a mental model (Mayer & Chandler, 2001). In
contrast, the viewing time in our study is shortened when results from research are presented via slides. However,
similar effects have already been pointed out by Stiller et al. (2009). When defining the experimental design, the
project team explicitly excluded the possibility of providing each participant with a fixed time budget, since
learning with instructional animations was expected to overstretch limited working memory (see Hatsidimitris &
Kalyuga, 2013). Since the time required to process the information shown during the test can vary from person
to person, self-determined timing was allowed. Obviously, presentation format and pacing are interlinked (see
Koć-Januchta et al., 2020). However, if test persons are classified in groups with comparable viewing time, the
superiority of the explainer video over the slide presentation persists (see Appendix C).
The results of the experiment with regard to the effect of presentation format and interaction are similar,
regardless of whether the objective results of the knowledge test are considered or the self-assessment of the test
subjects. This is remarkable insofar that other studies have come to the conclusion subjects would overestimate
the effective learning success, especially in the context of explainer video. Kulgemeyer and Wittwer (2021)
investigated this relationship with students majoring in physics and concluded: “While the experimental group
watched a video introducing the concept of force relying on misconceptions, the control group watched the
scientifically correct video. Both videos were comparable in terms of comprehensibility and duration. In the
posttest, the experimental group believed that the video was scientifically correct, well-explained, and that they
do not require further instruction to understand the concept.” They refer to other empirical findings suggesting
that humans have difficulties distinguishing between their feelings of efficacy and their actual level of
understanding, an effect Wiley (2019) called “seduction effect” of pictures.
Behind the factor “presentation form explainer video” there were partial factors, which were different compared
to the presentation form slide presentation. In addition to the timing and the animation, the absence of a speaker
should also be mentioned (the slide presentation lacks acoustic support). Particularly the interaction of spoken
text and moving images is seen as a determinant for an improved learning effect. As Stiller et al. (2009) state:
“the modality principle of multimedia design recommends using spoken rather than written texts in conjunction
with dynamic or static pictures, because learners learn more effectively in computer based and book-based
environments when spoken texts are used.” The cognitive theory of multimedia learning (CTML; Mayer, 2001)
helps to explain this mechanism, assuming that pictorial and verbal information is processed in two separate
systems. Both are functionally independent of each other, although they can interact. Written words are initially
processed in the visual/pictorial channel before they move to the auditory/verbal channel in the working memory.
When spoken words are presented simultaneously with text during a presentation, there is a third and detrimental
effect at work, called the redundancy principle (Sweller, 2005).
In order to classify the results, it should be noted that the comparatively poor results of the slide presentation
with regard to knowledge transfer—as well as the subjective assessment by the recipients—can possibly be
improved if a time frame is given for the viewing (e.g., if the slides are presented as a video) or if the results are
explained verbally (i.e., by integrating a speaker in an animated slide presentation or by personally presenting
results in a live presentation).
97jel.ccsenet.org Journal of Education and Learning Vol. 10, No. 4; 2021
6. Implications
The most important findings for the future use of explainer videos are: (a) use of explainer videos to convey core
messages, (b) use of options to substitute or enhance PowerPoint presentations by explainer videos and (c)
examine need for interactive elements.
6.1 Use of Explainer Videos to Convey Core Messages
When Laaser and Toloza (2017) claim “the cartoon type of explainer videos is limited to easily understandable
short topics and is more entertainment than a serious academic presentation”, then this does not necessarily apply
to all explainer videos. In fact, it should be noted that depending on the supplier of explainer videos, a more or
less professional creation of didactically efficient explainer videos is made possible. The range of offerings is
very fragmented (Böhrs & Krämer, 2020). The format of the explainer video is less responsible for the learning
success, but rather the quality of the explanation. For example, Kulgemeyer (2018) compared high explaining
quality (HE) video and one low explaining quality (LE), concluding that “the HE group outperformed the LE
group in the achievement of declarative knowledge.”
Therefore, general statements are problematic or inaccurate in specific cases. As was shown, the explainer video
in the experiment demonstrates a high level of effectiveness and efficiency in the transfer of knowledge.
However, the application spectrum is limited to short presentations, as Sedej (2019) highlights: “With explainer
videos companies can explain a business idea, product, or project in a one-to-three-minute-long video with
informational, educational, and even entertaining value at the same time.”
Against this background, it is recommended that explainer videos should be used, for example, where study
results are summarized in a highly condensed form (Kulgemeyer, 2018). These experimental results correspond
with the findings of other investigations, if for example Rusli et al. (2014) conclude that “learning with
multimedia using animation visualization presentation is better than the static visualization presentation”.
6.2 Use Options to Substitute or Enhance PowerPoint Presentations by Explainer Videos
Whether PowerPoint can maintain its dominant position as a medium in the classroom and in companies depends
on how the presentation format can be adapted to the changing needs of the target audience. The meta-analysis
by Baker et al. (2018), which focused on the use of PowerPoint in education, was conducted to summarize the
effectiveness of PowerPoint compared to traditional instruction on cognitive skills, concludes “that PowerPoint
had no effect on learning.” In Brewster’s (2011) opinion, PowerPoint shows poor performance, especially in
summarizing important content, therefore dashboards are recommended instead of slides. Other authors propose
using Augmented Reality (AR)-assisted tools instead of PowerPoint presentations (experimental research by
Zhang et al. (2020) showed that the AR-assisted lecture was significantly more effective than the PPTX-based
lecture). Based on their research results, explainer videos can also replace PowerPoint presentations in this
framework. However, it is also conceivable to dovetail explainer videos more closely with slide presentations,
for example in the case of longer presentations.
Videos could be used especially in areas where either the knowledge base is at a very low level, or the
involvement of consumers is rather low. Based on these results, it is expected that the knowledge improvements
in other areas could be even more substantial than in the test (the majority of respondents were very interested in
the topic). Furthermore, in case the interest is low potential users of explainer video only have a limited
willingness to spend a longer time to watch the video (Krämer & Böhrs, 2016). This emphasizes the crucial role
of a short video time.
6.3 Examine Need for Interactive Elements
Integrating interactive elements can not only lead to an improved knowledge transfer, but also to better
perception by the target audience, to an increased interest in the presented topic as well as to promote
engagement (Evans & Gibbons, 2007; Zhang et al., 2006). However, based on our findings, this is rather the case
for the PowerPoint presentation. This corresponds with the results of Jordan ad Papp (2014), pointing out that
PowerPoint can easily be used in an interactive manner. They recommend to “pose discussion questions or
introduce short quizzes or group application exercises into presentations to allow time for interaction, discussion
and reflection.”
In our experimental design, slightly positive effects were obtained by superimposing additional questions on the
topic (factor interaction). It is to be expected that the effects are significantly more positive for longer
presentations (e.g., 45 min). No positive effects resulted from the interaction in the presentation form explainer
video. This can possibly be due to the fact that the presentation of results in the video was already highly
compressed and well-structured; the presentation of the study results was very short and the presentation was
98jel.ccsenet.org Journal of Education and Learning Vol. 10, No. 4; 2021
optimized by storylining. Hence, no incremental positive effects can be achieved by forcing the test subjects to
deal more intensively with the topic. In longer presentations, interaction may have a positive effect (Geri, 2017).
However, in our analysis we only focused on a very short and very condensed result presentation. Therefore, it is
recommended to make the use of interactive elements dependent on the presentation form and especially length,
taking into account that the efficiency of knowledge transfer was lowest in the explainer video test group with
interaction (#4).
7. Conclusion
Numerous researchers have recently proposed principles for the design of effective presentations for improving
the knowledge transfer of slide presentations, both in the education as well as in the business environment. Our
study contributes to a better understanding of the effectiveness and efficiency of knowledge transfer depending
on the type of presentation. Overall, the study shows that a classic presentation of research results based on
PowerPoint slides (without a speaker, the viewing time is determined by the target persons themselves) is
inferior to a presentation via explainer video. This correlates not only with a potential for substituting short slide
presentations with explainer videos, but also with the integration of explainer videos into slide presentations.
Some special limitations of this experiment must be acknowledged. (1) The content covered is relatively limited,
scientific, and factual, (2) time to present results from research was short, and (3) performance measures were
not of the problem-solving type and only concerned declarative knowledge. In addition, it should be noted that
the study does not claim to be able to provide results representative of the population, but representative results
for simpleshow’s customers. However, a comparison of the media preferences of our own sample with
representative studies shows structural similarities. Nevertheless, there is a need for research to repeat the study
based on a representative sample of the population and to investigate the effects of verbal support in PowerPoint
presentations.
Acknowledgments
The authors are grateful to Rogator AG, Nuremberg, for the provision of survey software, the programming of
the questionnaire and the entire data management as well as Dr. Gerd Wilger, Dr. Robert Bongaerts (exeo
Strategic Consulting) and Lisa Burschik (simpleshow) for substantive comments and input to the study and
David Weber from simpleshow for creating the video material.
References
Baker, J. P., Goodboy, A. K., Bowman, N. D., & Wright, A. A. (2018). Does teaching with PowerPoint increase
students’ learning? A meta-analysis. Computers & Education, 126, 376−387.
https://doi.org/10.1016/j.compedu.2018.08.003
Böhrs, S., & Krämer, A. (2020). Explainer-Videos: Zwischen Agenturleistung und DIY-Tool. Marketing Review
St. Gallen, 37(2), 70−78.
Brewster, K. (2011). Dashboards–the new PowerPoint? Shifting the Boundaries of Research, 246−258.
Chou, P. N., Chang, C. C., & Lu, P. F. (2015). Prezi versus PowerPoint: The effects of varied digital presentation
tools on students’ learning performance. Computers & Education, 91, 73−82.
https://doi.org/10.1016/j.compedu.2015.10.020
Ciriello, R. F., Richter, A., & Schwabe, G. (2015). PowerPoint use and misuse in digital innovation.
Twenty-Third European Conference on Information Systems (ECIS), Münster.
Clark, J. (2008). PowerPoint and pedagogy: Maintaining student interest in university lectures. College Teaching,
56(1), 39−44. https://doi.org/10.3200/CTCH.56.1.39-46
Derouin, R. E., Fritzsche, B. A., & Salas, E. (2005). E-learning in organizations. Journal of Management, 31(6),
920−940. https://doi.org/10.1177/0149206305279815
Gabriel, Y. (2008). Against the tyranny of PowerPoint: Technology-in-use and technology abuse. Organization
Studies, 29(2), 255−276. https://doi.org/10.1177/0170840607079536
Gabrielle, B. R. (2010). Speaking PowerPoint: The new language of business. Insights Publishing.
Gamble, S. (2016). Visual Content Marketing: Leveraging Infographics, Video, and Interactive Media to Attract
and Engage Customers. John Wiley & Sons.
Garrison, D. R., & Shale, D. (1990). A new framework and perspective. In D. R. Garrison & D. Shale (Eds.),
Education at a distance: From issues to practice (pp. 123−133). Malabar, Florida: Robert E. Krieger
Publishing Company.
99You can also read