The Economic Penalty of Dengue
←
→
Page content transcription
If your browser does not render page correctly, please read the page content below
The Economic Penalty of Dengue

                                   By: Yamini Misra

                          Dr. Randall Kramer, Faculty Advisor

__________________________________________________________________________

  Honors Thesis submitted in partial fulfillment of the requirements for Graduation with

             Distinction in Economics in Trinity College of Duke University.

                                    Duke University

                                Durham, North Carolina

                                          2011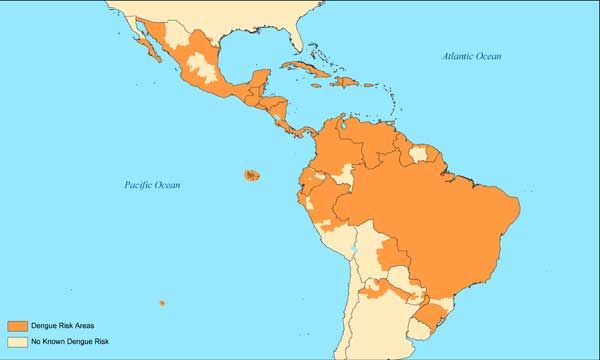
Table of Contents

ACKNOWLEDGEMENTS                                                       3

ABSTRACT                                                               4

INTRODUCTION                                                           5

LITERATURE REVIEW                                                      8

THE DENGUE VIRUS                                                       8
EVOLUTION OF DENGUE VIRUS                                             10
SYMPTOMS OF DENGUE                                                    11
DENGUE EPIDEMIOLOGY                                                   12
DENGUE INTERVENTIONS                                                  13
CHANGING NATURE OF DENGUE SEROEPIDEMIOLOGY                            16
MEASURING THE DENGUE BURDEN WITH A MODEL BY GALLUP AND SACHS (2001)   18

DATA AND METHODS                                                      19

RESULTS                                                               22

CROSS SECTIONAL ANALYSIS: MALARIA INCIDENCE                           22
CROSS SECTIONAL ANALYSIS: DENGUE INCIDENCE                            25
PANEL DATA REGRESSION ANALYSIS FOR DENGUE                             26
POSSIBLE REASONS FOR CONFLICTING RESULTS: MULTICOLLINEARITY           28
POSSIBLE REASONS FOR CONFLICTING RESULTS: FIXED EFFECTS               30

DISCUSSION                                                            34

CONCLUSION                                                            35

REFERENCES                                                            38

APPENDIX                                                              45

APPENDIX A: TABLE 1 FROM GALLUP AND SACHS, 2001                       45
APPENDIX B: VARIABLES AND CODES                                       46
APPENDIX C: CORRELATIONS                                              46

                                                                       2
Acknowledgements
I would like to thank Dr. Randall Kramer for his support, guidance and invaluable advice.
Special thanks to GIS librarians Joel Herndon and Mark Thomas, for their helpful
suggestions on data sources and teaching me how to use the ArcGIS maps. I am very grateful
to Arnav Mehta for his constructive criticisms, excellent editing and inspiration. I must also
thank all my other friends, especially members of Round Table, who have had to bear with
me through my times of frustration, for their constant support and encouragement. And last
but not least, this thesis would not be possible without the people who believe in me the most,
my parents and my sister. Thank you.
3Abstract
The WHO estimates that 40% of the world’s population is at risk of getting dengue. Despite
its high economic costs, dengue is often neglected in the face of more severe diseases. This
paper aims to understand the effect of dengue on economic growth. Data on geographic
variables, dengue incidence, and trade openness were obtained for 187 countries for the years
1990 to 2009. Results were largely inconclusive due to gaps in the dataset and the possibility
of GDP growth far outpacing improvements in dengue surveillance. However, dengue has
been proven to be extremely resilient and more research is crucial to mitigating the
potentially large economic burden of dengue.
JEL Codes: I10, I15, I18, Q59
Keywords: dengue, economic burden, economic costs
4Introduction
Dengue is a mosquito borne disease that has recently become a public health concern.
It is found in tropical and sub-tropical regions around the world, particularly in urban and
semi-urban areas. Dengue incidence has escalated throughout the world in recent times. The
World Health Organization (WHO) estimates that there are currently 50 million dengue
infections worldwide every year, and almost two fifths of the worlds’ population is now at
risk of getting dengue (WHO, 2002). The first well-documented outbreak of Dengue
Hemorrhagic Fever (DHF) was in Manila in 1953, which was followed by a larger outbreak
in Bangkok in 1958 (Halstead, 1980). It also now represents a significant health problem in
the Americas with a large epidemic in Cuba in 1981 (Guzman et al., 1984). This disease has
expanded considerably and is now endemic in many countries around the world, mostly in
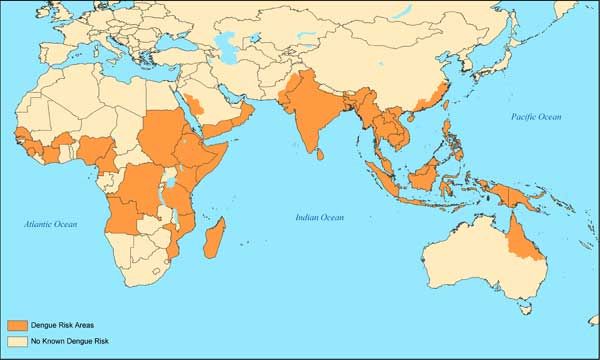
the Americas and South-east Asia (see Map 1, 2) (WHO, 2002). The dengue epidemic has
also increased dramatically in Africa since 1980, especially in the eastern regions (see Map
2). However poor surveillance and documentation in Africa makes it difficult to gauge the
actual numbers.
Map 1: Distribution of Dengue, Eastern Hemisphere (Tomashek, 2010)
5Map 2: Distribution of Dengue, Western Hemisphere (Tomashek, 2010)
Governments around the world are worried due to the high economic burden of
dengue, which has the potential to escalate to Dengue Haemorrhagic Fever (DHF) and finally
Dengue Shock Syndrome (DSS). DHF is a lethal complication of dengue with similar
symptoms albeit more pronounced. It requires extensive hospitalization and poses a fatality
rate of as high as 5 % (WHO, 2002). DSS is an even more severe fatal complication that
follows DHF, which usually results in the collapse of the circulatory system and multiple
organ failure (Ranjit, Kissoon & Jayakumar, 2005). Dengue has the potential to put large
numbers of a country’s most productive population out of work for weeks, making it an
extremely costly disease. As a result, governments worldwide are engaging in active vector
control policies as a preventive measure to reduce the burden of dengue.
In the 2005 outbreak, Singapore boosted its vector control budget by $30 million to
fund measures that included the distribution of informational pamphlets (Oh, 2005). Every
year, the government injects millions to fund research into dengue prevention and control
(Chen, 2008). Six new research bodies have been added to the original five bodies which
6made up the Singapore Dengue Consortium when it was set up in 2003 and at any point,
there are 60 to 80 scientists working on dengue research, double the number four years ago
(Tan & Keshava, 2007). Malaysia too boasts a vector control program with a budget of
almost $30 million in 2008 (ACTMalaria, 2010).
The total economic cost of dengue however far exceeds the simple costs of vector
control. Direct patient, hospitalisation, mortality and morbidity costs, along with opportunity
costs of time and productivity losses due to illness also need to be considered. Extensive
research has been done to analyse the economic burden of dengue. In the Americas, the
annual economic burden of dengue is estimated to be around US $2.1 billion (Shepard et al.,
2011), whilst that of Thailand, is estimated to be between US $31.5 and $51.5 million
(Sornmani & Okanurak, 1995). An analysis of the 2005 Panama dengue epidemic estimated
total economic costs to amount to US $16.9 million (Armien et al., 2008), whilst the 1981
Cuban epidemic cost around US $103 million (Kouri, Guzman, Bravo & Triana, 1989). The
total economic cost of dengue faced by endemic countries is sizeable and compares to the
disease burden of other major infectious diseases such as malaria (Luz, Grinsztejn &
Galvani, 2009).
It is therefore important to understand and quantify the exact effect of dengue on
economic growth, to push for greater prioritization of the disease on government agendas. A
study done by John Gallup and Jeffrey Sachs (2001) on the economic burden of malaria is
used as a model for replication with the dengue case. They found that malaria had a strong
negative correlation with economic growth. In the following analysis, dengue incidence and
7other independent predictors for economic growth are regressed against gross domestic
product (GDP) per capita.
Literature Review
The Dengue Virus
Humans are the major hosts of the dengue virus apart from other non-human primates
and Aedes aegypti mosquitos represent the principal vector. Although other species of the
Aedes mosquito such as Aedes albopictus and Aedes polynesiensis can act as dengue vectors
and have been found in many parts of the world where dengue is endemic, they carry the
disease less efficiently than A. aegypti (Gubler, 1987). A. aegypti is closely associated with
human habitation and its larvae are often found in artificial water containers such as
discarded tyres, buckets and water storage facilities.
Dengue virus is a single stranded positive-sense RNA virus of the genus Flavivirus.
The Flaviviridae family also includes the Japanese Encephalitis virus, West Nile virus and
Yellow Fever virus (Holmes & Twiddy, 2003). Dengue exists in 4 distinct serotypes –
DENV 1-4, within which there is considerable genetic variation (Holmes & Burch, 2000)
These distinct lineages have been thought to arise due to geographic or ecological
partitioning within primate species such that each serotype evolved independently (Holmes
& Twiddy, 2003). Little is known about the genetic diversity of the 4 genotypes, and if they
are associated with different clinical outcomes, host infection and virulence factors. Research
on the “E protein”, which is the major antigenic determinant of the dengue virus, has not
8yielded any evidence if some genotypes have more “epidemic potential” than others
(Twiddy, Pybus and Holmes, 2003). Recovery from infection by one dengue serotype
secures life-long immunity against that virus but does not confer immunity against the other
three viruses. In fact it is shown that past infection of a different serotype increases the risk of
developing DHF (WHO, 2002).
What is known, however, is that there have been differences in growth rates among
serotypes. A recent study by Twiddy, Pybus and Holmes confirmed that the dengue virus
population has had exponential growth the past 30 to 35 years. However this growth rate is
mostly for DENV-2 and DENV-3. DENV-1 had a single phase of exponential growth whilst
DENV-2 and 3 were still in their low growth stage. There are no good data for DENV-4 due
to insufficient numbers of the serotype in GenBank, the NIH genetic sequence database. This
suggests that endemic countries are likely to see exponential growth in strains of DENV-2
and 3 (Twiddy, Pybus & Holmes, 2003).
It is important to note that these 4 serotypes are not fixed as evidence shows that
recombination can occur among them, changing their virulent properties. Recombination will
allow these viruses to infer a wider range of hosts and adapt to the changing landscape,
whilst removing deleterious alleles that code for harmful genetic traits. However the
relatively low level of recombination observed until now suggests that it is more of a
sporadic occurrence (Holmes & Twiddy, 2003). Nevertheless it is important to determine
how these viruses recombine in order to predict the emergence and potential pathogenic
properties of new dengue viruses (Holmes & Twiddy, 2003).
9Evolution of Dengue Virus
The evolution of dengue seems to have taken place more recently then most other
diseases. Studies conclude that up until a few hundred years ago, dengue was primarily a
sylvatic or jungle transmission disease in which mosquitoes in the forest would transmit the
disease between monkeys, causing asymptomatic infections (Holmes & Twiddy, 2003).
There would only be sporadic outbreaks in humans. These sylvatic transmission cycles
between monkeys have been identified in Asia and West Africa where infection is clinically
mild or short. Sylvatic strains in DENV-2 and DENV-4 have also been found to be similar to
the human dengue strains (Rodhain, 1991). There is hence strong evidence that dengue was
originally a monkey virus that experienced cross-species transmission to humans. This
transmission was most likely due to a rapid increase in urbanization and human
encroachment into the forest habitat. The rapid increase in human population in contact with
these mosquitos provided a large number of susceptible human hosts for the dengue virus to
move from the sylvatic cycle to establish itself as an endemic human disease (Holmes &
Twiddy, 2003).
Meanwhile, the dengue virus itself was probably going through an evolution in terms
of its own genetic make up. RNA viruses are characterized by high genetic variability due to
high mutation rates associated with rapid rates of replication and immense population sizes
(Drake & Holland, 1999). This results in distinct sequences, or genotypes, which are visible
throughout all 4 serotypes (Holmes & Twiddy, 2003). Differences in genotypes give rise to
differences in host susceptibility where some individuals may have a genetically determined
predisposition or resistance to DHF and DSS. This may be mediated by a difference in a
10human leucocyte (white blood cell) antigen (HLA) haplotype, which may vary according to
age, sex or pre-existing chronic disease, though there are few studies in this area (Halstead,
2001).
Another result of this evolution is that an antibody from a previous dengue infection
induces a complex immunologic reaction during a secondary infection with a different
serotype known as antibody dependent enhancement (ADE). This results in higher levels of
DHF or DSS in secondary as compared to primary infections (Halstead, 1988). Lastly,
genetic evolution may have also resulted in strain variability in terms of their capacity to
cause DHF or DSS. For example the “American” genotype of DENV -2 is not associated
with DHF and is of low virulence as compared to “Asian” strains (Rico-Hesse et al., 1997;
Leitmeyer et al., 1999). This virulence ability is determined by a difference in amino acid E-
390, which determines its ability to replicate in monocyte derived macrophages (Pryor et al.,
2001; Proutski, Gritsun, Gould & Holmes, 1999).
Symptoms of Dengue
Dengue fever is characteristically a severe, flu-like illness that seldom causes death.
The clinical features vary with age of the patient and will include symptoms such as a fever
and rash. Older adults may also experience severe headache and muscle and joint pains
(WHO, 2002). Dengue fever then has the potential of escalating to DHF and DSS, which are
potentially deadly complications (Holmes & Twiddy, 2003). These are characterized by high
fevers, enlargement of the liver and in worse case situations, circulatory failure. Certain
neurological symptoms have also been observed with DHF (Solomon et al., 2000).
11Dengue Epidemiology
There are two main factors that contribute to the distribution of dengue incidence
around the world. The first is characterized by demographic changes and migration patterns
(Keating, 2001). As the world’s population increases, and globalization allows for the
increasing mobility of people, the incidence of dengue is predicted to increase considerably
(Ooi & Gubler, 2009). Rapid, unplanned rural-urban migration and an explosion of people
moving towards cities will result in an overcrowding that best allows rapid disease
transmission. To accommodate these people, more and more forests will have to be cleared
resulting a further encroachment into mosquito habitats that allow for animal to human
transmissions. Increased travelling will also allow for the greater mobility of strains resulting
in higher incidences of cross infections (Ooi & Gubler, 2009). Meanwhile increased human
activities such as the use of domestic water storage tanks and the increasing throw-away
culture will result in the creation of more potential breeding grounds for mosquitos (Gubler,
2004). Improper disposable of car tires, air-conditioning units, and other receptacles catch
rainwater providing mosquitoes with convenient stagnant water bodies to lay their eggs in.
Dengue incidence is also reported in frequent and cyclical epidemics. Temperature
and precipitation fluctuations affect infection rates by influencing vector reproduction rates,
biting rates or by shifting a vector’s geographic range of distribution. Temperature changes
may also alter the incubation period of a pathogen and vector-pathogen-host interactions,
thereby affecting host susceptibility (Keating, 2001) Global warming is hence thought to be
an important factor in the transmission cycle. Research suggests that higher global
temperatures will increase transmission rates of mosquito borne diseases and extend their
12geographical ranges as more areas experience higher temperatures (Reiter, 2001). Rising
temperatures may also increase the endemic potential of the disease where a smaller number
of mosquitoes can maintain a state of disease endemicity (Patz, Martens, Focks & Jetten,
1998).
Dengue Interventions
Dengue incidence has been increasing around the world, even in countries that have
seen much success with dengue intervention policies. In Singapore, a combination of lowered
herd immunity (low levels of immunity within the population), a move towards greater virus
transmission outside the home, increase in age of infection and an adoption of case-reactive
approach to vector control, have contributed to this increase in dengue incidence (Ooi, Goh
& Gubler, 2006). To combat this increase, dengue control policies have traditionally
consisted of a three-pronged approach, namely, surveillance and monitoring, adult mosquito
fogging and larval source reduction, and community engagement.
Accurate dengue diagnosis is the first step in any surveillance program. Dengue
produces a primary response of antibodies characterized by a slow and low titer antibody
response. IgM antibody is the first one to appear. Dengue diagnostic kits are hence designed
to identify the IgM antibody. However dengue viremia is short. It starts two to three days
before the onset of fever and lasts only four to five days after. Current IgM antibody
detection is inefficient and is compounded with problems of improper timing, false positive
reactions and the long persistence of IgM antibodies even after the end of the infection.
Genome detection via PCR is most accurate, however PCR requires specific laboratory
13equipment and facilities as well as extensive virus isolation and evaluation, which is time
consuming (Guzman & Kouri, 2004). Hence the need for early and more effective clinical
diagnosis of individuals is needed.
Effective diagnosis is just one part of a complete surveillance program. Surveillance
systems in the past were very unreliable as they relied on dengue reporting which dropped
especially during inter-epidemic periods, despite the presence of endemic transmission.
Hence epidemics were seldom detected before peak transmission (Gubler, 1989). The need
for an effective surveillance program is key. In Singapore, new initiatives have been put in
place for regular mosquito surveillance in housing estates and crowded places. This includes
the placement of ovitraps in high-risk areas. Ovitraps are devices consisting of a black
cylinder filled with cow grass solution that attracts female mosquitoes to lay eggs. This trap
then prevents mosquitoes that hatch from the eggs from flying out. Ovitraps are therefore
useful for detecting the presence of adult mosquito populations by measuring the number of
eggs laid by female mosquitoes attracted to the trap. These are checked weekly for breeding
and can be used to detect a sudden increase in populations (Tan, 2000). The data is then
monitored by a Geographical Information System (GIS) for the management of these
databases and the identification of potential disease outbreak hotspots. GIS provides a
graphical analysis of epidemiological factors over time and helps authorities identify trends
and areas where they need to target their resources (Tan & Song, 2000).
Ultra-low volume adulticide (ULV) aerosols are then used as a form of vector control
policy. Targeted at adult populations, fogging of adulticides is intended to directly lower the
14mosquito populations. However studies have shown that ULV has little impact on disease
incidence despite frequent application. One reason for this corresponds with the resting
behavior of mosquitos. Aedes aegypti is known for resting indoors, in small cracks and
corners, making it hard for ULV droplets to penetrate effectively and in adequate amounts.
ULV is also only sprayed outdoors as most homeowners are opposed to the idea of fogging
the insides of their homes, limiting its effectiveness in dengue control (Perich et al., 2000). It
has been shown that the number of mosquitoes returns to pretreatment levels very quickly
and ULV has only a minimal impact on incidence. Instead effective ULV could only delay
the course of an epidemic to allow time for other disease interventions (Newton & Reiter,
1992). However, despite the ineffectiveness of ULV overall, it is still used as a disease
intervention as it is a political tool to show government response in times of an epidemic.
Alternatively, source reduction is considered to be more effective in reducing
transmission as it directly decreases the basic reproduction rate of the disease by decreasing
the carrying capacity of the environment of mosquitoes (Newton & Reiter, 1992). Source
reduction involves the use of larvicides in stagnant water bodies to kill mosquito larva and
hence stop reproduction. The most commonly used larvicides are organophosphorus
compounds like temephos, fention and clorpyrifos. Temephos are most commonly used as
they present the least toxicity to non-target organisms (Pitasawat et al., 2007). A study by
Pelizza et al. showed that the use of Temephos was more effective against A. aegypti larvae
and for a much longer time period than Bacillus thuringiensis (Bti), the most commonly used
larvicide in mosquito control (Pelizza et al., 2010). Nevertheless it is difficult to monitor
larvicide use as it depends on an individual household’s commitment to larvicide use. Studies
15have shown that there is an overall hesitance towards using larvicides due to the unpleasant
odour of the formulation, an increase in water turbidity with use or for general safety
considerations (Suaya et al., 2007). Increasing resistance of larva to the larvicides, requiring
the development of new formulas or the increase in dosage required for effective vector
control is also increasingly a problem (Seccacini et al., 2008).
Any vector control policy however needs to be reinforced with an effective
community engagement effort. This includes a strategic public education and community
involvement program to spread awareness about dengue amongst the population. This could
include media advertising, and outreach to community groups, schools and other social
organizations (Singapore Ministry of Health, 2005). Behavioural changes towards dengue are
needed in bringing about effective community commitment to the use of larvicides and
making conscious efforts to clean the environment of stagnant water bodies to prevent
breeding of mosquitos. However, educational programs need to be matched with adequate
forms of evaluation and feedback to ensure effectiveness of the program. This could be done
with community-based surveys to ensure compliance, or even providing households with
their own ovitraps to give them a real indication of the levels of mosquito inhabitation within
their own households (Gubler & Clark, 1994; Heintze, Garrido & Kroeger, 2007).
Changing Nature of Dengue Seroepidemiology
A range of host and societal factors have cause shifts in various patterns of dengue
seroepidemiology, such as modal age, rural spread, and social and biological determinants of
susceptibility (Guha-Sapir & Schimmer, 2005). The co-circulation of multiple serotypes and
16the difference in severity of illness in different people has increased the need for better
research into investigating the indicators of dengue infection.
One of the most important trends in dengue has been the shift in modal age of
infection in countries such as Singapore, which have had successful vector control programs.
In countries such as Thailand, which have yet to experience mosquito population reductions,
average age of dengue infection hovers between 0 to 15 years of age. It is mostly classified as
a childhood disease. In Singapore, however, seropositivity increases with age, with the
highest incidence reported amongst those aged 55 to 74 years (Yew et al., 2009). Dengue
infections in adult are more likely to be clinically overt when compared to infections in
children. Adults are more likely to suffer from dengue related diseases such as diabetes
mellitus and other bacterial infections. Though not life-threatening, dengue fever in adults
can cause considerable incapacitating morbidity and a much delayed recovery period (Low et
al., 2006). This can have negative implications for the economic burden of dengue on a
country.
The shift in modal age of infection however brings with it an overall decrease in
DHF. Though the chances of a secondary infection and hence escalation to DHF is much
higher in adults, simply because they have been exposed to mosquitoes for a much longer
period, DHF rates in Singapore have remained low (Wilder-Smith et al., 2005). This could be
due to the fact that adults present less frequently with DHF than children. Young children are
known to have a larger microvascular surface area per unit volume of skeletal muscle than
adults. This coupled with increased microvasucular permeability due to the developing nature
17of their vessels explains why children more readily develop hypovolaemic shock than adults
in DHF, although the exact pathogenesis of this is currently unknown (Gamble et al., 2000).
Measuring the dengue burden with a model by Gallup and Sachs (2001)
The lack of information on the genetic diversity of dengue and the antibody
enhancement effect coupled with the constantly changing nature of dengue makes it difficult
to anticipate the potential severity of the disease in the future. Improvements in dengue
surveillance have not kept up with the exponential growth of the disease, which is said to
increase even more with predicted higher global temperatures. Dengue vector control needs
to be multipronged to ensure effectiveness and certain interventions, such as source
reduction, are labour intensive, making overall costs much higher. Furthermore, effective
vector control only seems to push the modal infection age higher, causing more expensive
damage, as the most productive share of the population is disproportionately susceptible to
the disease. It is hence important to quantify the effect of dengue on economic growth to
draw attention to the severity of the disease and its potential impact on the economy of
endemic countries. This would therefore also help governments prioritize dengue research in
order to better mitigate these costs.
Gallup and Sachs (2001) moved beyond the traditional methods of measuring the
economic costs of a disease – computing the total value of both indirect and direct cost of a
disease – to quantify the impact of a specific disease, malaria, on economic growth. They
showed that malaria and poverty are strongly connected. Controlling for factors that would
usually affect income levels with independent variables such as tropical location, colonial
18history, and geographical isolation, they showed that countries with intensive malaria had
significantly lower incomes levels (dependant variable) than those without (Gallup & Sachs,
2001) (see results in Appendix A). The period they analysed was 1965 to 1990. Their
approach is hence replicated below for the dengue case to parse the effects of dengue on
income levels.
Data and Methods
Data from 1990 to 2009 were used for this paper. Though this might affect results
significantly in comparison to Gallup and Sachs (2001), adequate data for dengue before
1990 does not exist. Also a comparison of any earlier period may not provide results that are
relevant for modern day public policy.
Data on dengue incidence were collected from the WHO DengueNet database (2010),
a new internet- based surveillance tool to track various dengue indicators around the world.
Incidence per 100,000 people was selected as the predictor for dengue. Data were available
for 77 countries over the 20-year period. However, since DengueNet was only started in
2005, with a major emphasis on the Americas, South-east Asian and Western Pacific regions,
the dataset is incomplete with large gaps for years earlier than 2000 and later than 2007. This
dataset was supplemented with additional data collected from annual reports on the dengue
epidemic available on specific WHO regional department websites; specifically, WHO for
South-East Asia region, Pan American Health Organisation and the Western Pacific region.
These reports usually had a better record of country specific data, and data points that
19overlapped with DengueNet were similar. However these annual reports mostly reported
dengue incidence through total number of annual cases. Hence dengue incidence per 100,000
people had to be calculated with annual population data from the World Development
Indicator Database (WDI) (2010). Country specific data from respective Ministry of Health
monitoring reports were also used to compare numbers. The log of dengue incidence
(LogDengue) is used in the following regressions. Nevertheless dengue incidence data
remains incomplete, which may affect the results in this analysis.
The data for national accounting related variables from 1990 to 2009 were obtained
from the Penn World Tables (Heston, Summers & Aten, 2011). Data on real purchasing
power parity converted gross domestic product (GDP) per capita in constant 2005 prices
(Laspeyres), and trade openness (TradeOpen) in constant 2005 prices were collected for 187
world countries.
Data for key geographic variables such as population within 100 km of the coast
(PopCoast) and total tropical land area as a percentage of total overall land area (TropLand)
were obtained from the CIESIN Place II (2007) dataset. Though these datasets only recorded
data for the years 1990 and 2000, there was negligible to no change between the data points
for all countries. Hence it is assumed that these variables remained constant throughout the
20 years for each country. Gallup and Sachs (2001) have shown that these geographic
variables are important indicators of economic success. A country’s accessibility to the coast
measured by PopCoast facilitates “foreign trade and integration into the global economy” and
as a result, higher income levels (Gallup & Sachs, 2001). Countries with high percentages of
20tropical land area on the other hand experience lower income levels, as they are more
susceptible to endemic disease incidence.
The minimum distance to world markets is another measure of integration into the
global economy through increased trade facilitation. Gallup and Sachs (2001) show that the
“minimum distance to core world markets is inversely related to higher incomes.” They
define core world markets as “one of the three capital goods supplying regions: the U.S.,
Western Europe and Japan” (Gallup & Sachs, 2001). Hence the log of the minimum distance
from each country’s capital city to New York, Rotterdam or Tokyo is used as the last
geographic variable. In the following regression, we use the minimum distance from the
border edge of each country to the three identified world markets as a close substitute
(LogMinDistance). Data for 186 countries (excluding Panama) were collected using ArcGIS
world maps. Minimum distances are again believed to have remained constant through the
years assuming any plate shifting to be negligible.
Resource deposits may also contribute to economic growth though the effect is
estimated to be very small. However, the inverse relationship, also known as the “Resource
Curse” may have a significant effect on growth as demonstrated by the Dutch paradox
(Atkinson & Hamilton, 2003). Gallup and Sachs (2001) use data on hydrocarbon reserves per
person to measure resource deposits. Instead, the following regressions use energy
production as a percentage of total energy use (Energy) as a suitable proxy. Using data on
energy imports as a percentage of energy use from the WDI database, Energy was calculated
as the difference between a country’s total energy use (100%) and its energy imports.
21Data on malaria incidence similar to that used by Gallup and Sachs (2001) would
have been ideal for purposes of comparison. However there was only data available for one
year that overlapped: 1994. Regressions below attempt to replicate their results for 1994
(MalariaSachs). For a more complete regression analysis, another malaria index was
developed, based on LogDengue, or incidence per 100,000 people. Malaria data for 104
countries were from the Earth Trends Database by the World Resources Institute (Earth
Trends, 2010). However since data were only available for the total annual number of
malaria cases per country, the malaria incidence variable (MalariaIn) was calculated using
population data for 1990 to 2009 from WDI.
STATA, version 11.1 was used for conducting cross sectional and panel data
regressions, along with various statistical tests for efficiency of results. Refer to Appendix B
for a summary of all variables and codes.
Results
Cross Sectional Analysis: Malaria Incidence
An attempt to replicate Gallup and Sach’s (2001) results in Table 1 of their paper (see
Appendix A) is shown in Table 1. 1994 was used as the base year for regression 1 due to the
only available overlap with their data for Malaria incidence. However since most large world
events show effects that smooth over the long run, it assumed that the unobservable
differences between 1994 and 1995 (in Gallup and Sachs (2001)) are negligible. The signs on
22coefficients for all variables were identical to those in Gallup and Sachs (2001), and were all
significant further emphasising the effect of the geographical variables and resource deposits
on income levels. There were, however, large differences in the magnitude of the coefficients
from their results. This could be due to differences in how each variable was measured, and
simply differences due to the time period of the regression analysis. 1990 (regression 2) and
2005 (regression 3) were chosen as comparisons for the start of the 20-year period and the
end. Fewer coefficients were significant, but were of the correct sign. MalariaIn in particular
was negative and significant in 1990, which confirms their result of a penalty on income with
Malaria incidence.
Table 1: Cross Sectional Regression Results: Malaria
23Regression analysis was done on data from 1994 for the next 6 regressions,
alternating between MalariaSachs and MalariaIn. Regressions using MalariaSachs produced
identical signs on coefficients of variables that were significant, including the coefficient on
MalariaSachs itself, which closely matched even the magnitude of the coefficient. Certain
factors used by Gallup & Sachs (2001) such as variables for socialist countries and countries
that were previously colonies were omitted as these were considered to have a lower impact
on growth in the past 20 years. The variable for quality of public institutions was also left out
due to a lack of comparable data. These could have contributed to the lack of significant
results. One oddity in results points to the negative coefficient on TradeOpen in regression 8,
though not significant. Leaving out LogMinDistance did not seem to correct for this result.
Differences in results may also be due to the differences in the number of observations.
Results remained similar when regressing panel data for Non-African countries (regression
8). African countries are characterised by high poverty rates and low infrastructure resulting
in low incomes, which might therefore cause inefficiencies in the results.
Using MalariaIn (regression 5,7 and 9) as an alternate variable brought out similar
results to those using MalariaSachs. Coefficients for MalariaIn however were consistently
positive, though not significant. MalariaIn may not adequately represent the high risk of
malaria, which is best captured through the falciparum malaria index used in Gallup and
Sachs (2001). 1
1
The falciparum malaria index used in Gallup and Sachs (2001) is the fraction of the
population at risk of malaria multiplied by the fraction of cases of malaria that are falciparum
malaria. Data for number of cases of falciparum malaria is not available for all years from the
WHO epidemiology reports for malaria.
24Cross Sectional Analysis: Dengue Incidence
Cross section regression results for dengue for years 1994, 1990 and 2005 are shown
in Table 2. Results were mostly not significant except for 2005. All coefficients show the
correct sign except for LogMinDistance, which is positive through out, suggesting that
distance to the core world markets might be accommodated by other variables. Indeed
identified core world markets all happen to be located in temperate climate zones, far north
from the tropical belt. LogDengue shows positive signs in 1990 and 2005 (contrary to
expectation), but reverts to negative for regressions 4, 5 and 6. A positive sign could be due
to high growth years where increases in income dwarfed the penalties of dengue incidence.
Table 2: Cross Sectional Regression Results: Dengue
25Panel Data Regression Analysis for Dengue
Panel data regression analysis was also employed to see how the independent variable
effects varied over time and with additional observations. Results are shown above in Table
3. Coefficients for PopCoast, Energy, TropLand and TradeOpen all had the right sign and
were significant. LogMinDistance however had a positive coefficient but was still
significant. LogDengue was positive in both cases, but not significant.
Table 3: Panel Data Analysis (1990 to 2009)
26Panel data were then analysed for the specific Dengue endemic regions to understand
if trends in regression 1 and 2 were equally applicable across the world. Analysis for Dengue
in Africa immediately dropped three variables, which is thought to be due to
multicollinearity. Oddly though, the coefficient for energy was significant and negative.
African nations such as Zambia, Nigeria, Sierra Leone and Angola have often seen
themselves fall to the “resource curse”, where sudden discoveries of large amounts of natural
resources have only further contributed to low growth. Corrupt governments, inadequate
infrastructure and misguided national economic policy may be reasons for this negative
coefficient (Mehlum, Moene & Torvik, 2006). Coefficients for other variables were not
significant.
Dengue in Southeast Asia (regression 4) produced significant results for all variables
except LogDengue. LogMinDistance and TropLand had significant but opposite signs.
Countries in Southeast Asia are generally characterised by high tropical land area and are at a
significant distance from the three core world markets. However high growth in this region
through the past 20 years may well make up for any tropical penalties. The quick
development of countries such as Malaysia, Indonesia and Singapore have made them better
equipped to deal with the endemic disease spread characterised by tropical countries.
Southeast Asian nations are also highly characterised by close access to the sea and high
values for PopCoast. Access to the sea coupled with a strategic location along major trade
routes and high inter-ASEAN trade suggest that it might be making up for the penalties
associated with LogMinDistance.
27These results remain the same with dengue incidence in the entire Asian continent
(regression 5). In this case, however, LogDengue is both negative and significant, suggesting
that countries with significant dengue incidence had a lower GDP per capita than those
without. However, it is important to note, that causality may also run the opposite way where
countries with a low GDP per capita may be less equipped to tackle the domestic dengue
problem.
The negative and significant LogDengue variable is also noticed in regression 6 for
the Americas region. The Americas region also logs a negative and significant result for
TropLand. A further breakdown for the Americas region to concentrate only on South
America causes the sign on LogDengue to turn positive and significant again, whilst the
others stay the same. Oddly enough, TradeOpen is negative and significant for both the
Americas and South American region.
Panel data regression analysis as shown in Table 3 did not produce consistent results
amongst the different regions, with signs on important coefficients switching between
regressions. This might suggest that there was omitted variable bias in the simple OLS
regression analysis that was not taken into account.
Possible Reasons for Conflicting Results: Multicollinearity
A key factor contributing to inconsistent results is the low number of observations
due to incomplete data. However, multicollinearity between the independent variables in the
above regressions could explain the changing signs on the coefficients of certain variables
28and for the overall insignificant results. This could especially be the case with variables such
as PopCoast and LogMinDistance, which have a tendency to overlap. Countries that are
concentrated in the tropical zone also tend to be island nations surrounded by most of the
world’s water bodies. Hence there is a possibility that the variance of these independent
variables is being inflated by strong correlations with other predictor variables.
Table 4: Multicollinearity Test (Panel Data 1990-2009)
L>&B$0.&&$1'"#$BP(-'HB(3+NN9QK99N5
!"#$"%&'( !)* +,!)*
-#./$0"&(&"12("#'"(345 +678 96::
;.&"B$.1(C$BD$1(+99(EF(.G(0."HB(345 +68: 96I@
;.might help to explain some of the variation in results; dengue is mostly found in tropical
urban areas.
Though multicollinearity may not be useful in explaining results for the entire panel
data set, it may be useful in understanding the results of regression 3 in Table 3: Dengue in
Africa. An OLS regression on panel data from African countries immediately dropped three
variables; PopCoast, LogMinDistance and TropLand. Initial intuition suggests that the
software dropped all three variables due to extreme multicollinearity. To confirm this
intuition, a test was conducted by running multiple regressions with each of the three
variables as the dependent variable, against the other two predictors. Estimating VIF factors
in this case simply dropped the variables without checking for multicollinearity.
Comparisons of the R values from all three regressions resulted in an odd observation. All
three variables were more than 90% independent of the other two. Hence we cannot attribute
the odd results simply to multicollinearity, though there does not seem to be another adequate
explanation.
Possible Reasons for Conflicting Results: Fixed Effects
Omitted variable bias through fixed effects is a key factor in explaining insignificant
results in the regression analysis. In this case, the oddities with the sign changes on
LogDengue coefficients could be due to the factors in countries that change over time, but
are constant within the country itself. One example is the trajectory of growth for certain
countries. Worldwide, countries have seen overall high growth rates through the past twenty
years despite major financial crises. The world economy as a whole has expanded as the
30Eastern Bloc collapsed and more countries have integrated themselves into free trade.
Political barriers have also slowly broken down and developing nations have seen increased
growth in both exports and domestic demand. Countries like China and India and the
Southeast Asian region as a whole have seen average annual growth rates of more than 5%.
Ignoring growth due to sudden resource discoveries, most countries have achieved such
numbers due to a steady strengthening of internal infrastructure and macroeconomic policies,
and the momentum that carries with such development. Though attempts have been made to
control for this using TradeOpen, there are various other intangible factors that may be hard
to isolate. Hence a positive coefficient for LogDengue may just be due to the exponential
increase trajectory of GDP that has far exceeded the negative effect of dengue.
Table 5: Fixed Effects Analysis
31A between-effects regression would therefore allow the use of variation between
cases to estimate the effect of omitted variable bias. This is equivalent to running a regression
with dummy variables for each year from 1990 to 2009, minus one. However, results as
shown in regression 1 of Table 5 are largely inconclusive. Significant coefficients with the
correct sign were achieved only for PopCoast and Energy. The coefficient for LogDengue
though negative was not significant. R-values were extremely low suggesting that a between-
effects regression was inefficient. Another attempt to control for time fixed-effects
specifically in Southeast Asia was also unsuccessful. A dummy variable for high growth
years (described as years with average growth between the 11 Southeast Asian nations above
7% - 1994, 1995, 2000, 2005) was created. However, the variable was dropped by STATA in
regression analysis.
Omitted variable bias may also be due to factors that may vary between cases but are
fixed over time. This could include cultural attitudes towards dengue. Hence a random-
effects model was run to test if conflicting results were due to a combination of both
between- and fixed-effects. Results are shown in regression 2 of Table 5. R-values had
increased to 0.43, suggesting that the random-effects model was better than regression 1.
Coefficients on variables that had significant results, PopCoast, Energy and TropLand, all
had the right sign. However the coefficient for LogDengue was positive, but also significant
at the 1% level. A Breusch and Pagan Lagrangian multiplier test for random-effects was
conducted to further assess the validity of these results over those in Table 3. Results of the
test were highly significant suggesting that the random-effects model was more effective than
simple OLS regression analysis.
32Lastly, a fixed-effects model controls for unobserved factors that are time invariant.
Apart from cultural attitudes to dengue, access to resources and healthcare, state attitudes
towards healthcare provision, other geographical specificities that make a country especially
vulnerable to dengue, or even traditional practices are examples of fixed-effects. In
Singapore for example, a large majority of citizens live in government subsidised high-rise
apartment buildings. Most come equipped with bamboo pole holders outside the kitchen
windows, which are used to dry laundry. These holders collect water during rainy days and
hence provide good breeding grounds for mosquitos. However, this phenomenon is
something that is uniquely Singaporean and hence would be difficult to control for with a
specific variable. Relying on simply regressing each country on its own is difficult due to the
short time period we are investigating and hence the overall lack in data points. Similar to
adding a dummy variable for each country, the fixed-effects model exploits group variation
over time, controlling for any unobservable or intangible predictors. Results of the fixed-
effects model are shown in regression 3 of Table 5. Factors such as TropLand, PopCoast, and
LogMinDistance were rightly dropped, as these do not vary over time within each country.
Otherwise results closely mirrored those in regression 2. Again coefficient for LogDengue
was both positive and significant.
The Hausman test was ran as a final check to decide between the fixed-effects and
random-effects model. Results of the test were extremely significant, concluding that a fixed-
effects model provided the most sensitive results.
33Discussion
The results from the regressions are not definitive enough to decide if the relationship
between dengue incidence and economic growth is negative. Cross sectional regression
results were inconclusive with no significant findings. Panel data regressions showed both
positive (South America) and negative (Asia and Americas) significant coefficients. A fixed-
effect regression, considered the most efficient according to a Hausman test, showed
significant positive results, although these effects were very small (0.02). These results could
in fact be due to inconsistency in monitoring and reporting of dengue cases around the world.
Moreover, dengue reporting seemed to be getting more robust through the years, signalling
that underreporting may be pervasive in the years preceding the development of DengueNet.
Reporting techniques and rigor may also differ amongst countries, which may affect results
to an extent greater than what the fixed-effects model can correct for. This trend of
underreporting may not have picked up fast enough with the overall expansion in world
economies. Dengue, despite its pervasiveness, remains largely ignored. Much less is known
about dengue than other diseases such as malaria or yellow fever, perhaps due to its much
lower overall mortality rates. Hence increases in GDP may far outpace the increasing
surveillance of dengue resulting in the odd positive coefficients. Causality may also run the
opposite direction; a large increase in GDP may result in an overall drop in dengue as
countries are better equipped to carry out effective vector control strategies.
Dengue also disproportionately affects countries in the tropics, a large number of
which are small and relatively new island nations or overseas territories that have yet to be
accounted for in national income data. Countries such as the Turks and Caicos, Anguilla and
34the French Polynesia were omitted due to a lack of data on GDP incomes and resource
deposits, despite obvious dengue incidence. The dengue variable itself may not be accurately
capturing the risk associated with the disease. As dengue deaths are uncommon it was not
ideal to use the rates of deaths from dengue. Countries also exclusively report clinically
diagnosed dengue, as laboratory tests for dengue are still expensive. Incidence based on
laboratory confirmed dengue, which then is separated according to the different serotypes
might be more accurate. Dengue incidence per 100,000 may also not be capturing the
possibilities of large economic burdens due to decreased productivity of infected and
recovering workers adequately. Gallup and Sachs (2001) were able to identify the very strain
of Malaria that had the most severe risk. However, dengue serotypes are almost equally
severe, and not enough is known about them. Moreover, it is difficult to capture the effect of
the antibody dependent enhancement mechanism that is said to increase the severity of
dengue disease.
Conclusion
Due to inconsistent statistical results, it is difficult to assess the true impact of dengue
on economic growth. However, this is not to say that dengue does not affect a country’s
economy. Dengue does have the potential to cause much harm as proven by studies on
economic burden suggesting that costs to society, not just in terms of healthcare costs, but in
loses in productivity, are significant. Dengue, despite having low mortality rates, is
characterised by side effects and symptoms that last well beyond the actual disease phase,
causing fatigue and aches for a long period. Pain and suffering is a welfare impact that is not
captured by traditional economic performance measures such as GDP. Furthermore, there are
35multiple other channels through which dengue may affect the economy. These include effects
on fertility, population growth, worker productivity, absenteeism, infant mortality, medical
costs, savings and even investment rates (Gallup & Sachs, 2001).
Ideally other factors that contribute to the relationship between dengue and economic
growth would have been added to improve efficiency. However, the data for these variables
were even more incomplete than dengue incidence itself. Accuracy would have been
enhanced with dummy variables for countries with high fatality rates, adult-focused versus
childhood dengue and other macroeconomic variables such as transparency, institutional
management and corruption. Although CPIA data from WDI was available for transparency
and corruption, the range of countries investigated was extremely limited.
More than anything else, this study has illustrated gaps in information and analysis on
the relationship between dengue and economic well-being. Although many developed
countries have seen a dip in dengue incidence due mostly to socio-economic development
and improvements in hygiene and sanitation, dengue has proven to be extremely resilient.
High resource countries like Singapore have failed to eradicate dengue, whilst locally
acquired dengue has recently been reported in the USA after a 40-year absence (WHO
SEARO, 2010). Though a start, DengueNet needs to expand its research and improve its
surveillance and monitoring capacities. States need to be mandated to record dengue cases
for submission to the WHO. GIS software, currently employed by Singapore will be crucial
in mapping dengue hotspots and epidemic cycles in the future (Eisen & Eisen, 2011). This
36information is especially important for purposes of analysing effects of a successful dengue
vaccine and hence formulating its pricing structure when it becomes available.
37References
Armien, B., Suaya, J. A., Quiroz, E., Sah, B. K., Bayard, V., Marchena, L., et al. (2008).
Clinical characteristics and national economic cost of the 2005 dengue epidemic in
Panama. Am J Trop Med Hyg, 79(3), 364-371.
Asian Collaborative Training Network for Malaria (ACTMalaria), Vector Control
Management, Malaysia. . 2010, from
http://www.actmalaria.net/home/aboutus.php#bas
Atkinson, G., & Hamilton, K. (2003). Savings, growth and the Resource Curse hypothesis.
World Development 31(11), 1793-1807.
Chen, H. (2008). Boost for research on dengue, diabetes; 2 projects strategic to Singapore get
grant of $25m each. The Business Times Singapore.
DengueNet. World Health Organisation. 2010, from
http://apps.who.int/globalatlas/default.asp
Drake, J. W., & Holland, J. J. (1999). Mutation rates among RNA viruses. Proceedings of the
National Academy of Sciences of the United States of America, 96(24), 13910-13913.
Earth Trends: Malaria 2010, from http://earthtrends.wri.org. World Resources Institute
Eisen, L., & Eisen, R. J. (2011). Using Geographic Information Systems and Decision
Support Systems for the prediction, prevention and control of vector-borne diseases.
Annual Review of Entomology, 56, 41-61.
Fact Sheet: Dengue and Dengue Haemorrhagic Fever. (2002). 2010, from
http://www.who.int/mediacentre/factsheets/fs117/en/
Gallup, J. L., & Sachs, J. D. (2001). The economic burden of malaria. American Journal of
38Tropical Medicine Hygiene, 64(1,2), 85-96.
Gamble, J. e. a. (2000). Age-related changes in microvascular permeability: a significant
factor in the susceptibility of children to shock? . Clinical Science, 98(211-216).
Gubler, D. (1987). Current research on dengue. In H. KF (Ed.), Current Topics in Vector
Research (pp. 37-56). NY, USA: Springer Verlag, Inc.
Gubler, D. J. (1989). Aedes aegypti and Aedes aegypti-borne disease control in the 1990s:
top down or bottom up. Am J Trop Med Hyg, 40(6), 571-578.
Gubler, D. J. (2004). Cities spawn epidemic dengue viruses. Nature Medicine, 10(1), 129 -
130.
Gubler, D. J., & Clark, G. G. (1994). Community-based integrated control of Aedes aegypti:
a brief overview of current programs. Am J Trop Med Hyg, 50(6_Suppl), 50-60.
Guha-Sapir, D., & Schimmer, B. (2005). Dengue fever: new paradigms for a changing
epidemiology. Emerging Themes in Epidemiology, 2(1), 1.
Guzman, M. G., & KourÌ, G. (2004). Dengue diagnosis, advances and challenges.
International Journal of Infectious Diseases, 8(2), 69-80.
Guzman, M. G., Kouri, G. P., Bravo, J., Soler, M., Vazquez, S., Santos, M., et al. (1984).
Dengue Haemorrhagic Fever in Cuba. II. Clinical investigations. Transactions of the
Royal Society of Tropical Medicine and Hygiene, 78(2), 239-241.
Halstead, S. B. (1980). Dengue haemorrhagic fever - a public health problem and a field for
research. Bulletin World Health Organisation, 58(1), 1-21.
Halstead, S. B. (1988). Pathogenesis of dengue: challenges to molecular biology. Science,
239(4839), 476.
Halstead, S. B., Streit, T. G., Lafontant, J. G., Putvatana, R., Russell, K., Sun, W., et al.
39(2001). Haiti: absence of dengue hemorrhagic fever despite hyperendemic dengue
virus transmission. Am J Trop Med Hyg, 65, 180 - 183.
Heintze, C., Garrido, M. V., & Kroeger, A. (2007). What do community-based dengue
control programmes achieve? A systematic review of published evaluations.
Transactions of the Royal Society of Tropical Medicine and Hygiene, 101(4), 317-
325.
Heston, A., Summers, R., & Aten, B. (2011). Penn World Table Version 7.0: Center for
International Comparisons of Production, Income and Prices at the University of
Pennsylvania.
Holmes, E. C., & Burch, S. S. (2000). The causes and consequences of genetic variation in
dengue virus. Trends in Microbiology, 8(2), 74-77.
Holmes, E. C., & Twiddy, S. S. (2003). The origin, emergence and evolutionary genetics of
dengue virus. Infection, Genetics and Evolution, 3(1), 19-28.
Keating, J. (2001). An investigation into the cyclical incidence of dengue fever. Social
Science & Medicine, 53(12), 1587-1597.
Kouri, G. P., M.G. Guzman, J.R. Bravo, and C. Triana. (1989). Dengue haemorrhagic
fever/dengue shock syndrome: lessons from the Cuban epidemic, 1981. Bull World
Health Organ, 67(4), 375-380.
Leitmeyer, K. C., Vaughn, D. W., Watts, D. M., Salas, R., Villalobos, I., de, C., et al. (1999).
Dengue virus structural differences that correlate with pathogenesis. J. Virol., 73(6),
4738-4747.
Low, J. G. H. e. a. (2006). Early dengue infection and outcome study (EDEN) - study design
and preliminary findings. Annals Academy of Medicine, 35(11), 783-789.
40You can also read