A Survey of Forex and Stock Price Prediction Using Deep Learning - MDPI

Page created by Victor Shelton
 
CONTINUE READING
A Survey of Forex and Stock Price Prediction Using Deep Learning - MDPI
Review
A Survey of Forex and Stock Price Prediction Using
Deep Learning
Zexin Hu † , Yiqi Zhao † and Matloob Khushi *

                                          School of Computer Science, The University of Sydney, Building J12/1 Cleveland St.,
                                          Camperdown, NSW 2006, Australia; zehu4485@uni.sydney.edu.au (Z.H.); yzha9512@uni.sydney.edu.au (Y.Z.)
                                          * Correspondence: matloob.khushi@sydney.edu.au
                                          † The authors contributed equally; both authors should be considered the first author.

                                          Abstract: Predictions of stock and foreign exchange (Forex) have always been a hot and profitable
                                          area of study. Deep learning applications have been proven to yield better accuracy and return in
                                          the field of financial prediction and forecasting. In this survey, we selected papers from the Digital
                                          Bibliography & Library Project (DBLP) database for comparison and analysis. We classified papers
                                          according to different deep learning methods, which included Convolutional neural network (CNN);
                                          Long Short-Term Memory (LSTM); Deep neural network (DNN); Recurrent Neural Network (RNN);
                                          Reinforcement Learning; and other deep learning methods such as Hybrid Attention Networks
                                          (HAN), self-paced learning mechanism (NLP), and Wavenet. Furthermore, this paper reviews the
                                          dataset, variable, model, and results of each article. The survey used presents the results through
                                          the most used performance metrics: Root Mean Square Error (RMSE), Mean Absolute Percentage
                                          Error (MAPE), Mean Absolute Error (MAE), Mean Square Error (MSE), accuracy, Sharpe ratio, and
                                          return rate. We identified that recent models combining LSTM with other methods, for example,
                                          DNN, are widely researched. Reinforcement learning and other deep learning methods yielded great
                                          returns and performances. We conclude that, in recent years, the trend of using deep-learning-based
                                          methods for financial modeling is rising exponentially.
         
         
                                          Keywords: deep learning; stock; foreign exchange; financial prediction; survey
Citation: Hu, Z.; Zhao, Y.; Khushi, M.
A Survey of Forex and Stock Price
Prediction Using Deep Learning.
Appl. Syst. Innov. 2021, 4, 9.            1. Introduction
https://doi.org/10.3390/asi4010009
                                               The share market is a snapshot of future growth expectations of companies as well
                                          as the economy. Many factors have attributed to stock price fluctuation, which includes
Received: 24 December 2020
Accepted: 19 January 2021
                                          but is not limited to macroeconomic factors, the market anticipation, and confidence in
Published: 2 February 2021
                                          the company’s management and operation. The advancement of technology allows the
                                          public to access a larger quantity of information in a timelier manner. This means that
Publisher’s Note: MDPI stays neutral
                                          stock analysis has become more and more difficult as a considerable amount of data has
with regard to jurisdictional claims in
                                          to be processed in a relatively short time. People hope that the progress made in big data,
published maps and institutional affil-   especially in the deep learning field, can help them analyze stock information [1].
iations.                                       Foreign exchange (Forex) is one of the largest financial markets in the world. The
                                          prediction of the exchange rates can provide investors with useful decision-making refer-
                                          ences to increase return and to reduce risk. However, the exchange rate is always under
                                          the influence of many factors, such as countries’ economies, politics, society, international
Copyright: © 2021 by the authors.
                                          situation, etc., so the complexity of the matter has made Forex prediction and forecasting a
Licensee MDPI, Basel, Switzerland.
                                          challenging research topic [2]. Nowadays, Forex forecasting tasks apply many different
This article is an open access article
                                          deep learning models as the computer and artificial intelligence technology mature.
distributed under the terms and                Forex and stocks are similar in many aspects. For example, they both have comparable
conditions of the Creative Commons        technical indicators, both have similar charts (candle chart), and both could be affected
Attribution (CC BY) license (https://     by a country’s market sentiment. Therefore, this paper discusses the application of deep
creativecommons.org/licenses/by/          learning in both Forex and the stock market and explores the impact of different deep
4.0/).                                    learning methods on price trend prediction accuracy.

Appl. Syst. Innov. 2021, 4, 9. https://doi.org/10.3390/asi4010009                                            https://www.mdpi.com/journal/asi
Appl. Syst. Innov. 2021, 4, 9                                                                                            2 of 30

                                      Continuous development in the AI field leads to the wide use of deep learning
                                techniques in many research fields and practical scenarios. Applications include natural
                                language processing, image recognition, medical predictions, and more. The neural net-
                                works used in these applications have also developed and improved due to the rise of
                                deep learning. For example, reinforcement learning has gained popularity since AlphaGo
                                defeated the best chess player at the time by using it, and reinforcement learning has
                                been implemented in the financial prediction field since then [3]. These technological
                                breakthroughs have given the stock and Forex prediction models a solid foundation to
                                start and greater room to improve.
                                      The highly complex nonlinear relationship of deep learning can fully describe the
                                complex characteristics of the influencing factors. Many other fields have verified the
                                accuracy of a deep learning model for prediction accuracy, such as image classification
                                and gene analysis. Research results are also obtained for time-series data analysis and
                                prediction with a deep learning algorithm; for example, deep learning is used to predict
                                offline store traffic [4]. Overall, deep learning models have excellent performances in other
                                research fields. Therefore, it is feasible to predict stock and Forex trends with deep learning.
                                      Financial researchers around the world have been studying and analyzing the changes
                                in the stock and Forex markets. The broadening application of artificial intelligence has led
                                to an increasing number of investors using deep learning model to predict and study stock
                                and Forex prices. It has been proven that the fluctuation in stock and Forex price could be
                                predicted [5]. Different from traditional statistical and econometric models, deep learning
                                can describe complex influencing factors.
                                      Therefore, this paper investigates the different effects of different deep learning meth-
                                ods on stock and Forex forecasting according to existing published papers. This survey
                                will analyze each paper from the following aspects: 1. What is the dataset of this paper?
                                2. What is the variable of this paper? 3. What kind of deep learning model had been
                                adopted? 4. What is the result of the prediction model?
                                      The structure of this paper will be as follows: firstly, the introduction of Forex and
                                stock combined with deep learning; secondly, the criteria and research methods of the
                                article selected by the survey; thirdly, the impact and analysis of different deep learning
                                methods on stocks and Forex prediction; fourthly, the discussion and analysis of the above
                                methods; and finally, a conclusion of the whole paper.

                                2. Related Deep Learning Methods and Input Introduction
                                2.1. Convolutional Neural Network (CNN)
                                      CNN was widely used in the field of image recognition because of its powerful pattern
                                recognition ability; its use was also extended to the field of economic prediction. Similar
                                to the traditional neural network, CNN is composed of multiple neurons connected by
                                a hierarchical structure, and the weights and bias between layers can be trained. CNN
                                is different from the network structure of a fully connected network such as deep brief
                                network (DBN), Sparse Autoencoder (SAE), backpropagation (BP), as the CNN can share
                                the weight among the neurons in each layer of the network. Hence, the model significantly
                                reduces the weight of the network and avoids falling into dimensional disaster and local
                                minimization [6].
                                      If the characteristics of the stock market at a specific time point are regarded as a
                                feature graph, CNN has the potential to extract the characteristics of the stock market at
                                the corresponding period from these feature graphs. Therefore, CNN can be used to build
                                a timing-selection model and can ultimately be used to complete the construction of the
                                timing-selection strategy.

                                2.2. Recurrent Neural Network (RNN)
                                     RNN belongs to the neural network, and it is good at modelling and processing
                                sequential data. The specific expression is that the RNN is able to memorize the previous
                                state, and the previous state can be used in the current state calculation. The different
Appl. Syst. Innov. 2021, 4, 9                                                                                            3 of 30

                                hidden layers are non-independent, and the input of the current hidden layer includes not
                                only the output of the input layer but also the output of the previously hidden layer. For
                                this reason, RNN has a good performance in dealing with sequential data.
                                      The advantage of RNN is that it considers the context of data in the process of training,
                                which is very suitable for the scenario of stocks and Forex because the fluctuation at a
                                particular time often contains some connection to the previous trend.

                                2.3. Long Short-Term Memory (LSTM)
                                     The LSTM model is one of the variants of the RNN. Its core contribution is to introduce
                                the design of self-loop to generate the path of a gradient which could continuously flow
                                for an extended period. The weight of the self-loop is also updated in each iteration,
                                which solves the gradient vanishing problem that is easily generated when the RNN model
                                updates the weights [7].
                                     The modelling of a time series is essentially a process of nonlinear parameter fitting.
                                The LSTM model performs well to reveal the correlation of a nonlinear time-series in the
                                delay state space and to realize the purpose of stock prediction [8]. The stock or Forex
                                trend prediction model based on LSTM obtained the corresponding data characteristics
                                from the stock or Forex history data.

                                2.4. Deep Neural Network (DNN)
                                     DNN is a neural network with at least one hidden layer. It provides modelling for
                                complicated nonlinear functions and has a high-level abstraction ability, which means
                                that the fitting power of the model is significantly improved. Meanwhile, it is a kind of
                                discriminant model which could be trained through the backpropagation algorithm.
                                     Since the DNN is good at dealing with prediction problems with sizable data and
                                complicated nonlinear mapping relations, an intelligent stock and Forex prediction system
                                can be designed based on a DNN to predict stock and Forex trends [9]. Hopefully, the
                                model is able to achieve far higher accuracies than human beings.

                                2.5. Reinforcement Learning
                                     Reinforcement learning is one of the deep learning methods that focuses on how to act
                                according to the current situation to profit maximization. In reinforcement learning, there
                                are two basic elements: state and action. A strategy is defined as performing a particular
                                action in a specific state. All the learner has to do is learn a good strategy by continually
                                exploring and learning.
                                     If the state is regarded as the attribute and the action is the label, it is easy to know
                                that both supervised learning and reinforcement learning try to find a map and to infer
                                the label/action from the known attribute/state. In this way, the strategy in reinforcement
                                learning is equivalent to the classification/regression in supervised learning. However, in
                                practical problems, reinforcement learning does not have such labelling information as that
                                of supervised learning, and the results are often obtained after an attempt of the action.
                                Therefore, reinforcement learning continuously adjusts the previous strategy through
                                feedback from the results; for this reason, this algorithm would learn in which state one
                                should take which step to have the most beneficial result.
                                     Therefore, reinforcement learning learns the best timing trading action (selecting the
                                best price, trading duration, and order size) according to the market response. It can view
                                the contextual information (price, news, public opinion, interest rate, fees, trading action,
                                returns, losses, etc.) of the transaction as an environment of reinforcement learning. Gains
                                or losses could be thought of as the reward for learning, trading actions could be thought of
                                as actions, and factors could be thought of as states or observations to realize the prediction
                                of the stock and Forex trends.
Appl. Syst. Innov. 2021, 4, 9                                                                                              4 of 30

                                2.6. Other Deep Learning Methods
                                     In this paper, we also discuss the prediction of stock and Forex trends by other deep
                                learning methods [10], for example, Hybrid Attention Networks (HAN), self-paced learning
                                mechanism (NLP), multi-filters neural network (MFNN), and Wavenet. The frequency of these
                                methods in the selected articles is not high so they will be discussed together in Section 4.1.6.

                                3. Review Methodology and Criteria
                                3.1. Paper Selection Methods
                                      In the past few years, there have been many deep learning model papers on stock and
                                Forex forecasting. The articles analyzed in this paper were all from the Digital Bibliography
                                & Library Project (DBLP) computer science bibliography and Microsoft Academic database.
                                      Firstly, the keywords were searched in DBLP: “CNN stock/Forex”, “LSTM stock/Forex”,
                                “Deep learning stock/Forex”, “RNN stock/Forex”, and “Reinforcement learning stock/Forex”.
                                These keywords are necessary to ensure the papers reviewed are relevant to our topic. The
                                keywords were searched in Microsoft Academic, and then, the filters “2015–2021” and “Deep
                                learning” were applied.
                                      Secondly, the quality of the selected articles from DBLP was ensured by excluding all
                                journals and conferences that were informally published and the quality of the selected
                                articles from Microsoft Academic were controlled by excluding all journals and conferences
                                that were informally published as well as those without a minimum of 5 citations. Filtering
                                on citations as the search method was designed to detect understudied areas within this
                                field; a paper with 5 or more citations can be an indication that the area could be potentially
                                explored. Furthermore, it should be noted that we only considered papers with a novel
                                model, with the implementation of existing models not analyzed in this review.
                                      At the same time, the timeliness of the survey was provided by focusing on publi-
                                cations after 2015. Among them, there were 4 papers in 2015, 1 paper in 2016, 14 papers
                                in 2017, 29 papers in 2018, 28 papers in 2019, and 10 papers in 2020; in total, 86 existing
                                papers were reviewed.

                                3.2. Selected Paper Statistics
                                      In this paper, the goal was to study the use of six different deep learning methods in
                                Forex/stock (which are CNN, LSTM, DNN, RNN, reinforcement learning, and other deep
                                learning methods) with different datasets, input variables, and model types. All the results
                                were compared together for discussion and for conclusion after being individually analyzed.
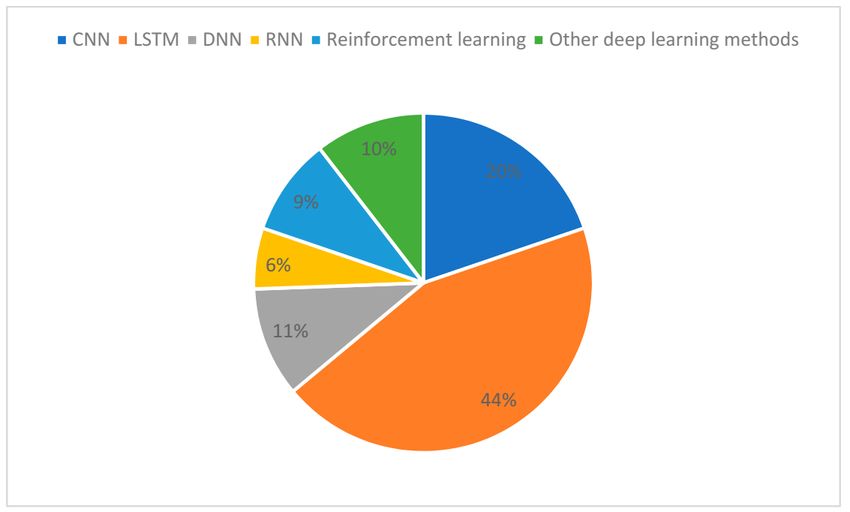
                                      Figure 1 showed the annual distribution of the papers collected and reviewed. Figure 2
                                showed the distribution of the different methods in this paper. Figure 3 shows the system-
                                atic literature review in this paper. Table 1 showed the distribution of different types of
                                articles in this paper.

                                Table 1. The distribution of different types of articles in this paper.

                                                                                       Number of Papers   Number of Papers
                                     Type of Method               Total Paper
                                                                                         in Journals       in Conferences
                                         CNN                            18                       6                 12
                                         LSTM                           38                      13                 25
                                         DNN                            9                       5                  4
                                         RNN                            5                       2                   3
                                     Reinforcement
                                                                         8                       1                  7
                                        Learning
                                  Other Deep Learning
                                                                        10                       3                  7
                                        Methods
Appl. Syst. Innov. 2021, 4, 9                                                                         5 of 30

                                Figure 1. The annual distribution of papers collected and reviewed.

                                Figure 2. The distribution of the different methods in this paper.
Appl. Syst. Innov. 2021, 4, 9                                                                                                                                 6 of 30

                                              Figure 3. The systematic literature review in this paper.

                                              4. Results
                                              4.1. Papers Descriptions
                                              4.1.1. CNN
                                                   Seventeen articles that used CNN technology for stock and Forex prediction are
                                              briefly described below. Table 2 shows the author, variables, dataset, and model of the
                                              papers mentioned.

                     Table 2. Information on the papers which used the Convolutional neural network (CNN) model.

  Reference No.                   Author                             Dataset                              Variables                            Model
                                                                                           1. Open price,
                                                        1. Top 4 performing companies of   high price, low price, AdjClose price,
                                                        US, Hong
       [11]                     Maqsood, H.                                                volume, and close price                              CNN
                                                        Kong, Turkey, and Pakistan
                                                                                           2. Sentiment (positive, neutral, and
                                                        2. Twitter dataset
                                                                                           negative sentiments).
                                                        1. News collected on a
                                                        financial website.                 Adjacency matrix calculated by the
                                                                                                                                       Graph convolution neural
       [12]                       Patil, P.             2. 30 stocks of fortune 500        correlation
                                                        companies, such as WMT, XOM,                                                       network (GCN)
                                                                                           coefficient and using news co-mentions
                                                        and AAPL
       [13]                      Sim, HS.               S&P 500 min data                   Close price                                          CNN
                                                        S&P 500, NASDAQ, Dow Jones
                                                        industrial average, NYSE,          82 variables including high, low, and              2D-CNN
       [14]                 Hoseinzade, E.                                                                                                  and 3D-CNN
                                                        and Russell                        close price; volume, RSI, KD, WR, etc.

                                 Eapen, J.              Standard and Poor’s (S&P) 500                                                     CNN-bidirectional
       [15]                                                                                Close price
                                                        stock dataset                                                                         LSTM
                                                                                           High, low, and close price; volume, RSI,
       [16]                      Yang, H.               S&P 500 Index ETF (SPY)                                                           CNN with MICFS
                                                                                           KD, WR, ROC, and CCI
                                                                                           1. word vector; headline and keyword
                                                        1. Crawling financial news
       [17]                       Cai, S.                                                  training set in the news                          CNN-LSTM
                                                        2. Baidu Index
                                                                                           2. Close price
                                                        Reuters and Reddit                 Word vectors of headlinesClose prices,
                                                        Standard & Poor’s 500 Index                                                          CNN-LSTM
       [18]                 Oncharoen, P.                                                  Bollinger band, RSI, and stochastic
                                                        (S&P500) and Dow Jones
                                                        Industrial Average (DJIA)          oscillator
                                                                                           1. Financial news corpus with
                                                                                           headlines from Apple
                                                        1. Thomson Reuters                 2. Open price; close price; high price;
       [19]                       Liu, Y.               2. Standard & Poor’s 500 index     low price; volume; stochastic oscillator      TransE-CNN-LSTM
                                                        (S&P 500)                          (%K); Larry William (LW) %R indicator;
                                                                                           and Relative Strength
                                                                                           Index (RSI)
                                                        NSE listed companies: Infosys,
       [20]                      Selvin, S.                                                Close price                                CNN sliding-window model
                                                        TCS, and CIPLA
Appl. Syst. Innov. 2021, 4, 9                                                                                                                        7 of 30

                                                                      Table 2. Cont.

  Reference No.                 Author                          Dataset                              Variables                           Model
                                                    Chinese stocks from the SINA
       [21]                     Liu, S.             FINANCE (not given                 Close price                                     CNN-LSTM
                                                    specific data)
                                                                                       Close price, RSI, SMA, MACD, MFI,
       [22]                 Gudelek, M.U.           Exchange-Traded Funds (ETF)        Williams %R, the stochastic oscillator,          2D-CNN
                                                                                       and the ultimate oscillator
                                                                                       1. close price
                                Ding, X.            1. S&P 500 index                                                                   NTN-CNN
       [23]                                                                            2. long-term, mid-term, and short-term
                                                    2. Reuters and Bloomberg
                                                                                       feature vectors of news headlines
                                                                                       1. Momentum indicators: RSI5, RSI10,
                                                                                       RSI20, MACD, MACDhist,
                                                                                       MACDsignal, Slowk, Slowd, Fastk,
                                                                                       Fastd, WR5, WR1, WR2, ROC5, ROC1,         Wavelet denoised-ResNet
       [24]              Zhao, Y. and Khushi        USDJPY exchange rate
                                                                                       ROC20, CCI5, CCI10, and CCI20              CNN with light GBM
                                                                                       2. Volume indicators: ATR5, ATR10,
                                                                                       ATR20, NATR5, NATR10, NATR20,
                                                                                       and TRANGE
        [3]              Chen, S. and He, H.        Chinese stock market               Closing price                                    CNN
       [25]                Chen, Jou-Fan            Taiwan index futures               Open, high, low, and closing price             GAF + CNN
                                                                                       Open, high, low, close, adjusted close,
       [26]                     Wen, M              S%P500                                                                                CNN
                                                                                       and volume.

                                                Maqsood, H. proposed a CNN model that made use of the price and sentiment analysis
                                           as input and compared the proposed model with linear regression and Support vector
                                           machine (SVM). He concluded that not all significant events have a serious impact on stock
                                           exchange prediction. However, more important local events could affect the performance
                                           of prediction algorithms [11].
                                                Patil, P. proposed a new network using graph theory and CNN, which leveraged
                                           spatiotemporal relationship information between different stocks by modelling the stock
                                           market as a complex network. Meanwhile, the model used both stock indicators and
                                           financial news as input [12].
                                                Sim, H.S. proposed a CNN network that uses 9 technical indicators (close price,
                                           Simple moving average (SMA), Exponential moving average (EMA), Rate of change (ROC),
                                           Moving average convergence/divergence (MACD), Fast%K, Slow%D, upper band, and
                                           lower band) to verify the applicability of the CNN method in the stock market. He
                                           concluded that the use of technical indicators in stock price forecasting by CNN has no
                                           positive effect [13].
                                                Hoseinzade, E. proposed two models: 2D-CNN and 3D-CNN using 82 different
                                           technical indicators. These two structures could improve the predictive performance of the
                                           baseline algorithm by about 3–11% [14].
                                                Eapen, J. proposed a model that had multiple pipelines of CNN and bidirectional
                                           LSTM units. It could improve prediction performance by 9% using a single pipeline deep
                                           learning model and by over a factor of six using support vector machine regressor model
                                           on the S&P 500 grand challenge dataset [15].
                                                Yang, H.M. proposed a multi-indicator feature selection for stock index prediction
                                           based on a multichannel CNN structure without subsampling, named the MI-CNN frame-
                                           work. In this method, candidate indicators were selected by the maximal information
                                           coefficient feature selection (MICFS) approach to ensure the correlation with stock move-
                                           ments whilst reducing redundancy between different indicators [16].
                                                Cai, S. proposed the CNN and LSTM forecasting system with financial news and
                                           historical data of the stock market. It generated seven prediction models. According to
                                           the ensemble learning method, the seven models were constructed into one ensemble
                                           model to obtain an aggregated model. Unfortunately, all models had a lower prediction
                                           accuracy [17].
                                                Oncharoen, P. proposed a new framework to train a DNN for stock market prediction.
                                           A new loss function was developed by adding a risk–reward function, which was derived
                                           from the trading simulation results [18].
                                                Liu, Y. proposed to incorporate a joint model using the TransE model for representation
                                           learning and a CNN, which extracted features from financial news articles. Then, he
Appl. Syst. Innov. 2021, 4, 9                                                                                                                                8 of 30

                                            combined the model with LSTM to predict the price movement. The model could improve
                                            the accuracy of text feature extraction while reducing the sparseness of news headlines [19].
                                                 Selvin, S. used CNN, LSTM, and RNN architectures to forecast the price of NSE-listed
                                            companies and compared their performance. The final results showed that CNN is the
                                            best architecture to predict the price of stock because it could identify the trend of the
                                            directional change [20].
                                                 Liu, S. proposed a CNN-LSTM model, and the model performed a basic momentum
                                            strategy and benchmark model for which the return rates were 0.882 and 1.136, respectively.
                                            The CNN part could extract useful features even from low signal-to-noise time-series
                                            data, and the LSTM part could predict future stock prices with high accuracy. Then, the
                                            predicting outcomes were used as timing signals [21].
                                                 Gudelek, M.U. proposed a 2D-CNN model. This model adopted a sliding window
                                            approach and then generated images by taking snapshots that are bounded by the window
                                            over a daily period. The model could predict the next day’s prices with 72% accuracy and
                                            ended up with 5:1 of the initial capital [22].
                                                 Ding, X. proposed a deep learning method for the event-driven stock market pre-
                                            diction. Firstly, events were extracted from news text and represented as dense vectors,
                                            trained using a novel neural tensor Network (NTN). Secondly, CNN was used to model
                                            both the short-term and long-term influences of events on stock price movements [23].
                                                 Zhao, Y. proposed a Wavelet Denoised-ResNet CNN for Forex exchange rate predic-
                                            tion. The technical indicators were treated as an image matrix. The image matrix was first
                                            denoised using Wavelet method and then processed by ResNet CNN. Lastly, LightGBM
                                            was used to replace the softmax layer to output a prediction [24].
                                                 Chen, S. and He, H. proposed a CNN model with a novel architecture, where it
                                            generated better results than the benchmark RNN model [3].
                                                 Chen, Jou-Fan proposed a novel CNN model which utilized the power of Gramian Angular
                                            Field. The results produced were average, but it is an interesting research direction [25].
                                                 Wen, M. proposed a CNN model which relied on the reconstructed of time series, it
                                            turned the time series into segments. Then, CNN was used to classify each segment. The
                                            model generated good results [26].

                                            4.1.2. RNN
                                                Five articles that used RNN technology for stock and Forex prediction are briefly described
                                            below. Table 3 shows the author, variables, dataset, and model of the papers mentioned.

                        Table 3. Information on the papers which used the Recurrent Neural Network (RNN) model.

  Reference No.                  Author                       Dataset                                 Variables                                Model
                                                        EURUSD, AUDUSD,
                                                    XAUUSD, GBPJPY, EURJPY,         Open price, close price,
       [27]                      Ni, L.             GBPUSD, USDCHF, USDJPY,                                                                   C-RNN
                                                                                    highest price, and lowest price
                                                           and USDCAD
                                                    China Security Index: CSI300,   Open price, high price, low price, close price,
       [28]                       Li, C.                                                                                              Multi-task RNN with MRFs
                                                        CSI200, and CSI500          volume, and amount.
                                                                                    1. Technical features: open price, high price,
                                                                                    low price, close price, volume, price change,
                                                               HS300                price limit, volume change, volume limit,                RNN-Boost
       [29]                     Chen, W
                                                                                    amplitude, and difference.
                                                                                    2. Content features: sentiment features and
                                                                                    LDA features
                                                      Sandstorm sector of the       Open price, close price, highest price, lowest
       [30]                     Zhang, R.                                                                                                 C-RNN (DWNN)
                                                     Shanghai Stock Exchange        price, and the daily trading volume
                                                                                    Momentum indicators: average directional
                                                                                    movement index, absolute price oscillator,
                                                                                    Aroon oscillator, balance of power, commodity
                                                                                    channel index, Chande momentum oscillator,
                                                                                    percentage price oscillator, moving average            Attention-based
       [31]             Zeng, Z. and Khushi            USDJPY exchange rate
                                                                                    convergence divergence, Williams,                       RNN-ARIMA
                                                                                    momentum, relative strength index, stochastic
                                                                                    oscillator, and triple exponential average
                                                                                    Volatility indicators: average true range,
                                                                                    normalized average true range, and true range
Appl. Syst. Innov. 2021, 4, 9                                                                                                                                9 of 30

                                                    Ni, L. proposed a CRNN model to predict the price of 9 kinds of Forex pairs. The
                                              results showed that the proposed model performed much better than the LSTM model and
                                              the CNN model [27].
                                                    Li, C. proposed a multi-task RNN model with Markov Random Fields (MRF). The
                                              multi-multilayer perceptron (MMLP) was proposed to automatically extract diversified
                                              and complementary features from individual stock price sequences, which means that
                                              there is no need for the technical indicators. Features learned by MMPL were passed to a
                                              binary MRF with a weighted lower linear envelope energy function to utilize intra-clique
                                              higher-order consistency between stocks [28].
                                                    Chen, W. proposed an RNN-Boost model that made use of the technical indicators and
                                              sentiment features, and Latent Dirichlet allocation (LDA) features to predict the price of stocks.
                                              Its results showed that the proposed model outperformed the single-RNN model [29].
                                                    Zhang, R. proposed a Deep and Wide Neural Networks (DWNN) model, where
                                              CNN’s convolution layer was added to the RNN’s hidden state transfer process. The
                                              results showed that the DWNN model could reduce the prediction mean squared error by
                                              30% compared to the general RNN model [30].
                                                    Zeng. Z proposed a novel Attention-based RNN (ARNN), where wavelet denoised in-
                                              put was passed to ARNN. The forecast was calculated using the Autoregressive integrated
                                              moving average (ARIMA) and the output of the ARNN model [31].

                                              4.1.3. LSTM
                                                   Twenty-seven articles that used LSTM technology for stock and Forex prediction are
                                              briefly described below. Table 4 shows the author, variables, dataset, and model of the
                                              papers mentioned.

                       Table 4. Information on the papers which used the Long Short-Term Memory (LSTM) model.

  Reference No.                   Author                              Dataset                                 Variables                          Model
       [32]                      Nikou, M.              iShares MSCI United Kingdom             Close price                                      LSTM
                                                                                                Open price, high price, low price,
                                                                                                close price, adjusted close price,
       [33]                      Fazeli, A.             S&P 500                                                                                  LSTM
                                                                                                volume, volatility, Williams %R,
                                                                                                and RSI
                                                        Microsoft (MSFT), PO logistics
                                                        (XPO), and AMD Daily stock price        Open price, high price, low price,
       [34]                        Xu, Y.               data are collected from Yahoo           close price, AD, ADX, EMA, KAMA,          Attention-based LSTM
                                                        Finance from 11 industries              MA, MACD, RSI, SAR, AMA, etc.
                                                        Finance tweets from a social media      and finance tweet sentiment
                                                        company StockTwits
                                                                                                Close price, moving average, crude
       [35]            Lakshminarayanan, S.K.           Dow Jones Industrial Average (DJIA)                                                      LSTM
                                                                                                oil price, and gold price
       [36]                      Rana, M.               Spanish stock company Acciona           Close price                                      LSTM
                                                        CIPLA stock, ITC stock,
       [37]                      Naik, N.               TCS stock, ONGC stock, and              Close price                                 RNN with LSTM
                                                        Nifty index
                                                        NASDAQ stock market: GE, AAPL,          Trade volume, open, close, high, low,
       [38]                Nguyen, D.H.D.                                                                                                    Dynamic LSTM
                                                        SNP, and FB                             and adjusted close prices
                                                                                                KD, OBV, MACD, RSI, and the
                                                        Foxconn, Quanta, and Formosa            average of the previous five days’
       [39]                       Lai, C.Y.             Taiwan Cement and Taiwan                                                                 LSTM
                                                                                                stock market information (open,
                                                        Semiconductor
                                                                                                high, low, and volume, and close)
                                                                                                Open price, close price,
       [40]                 Hossain, M.A.               S&P500                                                                              LSTM with GRU
                                                                                                volume
                                                                                                                                         LSTM with prevention
       [41]                       Baek, Y.              KOSPI200 and S&P500                     Close price
                                                                                                                                        module, prediction module
       [42]                      Kim, H.Y.              KOSPI 200                               Close price                                   GEW-LSTM
                                   Li, H.               CSI-300                                 Open price                                  Attention-based
       [43]
                                                                                                                                           Multi-Input LSTM
                                                                                                Open price, close price, low price,
                                                        Data from Taiwan Stock Exchange
       [44]                     Cheng, L.-C.                                                    high price, volume, KD, MA,               Attention-based LSTM
                                                        Corporation (not given specific data)
                                                                                                RSV, etc.
                                                        Tech Mahindra (NSE: TECHM)                                                               LSTM
       [45]                      Shah, D.                                                       Close price
                                                        BSESensex
                                                                                                Trade volume, transaction, open
                                                        Taiwan Stock Exchange                   price, highest price, lowest price,
       [46]                      Lin, B.-S.                                                                                                      LSTM
                                                        Corporation (TWSE)                      close price, KD, RSI, and Bollinger
                                                                                                Bands (BBands)
                                                        Facebook Inc. (FB), Apple Inc.
                                                        (AAPL), Amazon.com Inc (AMZN),
       [47]                      Skehin, T.             Netflix Inc.                            Close price                              ARIMA-LSTM-Wavelet
                                                        (NFLX), and Alphabet Inc. (GOOG)
                                                        in NASDAQ of S&P 500
Appl. Syst. Innov. 2021, 4, 9                                                                                                                               10 of 30

                                                                             Table 4. Cont.

  Reference No.                    Author                              Dataset                              Variables                            Model
                                                                                              The open price, close price, highest
       [48]                      Zhang, X.             China’s A-share market                 price, lowest price, and trading               RNN with LSTM
                                                                                              volume and 11 indicators
                                                       Facebook
       [49]                      Achkar, R.            stocks, Google stocks, and Bitcoin     Close price                                    RNN with LSTM
                                                       stocks collected from Yahoo finance
       [50]                       Zeng, Y.             SSE50 index                            N/A                                                LSTM
       [51]                       Shao, X.             Ping An Bank                           Close price                                     Kmeans-LSTM
                                                       SSE Composite Index, SSE 50, CSI
       [52]                       Zhao, Z.             500, CSI 300, and SZSE                 Close price                                  Time-weighted LSTM
                                                       Composite Index
                                                                                              Open price, close price, high price,
                                                       IBovespa index from the BM&F           low price, and volume exponentially
       [53]                     Nelson, D.M.                                                                                                      LSTM
                                                       Bovespa stock exchange                 weighted moving averages, etc. (175
                                                                                              indicators in total)
                                                                                              1. Financial domain news text
                                                       1. Standard&Poor’s 500 index                                                           NLP + LSTM
       [54]              dos Santos Pinheiro                                                  (headlines instead of the full content)
                                                       2. Reuters and Bloomberg
                                                                                              2. Close price
                                                                                              A stock identifier, a list of expert
                                                       Expert recommendation from
       [55]                 Buczkowski, P.                                                    recommendations of varying length,             LSTM with GRU
                                                       TipRanks company
                                                                                              and optional target labels (class)
                                                       Morning edition of the Nikkei          1. Paragraph Vector
        [4]                       Akita, R.            newspaper                              2. Open, close, highest, and                        LSTM
                                                       Nikkei 225                             lowest price
                                                       China stock market in Shanghai and
       [56]                       Chen, K.                                                    Volume, high, low, open, close price                LSTM
                                                       Shenzhen from Yahoo finance
       [57]              Qi, Ling and Khushi           Forex Exchange rate                    Technical indicators:                               LSTM
                                                                                              stock data, stock news, capital stock
       [58]                Pang, Xiong Wen             Chinese stock                          and shareholders, and financial            DeepLSTM with encoder
                                                                                              analysis
       [59]                Feng, Fuli, et al.          NASDAQ and NYSE                        Stock data                                LSTM with ranking relation
                         Chung, Hyejung, and                                                  Open, high, low, closing, volume,
       [60]                                            Korea Stock Price Index                                                               LSTM with GA
                          Kyung-shik Shin.                                                    and technical indicators
       [61]                Li, Jiahong, et al.         Chinese Stock Market                   Closing price and sentiment data            LSTM with Naïve Bayes
                                                       S&P 500 Index, Shanghai Composite
                                                       Index, IBM from NYSE, MSFT from        Open, high, low, closing, volume,           LSTM with Generative
       [10]               Zhang, Kang, et al.
                                                       NASDAQ, and PingAn Insurance           and technical indicators                  Adversarial Network (GAN)
                                                       Company of China (PAICC)
                                                                                                                                           LSTM with sentiment
       [62]               Jin, Zhigang, et al.         Apple stock price                      Sentiment and stock price data
                                                                                                                                              analysis model
                                                                                              Market information including
       [63]               Long, Jiawei, et al.         Chinese Stock market                                                                  LSTM with CNN
                                                                                              transaction records
       [64]                  Chen, MY.                 Chinese stock market                   Sentiment information                             LSTM
       [65]                Qian, F. Chen, X            Chinese stock market                   Closing price                                LSTM with ARIMA
                                                                                              Closing price and technical                  LSTM with Wavelet
       [66]                     Li, Z. Tam, V.         Asian stock indexes
                                                                                              indicators                                      Denoising

                                                    Nikou, M. proposed an LSTM model and compared it with the ANN model, Support
                                              Vector Regression (SVR) model, and RF model. The results showed that the LSTM model
                                              performed better in the prediction of the closing prices of iShares MSCI United Kingdom
                                              than the other models mentioned in paper [32].
                                                    Fazeli, A. proposed an LSTM model; his result showed an improvement using
                                              LeakyReLU. The Mean square error (MSE) was below 0.1, whilst compared with the
                                              ReLU function, the MSE was well above 0.2. He examined the effect of the Relative
                                              Strength Index (RSI), Williams %R, and volatility on the loss of the model. It was shown
                                              that the model’s loss was reduced by using only RSI, which contributed to the performance
                                              of the model [33].
                                                    Xu, Y. proposed an attention-based LSTM model that performs better than the regular
                                              LSTM. It was found that finance tweets that were posted from market closure to market
                                              open the next day had more predictive power on the next day’s stock movement. The
                                              weighted sentiment on the max follower on StockTwits also performed much better than
                                              other methods [34].
                                                    Lakshminarayanan, S.K. proposed an LSTM model combined with crude oil price,
                                              gold price, and moving average, which performed much better than the LSTM model
                                              without them and the SVM model. It showed that the crude oil and gold prices had some
                                              impact on stock price prediction [35].
                                                    Rana, M. proposed an LSTM model that outperformed the LR and SVR models. He
                                              also compared the different activation functions with different optimizers and concluded
                                              that the tanh activation with the Adam algorithm performs best with an accuracy of
                                              98.49% [36].
Appl. Syst. Innov. 2021, 4, 9                                                                                         11 of 30

                                      Naik, N. proposed an RNN with the LSTM model. The model had the ability to keep
                                the memory of historical stock returns in order to forecast future stock return output. It
                                was worth noting that recent stock information rather than old, related stock information
                                was stored and used. The network also outperformed the Feed Forward ANN model [37].
                                      Lai, C.Y. proposed a dynamic LSTM model. The results showed that stock prediction
                                accuracy based on Mean absolute error (MAE), Mean absolute percentage error (MAPE),
                                Root Mean Square Error (RMSE), and Mean square error (MSE) obtained by the dynamic
                                LSTM model were much better than that by the static LSTM model. The dynamic model
                                also consistently outperformed the linear models SA-5 and EMA-0.5 when predicting four
                                stocks [38].
                                      Lai, C.Y. proposed an LSTM model which used the average of the previous five days’
                                stock market information (open, high, low, volume, and close) as the input value. The
                                initial prediction was calculated using this value. The prediction was then used as part
                                of the average of the stock price information for the next five days through the ARIMA
                                method. Moreover, he utilized technical analysis indicators to consider whether to buy
                                stocks, or to continue to hold stocks or to sell stocks [39].
                                      Hossain, M.A. proposed an LSTM model followed by Gated recurrent unit (GRU). Both
                                LSTM and GRU were powerful recurrent networks that could perform better and faster in
                                terms of accuracy in regression-based prediction. The proposed model outperformed the
                                LSTM only, GRU only, and GRU followed by LSTM models [40].
                                      Baek, Y. proposed a novel data augmentation approach for stock market index forecast-
                                ing through the ModAugNet framework, which consisted of two modules: an overfitting
                                prevention LSTM module and a prediction LSTM module. The overfitting problems were
                                mainly caused by the limited availability of data points for training [41].
                                      Kim, H.Y. proposed some LSTM models to forecast stock price volatility that combined
                                the LSTM model with various generalized autoregressive conditional heteroscedasticity
                                (GARCH)-type models. He found that the Geneva Emotion Wheel (GEW)-LSTM model,
                                which combined all three models, GARCH, exponential generalized autoregressive condi-
                                tional heteroscedasticity (EGARCH), and exponential weighted moving average (EWMA),
                                with LSTM, performed best [42].
                                      Li, H. proposed an improved MI-LSTM based on LSTM and attention mechanism,
                                which achieved better performance in extracting potential information and filtering noise.
                                The model could assign different weights to different input series to keep the dominant
                                status of the mainstream while absorbing information from leaky input gates [43].
                                      Cheng, L.-C. proposed an attention-based LSTM model that could solve the problem
                                of exploding and vanishing gradients and thus did not effectively capture long-term
                                dependencies [44].
                                      Shah, D. proposed an LSTM model which was compared with the DNN model. The
                                proposed model was able to predict volatile movements in the true data. In general, it was
                                able to recognize the directionality of the changes in the true data more accurately than the
                                DNN [45].
                                      Lin, B.-S. proposed an LSTM model to predict the price of the top 10 industries
                                included in Taiwan Stock Exchange Corporation (TWSE). In the experimental results, most
                                of the results were reasonable except for the Midland Holdings Limited (MTK) stock [46].
                                      Skehin, T. proposed a linear Autoregressive Integrated Moving Average (ARIMA)
                                model and LSTM network for each series to produce next-day predictions. Wavelet meth-
                                ods decomposed a series into approximation and detail components to better explain
                                behavior over time. He combined these techniques in a novel ensemble model in an
                                attempt to increase forecast accuracy [47].
                                      Zhang, X. proposed a simple but efficient method to predict future stock return
                                ranking without handcrafted features [48].
                                      Achkar, R. proposed an approach to predict stock market ratios using artificial neural
                                networks. It considered two different techniques—Best performance algorithm (BPA)-
Appl. Syst. Innov. 2021, 4, 9                                                                                          12 of 30

                                Multilayer perceptron (MLP) and LSTM-RNN—their potential, and their limitations. And
                                the LSTM-RNN model outperformed the other one slightly [49].
                                     Zeng, Y. proposed an LSTM model based on the dataset SSE50, and the results showed
                                that the accuracy was above 65% [50].
                                     Shao, X. proposed a Kmeans-LSTM model that used the time window to divide the
                                stock price sequential data into several equal subsequences. The K-means algorithm was
                                used to cluster the stock price subsequences (He did not give the specific result data.) [51].
                                     Zhao, Z. proposed a time-weighted LSTM. Unlike other models which treat data
                                indiscriminately, the proposed model could carefully assign weights to data according to
                                their temporal nearness towards the data that was used for prediction. The results showed
                                that the proposed model outperformed the SVM, RNN, and Random Forest models [52].
                                     Nelson, D.M. proposed an LSTM model which was based on the price history and
                                technical analysis indicators. The results showed that the proposed model was better than
                                the MLP and Random Forest models [53].
                                     Dos Santos Pinheiro proposed a character-based neural language model for an event-
                                based trading model that was combined with NLP and LSTM. The results showed that
                                the proposed model performed better than some model proposed in other papers such as
                                WI-RCNN and SI-RCNN [54].
                                     Buczkowski, P. tackled the problem of stock market predicting feasibility, especially
                                when predictions were based only on a subset of available information, namely financial
                                experts’ recommendations. The analysis was based on data and results from the ISMIS
                                2017 Data Mining Competition [55].
                                     Akita, R. proposed an approach that converted newspaper articles into their dis-
                                tributed representations via Paragraph Vector and modelled the temporal effects of past
                                events on open prices about multiple companies with LSTM [4].
                                     Chen, K. proposed an LSTM model to predict the price of the Chinese stock. The
                                results showed that the accuracy was only 27.2% [56].
                                     Qi, L. proposed an LSTM model to predict the price of the forex exchange rate. The
                                model used technical indicators to calculate events, and then, the LSTM was used to make
                                predictions based on the events [57].
                                     Pang, X.W. proposed two improved deep LSTM models with embedded layers. The
                                results showed its improvement over the benchmark [58].
                                     Feng, F., et al. proposed a novel LSTM model that combined with stock relational
                                model; it had a great performance compared with its benchmarks [59].
                                     Chung, H. and Shin, K.S. proposed an LSTM model which was optimized by the
                                genetic algorithm (GA). The novel hybrid model outperformed the benchmark [60].
                                     Li, J., et al. proposed an LSTM model that was combined with a Naïve Bayne’s model.
                                This hybrid model outperformed the benchmarks and delivered promising results [61].
                                     Zhang, K., et al. proposed a novel generative adversarial network based on MLP and
                                LSTM. The model was able to achieve better results than some of the vanilla models [10].
                                     Jin, Z., et al. proposed to incorporate a sentiment analysis model into LSTM; they
                                successfully created a novel model which deliver a reasonable result [62].
                                     Long, J., et al. proposed a hybrid model which utilized CNN to extract transactional
                                information, and then, it was passed through an LSTM to predict the stock price. The
                                model showed improvements over some of the vanilla benchmarks [63].
                                     Chen, M. proposed an LSTM model which used the sentiment data collected. It
                                combined both sentimental models as well as LSTM to produce a good result [64].
                                     Qian, F. proposed an LSTM model which used ARIMA to improve its prediction
                                power. The model yielded a reasonable result [65].
                                     Li, Z. and Tam, V. proposed an LSTM model that used the wavelet denoising technique
                                before passing through the LSTM model; the model produced good results [66].
Appl. Syst. Innov. 2021, 4, 9                                                                                                                              13 of 30

                                         4.1.4. DNN
                                              Thirteen articles that used DNN technology for stock and Forex prediction are briefly de-
                                         scribed below. Table 5 shows the author, variables, dataset, and model of the papers mentioned.

                           Table 5. Information on the papers which used the Deep neural network (DNN) model.

  Reference                                              Dataset
                           Author                                                                   Variables                                   Model
  Number
                                                                                  715 novel input features (including moving
     [67]                  Song, Y.                KOSPI and KOSDAQ                                                                             DNN
                                                                                      average and disparity of stock price)
                                                                               SMA, exponential moving average, momentum
                                                          NSE                   indicator, stochastic oscillator, moving average
                                                       ICICI Bank
                                                        SBI Bank               convergence divergence, relative strength index,                 DNN
     [68]                 Naik, N.
                                                       Kotak Bank                            Williams R, accumulation
                                                        Yes Bank                       distribution index, and commodity
                                                                                                   channel index
                                                                                  Stock price, exchange rates, VIX index, gold
     [69]                Chatzis, S.P.          FRED database and the SNL        price, TED spread, oil price, effective federal                DNN
                                                                                    funds rate, and high yield bond returns
                                                                                      25 variables: 1. book-to-market ratio;
                                                                                  2. earnings-to-price ratio; 3. dividend yield;
                                                                               4. sales-to-price ratio; 5. cash flow-to-price ratio;
                                                                                      6. return on equity; 7. return on asset;
                                                                                    8. return on invested capital; 9. accruals;
                                                                                 10. sales-to-total assets ratio; 11. current ratio;
                                                                                     12. equity ratio; 13. total asset growth;
     [70]                  Abe, M.                        MSCI                                                                                  DNN
                                                                               14. investment growth; 15. investment-to-assets
                                                                                   ratio; 16. EPS revision (1 month); 17. EPS
                                                                               revision (3 months); 18. market beta; 19. market
                                                                                value; 20. past stock return (1 month); 21. past
                                                                                     stock return (12 months); 22. volatility;
                                                                                 23. skewness; 24. idiosyncratic volatility; and
                                                                                               25. trading turnover
                                                                                                                                       Deep factor model (DNN)
                                                                               16 variables: 60 VOL, BETA, SKEW, ROE, ROA,             with layer-wise relevance
     [71]               Nakagawa, K.                   TOPIX index              ACCRUALS, LEVERAGE, 12-1MOM, 1MOM,
                                                                               60MOM, PSR, PER, PBR, PCFR, CAP, and ILIQ                   propagation and
                                                                                                                                            multiple factors
     [72]                 Chong, E.                       KOSPI                                  Close price                            DNN with autoencoder
                                                                                36 variables: Open price, high price, low price,
                                                                               close price, MA5, MA10, MA20, BIAS5, BIAS10,
     [73]                 Singh, R.                     NASDAQ                  DIFF, BU, BL, K, D, ROC, TR, MTM6, MTM12,                 (2D2 PCA) + DNN
                                                                               WR%10, WR%5, OSC6, OSC12, RSI6, RSI12, PSY,
                                                                                    and the derivation of their calculation
                                               S&P 500, DJIA, the Nikkei 225
                                                        (N 225), the
                                                                                                                                        DNN with phase-space
                                                Hang Seng index (HSI), the
     [74]       Yu, Pengfei, and Xuesong Yan                                                      Closing price                          reconstruction (PSR)
                                                China Securities index 300
                                                                                                                                              and LSTM
                                                    (CSI 300), and the
                                                      ChiNext index
     [75]          Yong, Bang Xiang, et al.      Singapore stock market                          Intraday prices                                DNN

                                              Song, Y. proposed a DNN model with 715 novel input features configured on the
                                         basis of technical analysis. He also proposed a plunge filtering technique to improve the
                                         accuracy of the training model by collecting similar stocks. It is worth noting that the
                                         proposed model had great profitability [67].
                                              Naik, N. proposed a DNN model that used the Boruta feature selection technique to
                                         solve the problem of technical indicator feature selection and identification of the relevant
                                         technical indicators. The results showed that his model performed much better than the
                                         ANN and SVM models [68].
                                              Chatzis, S.P. proposed a DNN model which used Boosted approaches to predict stock
                                         market crisis episodes. According to his research, it was meaningful to know the stock
                                         market crisis to predict the price, even though his research was not specific to certain
                                         prediction methods [69].
                                              Abe, M. proposed a DNN network, and his results showed that DNNs generally
                                         outperform shallow neural networks and that the best networks also outperformed repre-
                                         sentative machine learning models [70].
                                              Nakagawa, K. proposed a deep factor model and a shallow model with DNN. The
                                         deep factor model outperformed the linear model. This implied that the relationship
                                         between the stock returns in the financial market and the factors is nonlinear rather than
                                         linear. The deep factor model also outperformed other machine learning methods including
Appl. Syst. Innov. 2021, 4, 9                                                                                                              14 of 30

                                            SVR and random forest. The shallow model was superior in accuracy, while the deep model
                                            was more profitable [71].
                                                 Chong, E. proposed DNN networks and examined the effects of three unsupervised
                                            feature extraction methods including principal component analysis, auto-encoder, and the
                                            restricted Boltzmann machine on the network’s overall ability to predict future market
                                            behavior. The empirical results suggested that DNNs could extract additional information
                                            from the residuals of the auto-regressive model and could improve prediction performance;
                                            the same could not be said when the auto-regressive model is applied to the residuals of
                                            the network [72].
                                                 Singh, R. proposed a 2-Directional 2-Dimensional Principal Component Analysis
                                            (2D2 PCA) + DNN, which outperformed the RNN and (2D2 PCA) + RBFNN. The paper
                                            found that the best results were generated from a window size of 20 and a dimension of
                                            10 × 10. The deep learning method for higher dimensions and large window sizes gave a
                                            limited performance [73].
                                                 Yu, P. and Yan, X. proposed a novel DNN model which incorporated LSTM as well as
                                            phase-space recognition. The model had produce promising results [74].
                                                 Yong, B.X., et al. proposed a DNN model with 40 nodes which showed reasonable
                                            results and appeared to be a highly profitable model [75].

                                            4.1.5. Reinforcement Learning
                                                 Eight articles that used reinforcement learning technology for stock and Forex predic-
                                            tion are briefly described below. Table 6 shows the author, variables, dataset, and model of
                                            the papers mentioned.

                                Table 6. Information on the papers which used the reinforcement learning model.

  Reference No.                   Author                       Dataset                         Variables                         Model
        [76]                       Li, Y.                  US stock dataset             Close price and volume                    DQN
                                                                                   A candlestick chart, four moving
                                                                                     average curves (5, 20, 60, and       Reinforcement Learning
        [77]                    Shin, H.-G.                     KOSPI                                                      combined with LSTM
                                                                                   120 days), a bar graph of trading             and CNN
                                                                                         volume, DMI, and SSO
                                                                                   Open price, high price, low price,
                                                         Chinese stock codes:      close price, volume, DEA, MACD
                                                        002415, 600016, 600028,   EXPMA, CDP, TRIX, BBI, ASI, KDJ,        Reinforcement Learning
        [78]                      Jia, W.
                                                            600547, 600999,                      RSI, PSY                 with LSTM-based agent
                                                              and 601988              VR, ADX, CCI, WR, dm up,
                                                                                                dm down
        [79]                    Carapuço, J.                  EUR/USD                 bid/ask prices, and volumes         Reinforcement Learning
                                                                                    Open, low, high, close price, and     Reinforcement Learning
        [80]                     Kang, Q.                   S&P500 index
                                                                                             trading volume                with A3C algorithm
                                                                                  Open, low, high, close price, volume,   Reinforcement Learning
        [81]                      Zhu, Y.                   S&P500 index           MACD, MA6, MA12, RSI6, RSI12,
                                                                                                 and KD                         with ABN
                                                                                                                           Multi-objective deep
        [82]                       Si, W.               Stock-IF, stock-IC, and               Close price                 reinforcement learning
                                                               stock-IF
                                                                                                                                with LSTM
                                                                                    Date, type, stock, volume, price,
        [83]                    Pastore, A.              FTSE100 stock index                                              Reinforcement learning
                                                                                                and total

                                                 Li, Y. proposed three different reinforcement learning methods to predict the price of
                                            stock. The results showed that the best-performing deep reinforcement learning model is
                                            Deep-Q Network (DQN), not Double DQN. This paper also demonstrated Duelling DQN,
                                            which was an improved model based on DQN [76].
                                                 Shin, H.-G. proposed a reinforcement learning model combined with LSTM and CNN.
                                            The model generated various charts from stock trading data and used them as inputs to
                                            the CNN layer. The features extracted through the CNN layer were divided into column
                                            vectors and inputted to the LSTM layer. The reinforcement learning defined the agents’
                                            policy neural network structure, reward, and action and provided buying, selling, and
                                            holding probabilities as final output [77].
Appl. Syst. Innov. 2021, 4, 9                                                                                                                               15 of 30

                                                   Jia, W. proposed a reinforcement learning with an LSTM-based agent that could
                                              automatically sense the dynamics of the stock market and could alleviate the difficulty of
                                              manually designing indicators from massive data. This paper compared a wide range of
                                              different input sets [78].
                                                   Carapuço, J. proposed a reinforcement learning-Q network model; three hidden layers of
                                              ReLU neutrons were trained as Reinforcement Learning (RL) agents through the Q-learning
                                              algorithm under a novel simulated market environment framework. The framework was able
                                              to consistently induce stable learning that generalized to out-of-sample data [79].
                                                   Kang, Q. proposed to apply the state-of-art Asynchronous Advantage Actor-Critic
                                              algorithm (A3C algorithm) to solve the portfolio management problem and designed a
                                              standalone deep reinforcement learning model [80].
                                                   Zhu, Y. proposed an adaptive box-normalization (ABN) stock trading strategy based
                                              on reinforcement learning, which improved the original box theory. In his ABN strategy,
                                              the stock market data was independently normalized inside each oscillation box [81].
                                                   Si, W. proposed a reinforcement learning model which had multi-objective and LSTM
                                              agents. It was found that feature learning could contribute to better performances. The
                                              LSTM network made continuous decisions and could change positions at the right time,
                                              which reduced the transaction cost, and the multi-objective structure made good profits
                                              within the acceptable risk [82].
                                                   Pastore, A. analyzed the data for 46 players extracted from a financial market online
                                              game and tested whether reinforcement learning could capture these players’ behavior
                                              using a riskiness measure based on financial modelling [83].

                                              4.1.6. Other Deep Learning Methods
                                                   Eight articles that used other deep learning technology for stock and Forex prediction
                                              are briefly described below. Table 7 shows the author, variables, dataset, and model of the
                                              papers mentioned.

                                      Table 7. Information on the papers which used other deep learning methods.

   Reference No.                   Author                          Dataset                                 Variables                             Model
                                                                                            Open price, high price, low price, close
        [84]                      Long, W.                         CSI300                                                                        MNFF
                                                                                                       price, and volume
                                                                                            Stock messages as information to form
        [85]                      Wu, J.-L.                        ANUE                    the text feature of each stock news (title,           HAN
                                                                                                   summary, and keywords)
                                                                                            Open price, high price, low price, close
                                                        CATHAY HOLDINGS, Fubon             price, volume, MACD, CCI, ATR, BOLL,
        [86]                     Cho, C.-H.             Financial, CTBC HOLDINGS,          EMA12/20, MA5, MA1MOM6, MOM12,                       Wavenet
                                                             ESFH, and FFHC                 ROC, RSI, WVAD, exchange rate, and
                                                                                                          interest rate
                                                                                            Open price, high price, low price, close            Document
                                                             S&P 500, VN-index,                                                          preprocessing–document
                                                               and cophieu68;                 price, volume, stochastic oscillator,
        [87]                     Minh, D.L.                                                                                                 labeling–Stock2Vec
                                                             Bloomberg, Reuters                      William (%R), and RSI
                                                                                                     Processed news article                 embedding–BGRU
                                                       Financial Times Stock; Exchange      Candlestick charts (images rather than            Convolutional
        [88]                       Hu, G.
                                                              100 Index (FTSE 100)                      annotation data)                   AutoEncoder (CAE)
                                                        Chinese stock price; News (not             1. Close price and volume
        [89]                        Hu, Z.                                                                                                   HAN with SPL
                                                               given specific data)                2. News corpus sequence
                                                          Nine Dow Jones companies
                                                            representing each sector:
                                                         industrials (MMM), financials
                                                        (JPM), consumer services (PG),
                                                        technology (AAPL), healthcare      Open price, high price, low price, close      2D Relative-Attentional
        [90]              Kim, T. and Khushi
                                                                                                    price, and volume                      Gated Transformer
                                                       (UNH), consumer goods (WMT),
                                                      oil and gas (XOM), basic materials
                                                        (DD), and telecommunications
                                                                (VZ) From Yahoo
                                                                                              Trend indicators: moving average,
                                                                                             exponential moving average, double
                                                                                              exponential moving average, triple
                                                                                               exponential moving average, and
        [91]              Zhang, and Khushi                 Forex exchange rates                        vortex indicators                  Genetic Algorithm
                                                                                           Momentum indicators: relative strength
                                                                                           index, and stochastic oscillatorsVolatility
                                                                                                indicators: Bollinger bands and
                                                                                                      Ichimoku indicators
                                                                                                                                         Hybrid of RNN, LSTM,
        [92]                    Shi, Lei, et al.           Apple Inc. and S&P 500                  News and financial data
                                                                                                                                               and CNN
Appl. Syst. Innov. 2021, 4, 9                                                                                        16 of 30

                                      Long, W. proposed a novel end-to-end model named multi-filters neural network
                                (MFNN) specifically for feature extraction on financial time-series samples and price
                                movement prediction task. Both convolutional and recurrent neurons were integrated to
                                build the multi-filters structure. The results showed that the proposed model is better than
                                the RNN, CNN, and traditional machine learning methods [84].
                                      Wu, J.-L. proposed a keyword-based attention network into Hierarchical Attention
                                Networks (HAN), namely the HKAN model, to learn the relationships between dimen-
                                sional sentiments (trend and trading) and stock messages and outperformed the HAN
                                network [85].
                                      Cho, C.-H. proposed three different models to predict the price of the stock: LSTM,
                                Seq2seq, and Wavenet. According to his experiments, Wavenet outperformed the other
                                two models [86].
                                      Minh, D.L. proposed a network to predict the directions of stock prices by using both
                                financial news and sentiment dictionary. His results showed that Two-stram gated recurrent
                                unit (TGRU) achieved better performance than GRU and LSTM and that Stock2Vec is more
                                efficient in dealing with financial datasets [87].
                                      Hu, G. proposed a Convolutional AutoEncoder model to learn a stock representation
                                and converted a 4-channel stock time series (lowest, highest, open, and close price for
                                the day) to candlestick charts by using the synthesis technique to present price history as
                                images. This method successfully avoided expensive annotation. The proposed model
                                outperformed the FTSE 100 index and many well-known funds in terms of total return [88].
                                      Hu, Z. proposed a Hybrid Attention Networks (HAN) to predict the stock trend based
                                on the sequence of recent related news. Moreover, he applied the self-paced learning
                                (SPL) mechanism to achieve effective and efficient learning. The results showed that the
                                proposed model outperformed RNN, Temporal-Attention-RNN, News-Attention-RNN,
                                and HAN [89].
                                      Kim, T. proposed a 2D relative-attentional gated transformer which was used to opti-
                                mize portfolio return. It used general reinforcement learning with the agent incorporating
                                2D relative-attentional gated transformer [90].
                                      Zhang, Z. proposed a genetic algorithm using a crossover of technique indicators as
                                input. It successfully outperformed some of the traditional trading strategies [91].
                                      Shi, L., et al. proposed a system that performed factor analysis and then utilized
                                multiple deep learning methods to design a model which outperformed the benchmark [92].

                                4.2. Papers Results Grouped by the Method Used
                                4.2.1. CNN
                                     Since the performance metrics used in different articles were different, our survey
                                analyzed them based on various metrics. The results used the average performance of the
                                best performing models in the mentioned papers. Table 8 shows the metrics and results for
                                the papers which used the CNN model.

                                4.2.2. RNN
                                     Since the performance metrics used in different articles were different, our survey
                                analyzed them based on different metrics. The results used the average performance of the
                                best performing models in the mentioned papers. Table 9 shows the metrics and results for
                                the papers which used the RNN model.

                                4.2.3. LSTM
                                     Since the performance metrics used were different in different articles, our survey
                                analyzed them based on different metrics. The results used the average performance of the
                                best performing models in the mentioned papers. Table 10 shows the metrics and results
                                for the papers which used the LSTM model.
Appl. Syst. Innov. 2021, 4, 9                                                                                                         17 of 30

                                 Table 8. The metrics and results for the papers which used the CNN model.

      Performance               Reference No.        Corresponding         Performance             Reference No.        Corresponding
        Metrics                                          Value               Metrics                                        Value
                                     [11]            0.043 +/− 0.007          MAPE                     [12]                    5
          RMSE                       [12]                   11                                                          [14] 2D:0.1422,
                                     [24]            0.395185 × 10⁻³        Sharpe ratio               [14]               3D:0.1413
          MAE                        [12]                   6
                                   [24,31]           0.240977 × 10⁻³                                   [18]               [18] 0.611
        Accuracy                                          71%                  CEQ                                       2D:0.0006681
                                   [10,13]                                                             [14]              3D:0.000664
                                    [16]                  60.02%
                                    [19]                  55.44%                                       [14]             [14] (2D:1.2312
                                    [22]                  71.72%                                                          3D:1.2604)
                                    [23]                  65.08%                                       [16]              [16] (1.3107)
                                     [3]                  75.2%
                                                                            Return rate
                                    [25]                  57.88%
                                    [26]                 74.753%
                                    [20]                  95.02%
    Error Percentage                [14]                2D:0.4944                                       [18]              [18] (1.2156)
                                                        3D:0.4931                                       [21]               [21] (1.309)
                                    [18]                  0.6227          Mean Test Score               [15]              0.000281317
       F-measure                                                                                        [22]                 0.2631
                                    [19]                 0.7133                MSE                                       0.156 × 10⁻⁶
                                                                                                      [24,31]
                                     [3]                  0.73                  AE                      [11]            0.029 +/−0.005
                                    [26]                 0.6367

                                       Table 9. The metrics and results for the papers which used the RNN model.

                                                Performance Metrics                  Reference No.              Corresponding Value
                                                                                            [27]                     512–530
                                                        RMSE                                [29]                       0.0205
                                                                                            [31]                      0.00165
                                                                                            [29]                       0.2431
                                                       MAPE
                                                                                            [31]                       0.232
                                                        MAE                                 [29]                       0.0132
                                                                                            [28]                      68.95%
                                                      Accuracy
                                                                                            [29]                      66.54%
                                                     F-measure                              [28]                      0.7658
                                                       Recall                               [28]                       0.7471
                                                      Precision                             [28]                      0.7855
                                                        MSE                                 [30]                     0.057443

                                Table 10. The metrics and results for the papers which used the LSTM model.

      Performance               Reference No.        Corresponding         Performance             Reference No.        Corresponding
        Metrics                                          Value               Metrics                                        Value
                                    [32]                0.306543                                       [35]                  1.03
                                    [35]                 347.46                                        [38]                 1.6905
                                    [36]                 0.0151               MAPE                     [40]                  4.13
                                                          25.90                                        [41]                 1.0077
                                    [37]                                                                                     0.119
                                                                                                       [57]
                                                                                                       [60]                  0.91
          RMSE                                                                                         [10]                  1.37
                                                                                                       [62]                  1.65
                                                                                                       [66]                 0.6346
                                     [38]                  0.0242            Precision                 [53]                  0.553
                                     [39]                    1.3              Recall                   [53]                  0.129
                                     [45]                   9.72            Return rate                [33]                 1.0667
                                     [46]             4.24 (Average)                                   [32]                0.093969
                                   [47][57]             1–100.0015                                     [33]              0.004845492
                                     [65]                 0.02295
                                                                                                       [59]                0.000379
                                    [32]                 0.21035                                       [35]                120731.4
                                    [35]                  262.42               MSE                     [38]                 19.7096
                                    [37]                  0.1895                                       [39]                  0.019
          MAE                       [38]                  0.0169                                       [40]                 0.00098
                                    [40]                  0.023                                        [41]                   7.56
                                    [42]                 0.01069                                       [42]                 0.00149
                                    [41]                  1.975                                        [43]                  1.012
You can also read