Private Equity in a Broader Portfolio Context - Institutional Money
←
→
Page content transcription
If your browser does not render page correctly, please read the page content below
Private Equity in a Broader
Portfolio Context

Antti Ilmanen
AQR Capital Management

September 11, 2018

 Disclosure: I have limited direct knowledge on PE but I am an avid
 reader and I have had many discussions with investors and
 academics about the subject. I could thank several of these besides
 my colleagues, but instead I highlight my debt to the surveys written
 for Norway’s GPFG – Doskeland-Strömberg (2018) and McKinsey
 (2017). And I am not alone: these educational surveys are a major
 public service from Norway and their authors to global investors.
Disclosures

The information set forth herein has been obtained or derived from sources believed by AQR Capital Management, LLC (“AQR”) to be reliable. However, AQR does not make any
representation or warranty, express or implied, as to the information’s accuracy or completeness, nor does AQR recommend that the attached information serve as the basis of any
investment decision. This document has been provided to you solely for information purposes and does not constitute an offer or solicitation of an offer, or any advice or recommendation,
to purchase any securities or other financial instruments, and may not be construed as such. This document is intended exclusively for the use of the person to whom it has been delivered
by AQR and it is not to be reproduced or redistributed to any other person. Please refer to the Appendix for more information on risks and fees. For one-on-one presentation use only. Past
performance is not a guarantee of future performance.
This presentation is not research and should not be treated as research. This presentation does not represent valuation judgments with respect to any financial instrument, issuer, security
or sector that may be described or referenced herein and does not represent a formal or official view of AQR.
The views expressed reflect the current views as of the date hereof and neither the speaker nor AQR undertakes to advise you of any changes in the views expressed herein. It should not
be assumed that the speaker or AQR will make investment recommendations in the future that are consistent with the views expressed herein, or use any or all of the techniques or
methods of analysis described herein in managing client accounts. AQR and its affiliates may have positions (long or short) or engage in securities transactions that are not consistent with
the information and views expressed in this presentation.
The information contained herein is only as current as of the date indicated, and may be superseded by subsequent market events or for other reasons. Charts and graphs provided herein
are for illustrative purposes only. The information in this presentation has been developed internally and/or obtained from sources believed to be reliable; however, neither AQR nor the
speaker guarantees the accuracy, adequacy or completeness of such information. Nothing contained herein constitutes investment, legal, tax or other advice nor is it to be relied on in
making an investment or other decision.
There can be no assurance that an investment strategy will be successful. Historic market trends are not reliable indicators of actual future market behavior or future performance of any
particular investment which may differ materially, and should not be relied upon as such. Target allocations contained herein are subject to change. There is no assurance that the target
allocations will be achieved, and actual allocations may be significantly different than that shown here. This presentation should not be viewed as a current or past recommendation or a
solicitation of an offer to buy or sell any securities or to adopt any investment strategy.
The information in this presentation may contain projections or other forward‐looking statements regarding future events, targets, forecasts or expectations regarding the strategies
described herein, and is only current as of the date indicated. There is no assurance that such events or targets will be achieved, and may be significantly different from that shown here.
The information in this presentation, including statements concerning financial market trends, is based on current market conditions, which will fluctuate and may be superseded by
subsequent market events or for other reasons. Performance of all cited indices is calculated on a total return basis with dividends reinvested.
The investment strategy and themes discussed herein may be unsuitable for investors depending on their specific investment objectives and financial situation. Please note that changes in
the rate of exchange of a currency may affect the value, price or income of an investment adversely.
Neither AQR nor the speaker assumes any duty to, nor undertakes to update forward looking statements. No representation or warranty, express or implied, is made or given by or on
behalf of AQR, the speaker or any other person as to the accuracy and completeness or fairness of the information contained in this presentation, and no responsibility or liability is
accepted for any such information. By accepting this presentation in its entirety, the recipient acknowledges its understanding and acceptance of the foregoing statement.

 2

Assets Under Management

 Total Assets
 Alternative Investment Assets $226 Billion* Traditional Strategies
 $116 Billion* $110 Billion*

 Multi-Strategy
 Fixed Income
 Total Return Other Total Return $2.1
 $4.9 $2.0
Equity-Related
 Total Return
 $7.7 Alternative:
 Total Return Global
 Large Cap
 $43.8 Equity
 $19.4

 Multi-Strategy Traditional Equity Style Tilts
 Risk Parity Absolute Return $36.5 International
 $45.9 $110.3 Large Cap Equity
 $29.2
 $16.6
 Alternative:
 Absolute Return Emerging
 Managed
 $71.8 Large Cap
 Other U.S. Equity
 Futures Large Cap $15.9
Absolute
 $15.4 Equity
 Return Relaxed
 $4.4 $11.3
 Constraint
 Global Asset Equity
 Allocation Equity Market Neutral $3.1
 Small and Mid Cap
 $1.8 $4.3 Equity
 $5.4

 *Approximate as of 6/30/2018, includes assets managed by AQR and its advisory affiliates. 3
Outline Private equity (“PE”) in a broader portfolio context Overview and caveats • Describe PE market size … and our focus on only buyouts Does private equity have an expected return edge over public equity? • Arguments and evidence for PE industry’s positive edge • How to aim to outperform the industry average • The counterarguments: fees; future past; debatable public benchmarks; limited diversification Understanding PE and its role in a total portfolio • Quest for common language for public and private • Do investors overpay for the smoothing service? Appendices As noted, this presentation owes a debt to extensive research on PE funds. Important overviews include Doskeland-Strömberg (2018), Kaplan-Strömberg (2009), Kaplan-Sensoy (2015). For critical views, see Phalippou (2011) and Appelbaum-Batt (2016b). 4
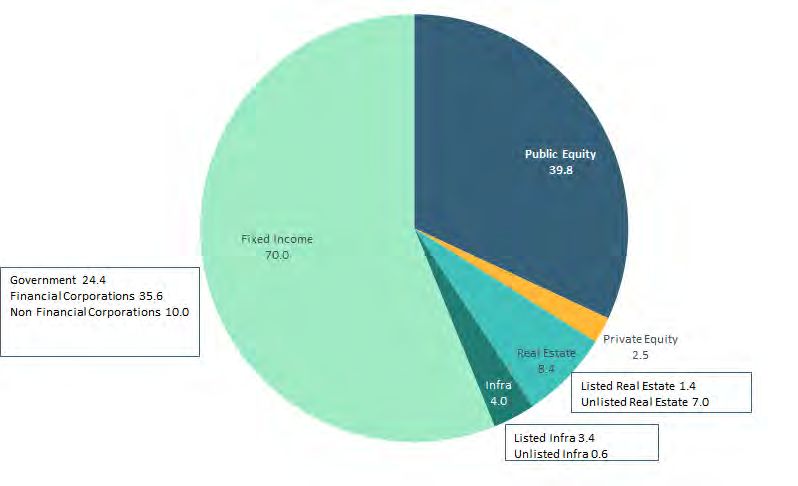
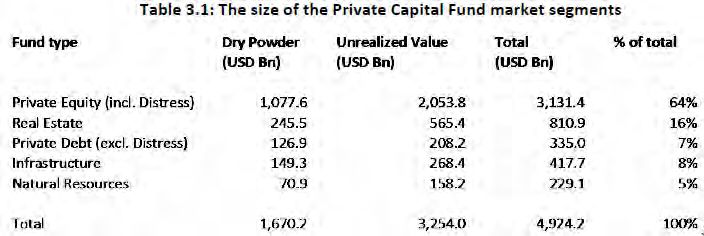
Private Equity Market Size
Up to $2-3 trillion and growing

PE is the majority of investable private capital fund
markets (total ~$5trn)

‘PE’ can mean a broad group of PE activities (~$3trn incl.
1/3 dry powder***) or just buyouts (~$2trn)

I will focus on (U.S.) buyouts, the largest and best-
performing segment of PE*

Note: buyouts do not include just public-to-private deals;
actually private-to-private deals have been more common

 PE Market Segments**
 Buyout 61%
 Venture Capital 19%
 Growth 13%
 Distress 5%
 Balanced 2%

 Source: Doskeland-Strömberg (2018). Estimates as of June 2017.
 Source: AQR, Preqin and Doskeland-Strömberg (2018). Estimates as of June 2017.
 *Best performance per Preqin fundraising data 2012-17
 **Market segment estimates by D-S are based on Preqin data on funds raised 2012-17.
 *** “Dry powder” is undrawn capital commitments, or committed uncalled capital, from LPs (investors) to GPs (fund managers). Note that the estimates in D-S Table 3.1 exclude co-
 investments and direct investments. D-S assess PE co-investments at 310bn and LPs’ direct investments at 182bn, small but growing shares in the total PE market. D-S find that as of
 November 2017 investments into U.S. account for about half of PE capital in recent years, while Europe and Asia account for almost a quarter each. Past performance is not a guarantee of 5
 future performance. Please read important disclosures in the Appendix.
Expected Return of Private Equity
Low Expected Returns Anchor All Long-Only Assets
Prospective real returns are low … even if market yields are not available

Expected Real Yield of U.S. Stocks, Bonds and the 60/40 Portfolio *Some marketing promises of continued high
January 1900–December 2017 double-digit returns seem to suggest that PE is
 immune to the falling expected returns…
20%
 18% ??
 18.0%
15%

10%

 5%
 3.3%
 0% 0.2%

 -5%
 1900 1910 1920 1930 1940 1950 1960 1970 1980 1990 2000 2010
 U.S. Equity Real Return U.S. Treasury Real Return Private Equity Expected Return
14%
12%
10%
 8%
 6% 5.0%
 4%
 2% 2.1%
 0%
 1900 1910 1920 1930 1940 1950 1960 1970 1980 1990 2000 2010
 US 60/40 Real Yield Long-term Average
 *Expected PE return of 18% is illustrative and not representative of AQR’s expectations for PE market, see for example: https://www.economist.com/news/finance-and-
 economics/21706506-buy-out-firms-are-seeking-out-longer-term-investments-omaha-play.
 Source: AQR, Bloomberg, Robert Shiller’s Data Library, Ibbotson Associates (Morningstar), Kozicki-Tinsley (2006), Federal Reserve Bank of Philadelphia, Blue Chip Economic
 Indicators, Consensus Economics. U.S. 60/40 is 60% U.S. stocks represented by the Standard&Poor’s 500 Index and 40% long-dated Treasuries represented by 10-year Treasuries.
 The equity yield is a 50/50 mix of two measures: 50% Shiller E/P * 1.075 and 50% Dividend/Price + 1.5%. U.S. bond yield is 10-year real Treasury Yield over 10-year inflation forecast.
 Scalars are used to account for long term real Earnings Per Share (EPS) Growth. Chart is for illustrative purposes only. Please read important disclosures in the Appendix. There is no 7
 guarantee, express or implied, that long-term return targets will be achieved. Realized returns may come in higher or lower than expected.

Summary of Positive and Negative Arguments on Private Equity
 Weighing the pros and cons of PE over public equity
 Pros Cons

• Theoretical reasons for return enhancement • High fees offset: Testing the limits of ‘the Asness law’
• Empirical evidence of outperformance over 30yrs • Past 10+ years may be a foretaste of a weaker future
• Easier way to take risk – optical diversifier • Is S&P500 the right benchmark to PE?
• PE industry performance is just a base to build on* • Overoptimism and/or Overpaying

 Net verdict: ?
 …but for many, one chart will suffice:

 Source: Cambridge Associates, Bloomberg. Past performance is not a guarantee of future
 performance. Please read important disclosures in the Appendix.

 Source: AQR, Cambridge Associates (IRR-based PE “returns” for U.S. Buyout), scales figure from Jessica Broome Research. Past performance is not a guarantee of future
 performance. Please read important disclosures in the Appendix.
 * This is a common aspiration or even expectation, even though we believe most PE investors should anchor their expectations near the industry mean. Our empirics focus on the 8
 industry mean.
Pro 1: Theoretical Reasons for a Return Edge
Growing the pie?

Here I liberally borrow from the excellent Doskeland-Strömberg 2018 survey (DS 2018)

Why should investors require higher returns for PE?

(1) Illiquidity premia, (2) Maybe higher loadings on market and other factors, (3) PE-specific risk

How do PE firms earn above-market returns (and cover their fees)?

• DS 2018 refers to PE model’s edges as an organizational form*

• PE investors strive to “create real value through active ownership and governance of firms in a way that is
 difficult to replicate in a public setting”

• More specifically, Kaplan and Strömberg (2009) emphasize three types of “engineering” that PE investors
 apply to their portfolio companies in order to increase value:

 − Governance engineering (possible because PE investors own a controlling stake)

 − Financial engineering (leverage used to finance the acquisitions; incentive benefits and tax benefits)

 − Operational engineering (industry and operating expertise that PE investors use to add value)

 Source: Doskeland-Stromberg (2018). Please read important disclosures in the Appendix.
 * As outlined by Michael Jensen in 1980s. “Jensen (1989) predicted that the PE model would become a dominant corporate organizational form. He argued that the PE investment model
 combined concentrated ownership stakes in portfolio companies, high-powered incentives for the private equity firm professionals, and a lean, efficient organization with minimal
 overhead costs. The private equity firm then applied performance-based managerial compensation, optimization of the capital structure, and active governance to the companies in which 9
 it invested. According to Jensen, these structures were superior to those of the typical public corporation with dispersed shareholders, low leverage, and weak corporate governance.”
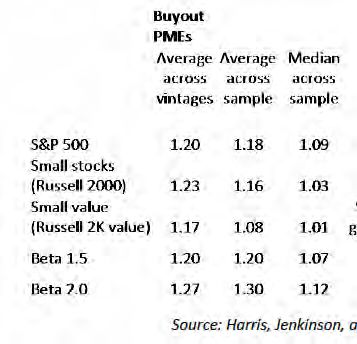
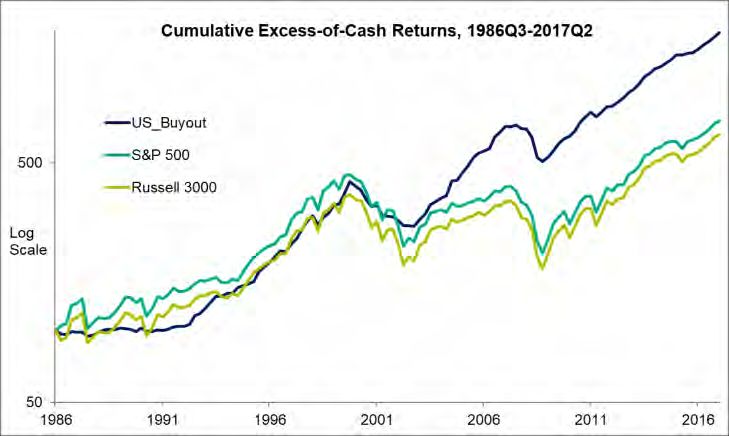
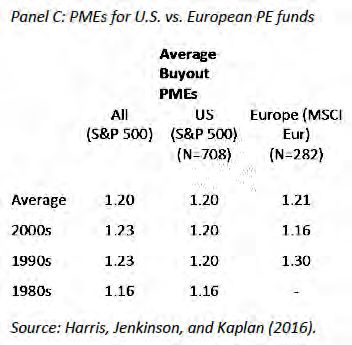
Pro 2: Empirical Evidence of PE Outperformance Over 30 Years
 The PE industry average has clearly outperformed public equities
 Performance of U.S. Private and Public Equity
 1986-2017 (excess-of-cash returns)
 Cambridge Cambridge PE 1.3 x
 Russell Small Value
• Buyout industry average has outpaced public PE (U.S. (US Buyout) S&P 500
 3000
 Russell
 Stocks (FF)
 Buyout) Desmoothed 3000
 equities (S&P500) by 2-3% p.a. over 30 years
 Avg (AM) 9.8% 9.8% 7.8% 7.5% 9.7% 11.4%
 using IRR-based “returns”, net of fees Avg (GM) 9.7% 9.1% 6.7% 6.3% 7.6% 9.3%
 Volatility 9.3% 13.9% 15.8% 16.4% 21.3% 21.6%
• Right columns in the table include some Sharpe 1.05 0.71 0.50 0.46 0.46 0.53
 popular PE proxies beyond S&P500 Eqty Corr. 0.70 0.73 0.98 1.00 1.00 0.83
 Eqty Beta 0.40 0.62 0.95 1.00 1.30 1.09
 AutoCorr1 0.38 -0.06 0.03 0.01 0.01 -0.01
 Source: AQR, Bloomberg, Cambridge Associates (using IRR-based raw index returns and an AR(1)-
 desmoothed variant), Kenneth French Data Library. Risk-free rate for Sharpe calculation is 3M T-bills. Past
 performance is not a guarantee of future performance. Please read important disclosure in the Appendix.

• A better metric, PME or public market Buyout PMEs
 equivalent*, points to 20% higher average net
 return than S&P500 over the fund life
• PME 1.20 converts to 3-4% annual “direct
 alpha” – if use effective fund life of 5-6 years**
• Main gains came from PE fund vintages
 1996-2005
 Source: Harris et al. (2016). Past performance is not a guarantee of future performance. For illustrative
 purposes only. Please read important disclosure in the Appendix.

 Source: AQR, Bloomberg, Cambridge Associates (using IRR-based raw index returns and an AR(1)-desmoothed variant), Kenneth French Data Library (Small Value Stocks).
 * PME is computed as in Kaplan-Schoar (2005): Both capital calls and distributions are discounted using the returns from a public equity benchmark index, such as S&P 500. The PME is then
 calculated as the ratio between the sum of discounted distributions and the sum of discounted calls. The numerator captures the amount of wealth that an investor would have obtained for an
 investment in the PE fund, while the denominator captures the amount of wealth that would have resulted from a mimicking strategy where the investor buys the benchmark index at the same times
 and amounts as the capital calls of the fund. Intuitively, PME above(/below) one implies PE out(/under)performance versus the chosen public-market benchmark. For problems with IRR-based
 returns, see Phalippou (2011).
 ** Most literature converts the PME into an annualized alpha based on an effective average fund life of 5-6 years, half the typical legal life of 10(+) years (logic: the committed cash is on average
 drawn and invested a few years after cash commitments are made, and then returned gradually). Appelbaum-Batt (2016b) question this approach, arguing that if investors commit the cash for the full 10
 legal fund life, the full 10 years should be used in annualization, in which case a PME of 1.20 converts to annualized alpha of 1.8%, instead of 3-4%. Past performance is not a guarantee of future
 performance. Please read important disclosures in the Appendix.
Pro 3: An Easier Way to Take Risk – Optical Diversifier
 Diversifying ability depends crucially on use of smoothed returns

Moderate expected correlation to public equities, and lower volatility, based on PE index ‘returns’…

…but higher from de-smoothed PE returns (or with lagged betas)…and even higher if based on public proxies

Welch (2017) concludes that traditional valuation methods understate the correlation of PE (vs. public equity),
creating an illusion of diversification, while new valuation practices reveal greater correlation
• Growing institutional awareness of this issue: Average correlation assumption has risen from 0.4 in 2000 to 0.8 in 2015*
• Many investors recognize overstated diversification benefits, but still value return smoothing**

Our takeaways:

• It is easier to take risk when mark-to-market (MTM) fluctuations are smoothed, and leverage is embedded

• One of the main potential benefits of PE is that it allows investors to take more equity risk and earn more
 equity premium than if all MTM fluctuations were visible***, and if all leverage was subject to prime broker
 calls
 − This applies to all illiquid private assets, not just PE

 Source: AQR, Welch (2017). Past performance is not a guarantee of future performance. Please read important disclosures in the Appendix. Diversification does not eliminate the risk of
 experiencing investment losses. Welch (2017) available at: https://www.researchgate.net/publication/272304991_Private_Equity's_Diversification_Illusion_Economic_Comovement_and_Fair_Value_Reporting.
 * Exhibit 2 in Welch (2017) tracks the forward-looking correlation assumption between public and private equity across 17 allocation consultants, 6 pensions and 2 endowments.
 The ongoing shift from smooth IRR and appraisal based estimates to more volatile estimates initiated from the LP (end-investor) side and likely reflects many developments, including revised fair
 value standards such as IAS 39; the academic use of PMEs instead of IRRs; literature on other alternatives about the understated volatility and beta estimates due to return smoothing; and end-
 investors’ desire to analyze their total portfolio more consistently in common terms.
 ** Welch quotesYale’s David Swensen: “Not only does lack of day-to-day [MTM] valuation information reduce reported risk [volatility] levels, the private company [also] gains spurious diversifying
 characteristics based solely on lack of co-movement with the more frequently valued public company.” 11
 *** Yet, not all MTM fluctuations are temporary. Smoothing will not help when both public and private equity disappoint over a multi-decade window (cf. Japan post-1990 experience).
Pro 4: PE Industry Performance Is Just a Base to Build On
Many investors expect their PE investments to outperform the average

Many investors aspire to identify in advance and access those famous top-quartile managers

• Optimism may reflect overconfidence, made worse by opacity and slow feedback/learning in PE

• And why not let everyone outperform? … Diverse evaluation metrics allow half of all PE funds to call
 themselves top-quartile!*

Plausible ways to “beat the PE market” for a large investor are highlighted in Doskeland-Strömberg (2018):

• Manager selection: performance persistence and wide dispersion give hope, but they have weakened

• Contrarian timing: PE returns have been lower after hot-vintage years characterized by high fundraising
 activity, high valuations, cheap financing, and high leverage**

• Cost reduction: fee negotiations, secondaries (provide liquidity in bad times), co-investments (hoping to
 avoid adverse selection; literature is mixed), direct investing (but need costly resources)***

 Source: AQR, Doskeland-Strömberg (2018), Kaplan-Strömberg (2009), Axelson et al. (2013), Harris et al. (2014), Robinson-Sensoy (2015), L’Her et al. (2016). Past performance is not a
 guarantee of future performance. Please read important disclosures in the Appendix.
 * Harris-Stücke (2012).
 ** Kaplan-Strömberg (2009), Axelson et al. (2013), Harris et al. (2014), Robinson-Sensoy (2015), L’Her et al. (2016).
 *** Doskeland-Strömberg (2018) estimate that secondary volume, while growing, was still ‘only’ ($)42bn in 2014 (double the 2008 peak). For perspective, the total PE market size including dry
 powder was estimated to be over 3100bn in 2017, on top of which they count 310bn co-investments and almost 200bn direct LP investments. DS pp 103-6 survey tells that research on the
 relative performance of co-investments shows mixed results, while direct investments and co-investments have earned roughly similar net-of-fee returns as PE funds. 12
Con 1: Fees Could Offset PE Industry’s Return Edge
The PE industry is testing the limits of ‘the Asness Law’

“Asness’ Law”: No investment product is so good that there’s not a high enough fee to make it a bad investment

PE fees are famously high and opaque, but institutional investor pressure and new research have slowly
begun to improve transparency

Management fees, performance fees, additional portfolio company fees (partly shared with LPs) are
inherently difficult to translate into total annual fees, also given the different fees for commitment vs.
deployment periods

One recent estimate: almost 6% total annual fees*
 • 2.7% management fees**
 • 1.9% performance fees (carried interest)
 • 1.2% other fees, incl. net portfolio company fees

Historically positive industry performance even net of these high fees tells that there is skill or other premium
in PE – the question is how much is passed on to the end-investors

 Source: McKinsey (2017), Doskeland-Strömberg (2018), and critical views in Appelbaum-Batt (2016a) and Phalippou-Rauch-Umber (2017). For illustrative purposes only. Pease read
 important disclosures in the Appendix.
 * CEM Benchmarking estimate the total annual fee to average 5.7% for a sample of PE funds (including fund investments and fund-of-fund investments), shown in Exhibit 9 of
 McKinsey (2017). Number of observations: partnership expenses: 112 observations, management fees: 167 observations, carried interest: 84 observations and
 internal oversight and selection: 122 observations.
 ** Note that fees are typically based on committed capital for the first six years of the LP-GP agreement, and on NAV for the remaining six years, which is why the management fee
 can exceed the standard 2% when based on fund NAV in the denominator. Please read important disclosures in the appendix. 13
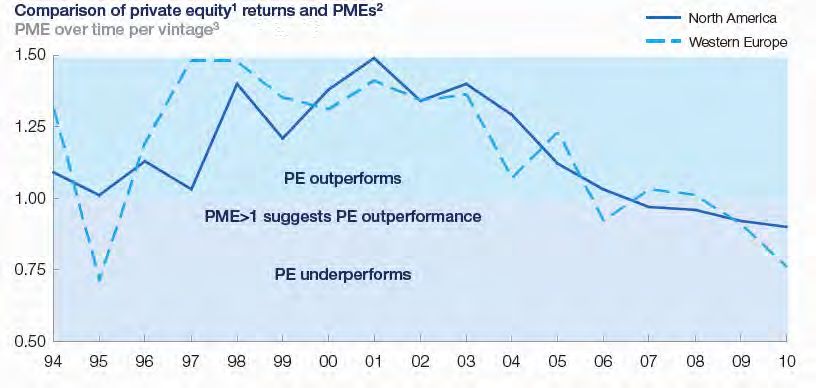
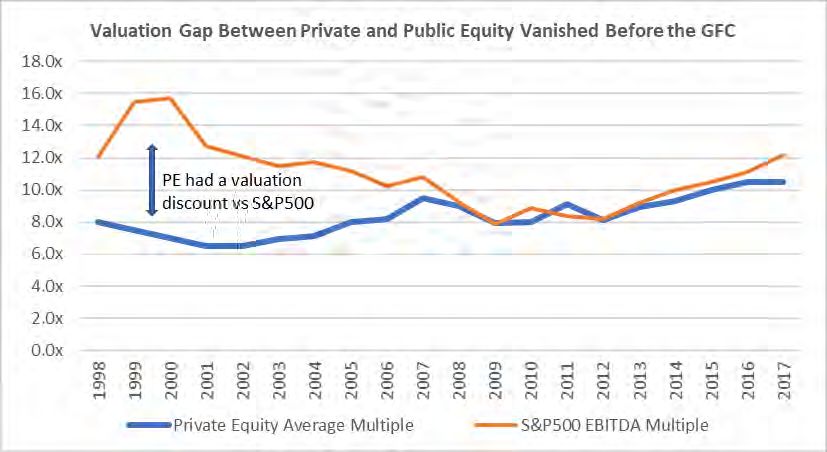
Con 2: Empirically Weaker PE Outperformance Since Mid-2000s
Is this a foretaste of worse performance to come?
• PE industry has not outperformed S&P 500 since 2006 (PMEs near 1 – Harris et al. (2014, 2016), L’Her
 et al. (2016), and Pitchbook data agree on this)
• PE outperformance ended just around the time when the PE market’s valuation discount was closed
• As noted, hot vintage years are followed by lower returns
• Competitive environment today is even tougher given institutional demand for PE, more PE firms,
 record-high dry powder, and competition for deals from cash-rich public companies and SWFs

Source: Harris etal (2016) based on Burgiss data. Past performance is not a guarantee of future performance. Source: Rasmussen (2018) based on data from Pitchbook, Cambridge Associates, CapitalIQ. Data from 1998-2017. In early
Please read important disclosure in the Appendix. years, the author uses proprietary data, for the past decade, Pitchbook data, reflecting calendar-year average information of all PE
 deal valuations managers assess and report of their private holdings. Past performance is not a guarantee of future performance.
 Please read important disclosure in the Appendix.

 Source: Doskeland-Strömberg (2018), “SWFs” refers to Sovereign Wealth Funds. Note that the LHS chart shows results only up to the 2010 vintage to avoid possibly understated returns for fresh
 vintages (so-called J-curve effect). By convention, funds are classified to a vintage year by the first capital call. While the chart shows results from Harris et al. (2016), we note that it reflects the
 consensus from many studies using different PE databases (e.g, see Harris et al (2014), Kaplan-Sensoy (2015), Doskeland-Strömberg (2018)) The old consensus on long-run PE edge was more
 modest before 2011 when some errors were found in one major database on 1990s PE performance. PME is computed as in Kaplan-Schoar (2005): Both capital calls and distributions are
 discounted using the returns from a public equity benchmark index, such as S&P 500. The PME is then calculated as the ratio between the sum of discounted distributions and the sum of discounted
 calls. The numerator captures the amount of wealth that an investor would have obtained for an investment in the PE fund, while the denominator captures the amount of wealth that would have
 resulted from a mimicking strategy where the investor buys the benchmark index at the same times and amounts as the capital calls of the fund. Intuitively, PME above(/below) one implies PE 14
 out(/under)performance versus the chosen public-market benchmark. For problems with IRR-based returns, see Phalippou (2011). Past performance is not a guarantee of future performance. Please
 read important disclosures in the Appendix.
Con 3: Is S&P500 the Right Benchmark to PE?
Can we replicate PE’s edge with factor/characteristic tilts in public markets?
• Even if we trust the long-run edge of 3-4%* over S&P500, one can ask if S&P500 is the right comparison
• Harris et al. (2016) show that the edge appears robust to benchmark, fund weighting, decade and region
• However, L’Her et al. (2016) argue that adjusting for lower cap and higher leverage removes the PE edge

 Buyout PMEs (Harris et al.) Buyout PMEs (L’Her et al.)
 Leverage Size-,
 Sector-, and
 S&P Size- Levered Size- and
 Unadjusted Leverage-Adjusted
 Adjusted Leverage-Adjusted
 S&P 500 S&P 600 with
 S&P 600 S&P 600
 Buyout Sector
 Weights
 EW average
 1.18 1.12 1.04 1.06
 1986-2014
 VW average
 1.12 1.03 0.96 0.94
 1986-2014

 Source: Harris, Jenkinson, and Kaplan (2016).
 Past performance is not a guarantee of future Source: L’Her et al (2016) based on Burgiss data. “EW” and “VW” averages are equally weighted and value-weighted respectively. Caveat:
 performance. For illustrative purposes only. Recent vintages may have insufficient data by publication time. But the results are similar if 2008 is used as the last vintage. Past performance
 Please read important disclosure in the is not a guarantee of future performance. For illustrative purposes only. Please read important disclosure in the Appendix
 Appendix.

• Other studies claim that the PE edge can be at least partly replicated by tilts in listed equity (Phalippou
 (2014), Stafford (2016), Ang et al. (2017))

 Source: Capital IQ, L’Her et al (2016) based on Burgiss data; Harris, Jenkinson, and Kaplan (2016). Past performance is not a guarantee of future performance. Please read important disclosures in the Appendix. To
 generate the levered size- and sector-adjusted return time series, L’Her et al (2016) first estimated the unlevered return time series and then re-levered the return with the appropriate leverage and cost of the debt. Using
 data from LCD, L’Herr measured the net-debt-to-enterprise value of buyout investments at inception. LCD does not provide pre-1992 leverage data; L’Herr backfilled the data to 1986, assuming that the leverage was the
 same then as in 1992. For the sector-adjusted S&P 600, L’Her measured ND/EV from Worldscope data. L’Herr proxied the cost of leverage for buyout investments by the yield of the S&P/LSTA US Leveraged Loan Index,
 obtained from LCD starting in 1999. For 1992–1999, L’Her used the yield of the US Credit Suisse Leveraged Loan Index. For 1986–1992, L’Herr used as a proxy Barclays BB/B Bond Index minus the average credit spread 15
 to the S&P/LSTA US Leveraged Loan Index over 1999–2012. The cost of leverage for public equity is proxied by the yield of the Barclays US Corporate Investment Grade Index.
 * See slide 9, PME 1.20 converts to 3-4% annual “direct alpha”.
Con 4: Overoptimism and/or Overpaying
Is a slimmer return edge accepted by investors?

End-investors may require at least 3% outperformance from PE as a fair reward for illiquidity and risk*

The industry has not delivered this since mid-2000s, yet end-investors have increased their allocations

Why?

Are investors overoptimistic about PE industry performance, or their own manager selection skills?
• Opacity of the PE market may contribute: limited data; slow feedback; gameable performance measures; reporting biases**

Or, do they accept slimmer excess returns because smooth PE returns understate the volatility and overstate
the diversification benefits?
• Overpaying for smoothing may well offset some of the fair illiquidity premium and other premia*** in private assets
• This would follow if investors give some weight in portfolio allocations to understated risk measures, as appears likely****

It’s hard to tell, but some combination of the two seems likely

A more positive interpretation: The disappointing performance reflects just small samples or a J-curve effect.
We may still expect the 3% outperformance over the long run…

 Source: AQR, Andonov-Rauh (2017), Appelbaum-Batt (2016b), Welch (2017). Past performance is not a guarantee of future performance. Please read important disclosures in the Appendix.
 * Appelbaum-Batt (2016b, p.31) list several large U.S. public pension plans who use 3% over public equity as their PE benchmark, while Andonov-Rauh (2017) show that the median long-run return
 edge of PE over public equity expected by U.S. public pension plans is about 2%.
 ** Reporting biases may be limited because most databases (Burgiss, Cambridge, Preqin, Pitchbook) source histories from LPs through voluntary reporting or FOIA requests. The consistency of
 main results across sources is also comforting.
 *** Another risk related to illiquidity is the commitment risk: the timing of capital calls and distributions depends on the GP, which imposes a call on the whole LP’s liquidity and complicates its total
 portfolio management (but this risk may be mitigated by fund diversification). Robinson-Sensoy (2015) show that net cash flows to LPs are procyclic, Drawing liquidity from LPs in bad times should
 warrant an illiquidity premium but this timing does help the performance of PE funds in both time-series and cross-sectional sense: Cash commitments by LPs are typically made in even hotter 16
 times than cash deployment by GPs, while funds with high propensity to call capital in bad times have had a relatively better performance.
 **** See Welch (2017).
Better Understanding PE
Returns and Risk in the
Wider Portfolio
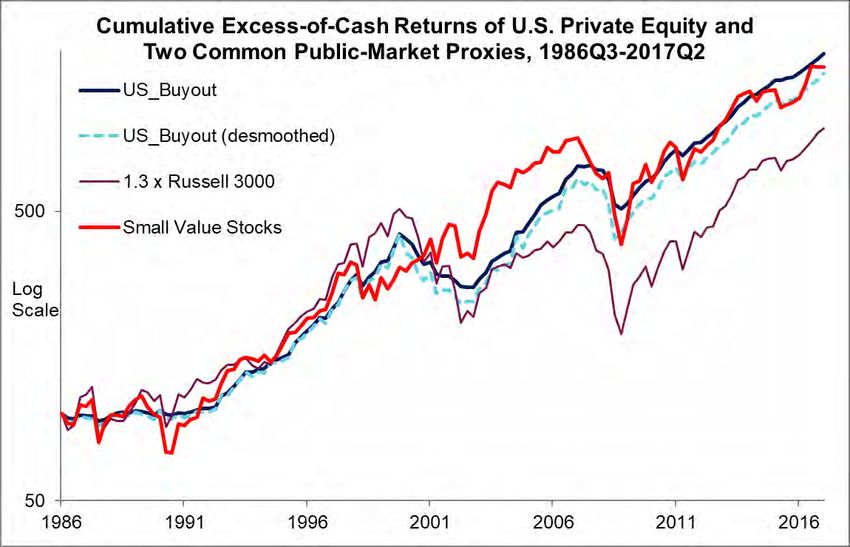
Better Understanding of PE Returns
Understanding total portfolio return sources in a common language

Deal-specific PE proxies – often called the “Canada Pension Plan model”*
• Each deal is matched to public-market assets with similar industry and country exposures, and estimated
 leverage is captured by a short bond position
• This “total portfolio approach” helps institutions view public and private investments in a common language

Public-market proxies for the broad PE
industry
• The PE (buyout) industry is increasingly
 proxied by small-cap stocks or 1.3 beta
 equity indices

 Source: AQR, Bloomberg, Cambridge Associates (using IRR-based raw index returns and an AR(1)-desmoothed
 variant), Kenneth French Data Library. Past performance is not a guarantee of future performance. Please read
 important disclosures in the Appendix.

 Sources for graph: AQR, Cambridge Associates, Kenneth French Data Library. For illustrative purposes only. ‘US_Buyout’ returns are Cambridge Associates U.S. Buyout series and
 ‘Small Value Stocks’ are small high book-to-market returns from Kenneth French’s Data Library. For illustrative purposes only. Please read important disclosures in the Appendix.
 Past performance is not a guarantee of future performance. 18
 * See Ang et al. (2014).
Better Understanding of PE Returns (cont.)
Demystifying or replicating PE returns
Many studies are trying to demystify and replicate PE industry’s performance in a similar vein as public-asset
investors’ performance has been demystified with factor regressions (cf. Appendix)
• PE managers are not keen on such demystifying efforts
• Clearly, all of the PE edge is not replicable with public assets (cf. operational and governance gains on p9,
 or the smoothing feature). Style tilts, market timing* and sector rotation might be.
• But given the 6%** fees in PE, even partial replication could be enough

However, style factor exposures are hard to detect in PE given the sparse data available on private deals, so
empirical results are quite mixed
• The table below summarizes regression-based estimates of U.S. buyout factor sensitivities: few non-
 market tilts are statistically significant at 5% level^
• Studies using other methods – Phalippou (2014), Stafford (2016), Andreeva (2017) – find strong tilts
 toward small-cap and value, while L’Her et al. (2016) find small-cap tilt but no value tilt.***
 Market Small Value Illiq.
 Beta (SMB) (HML) (P-S)
 Franzoni et al. (2012) 1.0-1.3 insignif signif signif
 Driessen et al. (2013) 1.3-1.7 insignif insignif n.a.
 Ang et al. (2017) buyout 1.2-1.3 insignif insignif signif
 D-S (2018) LPX50 buyout 1.2-1.4 insignif signif insignif
 Source: McKinsey (2017), Doskeland-Strömberg (2018). For illustrative purposes only. Please read important disclosures in the Appendix.
 * See Jenkinson et al. (2018) on PE managers’ market timing skills. **CEM Benchmarking estimate the total annual fee to average 5.7% for a sample of PE funds (including fund investments and
 fund-of-fund investments), shown in Exhibit 9 of McKinsey (2017). Number of observations: partnership expenses: 112 observations, management fees: 167 observations, carried interest: 84
 observations and internal oversight and selection: 122 observations. ***The PE/buyout return series are created using different data sources and universes as well as different methods to convert
 PE data to return-like series (e.g., some use gross returns of individual PE deals, others use net cash flows to PE funds, while Stafford covers just public-to-private deals, and LPX listed stocks of 19
 buyout firms, etc.) ^The following factor models are used to calculate the US buyout factor sensitivities: the CAPM, the three factor models of Fama and French (1993), and the four factor model of
 Pastor and Stambaugh (2003). Franzoni et al. (2012) uses a dataset provided by the Center for Private Equity Research (CEPRES GmbH), Driessen et al. (2013) uses 272 BO Funds from TVE, D-
 S (2018) uses the LPX50 Index, and Ang et al. (2017) uses 423 BO funds from Preqin.
Overpaying for the “Smoothing Service”
 May explain slim realized and expected return edge of private over public

 Investors prefer smooth sailing to a bumpy ride
Cumulative Return

 Time Time
 Image source: https://stockboardasset.com/insights-and-research/2018-bumpy- Image source: http://www.refreshleadership.com/index.php/2015/07/anchor-
 ride-energy-stocks/. For illustrative purposes only. companys-future-smoothsailing-tips/. For illustrative purposes only.

 Overpaying for the smoothing service may offset some of the fair illiquidity premium in private assets
 • This would follow if investors give some weight in portfolio allocations to the understated risk measures
 (see “diversification illusion” in Welch (2017))
 • Investors may know that measured PE risks are understated, yet care about them due to regulatory or
 accounting reasons, e.g., because they smooth needed pension contributions
 • Or investors with self-knowledge may deem that it is easier to be patient with equity risk when all the
 MTM losses do not hit at once => PE may thus enable larger total equity allocations – and potentially
 enhance long-run returns through “more equity premium” rather than through a large illiquidity premium

 Source: AQR, Welch (2017). For illustrative purposes only. Please read important disclosures in the Appendix. 20
Concluding Remarks
PE’s role depends on perspective: smooth or de-smoothed returns

Return enhancer – but overpaying for the smoothing service may mean that less than 3% return edge

Even IF we believe that PE offers 3% edge over public equity, this may imply 1% or 5% CAPM alpha –
depending on the weight given to the smooth raw PE returns

It matters whether PE outperformance is deemed “just beta”: if the investor portfolio is already dominated by
equity risk, other less-correlated alpha sources may be more valuable than PE

Using smooth returns will make PE appear like a valuable diversifier, so much so that constraints must be
imposed in portfolio optimization exercises

Using de-smoothed returns will make PE a less attractive diversifier; it can offer other potential benefits:

• a modest expected return edge over public equity

• embedded leverage

• high-capacity access to small value

• a smoothing service enables you to hold more equities and earn more equity premium

 Source: AQR. Please read important disclosures in the Appendix. 21
Appendices
- Expected Return Modeling for PE
- More on PE Market Size and Risk
- Demystifying Regressions
- Macro Sensitivities
- References
Summary of Positive and Negative Arguments on Private Equity
Any verdict is inevitably subjective
 Pros Cons

 • Theoretical reasons for return enhancement • High fees: testing the limits of ‘Asness’ Law’
 • Evidence of outperformance over 30 years • Past 10+ years may warn of a weaker future
 • Easier way to take risk – optical diversifier • Is S&P500 the right benchmark to PE?
 • Industry performance is just a base to build on • Overoptimism and/or overpaying

Net verdict: mild outperformance of PE over (cap-weighted) public equity seems a good base case
 − Below-avg. public equity returns + below-avg. PE outperformance = below-avg. PE returns*
 − Current valuations and fees could justify especially low estimates for the coming decade
 − Besides basing expected returns on historical average returns, theory-based (normative required return) or
 supply-based approaches are possible. We show below one illustrative example of each.
 • One supply-based approach (in the spirit of the discount cash flow models) considers current market yields as well
 as private equity valuations, and fees, growth enhancements, leverage
 • One theory-based approach uses CAPM betas and adjusts the expected/required return of comparable public
 equity for PE’s higher risk. (Another theory-based approach (not shown) involves estimating a fair illiquidity
 premium for forgone flexibility – though this may be offset by investors overpaying for the smoothing service.)

 Source: AQR, graph from Jessica Broome Research. Past performance is not a guarantee of future performance. Please read important disclosures in the Appendix.
 * Andonov-Rauh (2017) show that the median long-run return edge of PE over public equity expected by 231 U.S. public pension plans between 2014 and 2016 is about 2%
 (12.1% vs 9.6% arithmetic mean, 10.0% vs. 8.6% geometric mean). The level of these forecasts is high, partly because they reflect multi-decade horizons and embed 23
 higher cash and inflation forecasts (3-3.5% mean cash rate and 3% inflation) than appear likely for the coming decade, partly because of pension optimism on equities.
Return Decomposition in PE and Other Asset Classes
Supply-based framework: net income + CF growth + valuation change
Discounted cash flow framework is often used to assess prospective returns in liquid asset markets
Numbers below are only illustrative* as any estimates require many assumptions
Data limitations complicates the task further in PE but the idea is worth exploring

 Asset Class Net Real Income Expected Real Expected Total Exp.
 (real return in unchanged cap. CF Growth Valuation Real LT
 mkt. env., incl. fees) Change Return

 Public Equity Div.Yield or Net Payout Yield; Real E(DPS) or E(EPS) Assume zero
 (U.S. cap-wtd) (assume negligible fee) (use long-term trend)
 2.0 - 2.5% 1.5 - 2.0% 0% 4%

 Bonds Yield - Exp. Infl. + Rolldown; None Assume zero
 (U.S. 10Y Treasury) (assume negligible fee)
 1% 0% 0% 1%
 Real Estate Proxy CF Yld w. 2/3 of Cap Ratio Imperfect inflation Assume zero
 (NCREIF NPI, (if 1/3 CapEx, then 4.5%x(2/3)=3%); pass-through
 Unlevered) assume 0.5% fee
 2.5% -0.5% 0% 2%
 Private Equity Above-mkt yield? Levg. Fee. Above-mkt growth, levg. Assume zero
 (US Buyout) Say, 3x 3% yield 3x 3% E(real CF growth)
 minus assumed 6% fees - 2x 3% HY real yld (levg.cost)
 3% 3% 0% 6%

 Source: Ilmanen (2011): Expected Returns; AQR (2018): Alternative Thinking: Capital Market Assumptions; Straehl-Ibbotson (2017): The Long-Run Drivers of Stock Returns: Total Payouts
 and the Real Economy. Financial Analysts Journal; Siegel (2018): She Caught the CATY; Pagliari (2017): Some Thoughts on Real Estate Pricing, Journal of Portfolio Management.
 For illustrative purposes only. Notes: Numbers are for illustration only and not to be taken as current forecasts. Any tax effects are ignored. The naïve takeaway that more and cheaper
 leverage boosts expected return on PE is inconsistent with empirical evidence that such conditions coincide with hot-vintage years and low prospective returns. Please read important
 disclosures in the Appendix. Hypothetical performance results have certain inherent limitations, some of which are discussed in the disclosures.
 * We use ballpark reasonable estimates that are not too far from Alternative Thinking 1Q2018 capital market assumptions for stocks and bonds, and in line with the Pagliari (2017) for Real 24
 Estate. For Private Equity we assume higher numbers than for public equity, and a leverage estimate from Doskeland-Strömberg (2018). Please see Appendix for Alternative Thinking
 1Q2018 capital market assumptions methodology for stocks and bonds.
One Way to Estimate Private Equity’s Expected Return and Risk
Assume same Sharpe ratio as public equity; adjust for beta/leverage
 Expected Real Expected Exp. Nominal Ret.
Step 1: Calculate expected return and Return Inflation (Real + Inflation)
volatility of Large Cap (LC) U.S. stocks LC Stocks 4.0% 2.2% 6.2%

(e.g., based on DDM or cycl.-adj. earnings yield) 1. Past 10-year 2. Long-Term Vol Expected Volatility
 Volatility (Since 1990) (Avg of 1 and 2)
 LC Stocks 15.0% 14.2% 14.6%
Step 2: Assuming small cap (SC) stocks have same
risk-adjusted return as LC stocks and using the same
volatility forecast methodology, calculate the expected 1. Past 10-year 2. Volatility Since Expected Volatility
 Volatility 1990 (Avg of 1 and 2)
excess return of SC stocks
 LC Stocks SC Stocks 19.8% 18.7% 19.2%

 Excess Return* 4.0%
 Expected Excess
 Volatility of ExR 14.2% Sharpe Ratio Volatility Return (Sharpe
 Ratio * Vol)
 Sharpe Ratio 0.27
 SC Stocks 0.27 19.2% 5.3%

Step 3: Employ 1.2x market beta** to estimate
the expected excess return and volatility of PE

Step 4: Add back cash to give total return forecasts
and observe the differences between our estimates

 Source: AQR, Bloomberg, Large Cap Stocks is the S&P 500 and Small Cap Stocks is the Russell 2000, Consensus Economics. For illustrative purposes only. Hypothetical data has certain inherent
 limitations, some of which are disclosed in the Appendix. Please read important disclosures in the Appendix.
 * For U.S. Equities, we average two yield-based approaches: 1. Earnings-based: Shiller E/P * 0.5 (long-run dividend payout ratio) + 1.5% long-run real EPS growth 2. Payout-based: Dividend Yield +
 Net Buyback Yield + estimated real aggregate payout growth. We assume no mean reversion in equity valuations, and we quote local real returns. We expect the return of cash to be equal to 25
 inflation, and thus our expected excess return is equal to our expected real return. See AQR Alternative Thinking 1Q2018, 10-Year forecast inflation uses Consensus Economics data. Please see
 Alternative Thinking slides at the end of this presentation for further information. ** Franzoni, Nowak and Phalippou (2012) estimate a 1.3 beta for PE vs Large-cap companies, attributable to the
 higher debt-to-equity ratio of PE companies. This 1.3 beta versus large-cap is equivalent to a 1.2 beta versus small-cap.
More Context to Private Equity Market Size
Small but growing share

Investable PE market is $2-3trn… PE share in institutional portfolios in double-digits for
…compared to $40-70trn global public equity some investor groups
(depending on definitions) Demand is growing while popularity of hedge funds
PE market share: ca. 5% of total equity, 2% of global and traditional active equity is softening
investable wealth, though on a mild uptrend McKinsey (2017) PE allocations for some very large
 pension plans: Europe 5%, U.S. 10%, Canada 15%

 Investable Global Market Portfolio in $ trn, June-2015 Average Private Equity Allocation by Investor Type
 35%

 29%
 30%

 25%

 20%

 15%
 12%
 11%
 10%
 6% 6%
 5% 5%
 5% 3%
 1%
 0%
 Family Endow- Found- Sovereign Public Private Super- Insurance Retail
 Offices ments ations Wealth Pension Pensionannuation
 Funds Schemes

 Source: Gupta et al. (2016) Source: Pomona Capital, as of October 2017, using Preqin data.
 (See: https://individuals.voya.com/system/files/document/file/Pomona%20Capital%20-
 %20Private%20Equity%20Overview.PDF .)

 Source: Gupta et al. (2016) and Pamona Capital. Note that in the piechart on the left, investable real estate and infrastructure markets are judged to be about ten times larger than on the previous
 page which focused on investable private funds. Estimates of investability in private markets are inherently judgmental. Most uninvestable private markets are much larger than investable ones.
 Even with public equities, total cap estimates vary a lot. Including smaller equity markets and without float-adjustment, the 2017 global public equity estimates exceed $70trn (and private equity
 $3trn), see Gupta et al. (2016). McKinsey (2017) findings use Preqin data as of November 2017, the universe is a sample of 12 peer funds, reflecting a mix of pension funds 26
 and sovereign wealth funds from North America, Asia, and Europe (including two Scandinavian funds). Past performance is not a guarantee of future performance. Please read important
 disclosures in the Appendix.
Better Understanding of PE Risk
Risk estimate depends crucially on weight given to smooth raw PE returns

Let’s be more modest and merely ask about the basic riskiness (volatility or market beta) of PE

• Even this is hard

• Is the PE industry volatility 10% or 25%, and is the market beta 0.5 or 1.5 or even 2+?

• Raw PE index returns give single-digit volatility, while de-smoothing may raise it by 50-100%*

• Simple regressions show beta near 0.5, and even with lagged betas below 1*

• Axelson et al. (2014) leverage argument: public equity adds 0.3-0.5x debt on equity, while PE adds 2x**

• Many academic studies above, with varying data/methods, show PE (buyout) industry beta near 1.3

Useful way to think of at least three contributions to measured portfolio risks:

• Per-deal risk: especially leverage and size point to high total risk – but measured risk will be reduced by:
 − Smoothing effects
 − Diversification across deals/funds

 Source: AQR, DS (2018) and Axelson et al (2014). ‘Raw PE Index returns’ refers to Cambridge Associates U.S. Buyout data. See slide 10. Past performance is not a guarantee of
 future performance. Please read important disclosures in the Appendix.
 *AQR, Bloomberg, Cambridge Associates (using IRR-based raw index returns and an AR(1)-desmoothed variant), Kenneth French Data Library. Please refer to slide 9.
 **Terminology on leverage varies but debt-to-equity 66%/33% split in a buyout implies leverage near 2 or 66% debt-to-enterprise-value ratio. Axelson et al quote even higher beta
 estimates, using D/EV ratio above 70%. But their beta estimates above 2 are on gross-of-fee returns, and would imply beta below 2 for net-of-fee returns. Axelson et al. (2014) use data
 from 1994-2013 provided by a large fund-of-funds, one of the world’s largest investors in private equity, including both buyout and venture capital funds. 27
Factor Return Regressions Provide Demystifying Evidence
Help investors understand active managers’ long-run return sources
As a group, delegated active managers exhibit highly significant market exposures as well as significant
small-cap and pro-momentum tilts (plus high-beta tilts for hedge funds)
Hedge funds, as a group, have been about 80% correlated with equity markets

 1999-2016
 Mutual Funds 1999-2016
 Morningstar DB Hedge Funds
 All U.S. (eq.wtd.) (All CS/HFR avg.)
 6-Factor Regression Statistics 4-Factor Regr. Stat’sRegression Statistics
 6-Factor 4-Factor Regr
 Adj. R Square 98.6% Adj. R 97.8%
 Adj. R Square Square 64.9% Adj. R Square
 Coefficient t Stat Coefficient t Stat Coefficient t Stat Coefficient
 Intercept -0.053 -1.36 -0.011 -0.24
 Intercept 0.264 3.54 0.281
 MKT 0.989 99.55 MKT 84.55
 1.006 0.288 15.12 0.298
 SMB (Small-Cap) 0.125 10.42 SMB (Small-Cap) 0.067 2.91
 HMLdev (Value) 0.014 0.69 HMLdev4.90
 0.077 (Value) -0.031 -0.82 0.010
 UMD (Momentum) 0.053 5.89 UMD (Momentum)
 0.059 5.49 0.081 4.71 0.086
 GPOA (Quality) 0.017 0.91 GPOA (Quality) -0.003 -0.07
 BAB (Low Risk) 0.008 0.76 BAB (Low
 -0.037 Risk)
 -2.90 -0.048 -2.26 -0.071

 Source: AQR, Morningstar, CS, HFR. For the period 1999-2016. For illustrative purposes only. Hypothetical performance results have certain inherent limitations, some of which are disclosed in
 the Appendix. Please read important disclosures at the end of this presentation. MKT is a value-weighted CRSP market portfolio, SMB: Small Minus Big size factor, HMLdev: High Minus Low
 value factor (based on book-to-market), UMD: Up Minus Down momentum factor (based on performance in the past year, skipping past month), GPOA is gross profit over total assets, BAB
 (Betting Against Beta) is a levered beta-neutral portfolio that is long low beta stocks and short high beta stocks with the stock universe roughly the Russell 1000.
 33
Demystifying Buffett
Can demystify individual investors as well as manager composites
“Whether we’re talking about socks or stocks, I like buying quality merchandise when it is marked down.”*

 Average Sharpe Annual
 Volatility Information Ratio
 Return Ratio Outperformance
 Berkshire Hathaway 17.6% 23.6% 0.74 10.6% 0.49
 U.S. Equities 6.9% 15.5% 0.45 - -

Factors Used
Market: the U.S. equity market factor from Kenneth French’s data library
Value: the HML factor from Kenneth French’s data library
Low-Risk: the “Betting-Against-Beta” (BAB) factor from AQR’s data library
Quality: the “Quality-Minus-Junk” (QMJ) factor from AQR’s data library

Regression Statistics Regression-based Return Attribution
 20%
 Alpha Low-
 Market Value Quality R2
 (ann’l) Risk Regression Alpha (3.6%)**
 15%
 Coefficient 3.6% 0.98 0.43 0.23 0.63 28%
 Quality (3.4%)
 T-stat 1.0 12.4 3.6 2.6 4.6 10%
 17.6% Low-Risk (2.6%)

 Value (1.2%)
 5%
 Market (6.8%)
 0%
 Raw Returns Style
 Perspective

 Source: AQR, 4Q2016 Alternative Thinking: Superstar Investors, AQR, CRSP (for BRK data). For inspiration of this superstars-demystifying study, see Frazzini-Kabiller-Pedersen (2012):
 Buffett’s Alpha. Returns in all exhibits are excess of risk-free rate from Kenneth French’s data library, unless stated otherwise. Factor returns are all gross of fees and transactions costs. U.S.
 Equities are the CRSP capitalization-weighted equity market factor from Kenneth French’s data library. All data are from Jan 1977 to May 2016. See appendix for details on factor construction. 29
 *Warren Buffett, Berkshire Hathaway Inc., Annual Report, 2008.
 **Not statistically significant at 95% confidence.
Assessing Sensitivities To Different Macro Environments
 Macro diversification: mapping investments to macro risks

 Long-Only Market Risk Premia
 1972-2016
 2.5 2.12
 2.0
Sharpe Ratio

 1.5 1.30 1.29
 1.05 1.15
 0.87 0.97
 0.80 0.80
 1.0 0.57 0.56
 0.49 0.47
 0.5 0.26 0.25
 0.42 0.31 0.29 0.42 0.18
 0.0
 -0.10 -0.01
 -0.5 -0.21 -0.10 -0.19
 Global Equities Global Bonds Commodities Private Equity (Since 1986) Real Estate (Since 1987)

 Hypothetical Long/Short Style Premia
 1972-2016
 2.0
 1.36 1.28 1.41 1.42
 1.5
 1.09 1.17
 Sharpe Ratio

 1.09 1.05 0.98 1.03
 0.94 0.94 0.88
 1.0 0.72 0.75 0.82 0.87 0.88
 0.68 0.58 0.73 0.72
 0.45 0.48 0.55
 0.5
 0.0
 -0.5
 Value Momentum Carry Defensive Trend

 Hypothetical Simple Portfolios
 1972-2016
 2.5 All
 1.86 1.96 1.89
 1.86 1.87
 2.0
 Sharpe Ratio

 Growth Up + Inflation Up
 1.5 1.29
 1.0 Growth Up + Inflation Down
 0.33 0.44 0.39
 0.5 Growth Down + Inflation Up
 0.0
 -0.22 Growth Down + Inflation Down
 -0.5
 Global 60/40 Five Styles

 Source: Bloomberg, AQR. Data from January 1972 – December 2016. Global Equities is the MSCI World Index. Global Bonds is a GDP weighted composite of Australian, European,
 Canadian, Japanese, U.K. and U.S. 10-year government bonds. Commodities is an equal dollar-weighted index of 24 commodities. Private Equity and Real Estate are represented by
 Cambridge Associates indices. Long-Short Style Premia are backtests of style premia as described herein. Global 60/40 takes 60% Global Equities and 40% Global Bonds. Five Styles
 is an equal dollar-weighted composite of the five long/short style premia. Please see Appendix for more details on the construction of the return series and macroeconomic
 environmental indicators. The analysis is based on hypothetical returns gross of trading costs and fees. Hypothetical performance results have certain inherent limitations, some of
 which are disclosed in the Appendix. Past performance is not a guarantee of future performance. 30
References

Andonov, Aleksandar, and Joshua D. Rauh, 2017, The return expectations of institutional investors, Erasmus University working paper.
Andreeva, Zhana, 2017, Predictive characteristics for the cross-section of private equity returns, Erasmus University working paper.
Ang, Andrew, Michel W. Brandt, and David F. Denison, 2014, “Review of the active management of the Norwegian Government Pension Fund Global,” report to the Norwegian Ministry of
Finance.
Ang, Andrew, Bingxu Chen, William N. Goetzmann, and Ludovic Phalippou, 2017, “Estimating private equity returns from limited partner cash flows,” Columbia University working paper.
Appelbaum, Eileen, and Rosemary Batt, 2016a, “Fees, fees and more fees: How private equity abuses its limited partners,” Center for Economic and Policy Research.
Appelbaum, Eileen, and Rosemary Batt, 2016b, “Are lower private equity returns the new normal?”, Center for Economic and Policy Research.
Axelson, Ulf, Tim Jenkinson, Per Strömberg, and Michael Weisbach, 2013, “Borrow cheap, buy high? The determinants of leverage and pricing in buyouts.” Journal of Finance 68 (6), 2223-
2267.
Axelson, Ulf, Morten Sørensen, and Per Strömberg, 2014, “Alpha and beta of buyout deals: A jump CAPM for long-term illiquid investments,” LSE working paper.
Doskeland, Trond, and Per Strömberg, 2018, “Evaluating investments in unlisted equity for the Norwegian GPFG,” report to the Norwegian Ministry of Finance
Driessen, Joost, Tse-Chun Lin, and Ludovic Phalippou, 2012, “A new method to estimate risk and return of non-traded assets from cash flows: The case of private equity funds,” Journal of
Financial and Quantitative Analysis 47(3), 511-535.
Franzoni, Francesco, Eric Nowak, and Ludovic Phalippou, 2012, “Private equity performance and liquidity risk,” Journal of Finance 67(6), 2341-2373.
Gupta, Abhishek, Dimitris Melas, Raghu Suryanarayanan, and Andras Urban, 2016, “Global markets and return drivers,” report to Norwegian Ministry of Finance, MSCI.
Harris, Robert, Tim Jenkinson, and Steven Kaplan, 2014, “Private equity performance: What do we know?” Journal of Finance 69(5), 1851-1882.
Harris, Robert, Tim Jenkinson, and Steven Kaplan, 2016, “How do private equity investments perform compared to public equity?” Journal of Investment Management 14 (3). 1-24.
Harris, Robert S., and Rüdiger Stucke, 2012, “Are too many private equity funds top quartile?” Journal of Applied Corporate Finance 24(4), 77-89.
Jenkinson, Tim, Stefan Morkoetter, and Thomas Wetzer, 2018, “Buy low and sell high? Do private equity fund managers have market timing abilities?” University of St.Gallen working paper.
Kaplan, Steven N., and Berk A. Sensoy, 2015, “Private equity performance: A survey,” Annual Review of Financial Economics 7, 597-614.
Kaplan, Steven N., and Per Strömberg, 2009, “Leveraged buyouts and private equity,” Journal of Economic Perspectives 23(1), 121-146.
L’Her, Jean-François, Rossitsa Stoyanova, Kathryn Shaw, William Scott, and Charissa Lai, 2016, “A bottom-up approach to the risk-adjusted performance of the buyout fund market,” Financial
Analysts Journal 72(4), 36-48.
McKinsey, 2017, “Equity investments in unlisted companies,” report to the Norwegian Ministry of Finance.
Phalippou, Ludovic, 2011, “An evaluation of the potential for GPFG to achieve above average returns from investments in private equity and recommendations regarding benchmarking, report
to the Norwegian Ministry of Finance.
Phalippou, Ludovic, 2014, “Performance of private equity revisited?,” Review of Finance, 18(1), 189-218.
Phalippou, Ludovic, Christian Rauch, and Marc Umber, 2017, “Private equity portfolio company fees,” forthcoming in the Journal of Financial Economics.
Rasmussen, Daniel, 2018, “Private equity: Overvalued and overrated?”, American Affairs Journal.
Robinson, David, and Berk Sensoy, 2015, “Cyclicality, performance measurement, and cash flow liquidity in private equity,” Journal of Financial Economics 122(3), 521-543.
Stafford, Erik, 2016, “Replicating private equity with value Investing, homemade leverage and hold-to-maturity accounting,” Harvard Business School working paper.
Welch, Kyle, 2017, “Private equity’s diversification illusion: Evidence from fair value accounting,” George Washington University working paper.
You can also read