Drivers of spatio temporal variation in mosquito submissions to the citizen science project 'Mückenatlas' - Nature
←
→
Page content transcription
If your browser does not render page correctly, please read the page content below
www.nature.com/scientificreports
OPEN Drivers of spatio‑temporal
variation in mosquito submissions
to the citizen science project
‘Mückenatlas’
Nadja Pernat1,3,5*, Helge Kampen2, Florian Ruland3,4,5, Jonathan M. Jeschke3,4,5 &
Doreen Werner1,5
Intensified travel activities of humans and the ever growing global trade create opportunities of
arthropod-borne disease agents and their vectors, such as mosquitoes, to establish in new regions.
To update the knowledge of mosquito occurrence and distribution, a national mosquito monitoring
programme was initiated in Germany in 2011, which has been complemented by a citizen science
project, the ‘Mückenatlas’ since 2012. We analysed the ‘Mückenatlas’ dataset to (1) investigate causes
of variation in submission numbers from the start of the project until 2017 and to (2) reveal biases
induced by opportunistic data collection. Our results show that the temporal variation of submissions
over the years is driven by fluctuating topicality of mosquito-borne diseases in the media and large-
scale climate conditions. Hurdle models suggest a positive association of submission numbers with
human population, catch location in the former political East Germany and the presence of water
bodies, whereas precipitation and wind speed are negative predictors. We conclude that most
anthropogenic and environmental effects on submission patterns are associated with the participants’
(recording) behaviour. Understanding how the citizen scientists’ behaviour shape opportunistic
datasets help to take full advantage of the available information.
Mosquito-borne diseases pose an increasing threat to human and animal health worldwide. Human-mediated
dispersal, for example by global trade or travelling, are the main factors for the introduction of non-indigenous
species such as the Asian tiger mosquito Aedes albopictus or the yellow fever mosquito Aedes aegypti1,2. Due
to their adaptability and potentially facilitated by global warming, both species have succeeded in establishing
populations in new r egions3,4, and are potential vectors of a range of pathogens such as dengue or chikungunya
viruses1. Comprehensive, long-term data collection about the distribution and phenology of invasive as well as
native species that are competent vectors of pathogens5 are required to prevent infections, to assess and decrease
impacts on human and animal well-being and to predict how particular vectors will spread.
To collect and update data as a basis for risk assessments, the German government initiated a still ongoing
nationwide mosquito monitoring programme in 2011, consisting of targeted field efforts by scientists and a com-
plementary citizen science project. While developmental stages and adults have been actively collected by dipping
and trapping throughout Germany since the start of the programme6, this kind of professional monitoring is lim-
ited by staff and funding and can only provide snapshots of mosquito populations in selected habitats. Moreover,
lack of access to private properties and of data from the people’s immediate surroundings, where, for example,
invasive species readily breed in artificial containers, hampers risk assessments. The importance of such data
from densely populated areas is illustrated by the first West Nile virus infections in Berlin in 2 0197. To enhance
data collection and to complement active surveillance by scientists, the citizen science project ‘Mückenatlas’
(mosquito atlas) started in 2012. Contrary to the majority of biodiversity monitoring projects involving citizens
and working with online recordings via a website or an app, for instance eBird8 and iNaturalist on a global or the
Spanish Mosquito Alert9 and the Austrian RoadKill10 on a national scale, ‘Mückenatlas’ participants do not upload
1
Leibniz Centre for Agricultural Landscape Research, Eberswalder Str. 84, 15374 Müncheberg,
Germany. 2Friedrich‑Loeffler‑Institut, Federal Research Institute for Animal Health, Südufer 10, 17493 Greifswald
Insel ‑ Riems, Germany. 3Department of Biology, Chemistry, Pharmacy, Institute of Biology, Freie Universität
Berlin, Königin‑Luise‑Str. 1‑3, 14195 Berlin, Germany. 4Leibniz Institute of Freshwater Ecology and Inland Fisheries
(IGB), Müggelseedamm 310, 12587 Berlin, Germany. 5Berlin-Brandenburg Institute of Advanced Biodiversity
Research (BBIB), Königin‑Luise‑Str. 2‑4, 14195 Berlin, Germany. *email: nadja.pernat@zalf.de
Scientific Reports | (2021) 11:1356 | https://doi.org/10.1038/s41598-020-80365-3 1
Vol.:(0123456789)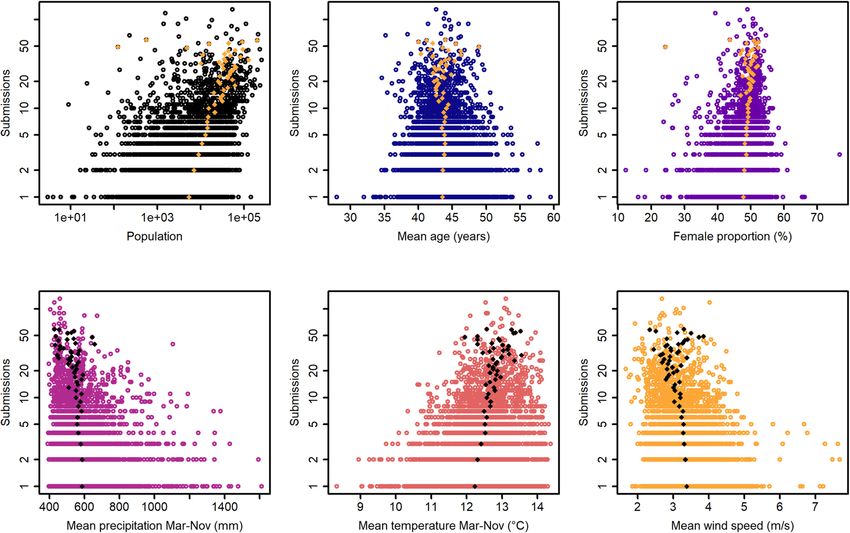
www.nature.com/scientificreports/
records or are involved in the identification of the reported specimens themselves. Instead, they catch and send
physical samples that are then determined to species level by the project’s experts according to a standardised
protocol11. In this way, the ‘Mückenatlas’ has the benefits of citizen science—large observation numbers and a
large geographic scale—while taking a rather conservative approach to ensure data quality instead of controlling
for data quality issues with tools such as crowdsourcing, external expert validation or in-process data vetting8,9.
Another advantage of opportunistic sampling by citizens is to increase the probability of detecting rare or
unexpected events, such as the arrival of an invasive species or the return of a particularly rare taxon12. With
regard to mapping biodiversity and detecting invasive species, the ‘Mückenatlas’ has already attested its effi-
ciency: submissions revealed new populations of Aedes japonicus (Asian bush mosquito) and Ae. albopictus11,13–17,
produced first records of Ae. aegypti and Aedes koreicus in Germany18,19, and led to the rediscovery of very rare
species after decades without d ocumentation20,21.
On the flipside, random collections from citizens result in opportunistic datasets incorporating observation
bias caused by recorder activity22 that vary in intensity depending on project design. Consequently, only small,
species-specific fractions of the growing ‘Mückenatlas’ dataset have been analysed so far, e. g. to describe particu-
ndings23, to investigate nuisance s ources24 or for population g enetics25. Kerkow et al.26, for example,
lar species fi
mitigated bias by combining ‘Mückenatlas’ observations of Ae. japonicus with conventional monitoring data to
predict species distribution, to some degree discussing patterns resulting from biases of both—in this case over-
and underrepresentation of land-use types. Other case studies of observation patterns focus on intrinsic and
extrinsic motivations of citizen s cientists27,28, less commonly on general environmental or anthropogenic factors
associated with volunteers’ recordings for large-scale citizen science projects29,30. Analysing these driving factors,
however, would help utilise opportunistic data collections to full extent and design future citizen science projects.
The ‘Mückenatlas’ submissions have so far neither been explored nor evaluated from a citizen science
perspective31,32. This study contributes to our knowledge about the complexity of submission patterns for long-
term, large-scale citizen science projects with the particularity that, in contrast to other studies, there is no
uncertainty concerning species identification. After the ‘Mückenatlas’ has been operating for more than seven
years, we here aim at answering the following three questions: (1) Which trends and characteristics shape the
opportunistic dataset? (2) Which factors drive the seasonal and annual variations in submission numbers? (3)
Which factors drive the spatial distribution of submissions? These questions are tackled by a descriptive analysis
of the dataset and by deploying hurdle models to test the association of several anthropogenic and environmental
predictors with submission numbers.
Methods
‘Mückenatlas’ workflow. Citizens are asked to catch mosquitoes in a closable container without physi-
cally damaging them, and to kill them by freezing for at least 24 h. A form that can be downloaded from the
project’s website (http://www.mueckenatlas.com) and is also available at the project’s office must be completed
with information about the catch. The participants then send their catch along with the submission form to the
orphologically33,34 or, in difficult cases, such
project’s laboratory where the sample is identified to species level m
35
as damaged specimens or cryptic species, genetically . As a reward, every participant receives a personal letter
or email including detailed information about the submitted mosquito(es). If desired, the participants also get
a mark with their name or a pseudonym on the website’s collectors’ map. The data corresponding to the catch is
uploaded to CULBASE, the German mosquito database.
Data preparation. Data attributed with ‘MA’ (tag for ‘Mückenatlas’) were extracted from CULBASE on
July 31, 2018, marking the end of the period of data entry for 2017. Each entry represents the submission of one
or more specimen of one mosquito species from one location. We ignored specimen counts for this study as we
focused on investigating submissions, irrespective of the exact number of specimens sent. The dataset consisted
of a partly automatically generated suite of covariates composed of information from the submission form and
database processing such as species, geo-coordinates, collection date and land-use types according to CORINE
Land Cover data level 3 36. Furthermore, the collection site description provided by the participants on the sub-
mission forms were categorised to a biotope variable. When information on the catch location was missing,
the home addresses of the participants were taken as geo-coordinates by default, but no biotope category was
assigned to the corresponding entries. Unclear site descriptions, such as ‘hedge’ or ‘path’ with geo-coordinates,
as well as interpretable descriptions without geo-coordinates, such as ‘forest nearby home’, were verified manu-
ally by Google Maps. If the catch location could not be verified, biotope category was set invalid. In total, the
resulting dataset comprised 21,768 submissions and 15 covariates (Supplementary Table S1). Explorative and
descriptive analysis of the covariates to depict submissions and identify temporal trends were conducted with R
packages ggplot237, treemap38 and summarytools39 deploying R version 3.5.240.
Raster data. To implement submission numbers as response variable for statistical testing, we drew a raster
grid with a 5 km resolution across Germany and counted submissions in every grid cell to create a submission-
distribution raster file. Over 73% of the grid cells showed zero submissions, and the frequency distribution was
highly skewed to the right (Fig. 1).
We selected four environmental and four anthropogenic predictors per grid cell a priori (Table 1, Supple-
mentary Fig. S1), which were considered candidates to explain the variability of submission distribution and
numbers. Predictors were integrated as spatial raster values according to the response variable’s raster extent. The
variable ‘population’ was chosen because numerous previous studies in citizen science data have shown a strong
positive relationship between total human population and the number of r ecords29,30, and we expected the same
for our data. The two variables ‘mean age’ and ‘proportion of women’ were used to test patterns in participant
Scientific Reports | (2021) 11:1356 | https://doi.org/10.1038/s41598-020-80365-3 2
Vol:.(1234567890)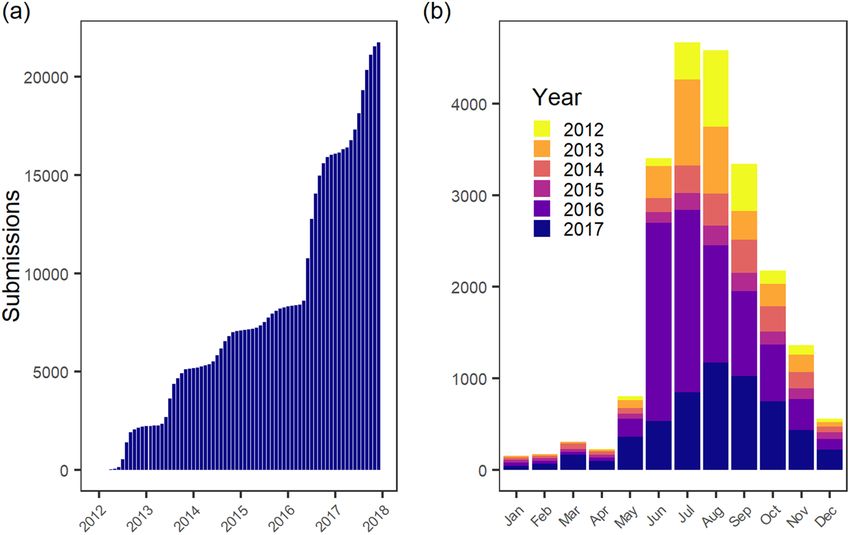
www.nature.com/scientificreports/
Figure 1. Histogram showing the numbers of grid cells on a log-transformed y-axis against the numbers of
submissions per grid cell (limited to 60).
Anthropogenic variable
Population (pop) Human population in 2011 within each grid cell
Population age (age) Mean age of human population within each grid cell in years
Proportion of women (fem) Mean proportion of women within each grid cell in percent
Grid cell within the federal states located in former political East Germany
Region (east)
(0 = no, 1 = yes)
Environmental variable
Temperature (temp) Mean temperature for March to November 2012 to 2017 in °C
Precipitation (preci) Mean precipitation for March to November 2012 to 2017 in mm
Wind speed (wind) Mean wind speed 10 m above ground 1981 to 2000 in m/s
Presence of water (water) Standing water bodies, floodplains or wetlands in grid cell (0 = no, 1 = yes)
Table 1. Set of variables pre-selected as predictors.
engagement according to demographic background. This selection builds on studies with partly contradic-
tory results which have investigated the age structure and gender of citizen s cientists41–44, giving us the idea of
uncovering large-scale trends through spatial analysis rather than through sociological and selective participant
surveys. As a fourth anthropogenic predictor, we created a binary variable that assigned the grid cells to former
political East or West Germany in order to investigate whether the project headquarters’ locations—both based
in federal states located in former East Germany—might affect the engagement of citizens and to test for general
and large-scale differences in demographic structure and climatic conditions. We selected the environmental
predictors that are generally important for the development and occurrence of the vast majority of mosquito
species. These include precipitation, temperature, wind speed and natural water bodies that might be suitable
for mosquito b reeding33. For the latter we used open hydrographical data from a Web Feature Service (WFS)45
of a range of hydrological landscape features and included stagnant waters as well as floodplains and wetlands
as areas presumably suitable for larval development. The preference for a binary variable over a numeric one or,
in other words, whether or not there is a water body in the grid cell in favour of percentage coverage, was based
on the assumption of a strong, positive correlation of the number of water bodies with submission numbers.
Percentages would lead to meaningless associations due to the nature of the project, e.g. a 100% coverage of the
grid cell with water would correlate with a maximum number of submissions, although no potential participants
could live there. Wind speed turned out to be an interesting environmental factor in previous studies on predict-
ing mosquito s pread26, as it induces flight restriction and therefore decreases the probability of a mosquito to
be caught. For example, Ae. japonicus has not yet been detected in German areas with an average wind speed
> 4.7 m/s, based on results from both passive and active surveillance schemes26. Data on human population,
mean age and proportion of women were derived from the German census in 2 01146, while the German Weather
Service47 (Deutscher Wetterdienst Climate Data Center) provided data on mean wind speed (1981–2000) as well
as on mean temperature and precipitation for March to November, from 2012 to 2017, to describe the climatic
conditions during the mosquito seasons.
The predictors were grouped into anthropogenic and environmental factors. This allowed us to consider (1)
the participants as a driving factor for submissions and (2) the effect of environmental variables on the occurrence
Scientific Reports | (2021) 11:1356 | https://doi.org/10.1038/s41598-020-80365-3 3
Vol.:(0123456789)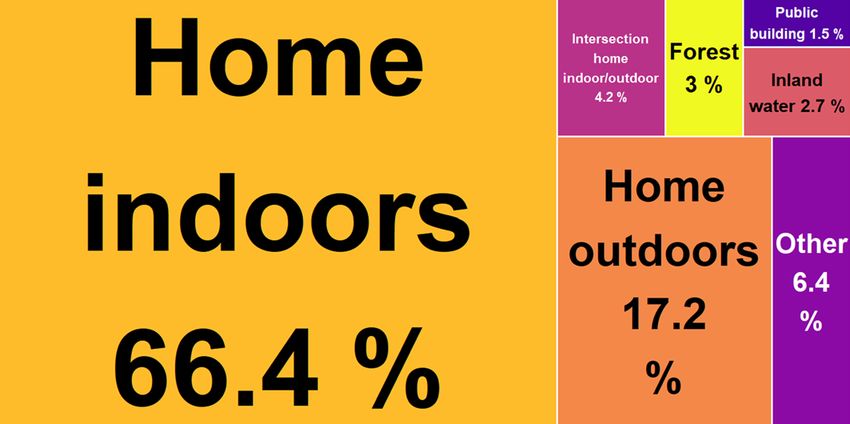
www.nature.com/scientificreports/

                                            Figure 2.  Temporal variation in submission numbers. (a) Cumulative submission numbers from 2012 to 2017.
                                            (b) Total number of submissions per month over all study years.

                                            of mosquitoes. However, this is a simplification of the ecological interactions of the underlying complex network,
                                            as every predictor might influence both participation behaviour and mosquito occurrence. For example, high
                                            wind speed might not only prevent mosquitoes from flying but also people from collecting mosquitoes outside,
                                            whereas a dense human population also provides a variety of habitats and hosts for container-breeding mos-
                                            quitoes. Raster files of response variable and predictors were built with packages sf48, leaflet49, raster50, rgdal51
                                            and spatstat52.

                                            Statistical analysis. Predictors were applied to fit hurdle models using either the probability of a zero
                                            count (binomial) or the number of submissions per grid cell (truncated negative binomial), accounting for over-
                                            dispersion and excess zeros in the data. Multicollinearity was checked by calculating variance inflation factors
                                            (VIF) and, consequently, the predictors ‘mean age’ and ‘temperature’ with returned values > 5 were removed. The
                                            hurdle models allowed us to examine whether a certain set of predictors has an effect on (1) the probability of
                                            a non-zero count in the zero and (2) the number of submissions in the count part. All possible combinations of
                                            predictors were explored for both modelling parts using Automated Model Selection (AMS; command dredge in
                                            R package MuMIn) that ranks models by AIC and Akaike’s model weight. Models were selected and realised by
                                            the R packages car53, countreg54, MuMIn55, MASS56 and pscl57.

                                            Ethical approval. Ethical approval was not required because the collected data were anonymised, location
                                            data were aggregated and further processed without geo-referencing. The use of personal data complies with the
                                            EU General Data Protection Regulations; no personal sensitive information was obtained during this project or
                                            shared outside of the research team.

                                            Informed consent. Insect samples were provided voluntarily by citizen scientists after consent was given to
                                            the processing of the sender data according to EU General Data Protection Regulation.

                                            Results
                                            Characteristics of and temporal variation in submissions. Between January 23, 2012 (first submis-
                                            sion to ‘Mückenatlas’) and December 31, 2017, a total of 21,768 submissions from 11,277 locations (geo-coor-
                                            dinates) in 3221 municipalities were received. The number of specimens sent to the ‘Mückenatlas’ in the above
                                            time period adds up to 110,581; 3950 additional samples of arthropods submitted did not belong to the family
                                            Culicidae and were excluded from the study. Some submissions included several hundreds of specimens of the
                                            same species. This explains the difference between number of submissions recorded in the database and total
                                            species count, as we only created one CULBASE entry per species and submission, independently of the count
                                            which is recorded as a covariate. 2016 and 2017 represent the most productive years with 7756 (35.6% of all
                                            submissions from 2012–2017) and 5730 (26.3%) submissions, respectively, with June 2016 holding the monthly
                                            record of 2163 (9.9%) submissions (Fig. 2a). When submissions are added up according to month for the total
                                            observation period, most mosquitoes were submitted in July (4674, 21.5%), followed by August (4583, 21.1%),
                                            June (3405, 15.6%) and September (3341, 15.4%). The autumn months October and November still exhibit over
                                            1000 submissions each, and are followed by a considerable decline during winter and spring, before submission
                                            numbers rise again in May (Fig. 2b).

          Scientific Reports |   (2021) 11:1356 |                https://doi.org/10.1038/s41598-020-80365-3                                                    4

Vol:.(1234567890)
www.nature.com/scientificreports/
Figure 3. Proportional treemap of categorised participants’ biotope information showing the
overrepresentation of submissions from private surroundings. Only biotopes with portions ≥ 1.5% are presented
individually, categories with a smaller share have been combined into ‘other’. Plotted with package treemap in R
version 3.5.2.
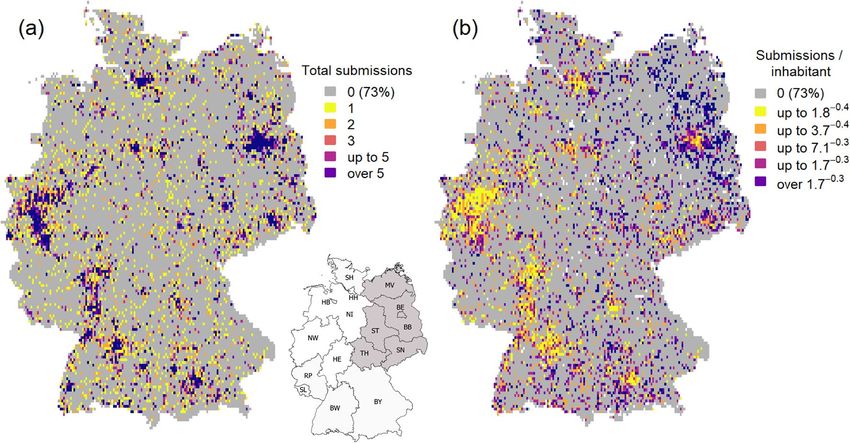
Figure 4. Federal states of Germany (SH Schleswig-Holstein, HH Hamburg, HB Bremen, NI Lower Saxony,
NW North Rhine-Westphalia, HE Hesse, RP Rhineland Palatinate, SL Saarland, BW Baden-Wuerttemberg, BY
Bavaria, MV Mecklenburg Western-Pomerania, BB Brandenburg, BE Berlin, ST Saxony-Anhalt, SN Saxony,
TH Thuringia). (a) Raster grid of Germany (5 × 5 km2 cell size) of total submission numbers. (b) Raster grid
of Germany (5 × 5 km2 cell size) showing per-capita submission rates (white grid cells = zero submission and
zero/invalid population data). Both raster maps were created in R version 3.5.2., the German map outlining
the federal states was drawn using QGis version 3.4.2. (Quantum GIS Geographic Information System, Open
Source Geospatial Foundation Project. http://www.qgis.org/en/site/).
Almost every participant (92.9%, not applicable = 7.1%) provided information about the collection site, so
that biotope descriptions could be considered during data analysis. According to the CORINE Land Cover Data
level 3, most mosquitoes were caught in ‘discontinuous urban fabric’ (12,718, 58.4%), ‘non-irrigated arable land’
(3237, 14.9%) and ‘pastures’ (1247, 5.7%). In agreement, the most frequent specification of the collection sites
as provided by the participants were ‘home indoors’ (13,305, 66.4%), followed by ‘home outdoors’ (e.g. garden,
backyard, court; 3446, 17.2%) and ‘intersection home indoors/outdoors’ (e.g. house walls, windows, entrance
doors; 839, 4.2%) (Fig. 3).
Engagement hotspots in submission distribution. We further investigated the effect of ‘population’,
as the map of total submission numbers strongly resembles a German human population map (Fig. 4a), with
grid cells in densely populated areas, such as Berlin, Hamburg, Munich, the Ruhrgebiet and the Main-Neckar
area displaying extremely high submission numbers. To disclose regions with high engagement independently
of human population, we calculated a raster with per-capita submission rate, defined as number of submissions
Scientific Reports | (2021) 11:1356 | https://doi.org/10.1038/s41598-020-80365-3 5
Vol.:(0123456789)www.nature.com/scientificreports/
Count hurdle model predictors (truncated negbin Zero hurdle model predictors (binomial with logit
with log link) link) Delta-AIC AIC weight
+ pop + east + water − preci − wind + pop + east + water + fem − wind 0 0.328
+ pop + east + water (+ fem) − preci − wind + pop + east + water + fem − wind 0.055 0.319
+ pop + east + water − preci − wind + pop + east + water + fem (+ preci) − wind 1.320 0.170
+ pop + east + water (+ fem) − preci − wind + pop + east + water + fem (+ preci) − wind 1.374 0.165
Table 2. Best ranked models according to Akaike’s model weight (cumulative AIC weight > 0.95). Each of the
algebraic signs indicates a positive or negative association of predictors (pop = human population, east = binary,
region of former political East or West Germany, water = binary, presences of stagnant water bodies,
fem = proportion of women, preci = mean precipitation (March to Nov, 2012 to 2017), wind = mean wind speed
(1981 to 2000) with submission numbers. In brackets: predictors not present in all of the best models.
per person, based on the total human population in the respective grid cell. The resulting map (Fig. 4b) exhibits
a considerably higher per-capita submission rate for eastern and south-eastern regions with a core area around
the capital of Berlin, whereas the western part of the country stands behind. Although ranking first in absolute
submission numbers (3119, 14.3%), the federal state of North-Rhine Westphalia as the most densely populated
German region results in a low per-capita submission rate. People from Brandenburg (3075, 14.1%) and Bavaria
(2917, 13.4%), both less densely populated federal states, participate more often, with a peak of 250 submissions
in one of the two project’s hometowns, Müncheberg in Brandenburg (population: 6783), located approximately
50 km east of Berlin. To check if these hotspots are due to urban dwellers making trips to these areas rather
than local residents, an additional analysis with entries coming exclusively from the participants’ homes or gar-
dens was conducted. The corresponding map (Supplementary Fig. S2) shows that the hotspot density becomes
weaker, indicating that indeed some participants seem to be travelling from urban to rural areas to catch mos-
quitoes. Nonetheless, the pattern of greater involvement in the above-mentioned residential areas remains.
Distribution patterns by hurdle models applying anthropogenic and environmental predic‑
tors. The engagement hotspots suggest that the non-random distribution of submissions might also be
caused by further anthropogenic and environmental variables, whose associations were therefore tested using
hurdle models. A predictor was considered important when included in the four best ranked models based on
the Automated Model Selection (AMS) with an accumulated AIC weight > 0.95 (Table 2). As expected from
the previous analysis on engagement hotspots, the number of people living in a grid cell has an effect on both
whether there is a submission and how many. Indeed, ‘population’ is included in both parts of the best 995
models (24.9%) calculated by AMS (Supplementary Table S2 for complete AMS output). ’Region’ (East or West
Germany), ‘presence of water bodies’ as well as ‘wind speed’ were also meaningful predictors of both submission
numbers and submission probability. The importance of proportion of women and precipitation differs for each
part of the hurdle models. Precipitation negatively affects the number, but not the probability of submissions.
Conversely, the proportion of women in a grid cell may increase the probability of a submission from that unit,
but does not influence record numbers.
To further explore relationships between predictors and response variables, we plotted the predictor values
against the submission counts (Fig. 5). In accordance to model output, the resulting plots show a positive effect
of human population and proportion of women on recordings, whereas increasing mean precipitation and mean
wind speed per grid cell result in fewer submissions. The plots for mean age and mean temperature, both excluded
from modelling due to multicollinearity, suggest a slightly and strongly positive association with submission
numbers, respectively.
Discussion
With the tremendous and continuous numbers of mosquito submissions received between 2012 and 2017, the
‘Mückenatlas’ is one of the most popular and successful citizen science projects in Germany. For the first time,
we analysed the underlying dataset to characterise the origin and structure of the submissions, to reveal major
spatial and temporal trends in submission numbers and to investigate what might drive these patterns.
The main characteristics of the data are the overrepresentation of indoor samples from the participants’ homes
off densely populated areas. As shown in previous studies summarising popular citizen science projects focused
on arthropods58,59, the ‘Mückenatlas’ participants seem to be genuinely interested in arthropods present in and
around their homes. This interest is not confined to mosquitoes, as the participants’ messages on the submis-
sion forms indicate that the roughly 20% non-mosquito samples might be sent on purpose when people fail to
identify a species they are curious about or suspect to be a pest. Such behaviour substantiates the high potential
and success of large-scale and cross-taxonomic citizen science projects such as iNaturalist and supports the idea
of a global community of citizen scientists recording species around their h omes60.
It is of advantage to receive specimens found in the direct neighbourhood of people, as private properties
are not directly accessible for scientists and at the same time highly important for r esearch60. From a public
health point of view submissions from people’s homes are of greater epidemiological relevance when address-
ing (arthropod-) vector-borne d iseases61 than rare species in non-inhabited areas; the latter are more valuable
for biodiversity research31,62. From a data science perspective, the over- and underrepresentation of certain
Scientific Reports | (2021) 11:1356 | https://doi.org/10.1038/s41598-020-80365-3 6
Vol:.(1234567890)www.nature.com/scientificreports/
Figure 5. Scatterplots of the six non-factor predictors plotted against the number of submissions on a log-
transformed y-axis. In the case of ‘population’, both axes are log-transformed. The yellow and black diamonds
indicate average values per submission frequency.
land-use types create a spatial bias in the presence-only data to be considered when it comes to species distribu-
tion modelling26,29,63.
Our analysis to identify temporal trends revealed a noticeable variation in submission numbers over the
years and months. The boost in submission numbers in 2016 may be the result of an increased public aware-
ness of mosquito-borne d iseases64, caused by an extensive flood of news about the South-American ZIKA virus
epidemic, possibly triggering the maximum of recordings in June 2016 and sustained high numbers into 2017.
We believe people became worried about mosquitoes in their living environment and—in a way of self-pro-
visioning—approached the ‘Mückenatlas’ as an authority that could dissipate their concerns. In addition, the
warm and humid weather in both 2016 and 2017 created beneficial conditions for many mosquito species in
large parts of the country. This favourable climatic situation combined with the continuing public attention
fuelled by the media may have kept the submission numbers high until the end of 2017. Temporal variation in
citizens’ observation records can c onfirm65 or e xtend66 findings on the phenology of the target species. In our
case, the records even reflect those mosquitoes that enter people’s homes in October and November to find an
overwintering place, such as Culiseta annulata.
Based on the hurdle models we demonstrated how anthropogenic and environmental predictors relate to the
spatial distribution of submissions. The positive correlation of human population with submission numbers was
expected, especially since the visualisation revealed a spatial pattern of urban clusters known from other citizen
science projects29,30. After controlling for the influence of human population, engagement hotspots became appar-
ent in East Germany, predominantly in the sparsely populated federal states of Brandenburg and Mecklenburg-
Western Pomerania67. This finding is corroborated by the models’ estimated positive association of the predictor
‘east’ with submission numbers. In other words, a location in former East Germany increases the number and
probability of submissions. We attributed this trend to the project’s institutional homes in Brandenburg and
Mecklenburg-Western Pomerania: frequent regional media coverage and participation in regional (science)
events may create a headquarter effect that leads to a strong project support and identification by local communi-
ties. Newman et al.68 discovered that place-related effects play a considerable role in citizen scientists’ motivations
to participate, especially in programmes using volunteer data for conservation decisions. This ‘power of place’68
may even present a stronger driver for participation than citizen concerns about invasive species: of the regions
invaded by Ae. japonicus and Ae. albopictus, only the infested Southwest showed an increased engagement.
Considering the third investigated anthropogenic effect included in the models, a higher proportion of women
per grid cell positively affects participation, but only the odds of a submission, not the number of submissions.
However, it would be premature to conclude that women are more likely to contribute to the ‘Mückenatlas’. Much
more information is needed to test associations of submissions with the participants’ demographic background,
for instance to check if this weak positive correlation is due to the female surplus in urban areas.
Our model estimates imply that submission numbers could partly reflect environmental conditions. The pres-
ence of water is one key factors of mosquito development and o ccurrence33, suggesting the positive correlation
for both model parts may not only be due to a higher probability of encountering mosquitoes near breeding
Scientific Reports | (2021) 11:1356 | https://doi.org/10.1038/s41598-020-80365-3 7
Vol.:(0123456789)www.nature.com/scientificreports/
habitats, but also in larger numbers. The prevalence of water bodies in the north-eastern part of Germany might
further contribute to the stronger engagement in this area, where—contrary to other regions with similar land-
scape features69—management actions are not carried out (e.g. large-scale application of Bacillus thuringiensis
israelensis by helicopter along sections of the river Rhine).
Of the environmental variables that negatively relate to the number of submissions, wind speed affects both
the number and probability of submissions, because the absence or inactivity of mosquitoes in breezy coastal or
mountainous regions is likely to result in few mosquito encounters. More surprising is the inverse correlation
of precipitation with only submission counts, as mosquito breeding depends on the availability of water, with
small natural sites such as tree holes or small ponds strongly prone to desiccation. Yet most submissions came
from people’s private surroundings, houses or gardens, and therefore from areas that could have persisting water
sources independent of precipitation. People inadvertently tend to create perfect mosquito habitats by garden
design and irrigation, and the topmost mosquito taxa submitted to the ‘Mückenatlas’ (Culex pipiens complex,
Cs. annulata or Ae. japonicus), readily breed in garden ponds and in a range of artificial containers such as
water-filled rain barrels, flower-pot dishes, vases or bird baths70,71. The exclusive association of precipitation with
submission counts again indicates a possible relationship with engaged communities in the north-eastern part
of Germany, where precipitation is lower compared to the rest of the country72.
We aimed at reflecting mosquito seasonality by calculating the overall mean of precipitation (and tempera-
ture) from March to November for the years 2012 to 2017. While adequate for a first exploration of driving fac-
tors as conducted in this study, this simplification would be insufficient and inexact for predicting submission
numbers, given the likely influence of climate on their temporal variation (as already discussed). Instead of using
the standard approach with weather variables like seasonal means, modelling the distribution of submissions
and also of species, could be improved by variable decomposition to allow for inherent spatio-temporal fluctua-
tions as well as for a nomalies73, which would be especially useful to account for the phenology of semi-aquatic
arthropods like mosquitoes.
Conclusions
The ‘Mückenatlas’ is an analogue citizen science project open to everyone, without any preparation or constraints
like collection kits, educational training or sampling protocols. This study lays the foundation to future applica-
tions of this specific opportunistic dataset that does not struggle with data quality, but displays massive spatio-
temporal variation in citizen submissions of mosquito samples. Although environmental factors do play their
part in spatio-temporal variation of ‘Mückenatlas’ submissions, it is the citizens and their recording activities
that primarily shape the data.
Our findings have five important implications for (mosquito-related) citizen science monitoring projects.
First, an unstructured, opportunistic programme such as the ‘Mückenatlas’ is well suited to collect data from
several taxa over a long period of time and over a large area in order to mitigate uncontrollable effects such as
climate variability, which, in the case of mosquitoes, strongly influences their occurrence and abundance. In
contrast, studies on a smaller spatial scale, for specific species or habitats, or over a shorter period of time, would
benefit from a structured approach to better anticipate the spatio-temporal effects of environmental factors
through sampling protocols or pre-selection of place and time.
Second, the main anthropogenic causes of spatial bias in opportunistic data collections are human population
and the preference of citizens to take part in projects that allow data collection at home or close by74. Citizen
science monitoring programmes can prepare for this urban clustering and overrepresentation of observations
from artificial surfaces by adapting protocol design and regulating the recruitment of participants (e.g. by creating
sample units with fixed numbers of participants), by clearly defining their research questions and project goals,
and by developing strategies for appropriate data a nalysis75,76.
Third, more engaged communities cause spatial bias, but these location-based effects could also be used to
the advantage of the project, e.g. in the case of mosquito-related citizen science projects to tap local knowledge
about mosquito a bundance77.
Fourth, due to their impact on human health and well-being, mosquitoes are a regular media topic in many
countries. The rush for the ‘Mückenatlas’ in 2016, probably triggered by the ZIKA epidemic, demonstrate the
influence of the media, but also emphasise the usefulness of media for citizen science, whether for general
recruitment, as a specific appeal for a particular region (e.g. on the frontline of an invader’s spread) or to draw
attention to certain species of scientific interest. Eritja et al.78 used the media and place-based effects to activate
the local community to search for Ae. japonicus after a first record in northern Spain.
Finally, if the data situation is suitable, a hurdle model can be used to test if certain variables influence the
number and/or probability of an observation. This could be done, for example, in the improvement or planning
of citizen science projects, e.g. by taking additional, more targeted measures to recruit from areas for which the
model predicts low participation. By including demographic information, we tested the applicability in large-
scale spatial modelling in the context of citizen science. Although the approach is promising for identifying bias
caused by national demographic trends, it cannot replace the accuracy of a social science survey of participants.
For example, it would then also be possible to find out whether stronger regional engagement is associated with
the attitude towards participatory formats of former citizens of East versus West Germany.
This study and many existing and emerging citizen science projects show that the public can provide valu-
able support in monitoring biodiversity, also of arthropod vectors, but there is still great potential to develop
methods to improve data robustness.
Scientific Reports | (2021) 11:1356 | https://doi.org/10.1038/s41598-020-80365-3 8
Vol:.(1234567890)www.nature.com/scientificreports/
Data availability
For the time being, the raw data used for this study cannot be provided publicly, as the geo-references are con-
nected with the participants’ home addresses. Sharing the raw data would violate the personal privacy of the
citizen scientists. However, the subset of spatial data (raster) used for modelling submission counts is available
via the Open Research Data repository at the Leibniz-Centre for Agricultural Landscape Research (ZALF),
Germany, https://www.doi.org/10.4228/ZALF.DK.153.
Received: 21 May 2020; Accepted: 27 November 2020
References
1. Paupy, C., Delatte, H., Bagny, L., Corbel, V. & Fontenille, D. Aedes albopictus, an arbovirus vector: From the darkness to the light.
Microbes Infect. 11, 1177–1185 (2009).
2. Scholte, E. J. & Schaffner, F. Waiting for the tiger: Establishment and spread of the Aedes albopictus mosquito in Europe. In Emerg-
ing Pests and Vector-Borne Diseases in Europe (eds Takken, W. & Knols, B. G. J.) 241–260 (Wageningen Academic Publishers,
Wageningen, 2007).
3. Kraemer, M. U. G. et al. Past and future spread of the arbovirus vectors Aedes aegypti and Aedes albopictus. Nat. Microbiol. 4,
854–863. https://doi.org/10.1038/s41564-019-0376-y (2019).
4. Kuhlisch, C., Kampen, H. & Walther, D. The Asian tiger mosquito Aedes albopictus (Diptera: Culicidae) in Central Germany:
Surveillance in its northernmost distribution area. Acta Trop. 188, 78–85 (2018).
5. Kampen, H. & Walther, D. Vector potential of mosquito species (Diptera: Culicidae) occurring in Central Europe. In Mosquito-
borne Diseases: Implications for Public Health, Parasitol. Res. Monogr. Vol. 10 (eds Benelli, G. & Mehlhorn, H.) 41–68 (Springer,
Heidelberg, 2018).
6. Kampen, H., Schuhbauer, A. & Walther, D. Emerging mosquito species in Germany—A synopsis after 6 years of mosquito moni-
toring (2011–2016). Parasitol. Res. 116, 3253–3263 (2017).
7. Ziegler, U. et al. West Nile virus epidemic in Germany triggered by epizootic emergence, 2019. Viruses 12, 448. https://doi.
org/10.3390/v12040448 (2020).
8. Sullivan, B. L. et al. The eBird enterprise: An integrated approach to development and application of citizen science. Biol. Conserv.
169, 31–40 (2014).
9. Oltra, A., Palmer, J. R. B. & Bartumeus, F. AtrapaelTigre.com: Enlisting citizen-scientists in the war on tiger mosquitoes. In Euro-
pean Handbook of Crowdsourced Geographic Information (eds Capineri, C. et al.) 295–308 (Ubiquity Press, London, 2016).
10. Heigl, F., Horvath, K., Laaha, G. & Zaller, J. G. Amphibian and reptile road-kills on tertiary roads in relation to landscape structure:
Using a citizen science approach with open-access land cover data. BMC Ecol. 17, 24. https://doi.org/10.1186/s12898-017-0134-z
(2017).
11. Walther, D. & Kampen, H. The citizen science project “Mueckenatlas” helps monitor the distribution and spread of invasive mos-
quito species in Germany. J. Med. Entomol. 54, 1790–1794 (2017).
12. Pocock, M. J. O., Roy, H. E., Fox, R., Ellis, W. N. & Botham, M. Citizen science and invasive alien species: Predicting the detection
of the oak processionary moth Thaumetopoea processionea by moth recorders. Biol. Conserv. 208, 146–154 (2017).
13. Kampen, H., Kronefeld, M., Zielke, D. & Werner, D. Further specimens of the Asian tiger mosquito Aedes albopictus (Diptera,
Culicidae) trapped in Southwest Germany. Parasitol. Res. 112, 905–907 (2013).
14. Kampen, H., Kuhlisch, C., Fröhlich, A., Scheuch, D. E. & Walther, D. Occurrence and spread of the invasive Asian bush mosquito
Aedes japonicus japonicus (Diptera: Culicidae) in West and North Germany since detection in 2012 and 2013, respectively. PLoS
ONE 11, e0167948. https://doi.org/10.1371/journal.pone.0167948 (2016).
15. Walther, D., Scheuch, D. E. & Kampen, H. The invasive Asian tiger mosquito Aedes albopictus (Diptera: Culicidae) in Germany:
Local reproduction and overwintering. Acta Trop. 166, 186–192 (2017).
16. Werner, D. & Kampen, H. Aedes albopictus breeding in southern Germany, 2014. Parasitol. Res. 114, 831–834 (2015).
17. Zielke, D. E., Walther, D. & Kampen, H. Newly discovered population of Aedes japonicus japonicus (Diptera: Culicidae) in upper
Bavaria, Germany, and Salzburg, Austria, is closely related to the Austrian/Slovenian bush mosquito population. Parasit. Vectors
9, 163. https://doi.org/10.1186/s13071-016-1447-z (2016).
18. Kampen, H., Jansen, S., Schmidt-Chanasit, J. & Walther, D. Indoor development of Aedes aegypti in Germany, 2016. Euro Surveill.
21, 30407. https://doi.org/10.2807/1560-7917.ES.2016.21.47.30407 (2016).
19. Werner, D., Zielke, D. E. & Kampen, H. First record of Aedes koreicus (Diptera: Culicidae) in Germany. Parasitol. Res. 115,
1331–1334 (2016).
20. Kampen, H., Kronefeld, M., Zielke, D. & Werner, D. Three rarely encountered and one new Culiseta species (Diptera: Culicidae)
in Germany. J. Eur. Mosq. Control Assoc. 31, 36–39 (2013).
21. Kampen, H., Kronefeld, M., Zielke, D. & Werner, D. Some new, rare and less frequent mosquito species (Diptera, Culicidae) recently
collected in Germany. Mitt. Dtsch. Ges. Allg. Angew. Ent. 19, 123–130 (2014).
22. Isaac, N. J. B. et al. Statistics for citizen science: Extracting signals of change from noisy ecological data. Methods Ecol. Evol. 5,
1052–1060 (2014).
23. Kuhlisch, C., Kampen, H. & Werner, D. On the distribution and ecology of Culiseta (Culicella) ochroptera (Peus) (Diptera: Culi-
cidae) in Germany. Zootaxa 4576, 544–558 (2019).
24. Heym, E. C., Schröder, J., Kampen, H. & Walther, D. The nuisance mosquito Anopheles plumbeus (Stephens, 1828) in Germany—
A questionnaire survey may help support surveillance and control. Front. Public Health 5, 278. https://doi.org/10.3389/fpubh
.2017.00278(2017).
25. Zielke, D. Population genetics and distribution of the invasive mosquito Aedes japonicus japonicus (Diptera: Culicidae) in Germany
and Europe (Ph.D. thesis, University of Greifswald, 2015).
26. Kerkow, A. et al. What makes the Asian bush mosquito Aedes japonicus japonicus feel comfortable in Germany? A fuzzy modelling
approach. Parasit. Vectors 12, 106. https://doi.org/10.1186/s13071-019-3368-0 (2019).
27. Boakes, E. H. et al. Patterns of contribution to citizen science biodiversity projects increase understanding of volunteers’ recording
behaviour. Sci. Rep. 6, 33051. https://doi.org/10.1038/srep33051 (2016).
28. Seymour, V. & Haklay, M. Exploring engagement characteristics and behaviours of environmental volunteers. Citiz. Sci. Theory
Pract. 2, 5. https://doi.org/10.5334/cstp.66 (2017).
29. Mair, L. & Ruete, A. Explaining spatial variation in the recording effort of citizen science data across multiple taxa. PLoS ONE 11,
e0147796. https://doi.org/10.1371/journal.pone.0147796 (2016).
30. Tiago, P., Ceia-Hasse, A., Marques, T. A., Capinha, C. & Pereira, H. M. Spatial distribution of citizen science casuistic observations
for different taxonomic groups. Sci. Rep. 7, 12832. https://doi.org/10.1038/s41598-017-13130-8 (2017).
31. Chandler, M. et al. Contributions to publications and management plans from 7 years of citizen science: Use of a novel evaluation
tool on Earthwatch-supported projects. Biol. Conserv. 208, 163–173 (2017).
Scientific Reports | (2021) 11:1356 | https://doi.org/10.1038/s41598-020-80365-3 9
Vol.:(0123456789)www.nature.com/scientificreports/
32. Kelling, S. et al. Taking a “Big Data” approach to data quality in a citizen science project. Ambio 44, 601–611 (2015).
33. Becker, N. et al. Mosquitoes and Their Control (Springer, Heidelberg, 2010).
34. Schaffner, F. et al. The Mosquitoes of Europe. An Identification and Training Programme (CD-Rom) (IRD Éditions & EID Méditer-
rannée, Montpellier, 2001).
35. Heym, E. C., Kampen, H. & Walther, D. Mosquito species composition and phenology (Diptera, Culicidae) in two German zoo-
logical gardens imply different risks of mosquito-borne pathogen transmission. J. Vector Ecol. 43, 80–88 (2018).
36. European Union, Copernicus Land Monitoring Service. (European Environment Agency (EEA), 2012).
37. Wickham, H. ggplot2: Elegant Graphics for Data Analysis (Springer, New York, 2016).
38. Tennekes, M. treemap: Treemap Visualization. R package version 2.4-2 (2017).
39. Comtois, D. summarytools: Tools to Quickly and Neatly Summarize Data. R package version 0.9.3 (2019).
40. R Core Team. R: A Language and Environment for Statistical Computing (R Foundation for Statistical Computing, Vienna, 2018).
41. Alender, B. Understanding volunteer motivations to participate in citizen science projects: A deeper look at water quality monitor-
ing. J. Sci. Commun. 15, A04. https://doi.org/10.22323/2.15030204 (2016).
42. Domroese, M. C. & Johnson, E. A. Why watch bees? Motivations of citizen science volunteers in the Great Pollinator Project. Biol.
Conserv. 208, 40–47 (2017).
43. Geoghegan, H., Dyke, A., Pateman, R., West, S. & Everett, G. Understanding Motivations for Citizen Science. Final report on behalf
of UKEOF (University of Reading, Stockholm Environment Institute (University of York) and University of the West of England,
2016).
44. Land-Zandstra, A. M., Devilee, J. L., Snik, F., Buurmeijer, F. & van den Broek, J. M. Citizen science on a smartphone: Participants’
motivations and learning. Public Underst. Sci. 25, 45–60 (2016).
45. GeoBasis-DE/BKG. Bundesamt für Kartographie und Geodäsie. WFS service. http://sg.geodatenzentrum.de/wfs_dlm250_inspi
re?request=GetCapabilities&service=wfs (2019).
46. Statistisches Bundesamt, Wiesbaden. https://ergebnisse.zensus2011.de/ (2015).
47. Deutscher Wetterdienst (German Weather Service, single values averaged). https: //openda ta.dwd.de/climat e_enviro nment / (2020).
48. Pebesma, E. Simple Features for R: Standardized support for spatial vector data. R J. 10, 439–446. https: //doi.org/10.32614/ rj-2018-
009 (2018).
49. Cheng, J., Karambelkar, B. & Xie, Y. leaflet: Create Interactive Web Maps with the JavaScript ’Leaflet’ Library. R package version
2.0.3 (2019).
50. Hijmans, R. J. raster: Geographic Data Analysis and Modeling. R package version 2.8-19 (2019).
51. Bivand, R., Keitt, T. & Rowlingson, B. rgdal: Bindings for the ’Geospatial’ Data Abstraction Library. R package version 1.4-3 (2019).
52. Baddeley, A., Rubak, E. & Turner, R. Spatial Point Patterns: Methodology and Applications with R (Chapman and Hall/CRC Press,
Boca Raton, 2015).
53. Fox, J. & Weisberg, S. An R Companion to Applied Regression (Sage, Thousand Oaks, 2019).
54. Kleiber, C. & Zeileis, A. countreg: Count Data Regression. R package version 0.2-1 (2016).
55. Barton, K. MuMIn: Multi-model Inference. R package version 1.43.6 (2019).
56. Venables, W. N. & Ripley, B. D. Modern Applied Statistics with S (Springer, New York, 2002).
57. Zeileis, A., Kleiber, C. & Jackman, S. Regression models for count data in R. J. Stat. Softw. https://doi.org/10.18637/jss.v027.i08
(2008).
58. Bertone, M. A. et al. Arthropods of the great indoors: Characterizing diversity inside urban and suburban homes. PeerJ 4, e1582.
https://doi.org/10.7717/peerj.1582 (2016).
59. Epps, M. J., Menninger, H. L., LaSala, N. & Dunn, R. R. Too big to be noticed: Cryptic invasion of Asian camel crickets in North
American houses. PeerJ 2, e523. https://doi.org/10.7717/peerj.523 (2014).
60. Dunn, R. R. & Beasley, D. E. Democratizing evolutionary biology, lessons from insects. Curr. Opin. Insect Sci. 18, 89–92 (2016).
61. Hamer, S. A., Curtis-Robles, R. & Hamer, G. L. Contributions of citizen scientists to arthropod vector data in the age of digital
epidemiology. Curr. Opin. Insect Sci. 28, 98–104 (2018).
62. Freitag, H., Pangantihon, C. V. & Njunjic, I. Three new species of Grouvellinus Champion, 1923 from Maliau Basin, Sabah, Borneo,
discovered by citizen scientists during the first Taxon Expedition (Insecta, Coleoptera, Elmidae). ZooKeys 754, 1–21 (2018).
63. Higa, M. et al. Mapping large-scale bird distributions using occupancy models and citizen data with spatially biased sampling
effort. Divers. Distrib. 21, 46–54 (2015).
64. Caputo, B. et al. ZanzaMapp: A scalable citizen science tool to monitor perception of mosquito abundance and nuisance in Italy
and beyond. Int. J. Environ. Res. Public Health 17, 7872 (2020).
65. Curtis-Robles, R., Wozniak, E. J., Auckland, L. D., Hamer, G. L. & Hamer, S. A. Combining public health education and disease
ecology research: Using citizen science to assess Chagas disease entomological risk in Texas. PLoS Negl. Trop. Dis. 9, e0004235.
https://doi.org/10.1371/journal.pntd.0004235 (2015).
66. Soroye, P., Ahmed, N. & Kerr, J. T. Opportunistic citizen science data transform understanding of species distributions, phenology,
and diversity gradients for global change research. Glob. Change Biol. 24, 5281–5291 (2018).
67. Statistisches Bundesamt. Bevölkerungsdichte (Einwohner je k m2) in Deutschland nach Bundesländern zum 31. Dezember 2019
(Statista GmbH, 2020).
68. Newman, G. et al. Leveraging the power of place in citizen science for effective conservation decision making. Biol. Conserv. 208,
55–64 (2017).
69. Becker, N. Microbial control of mosquitoes: Management of the upper Rhine mosquito population as a model programme. Para-
sitol. Today 13, 485–487 (1997).
70. Peus, F. Beiträge zur Faunistik und Ökologie der einheimischen Culiciden. I. Teil. Zeitschr. Desinfekt. 21(76–81), 92–98 (1929).
71. Vezzani, D. Artificial container-breeding mosquitoes and cemeteries: A perfect match. Trop. Med. Int. Health 12, 299–313 (2007).
72. Scharnweber, T. et al. Drought matters—declining precipitation influences growth of Fagus sylvatica L. and Quercus robur L. in
north-eastern Germany. Forest Ecol. Manag. 262, 947–961 (2011).
73. Oedekoven, C. S. et al. Attributing changes in the distribution of species abundance to weather variables using the example of
British breeding birds. Methods Ecol. Evol. 8, 1690–1702 (2017).
74. Catlin-Groves, C. L. The citizen science landscape: From volunteers to citizen sensors and beyond. Int. J. Zool. 2012, 349630 (2012).
75. Kelling, S. et al. Using semistructured surveys to improve citizen science data for monitoring biodiversity. Bioscience 69, 170–179
(2019).
76. Weiser, E. L. et al. Balancing sampling intensity against spatial coverage for a community science monitoring programme. J. Appl.
Ecol. 56, 2252–2263 (2019).
77. Mwangungulu, S. P. et al. Crowdsourcing vector surveillance: Using community knowledge and experiences to predict densities and
distribution of outdoor-biting mosquitoes in rural Tanzania. PLoS ONE 11, e0156388. https: //doi.org/10.1371/journa l.pone.01563
88 (2016).
78. Eritja, R. et al. First detection of Aedes japonicus in Spain: An unexpected finding triggered by citizen science. Parasit. Vectors 12,
53. https://doi.org/10.1186/s13071-019-3317-y (2019).
Scientific Reports | (2021) 11:1356 | https://doi.org/10.1038/s41598-020-80365-3 10
Vol:.(1234567890)www.nature.com/scientificreports/
Acknowledgements
First and foremost, we thank all ‘Mückenatlas’ project participants for their submissions. We are also grateful to
the laboratory staff and the Ph.D. students of the Leibniz Centre for Agricultural Landscape Research, Münche-
berg, Germany, and of the Friedrich-Loeffler-Institut, Greifswald, Germany, involved in the various monitor-
ing projects, and to Stefan Kowalczyk, Institute of Epidemiology of the Friedrich-Loeffler-Institut, Greifswald,
Germany, for database maintenance. The authors thank Ronny Kuhnert (Robert-Koch-Institut, Berlin) and
Linus Früh for fruitful discussions about analysis strategies. This work was financially supported by the German
Federal Ministry of Food and Agriculture (BMEL) through the Federal Office for Agriculture and Food (BLE),
grant numbers grant numbers 2810HS022, 2819104615 and 2818SE001.
Author contributions
N.P. conceptualised the work, analysed and interpreted the data and prepared a draft of the manuscript. F.R. con-
tributed to data analysis, interpreted the data and revised the manuscript. J.M.J. provided advice, interpreted the
data and revised the manuscript. H.K. and D.W. designed the study, raised funds, provided the data, interpreted
the data and revised the manuscript. All authors contributed critically to the manuscript drafts.
Funding
Open Access funding enabled and organized by Projekt DEAL.
Competing interests
The authors declare no competing interests.
Additional information
Supplementary Information The online version contains supplementary material available at https://doi.
org/10.1038/s41598-020-80365-3.
Correspondence and requests for materials should be addressed to N.P.
Reprints and permissions information is available at www.nature.com/reprints.
Publisher’s note Springer Nature remains neutral with regard to jurisdictional claims in published maps and
institutional affiliations.
Open Access This article is licensed under a Creative Commons Attribution 4.0 International
License, which permits use, sharing, adaptation, distribution and reproduction in any medium or
format, as long as you give appropriate credit to the original author(s) and the source, provide a link to the
Creative Commons licence, and indicate if changes were made. The images or other third party material in this
article are included in the article’s Creative Commons licence, unless indicated otherwise in a credit line to the
material. If material is not included in the article’s Creative Commons licence and your intended use is not
permitted by statutory regulation or exceeds the permitted use, you will need to obtain permission directly from
the copyright holder. To view a copy of this licence, visit http://creativecommons.org/licenses/by/4.0/.
© The Author(s) 2021
Scientific Reports | (2021) 11:1356 | https://doi.org/10.1038/s41598-020-80365-3 11
Vol.:(0123456789)You can also read