Smart containment with active learning - Evidence from a data-driven rapid policy response - International Growth ...
←
→
Page content transcription
If your browser does not render page correctly, please read the page content below
Final report

Smart
containment
with active
learning
Evidence from a
data-driven rapid
policy response

Ahwaz Akhtar
Ali Cheema
Jishnu Das
Adnan Q Khan
Asim I Khwaja
Anum Malkani
Ahmad Mustafa

November 2020

When citing this paper, please
use the title and the following
reference number:
S-20053-PAK-1
Smart Containment with Active Learning:
Evidence from a Data-Driven Rapid Policy
Response to Covid-19 in Punjab
Ahwaz Akhtar, Ali Cheema, Jishnu Das, Adnan Q Khan, Asim I Khwaja, Anum Malkani, Ahmad
Mustafa*

November 2020

Abstract
The problem governments face in designing effective Covid-19 response measures is that there
is little data on potential health and economic impacts to figure out tradeoffs between choices
and to design a real-time, effective, and evidence-based response. For an effective policy
response, it is imperative that governments use data-driven and evidence-based policies that are
responsive to on-ground realities, understand the benefits and costs of various policy
interventions, and continuously refine policy measures. The Smart Containment with Active
Learning (SCALE) approach lays out an evidence-responsive Covid-19 response strategy that
seeks to minimize disease spread and limit adverse socio-economic impact by targeting response
to the current & projected level of prevalence in the smallest feasible geographical units.
Implementing SCALE requires large-scale testing to establish the level of prevalence in each area.
The SCALE Smart Testing strategy lays out an effective testing methodology allowing accurate
estimates of prevalence given limited testing capacity. The Smart Testing strategy was
implemented in Lahore, in collaboration with the Punjab Primary and Secondary Health
Department (P&SHD), over a two week period. The strategy was deployed at the census block
level and over 12,000 individuals were tested. The findings revealed substantial variation in
prevalence rates across census blocks suggesting that the infection spread was localized and a
localized policy response may be more effective. Other key findings include: women and the
elderly had higher rates of infection; 95% of those who tested positive did not display any
symptoms; likelihood of infection increases by pre-existing conditions and the fraction of nearby
people who are infected.

*We would also like to thank Captain (retd.) Usman Younis, Secretary Primary & Secondary Healthcare Department
and Muhammad Ajmal Bhatti, Special Secretary Primary & Secondary Healthcare Department and Focal Personal of
the Government of Punjab for their feedback.

Table of Contents

1.     Introduction ............................................................................................................................. 3
2.     Context .................................................................................................................................... 5
3.     Methodology ........................................................................................................................... 6
4.     Results from Analysis of Smart Sampling and Testing Data .................................................... 7
     4.1: Overall Prevalence and Spatial Variation ............................................................................ 8
     4.2: Prevalence Rates Over Time .............................................................................................. 10
     4.3: Prevalence Rates by Demographic Characteristics ........................................................... 12
     4.4: Prevalence Rates for Symptomatic and those with Pre-existing Conditions .................... 15
     4.5: What Predicts Covid-19 prevalence? A Multivariate Regression Analysis ........................ 17
     4.6: Testing Costs and Efficiency ............................................................................................... 20
5.     Policy Recommendations ...................................................................................................... 21
6.     Conclusion ............................................................................................................................. 22
Appendix A: SCALE Operational Plan ............................................................................................ 23
Appendix B: SCALE Smart Testing Strategy................................................................................... 25
Appendix C: Testing and Tracing Survey Instrument .................................................................... 30
Bibliography .................................................................................................................................. 41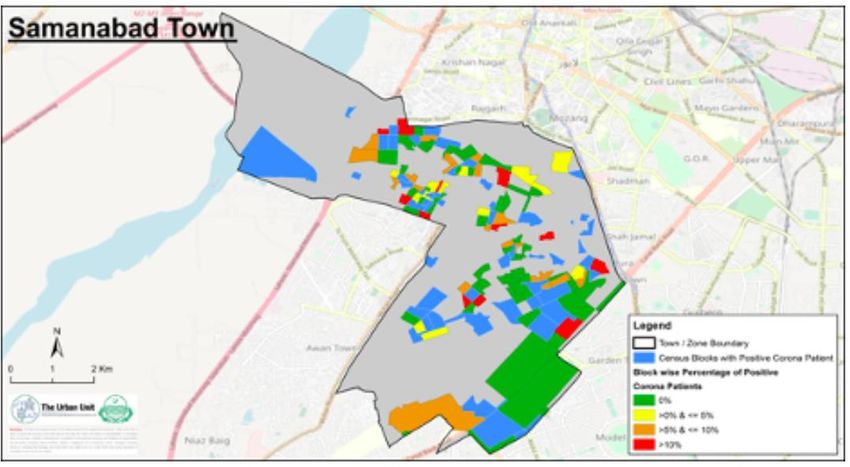
1. Introduction
Governments across the world have grappled with difficult policy questions in response to Covid-
19. What has made these policy decisions harder is the surprisingly limited knowledge we had
about Covid-19 at the outset. Past experiences, such as the 1918 Spanish Flu outbreak,
underscored the importance of early intervention with public health measures such as physical
distancing and contact tracing. Early on, countries that adopted such measures, including China
and Singapore, saw some success in containing the epidemic (Anderson et al. 2020). However,
while strict physical distancing and lockdown measures may mitigate the deaths and medical
burden of Covid-19, they could severely dent the economy as well as generate adverse
socioeconomic, psychological, and health outcomes.

In recent history, evidence from the influenza pandemics and other outbreaks – for example,
H1N1, H5N1, Ebola, Zika – demonstrates the acute economic impact of pandemics and associated
public health response measures (Keogh-Brown and Smith 2008, Smith et al. 2009). With
economic activity at a stand-still during lockdowns, Covid-19 poses both substantial demand and
supply side shocks to the economy. Early evidence suggests that the Covid-19 pandemic and
resulting lockdown measures have caused serious economic downturns (Stock 2020, Hausmann
and Schetter 2020).

Physical distancing and lockdowns are likely to carry deleterious effects in low-income countries
for multiple reasons (Mobarak and Barnett-Howell 2020). Since much of the economy is informal
in low-income countries, they struggle to provide financial assistance to those who may need it
most. The food chain, from crop production to distribution and sale, is more labor intensive and
maintaining food supply may become hard in extended lockdowns. A significant fraction of the
disease burden remains acute. Childhood diarrhea, pertussis and Tuberculosis all require regular
care, and, in a lockdown, this may not be feasible. Fiscal space at the state/provincial level is
limited (Hausmann 2020), and unlike in the U.S. or Europe, where money flows in when times
are uncertain, in low-income countries, the money flows out.

Given the potential deleterious impacts of lockdowns, sustained blanket lockdowns for long,
drawn out pandemics are not feasible. A growing body of research suggests that containment
measures should be based on testing data and/or demographic characteristics, with
partial/targeted lockdowns rather than unsustainable blanket shutdowns of the economy
(Acemoglu et al. 2020, Eichenbaum, Rebelo and Trabandt 2020, and Alvarez, Argente and Lippi
2020).

This underscores the need for effective testing and data collection strategies. Given the large
number of asymptomatic cases, designing an effective testing strategy must go beyond screening
for symptoms. And, given limited testing capacity, optimal utilization of existing capacity should
leverage innovative solutions such as, smart sampling and pooled testing.
Prevalence and transmission estimates established by testing data will inform not just physical
distancing measures but also other key public health policies, including community messaging
and enforcement. Appropriate communication and messaging are key for crises in general but
especially those where voluntary and informed compliance to policies will have huge implications
on the efficacy of policy measures (Nour et al. 2017).

This study addresses the above policy gap by providing a dynamic, targeted, and evidence-based
Covid-19 response strategy. The Smart Containment with Active Learning approach utilizes
standard frameworks from decision making under policy uncertainty to help governments design
better policy responses to the Covid-19 pandemic (Manski 2013). Central to this approach is the
Active Learning strategy: using real time testing and refinement of policy responses together with
a graded approach that varies by local disease projections.

The four distinct parts of this Active Learning process are:

  i.    First, some decisions will essentially remain the same regardless of what information
        becomes available. For instance, the urgent requirement to expand testing capacity and
        PPE for health workers. In this case, there is no need for information to become available;
        policymakers can act immediately.
  ii.   Second, there are other decisions that are best made after collecting some information—
        especially if that information is relatively costless to collect. These decisions are ones
        where more information may change the decision. For instance, in countries that imposed
        sudden lockdowns, a 2-day survey could have helped the government understand that
        migrants would leave urban areas with a lockdown and this would have allowed multiple
        mitigation measures to have been put in place. Countries can be prompt in their response
        without rushing blindly into decisions.
 iii.   Third, in making decisions, all prior information should be used. For instance, an
        understanding of the underlying vulnerability of populations would help governments to
        undertake a spatially targeted strategy.
 iv.    Fourth, every decision will have an impact on the outcomes of interest but will also
        provide further information. This new learning can critically inform the decision-making
        process tomorrow. A decision that may have little impact on potential outcomes but can
        massively increase information should be favored. This moves us away from passive to
        active learning and must be a key component of the strategies in both high- and low-
        income countries.

Based on the Active Learning strategy, the SCALE alert system and operational plan allows for a
staged, time-varying response with rapid learning and refinement. The SCALE operational plan
(Appendix A) lays out an evidence-responsive Covid-19 response strategy that seeks to minimize
disease spread and limit adverse socio-economic impact by targeting response to the current &
projected level of prevalence in the smallest feasible geographical units. Implementing SCALE
requires large-scale testing to establish the level of prevalence in each area. The SCALE smart
sampling and testing strategy (Appendix B) is an effective testing methodology allowing accurate
estimates of prevalence in a cost-effective manner with limited testing capacity.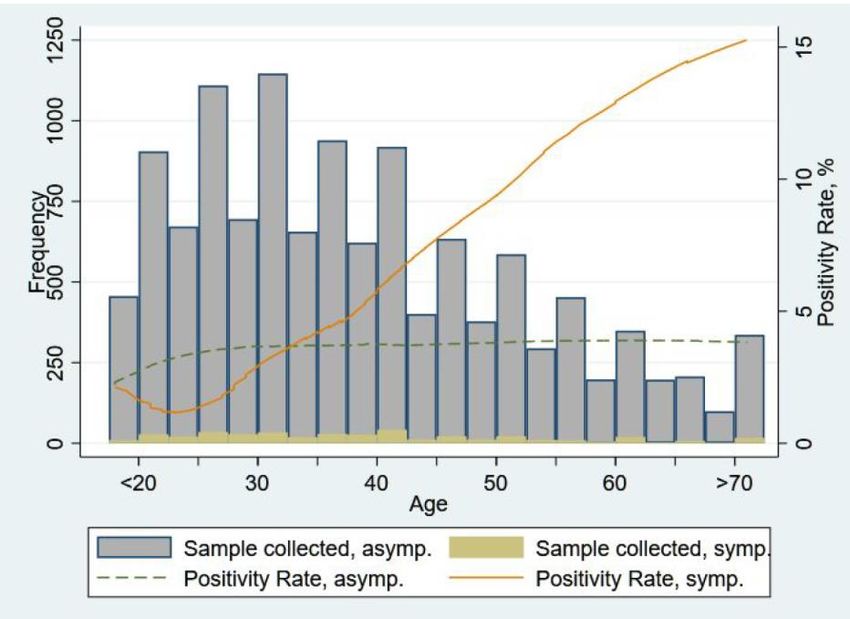
2. Context
Towards the end of February, Pakistan began recording its first few cases of Covid-19. By May 1st,
the rise in cases had reached alarming levels, with over 800 cases per day and Punjab, Pakistan’s
most populous and urbanized province, recording the highest number of cases. The emerging
debate around Covid-19 mitigation measures in Pakistan was between two extremes: either
locking down to mitigate Covid-19 spread, or remaining open to prevent economic hardship.

Health is a provincial topic in Pakistan with each provincial health department formulating its
own health programs and policies. At the federal level, the Ministry of National Health Services
Regulation and Coordination functions as a central coordinating entity. This study leveraged a
unique partnership with the provincial Government of Punjab (GoPunjab) to examine how
Pakistan can deliver an evidence-based rapid policy response at the right level to maximize lives
saved and minimize economic costs.

Based on our advisory, the Primary and Secondary Healthcare Department (P&SHD) notified a
working group on April 28 2020, composed of our team, the P&SHD and other government
departments, with the following TORs:

   •   Design and share smart sampling, testing and data collection methodologies to help
       establish prevalence and transmission rates of Covid-19;
   •   Based on analysis, assist the government to understand immediate health and economic
       impact;
   •   Provide analysis of relevant data on Covid-19 related to smart sampling / testing provided
       by Government of Punjab and report on the findings, where possible, support
       government to conduct its own analysis;
   •   Provide technical input to government about Covid-19 policy response.

As members of this working group, we implemented the Smart Testing Strategy during May 2020
in 645 randomly selected census blocks in Lahore. We generated a repeated cross-sectional
sample of Covid-19 testing data in Pakistan to examine and understand transmission vectors.

There are two major policy contributions. First, this project recognizes the imperative need for
evidence-based policy making that is responsive to on-ground realities. Given the limited
feasibility of sustained blanket lockdowns, and the nature of the Covid-19 pandemic with waves
of infection, there is a need for context-specific, spatially and temporally varied policy responses
which mitigate disease spread while minimizing the negative socioeconomic impact. The main
policy question this project examines is how governments may deliver such a dynamic, data-
driven, and evidence-based response.

Second, the project seeks to enhance government capacity to gather, analyze and understand
data, as well as deploy limited resources as effectively as possible. Through a close collaboration
with the Punjab government, this project provides a proof of concept and blueprint that can be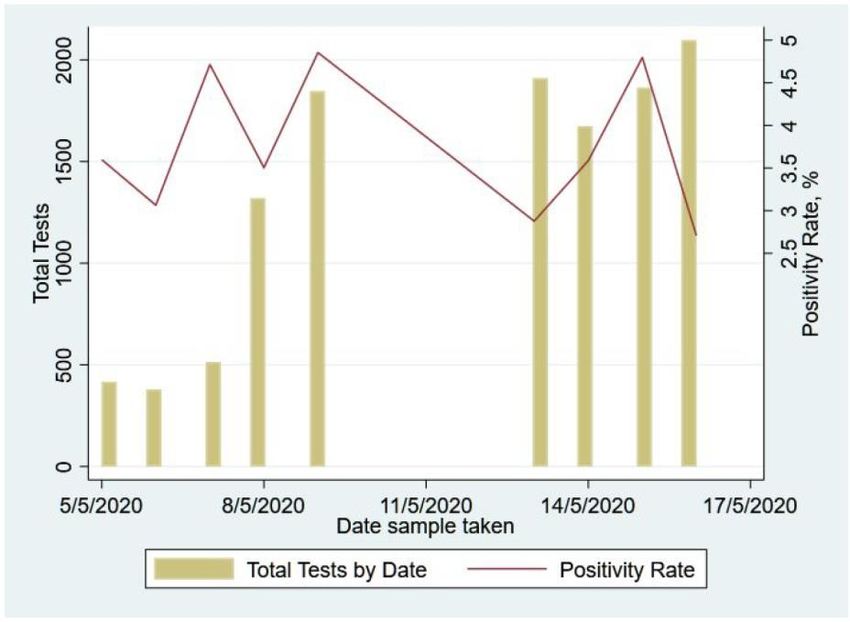
implemented in other districts, provinces and countries. By determining the extent of the
remedial social distancing measures through an iterative process based on existing prevalence
rates as well as impact on future prevalence, governments can mitigate socio-economic costs
and enhance the efficacy of policy measures. Such an approach requires capacity building for
governments to gather and analyze data in real time, and rapidly design policy measures based
on local conditions. The policy recommendations and lessons learnt have value for many other
countries.

    3. Methodology
The SCALE smart sampling and testing strategy is generally focused on providing representative
prevalence data at the level of the smallest feasible geographical unit (S-grid) within a district
where Covid-19 specific response measures (such as testing, quarantine and lockdowns) can be
effectively enforced. The ideal S-grid is one that is minimally feasible (200+ households),
integrates with census information such as population density, distribution of age, etc., and can
be determined using shape files (geo-referenced boundaries). Refer to Appendix 2 for the
detailed smart sampling and testing strategy.

The city of Lahore was chosen to begin implementation. Census blocks were established as the
S-grid in Lahore. The census blocks selected for inclusion in the smart sample were adjacent to
originally infected blocks, i.e., blocks that were discovered to be infected before implementation.
Within each selected S-grid, random GPS points were dropped at a ratio of 1 GPS point per 150
households.

The GPS points in each census block were shared with P&SHD, where the District Health
Authority’s smartphone-equipped field team was trained on administering a patient survey. The
survey instrument is included in Appendix C.

To reduce the cost of testing, the SCALE team proposed pooled testing. Recent work has argued
this can be a cost-effective means of testing (Majid, Omer and Khwaja 2020). In this case, a pool
of up to ten individuals at each GPS point was selected. The pooling procedure is detailed in
Appendix B. The left- hand rule was used to determine the first household to be tested. Within
each household, the person with the highest contacts and mobility was selected for testing and
was subsequently administered the patient survey to record patient contact information,
symptoms, comorbidities, number of contacts, and names of nearby contacts who they
considered to be highly mobile. Through this ‘daisy chaining’ process, a pool of up to 10
individuals was built from 1 GPS point. The collected samples were tested through the pooled
testing procedure.1

1
  Pooled testing works by combining a set of individual specimens into a common pool. If the pool tests negative, all
individuals are diagnosed as negative. If the pool tests positive, the individuals within the pool shall have to be
retested, and the samples processed individually to identify positive individuals from the negative individuals.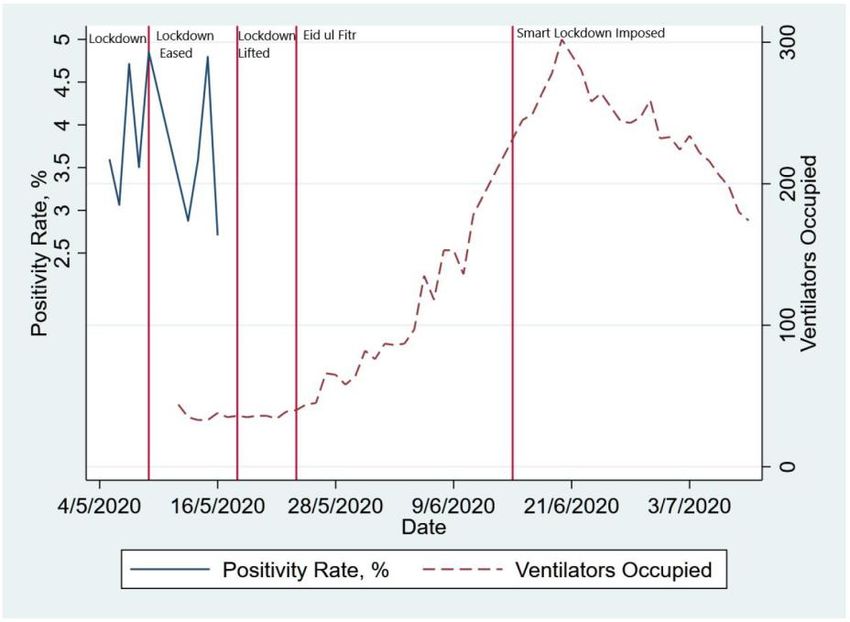
Through this innovative approach, which was first implemented in Punjab as part of this smart
sampling and testing exercise, the Punjab government was able to decrease costs while
simultaneously enhancing testing capacity (Cherif et al. 2020).

This strategy was deployed for a two-week period in May across Lahore, where the testing period
includes the period of strict lockdown in the city. Testing took place in 3 stages: Pilot, Wave 1,
and Wave 2. The Pilot stage was implemented on May 3rd and 4th 2020 in 11 blocks that were
adjacent to originally infected blocks. The field team was trained to follow the daisy chain
process. If the chain broke at any point either because a test recipient refused to share contact
information, the referred person was not available, or because the referred person refused a
test, the field team moved to the adjacent house/property and followed the same set of
procedures as before.

Wave 1 implementation spanned from May 5th to 9th 2020 and covered 282 S-grids that were
adjacent to originally infected blocks. While largely the same process was followed as in the Pilot
stage, anecdotal evidence emerged (through focus groups and discussions with the survey
operators from the District Health Authority) of the field team also using their local knowledge
and contacts to identify individuals (within the census block) who they deemed to have high
mobility.

Wave 2 implementation spanned from 13th May to 16th May 2020 and covered 449 S-grids that
were adjacent to originally infected blocks. P&SHD was advised to implement the following three
strategies:
● Track A: daisy chaining by contact referrals
● Track B: conducting frontline worker testing (with emphasis on healthcare workers, police,
grocery stores)
● Track C: pool testing those individuals identified by the local P&SHD surveyor

Track A was implemented as a part of this study.

   4. Results from Analysis of Smart Sampling and Testing Data
A total of 645 blocks have been covered under Smart Sampling in Lahore as of date. Out of 12,251
unique samples collected, 97.7% have received results after submission to the laboratory
whereas 2.3% of results were not obtained due to sample rejection by the laboratory.

The table below breaks down the number of samples by test result:
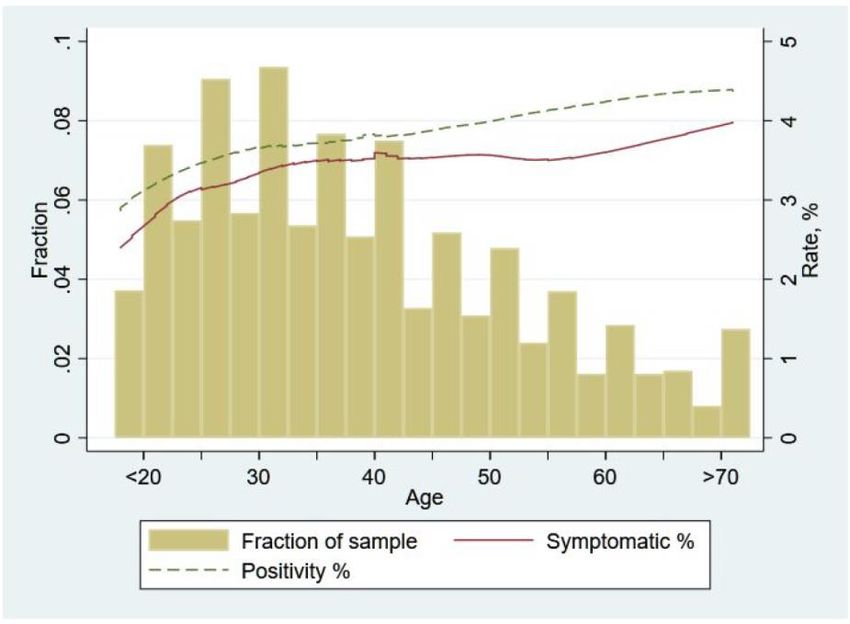
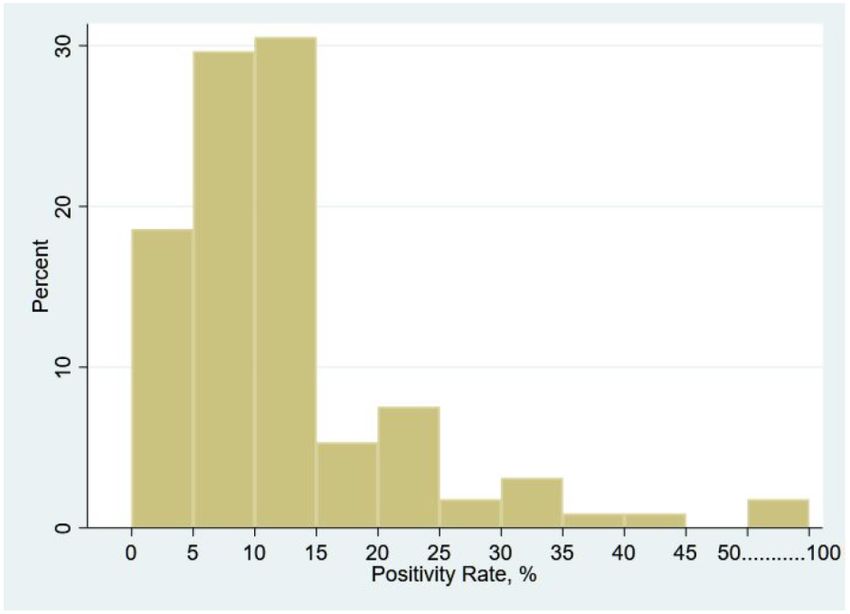
Table 1: Sample Results

4.1: Overall Prevalence and Spatial Variation

The overall Covid-19 prevalence rate in the sample is 3.76% with roughly similar splits between
gender - as 4.43% of females and 3.66% of males tested positive, a statistically significant
difference at the 10% level.

The blocks in which testing took place were spread all over Lahore. Because our sampling strategy
randomly surveyed blocks around infected blocks, this provides some sense of spatial distribution
of prevalence. Our results suggest that there was quite a bit of variation in Covid-19 prevalence
rates even within a given city/neighbourhood.

First, at the level of blocks we find that the spread of Covid-19 was localized in most cases with
419 out of 645 blocks testing negative for all those sampled. Among the blocks that did contain
at least one positive individual (226 blocks), the distribution of positivity rates looked as follows:

Figure 1: Block-level Prevalence Rates (excluding zero prevalence blocks)
The maps below illustrates this variation spatially and again make the point that there is
considerable variation in prevalence rates.

Figure 2: Map of Lahore showing Originally Infected Blocks (in blue) along with Adjacent Blocks where
Smart Sampling & Testing was implemented (in green/yellow/orange/red)

Interestingly, there was a lot of very localized variation in prevalence as well. Even adjacent
blocks can have fairly different levels of infection suggesting that Covid-19 spread may be a fairly
localized phenomenon (especially when lockdown policies are in effect). The figures below
provide zoomed-in versions of a few different areas of the overall prevalence map and illustrate
the very localized differences in Covid-19 prevalence rates.
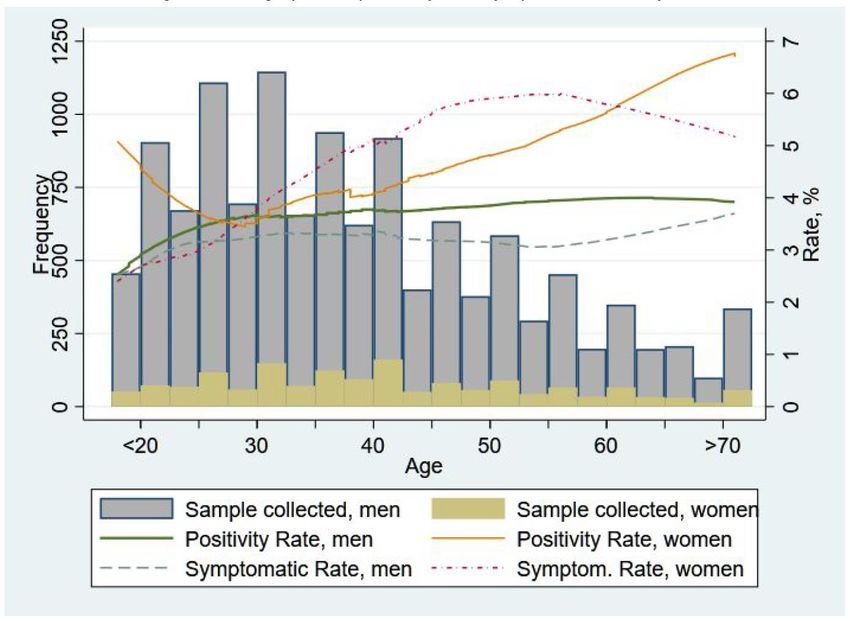
Figure 3: Map of Gulberg Town showing Originally Infected Blocks (in blue) along with Adjacent Blocks
where Smart Testing was implemented (in green/yellow/orange/red)

Figure 4 - Map of Samanabad Town showing Originally Infected Blocks (in blue) along with Adjacent Blocks
where Smart Testing was implemented (in green/yellow/orange/red)

4.2: Prevalence Rates Over Time
An important statistic that informs how to deal with Covid-19 and the extent and efficacy of
lockdowns is how prevalence rates change over time. Without taking any precautionary
measures one would expect the number of infected to increase exponentially over time. While
we do not have repeat samples for the same area, given that the blocks were selected randomly
and tested in no specific order, looking at prevalence rates across the different days of collection
provides a rough sense of how they were changing over time.

The figure below shows this evolution from May 5th to 17th 2020. Interestingly, the positivity rate
mostly remained between 2.5% and 5% during this period with no evidence of a clear upwards
trend let alone an exponential growth.

Figure 5: Positivity Rates across Waves 1 and 2

These results, while suggestive, do indicate that the lockdown period seems to have been
somewhat effective in the sense that blocks that got surveyed later during this period did not
show significantly higher prevalence rates.

However, a more accurate picture of the efficacy of the lockdown measures would have been to
have collected repeat samples and to continue testing, especially after the lockdown was eased
and, more recently, when a partial lockdown was re-enacted. Unfortunately, despite strong
advice given by the SCALE team, this data was not generated and therefore we were unable to
accurately assess how well the lockdowns have worked.

One piece of evidence that suggests that initial lockdown was likely to have been effective in
mitigating Covid-19 spread, and that the opening up of the lockdown worsened the spread,
comes from looking at ventilator usage data (in Lahore) based on statistics provided by
Specialized Healthcare & Medication Education Department (SH&ME). We repeat the prevalence
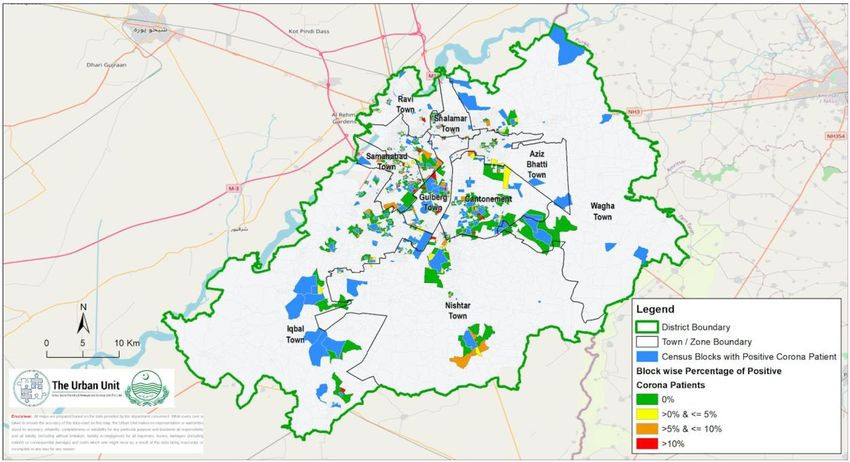
data in the previous figure but now overlay it with time-series data on ventilator usage. Note that
while the positivity rate from PCR tests (blue line) provides a closer to real-time measure of Covid-
19 prevalence, the number of ventilators used provides an alternative prevalence measure
though with greater lag (since those infected may take longer to develop severe enough
symptoms that require ventilators).

Figure 6: Positivity rate and Ventilator Usage during different policy periods

Nevertheless, comparing these two graphs and using ventilator data to “fill in” the lack of smart
PCR testing after mid-May suggests that the initial lockdown may indeed have been effective.
First, note that prior to lifting the lockdown both the PCR test-based prevalence data and
ventilator usage shows that there was not much change in Covid-19 prevalence. However, we
can see that a week after lockdown was lifted, ventilator usage started increasing and continued
to increase substantially suggesting that the initial lockdown indeed had been effective and the
subsequent opening caused prevalence rates to increase. Further, after the imposition of smart
lockdown in mid-June the ventilator usage declined in line with expectations.

4.3: Prevalence Rates by Demographic Characteristics

Age: The median age among all tested was 36 years and therefore the sample skewed younger.
In the figure below, the dashed green line represents the (“smoothed out”) relationship between
the positivity rate and respondent age.2 The bar chart represents the fraction of our sample of a
given age.

2
 We plot the lowess (Locally Weighted Scatterplot Smoothing) curve that shows the smoothed-out relationship
between positivity against age.
The main trend to note in the graph is that the rate of Covid-19 positivity increased with age of
the individual tested. It is lower for younger age groups and increased at a high rate till age 30,
after which it increased but at a lower rate. Among those above 50 years of age (comprising 20%
of the sample), the positivity rate exceeded 4% throughout.

Figure 7: Age Profile, Symptomacity and Positivity Rate of the Sample

We should note that, as shown in the solid red line in the figure, part of this relationship is likely
due to the higher fraction of symptomatic people we see at higher age groups. We should caution
that since we do not know refusal rates at different age groups we do not know if this is a feature
of the underlying population (i.e., older people are more likely to be symptomatic/infected) or is
it that older people who are symptomatic are more likely to consent to being tested. In future
rounds of testing, refusals and reasons for refusals should be collected to have a better sense of
this. Regardless, these results do suggest extra caution for the elderly - not only do we know from
other countries experiences that their morbidity outcomes may be worse, but at least based on
the data we have it seems they may be more likely to be infected as well.

Gender: Likely due to social norms and the fact that we had suggested that priority be given to
testing individuals within the household who had higher contacts/exposure, more men were
tested (10,410 valid samples) as compared to women (1,556 valid samples). We had previously
noted that the positivity rate seemed significantly higher for women (4.43%) compared to men
(3.66%).

Figure 8 below examines this further by examining whether Covid-19 prevalence varies
differentially by age for men and women. Interestingly, we see a marked difference here: For
men their positivity rate is rising till age 30 but then remains around 4% at all ages beyond.
Women, on the other hand, after a small initial drop, show a clear and sustained rise in positivity
rates with age, starting from around 4% even at ages lesser than 20 and then increasing to about
7% at beyond 70 years of age.

Without knowing if there is differential selection in who agrees to be tested it is hard for us to
determine what causes this large age effect for women but not for men. While there is some
selection here (the figure below shows there is a great fraction of symptomatic women as age
increases), it is also not clear that this by itself can drive the large increases women see in being
PCR positive as their age increases.

Figure 8: Age Profile, Symptomacity and Positivity Rate, by Sex

Other Attributes: Another risk factor associated with contracting the virus was whether a person
had to leave their residence for work. During the sample collection period, the lockdown was
eased in Lahore and therefore people might have been able to commute to their workplaces.
Those who were employed constituted 85.6% of the sample and showed a generally higher
positivity rate as compared to those unemployed across all age groups. Overall positivity rate for
those employed stood at 3.8% versus 3.2% for the unemployed, a statistically significant
difference at the 10% level. Our data is too limited to draw inferences on whether different
occupations have differential risks, but this is something that could be worth examining in future
testing.

In the early days of virus spread (February-March 2020), all the cases in Pakistan almost
exclusively came from those who had either traveled internationally or their domestic contacts.
In our sample, there were 532 cases of travel (4.3%) and among these only 10 had traveled
internationally. In our data, while 4.5% of those who traveled tested positive compared to 3.7%
of those who did not, these differences are not statistically significant.

4.4: Prevalence Rates for Symptomatic and those with Pre-existing Conditions

Given PCR testing is costly, one hope is that symptom-based phone surveys may be an effective
way of determining Covid-19 prevalence. We therefore examine how effective such methods
may be.

In our overall sample, 3.4% of individuals report themselves as having relevant symptoms. While
the symptomatic rate is not that far off from the overall rate of Covid-19 prevalence rate and, as
we had noted before, symptomatic rate increases with age along similar lines to Covid-19
positivity, the relationship between being Covid-19 positive in a PCR test and reporting symptoms
is not as strong as one would have hoped. While symptomatic individuals were more likely to
have tested positive in PCR testing (5.7%), this is only slightly greater than the PCR-based Covid-
19 prevalence rates in asymptomatic individuals (3.7%). While the difference is statistically
significant, with close to 95% of those detected as Covid-19 positive in the PCR tests being
asymptomatic, it does not seem symptom based surveys will be an effective way to identify the
majority of infected individuals.

Further analysis reveals that for asymptomatic individuals, there is little pattern with age – while
there is some initial increase with age, past late-20s the positivity rate remains stable at around
4%. In contrast, for those reporting symptoms, there is (after a small initial dip) a very strong
positive relationship between positivity and age with older people exhibiting substantially higher
positivity rates. For individuals reporting symptoms, those greater than 50 years of age have a
prevalence rate of around 13%, which is significantly higher compared to those less than 50
(3.8%). This suggests that while symptom based identification may be generally less useful, it is
more indicative of Covid-19 prevalence for older individuals, i.e., those above 50 years old are
more than three times more likely to show Covid-19 positivity if they are symptomatic than if
they are not. Though even in this older population around 91% of those detected as positive in
PCR-testing report no symptoms.
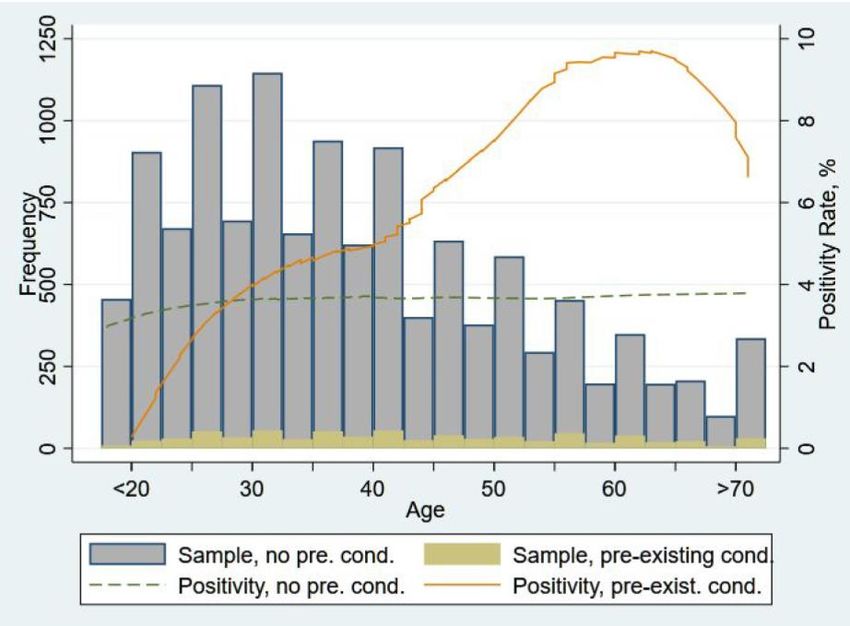
Figure 9: Age Profile and Positivity Rate by Symptomacity

It is also instructive to examine whether individuals with pre-existing conditions show differential
rates of positivity. In our sample, 707 (5.8%) people reported having any pre-existing conditions
such as diabetes, hypertension, breathing issues, etc. Given what we know about underlying
prevalence, we suspect there may be some under-reporting here. Nevertheless, we find that the
overall positivity rate of those with pre-existing conditions was 5.8% compared to 3.6% with no
pre-existing conditions and this difference is statistically significant. Among those with no
conditions, the positivity rate rises in earlier ages and then remains around 4% into higher age
brackets. However, those with pre-existing conditions exhibit an increasing positivity rate with
age, peaking at around 10% among the elderly. Curiously and somewhat puzzlingly, this drops at
above 60 years of age though that may be driven by differential reporting and smaller samples.
Figure 10: Age Profile and Positivity Rate by Pre-existing Conditions

4.5: What Predicts Covid-19 prevalence? A Multivariate Regression Analysis

While there is limited data available, we can still shed some light on what factors may be
predictive of Covid-19 prevalence rates. In order to do so, we conduct a multivariate regression
analysis utilizing some of the individual attributes mentioned above, as well as some group
attributes (like the level of infection in your vicinity) and the population attributes (such as
density) in your neighbourhood.

Table 2 below shows the result of this analysis. Column (1) first only includes variables that are
not directly related to Covid-19 (i.e. whether someone is symptomatic and the positivity rate in
a person’s vicinity) since that is a prediction model that can be used without any testing or special
surveying for Covid-19. Column (2) then adds additional factors that are related to Covid-19
specifically - namely whether an individual reports symptoms and the percentage of infected
individuals nearby.

Column (1) shows that once we include all these factors together, the two factors that increase
an individual’s chances of being Covid-19 positive are (i) whether they have pre-existing
conditions and (iii) the population density in their surrounding areas. Having a pre-existing
condition increases the probability that one is Covid-19 positive by 2.2 percentage points (a
58.5% increase over the average positivity rate of 3.76% in our sample) while an increase of
100,000 people per sq-km (around 0.4 standard deviations increase in population density in our
sample) increases the likelihood of infection by 0.3 percentage points for every 100,000 greater
density.
Column (2) includes the additional factors that capture whether someone is symptomatic and
the percentage of people who are infected in their vicinity. We find that a person is more likely
to be infected if individuals near them are infected. People in a person’s testing “pool” are those
individuals who are essentially their neighbours or live close enough that they were part of the
same pool of tests. Here we find a 1 percentage point increase in positivity rate in people who
were in a person’s testing pool increases the probability they are positive by 0.6 percentage
points. Another way of saying this is if everyone in an individual’s testing pool was positive then
their probability of being Covid-19 positive would increase by 60 percentage points! Interestingly,
there is an (additional) effect of 0.2 percentage points increase in being Covid-19 positive if there
is a 1 percentage point increase in the percentage of people who are Covid-19 positive and live
within a 1km radius of the (but not in their pool). However, there is no additional effect of the
percentage of people that are between 1km to 2km, and 2km to 3km of where the person lives.
These results suggest that the likelihood of infection increases the greater the percentage of
people around an individual are infected but that this effect decays as the distance increases so
that people more than 2 kms away don’t matter as much, i.e., the infectivity likelihood is very
localized. Interestingly, once we include these measures of local infection rates population
density no longer matters. This suggests that higher density places are worse off only to the
extent that a denser place means a greater chance that someone is infected nearby.
Table 2: What Predicts Covid-19 prevalence? A Multivariate Regression Analysis
4.6: Testing Costs and Efficiency

One of the concerns regarding testing may be the financial cost associated with it. While these
costs may well be worth it given the value testing and prevalence detection has in reducing future
spread, part of the value-additions of our smart sampling and testing strategy has been a large
reduction in these costs and an increase in the efficiency of testing. Based on data received from
P&SHD the typical cost of testing is Rs 3,500 per test. Once we factor in the personnel costs of
actually collecting test samples this goes up to Rs 3,663 per test. In our case, we were able to
adopt a pooled testing approach by creating pools of ten individuals. Therefore, while each
individual person in the pool would have a sample taken, there would only be one test run for
the combined sample. If the test was negative no further testing would be done. However, if the
test was positive, then each of the ten individuals in that pool would be tested. Given that the
majority of pools were negative (79%), this meant that far fewer overall tests needed to be
conducted. As a result of this we were able to effectively reduce the cost to Rs 1,170 per test, or
Rs 1,334 per test once we factor in costs of collecting the samples.

This is a remarkable saving, as pooled testing effectively reduces the overall cost of testing by a
factor of three (i.e. a 63.5% to 66.5% drop in costs). Another way to think about this is that just
this change alone allows us to sample three times as many individuals in the same budget. While
this is already a significant saving, these costs could be further reduced if larger samples were
pooled.

The testing strategy that was adopted also allows us to make considerable headway on two key
fronts, which are not only important for Pakistan but also for understanding transmission
globally. First, in countries like Pakistan, the number of Covid-19 cases is rising rapidly with
increasing evidence of community transmission. Once community transmission is underway, the
epidemic is harder to contain through contact tracing alone; some level of community
surveillance is required. Second, there is growing evidence, consistent with our data that a large
fraction of people infected with Covid-19 are asymptomatic, and although there is a dearth of
studies from Pakistan, it appears that many of these patients are truly asymptomatic, rather than
pre-symptomatic. The question we are then in a unique position to ask is: How does community
transmission and the presence of asymptomatic individuals affect the community surveillance
strategy for Pakistan?

We are concerned here both about effective epidemic control and the costs of testing. For
effective epidemic control, identifying individuals early in their infectious stage can help break
transmission chains. But if many infective patients are asymptomatic, screening on symptoms
alone is insufficient. It can also be very costly. To see why, consider how much it costs to detect
a single positive patient. With community surveillance, this includes both the costs of screening
and the cost of testing. If a large fraction of patients is asymptomatic, screening on symptoms
may be less effective even compared to simple random sampling.

In our testing data, we can calibrate these costs exactly. In doing so, we find that, even without
pooling, a strategy of smart testing like the one we used is more than 50% cheaper in the cost
per positive case detected than a policy of first screening for symptomatic individuals and then
testing (only) them. Once we factor in pooled testing, these savings are as high as 75%. Taken
together, these results highlight how large a saving can be generated by adopting a process of
smart sampling and testing.

   5. Policy Recommendations
This study has shed light on a data-driven policy response to COVID-19. Until a vaccine is
successfully produced and deployed—a process which may take several months even under
optimistic scenarios—lowering COVID-19 prevalence should remain a central policy focus. Some
policy recommendations, based on the findings of this study, are discussed in this section.

Health policies need to be revised to safeguard the elderly and women, who are at higher risk
of infections. Given that the elderly have higher infection rates and worse morbidity outcomes,
health policy needs to especially protect them. Moreover, given that women have higher
infection rates than men, there needs to be a move towards greater testing for women.

Policy responses may be more effective if they are more localized. The substantial and very
localized variation observed in Covid-19 prevalence rates suggests that lockdown policies may be
more effective and less costly to the economy if they can be implemented in the smallest possible
geographical and administrative units.

Community messaging campaigns should focus on universal prevention. Given the high degree
of asymptomatic cases, safety messages need to stress universal prevention (wearing masks and
washing hands frequently etc.) for all regardless of whether they have symptoms or not.

Frontline workers should be tested regularly. While healthcare frontline workers should be
prioritized, there are a range of others who are also frontline workers - such as those working in
pharmacies, exposed bureaucratic staff, emergency response teams, enforcement officials,
supply chain logistics providers, immigration/border officials, public transport workers, retailers
- and need to be tested.

Conduct follow-up surveys with all those who are detected positive. Healthcare needs and long-
term morbidity outcomes should be traced out for the population.

An appropriately designed and systematically implemented contact tracing process can be
critical in preventing spread, especially when there is a low level of infection. Setting up such a
system will also help contain spread in places where there is risk of disease resurgence as has
been seen during reopening of cities around the globe.

Continuation and expansion of the Smart Testing approach. Rigorous testing data as well as
expanded data gathering exercises (including other health and socioeconomic outcomes) will
allow policymakers to understand prevalence and transmission of Covid-19, design effective
policies to mitigate spread, and assess the tradeoffs involved in lockdown and reopening so they
can mitigate the losses and help rebuild the economy and society.

   6. Conclusion
The Smart Sampling and Testing process implemented in Punjab built an impressive and
significant capacity in the P&SHD team to run smart and cost-effective sampling testing and data
collection activities that remain as critical to informing the Covid-19 policy response as ever. The
analysis above also revealed several useful and important findings that can directly inform the
Covid-19 response for the months to come.

First, this study has demonstrated that the smart sampling and testing methodology, combined
with pooled testing, is not only feasible but can be carried out regularly and at-scale across the
province to determine how Covid-19 prevalence is changing over time, even at the level of sub-
neighbourhoods within cities. This is a critical tool in helping us understand the effectiveness of
various kinds of lockdown policies, as well as how soon and costly an opening up can be. Our
analysis suggests that the initial lockdown was likely quite effective and such policies may
continue to be an effective tool for containment. Importantly, by tying the extent of future
lockdowns to such data, governments can ensure effective implementation of an evidence-based
smart lockdown and containment policy.

Second, our results have shown that we can readily combine the testing process with a rapid and
real-time data collection exercise. While we used the system to focus on data that helped us
better understand the demographics and patterns of the disease, we can easily amend this and
add data on other non Covid-19 related health outcomes as well as economic impact outcomes
(such as food security, poverty, employment, income, etc.) that will help provide a sense of how
costly the lockdowns are to the economic welfare of citizens. By obtaining this additional data,
we will be able to arrive at a better policy decision that balances the costs and benefits of each
lockdown/opening up strategy. These data will remain just as important even as Covid-19
prevalence diminishes since they would then help inform and better target the process of
rebuilding and restoring affected families and the overall economy.

Third, our study has yielded important policy implications described in the section above. These
policy recommendations show how a data-driven and evidence-based approach to designing
Covid-19 response measures can yield a more appropriate and effective policy response.
Appendix A: SCALE Operational Plan3
Governments around the world face two incredibly hard choices in responding to the COVID-19
pandemic: Lockdown and prevent spread, but risk economic collapse and potentially many dying
from non-COVID reasons – OR – start opening up to minimize the socio-economic fallout, but
risk COVID-19 resurgence. We propose a plan that helps make these choices in the most
informed, feasible and timely way.

           The problem we face is there is little data on potential health & economic impacts
             to figure out tradeoffs between choices and to design a real-time, effective, &
                                        evidence-based response

                   We propose an Active Learning & Refined Response Approach

The key principles underlying our approach are: ֍ Data is Critical ֍ Policy Responses Must Be
Data-Driven & Data-Responsive ֍ Policy Responses Must Vary with Local Conditions ֍
Community Messaging is Key to Ensuring Voluntary Compliance ֍ Response must be both
Immediate and Sustained ֍ Partner with on the Ground Implementers to Leverage Existing
Capacity

       Based on these principles, we have developed a standardized COVID-19 alert system and
       operational plan which allows for a staged time-varying response with rapid learning and
                                              refinement

3Contributing team members include (in alphabetical order by last name): Dr Tahir Andrabi (LUMS / Pomona), Dr
Matt Andrews (Harvard), Dr Ali Cheema (LUMS), Dr Jishnu Das (Georgetown / Center for Policy Research), Dr Adnan
Q. Khan (LSE), Dr Mishal S. Khan (LSHTM), Dr Asim I. Khwaja (Harvard), Dr Farhan Majid (University of Georgia), Dr
Amyn A. Malik (Yale), Anum Malkani (CERP), Dr Tyler McCormick (University of Washington), Dr Saad B. Omer (Yale),
and Maroof A. Syed (CERP).
This operational plan lays out a district evidence-responsive response strategy that seeks to minimize disease spread and limit adverse socio- economic impact by targeting response to the current & projected level of prevalence in the smallest feasible area (S) within the District (D). Each set of actions is associated with a set of agents.
Appendix B: SCALE Smart Testing Strategy4
Step 1: Define the lowest sampling grids “S” for City/Districts and conduct data diagnosis

    ➔ ‘S’ should be as small as minimally feasible (200+ households)
    ➔ Shape files (geo-referenced boundaries) will be required for ‘S’
    ➔ Ideal ‘S’ are census block/mauzas as that will allow for overlaying census information
      (population density, distribution of age etc.)
    ➔ Alternative options: If census blocks/mauzas not available, then the following can also be
      used:
           ◆ UCs
           ◆ Geo-referenced grids
           ◆ Creating geo-referenced polygons using cell phone towers
    ➔ Conduct a data diagnosis to assess the usability of the data5 that is being collected and
      understand its workflow

                               Inputs                                            Outputs

               1. Shape files of ‘S’ grids                                         N/A
               2. Census data on ‘S’ grids
               3. Geo-locations of isolation
                  centers, quarantine facilities
                  hospitals and labs conducting
                  PCR Tests
               4. Data Diagnosis

Step 2a: Contact Tracing Testing

    ➔ Identifying contacts of known positive cases - there are two ways to obtain this:
         ◆ First preference: Through Call Detail Records (CDR) and/or Cell Phone Tower Data.
              The steps involved would be as follows:

4
  The lead contributors for this document include Dr Ali Cheema (LUMS), Dr Jishnu Das (Georgetown / Centre for
Policy Research), Dr Adnan Q. Khan (LSE), Dr Asim I. Khwaja (Harvard), Dr Farhan Majid (University of Georgia), Dr
Amyn A. Malik (Yale), Dr Tyler McCormick (University of Washington), Dr Saad B. Omer (Yale), Omer Qasim (CERP),
Maroof Syed (CERP).
5
  Health, location, and contact tracing data is personal data. Information collectors should ensure that the data
collected is accurate and secure. The integrity of data can be improved by cross-referencing it with reputable
databases and by providing access for the consumer to verify it. Information collectors can keep data secure by
protecting against both internal and external security threats. They can limit access within their organization to
only necessary employees to protect against internal threats, and they can use encryption and other computer-
based security systems to stop outside threats.
● Provide telecom operators with cell phone numbers of infected patients
● Identify exposed people - identify individuals that were in the same
physical location (same tower) during the span of 15 minutes and/or 30
minutes overlapping window in the past 14 days (ideally 3 weeks). If this
number is not too large, use it. If it is too large, narrow it down further to
exposed contacts
● Define contact list - ask telecom operators to identify all numbers called by
the infected person’s number for at least 14 days (ideally 3 weeks) prior to
the person’s infection start date
● Narrow down list of exposed people to exposed contacts by excluding
everyone from exposed people list who are not in contact list
◆ Second preference: Actual contact tracing done through in-person surveys/phone
calls/robocalls (will capture contact details and work/home location of contacts)
➔ Test & administer basic in-field survey (survey captures basic demographics useful in
refining disease model) to contacts and geotag where they live/work and assign to
appropriate ‘S’ grid
Inputs Outputs
1. Individual level data on contact 1. Overlaying the data from inputs
tracing (CDR or captured on appropriate ‘S’ grids
through surveys/robocalls)
2. Home and work geo-locations of
traced contacts
Step 2b: Exposed Frontline Worker Testing
➔ Identify all exposed frontline workers. These are workers (medical staff, caretakers, police
and government officials, retailers, etc.) who are/have been in direct contact with
infected people (with 10 minutes or more of exposure)
➔ Test & administer in-field for contacts and geotag where they (i) work and (ii) live and
assign to appropriate ‘S’ grids
Inputs Outputs
1. Individual level data on exposed 1. Overlaying the data from inputs
front-line workers on appropriate ‘S’ grids
2. Home and work geo-location of
frontline workersStep 3: Testing in ‘S’ grids
▪ Prioritize PCR testing in ‘S’ grids of the following types - start testing in Category 1 first
and then move to Categories 2 and 3:
◆ Category 1
● ‘S’ grids that have no infection detected yet but are next to a grid which
has an infection
● ‘S’ grids that have a high number of frontline workers working or living in
them
● ‘S’ grids with people who have high mobility/travel/connectivity
◆ Category 2:
● ‘S’ grids that have high population density
● ‘S’ grids with large fraction of high health risk people (elderly etc.)
◆ Category 3:
● 3a: all remaining uninfected grids
● 3b: all grids that already have been detected with high infection (PCR
Testing in such areas is not as informative but these grids are top priority
for seroprevalence testing)
▪ Conduct the following types of prevalence testing:
◆ Screening and Testing:
● Ideal - but may be in limited supply; Instead of randomly testing people in
‘S’ grid, test those who are High Infection Susceptibility (i.e. people who
have higher likely of infection) since this gives a more efficient way of
testing (i.e. will need to use less tests to detect infection). These can be
defined as people with (i) high number of physical contacts/interactions
and/or (ii) high mobility
○ For PCR Testing, pool 10 or 20 tests each depending on what you
have been instructed to do. Follow Pooled Testing protocol. Make
sure everyone is also administered an in-field basic survey
● Preferable method is using CDR data:
○ High physical contacts: The following complementary approaches
can be used
◆ run algorithm for each phone number by seeing in one
week (can use the most recent full week - make sure
weekend and weekdays are included) what is the total
number of OTHER phone numbers that were in the same
physical location as they were in an overlapping 30 minute
time window - list (phone no & location) of the top 5%
percentile in this measure
◆ run algorithms on CDR data to identify high contact nodes
who are in contact with more people/links (restrict these tothose within the same city and also see which of their edges
are more active for further contact tracing)
○ High mobility folk: These are people who move around a lot (so
could be more likely to get exposed) - run algorithm to count how
many unique towers (i.e. different locations) the person has been
at - can refine this over time to maybe weigh locations that are hot
spots - provide list (phone & location) of the top 5% percentile in
this measure
○ Build profiles of high contact/mobility individuals by combining
CDR data with administrative records
● If CDR data not available, then define High physical contacts/mobility by:
○ Randomly arriving at the GPS pin location provided in ‘S’ Grid - Test
& Survey member of household who has highest contact/travel in
past 14 days (may not be owner but could be domestic help who
does regular shopping etc.) AND ask the household head who is a
person with high contacts nearby OR who is their friend nearby
(people who are identified as friends will likely have higher
connectivity) and then go and Test & Survey them
◆ Sentinel Surveillance PCR Testing
● Identify main 2-3 sewage collection points in ‘S’ Grid and collect sample by
using protocols similar to those for polio environmental surveillance
through sewage sampling
○ This is an experimental approach and will require a pilot before
being rolled out on a broader scale. Areas where grid maps of
sewerage are available would be required
● Take samples and note the GPS location where the sample was taken
◆ Phone-based Syndromic Surveys
● Call randomly selected numbers (if possible, prioritize numbers that show
high mobility or physical contact in past 2-3 weeks) and administer survey
of symptoms on the phone (this can also be done through robo-calls)
Inputs Outputs
1. Categorize ‘S’ Grids 1. COVID19 detection PCR tests
a. Identify high mobility and and field survey on people with
high contact individuals high mobility and high no of
to administer contacts
appropriate tests 2. Sentinel Surveillance by testing
2. Contact details and biographic water samples and recording
data on high mobility/high GPS location where the sample
contact individuals was collected from
3. Syndromic Surveys through
Robocalls and Phone CATI4. Positive cases overlaid on
respective ‘S’ grids
5. Action items for stakeholders to
take in respective ‘S’ grids
a. SOPs for dealing with
Positive cases (option for
isolation at home)
Step 4: Follow-up socio-economic and broader health surveys
● All individuals tested are administered short phone surveys that will capture their socio-
economic as well as broader health situation. This will be used to see what other costs
they are incurring and what help may be useful to provide to them
Inputs Outputs
1. Contact details and relevant 1. CATI phone surveys to capture
biographic data of all individuals socio-economic and broader
tested health concerns
2. Overlay the information on
appropriate ‘S’ grids
3. Devising action items for the
stakeholders in ‘S’ gridsAppendix C: Testing and Tracing Survey Instrument6
This repository consists of 7 modules.
I. TESTING SURVEY: Module 1, 2, 3, & 4 will be asked from the same respondent at the time of taking the
sample for PCR test. This will be done for 10 respondents on each GPS point for a particular area (S Grid
number).
Module 1 - S Grid Cluster Mapping / Identification: This section is to keep track of areas covered (S grid and
GPS points).
Module 2 - Respondent Identification and Testing : This section contains basic respondent information and
where test sample should be taken.
Module 3 - Travel History : This section records basic travel history of the respondent.
Module 4 - Clinical History : This section records clinical history of the respondent.
II. FOLLOW-UP SURVEYS: The modules below are 3 different follow-up survey instruments for Pool Testing
follow-up (in case the result is positive), a follow-up with individual positive cases & a Contact Tracing
questionnaire.
Module 5 - Pool Testing Follow-Up : If for any specific pool, the result comes out positive, then follow-up
individual test samples will be taken for each individual that was part of that pool.
Module 6 - Confirmed Positive Case(s) Follow-Up : Here, enumerators will survey people from the pool who tested
positive. They will gather information on other people these positive cases have come into contact with.
Module 7 - Contact Tracing : Enumerators will reach out to the contacts provided in Module 6 and survey these
contacts using questions here. To get additional data points on traced contacts, Module 3 (Travel History) and
Module 4 (Clinical History) are also recommended to be administered.
6 The lead contributors for this document include Dr Ali Cheema (LUMS), Dr Jishnu Das (Georgetown / Centre for
Policy Research), Dr Adnan Q Khan (LSE), Dr Asim I Khwaja (Harvard), Dr Farhan Majid (University of Georgia),
Dr Amyn A. Malik (Yale), Dr Tyler McCormick (University of Washington), Dr Saad B. Omer (Yale), Omer Qasim
(CERP), Maroof Syed (CERP).You can also read