Complexity Aversion when Seeking Alpha - Tarik Umar Rice University - American Economic ...
←
→
Page content transcription
If your browser does not render page correctly, please read the page content below
Complexity Aversion when Seeking Alpha ∗
                                                  Tarik Umar†
                                                  Rice University

                                               December 31, 2017

                                                     Abstract

       I provide evidence that news’ complexity and sentiment affect investor attention to news and
       market reactions. Using field data with randomization from Seeking Alpha, I find standard-
       deviation increases in headline length (negativity) lead to 12%-fewer (2%-more) views. Effects
       are greater for less-sophisticated investors. Studying company-earnings-press-release headlines,
       and using the length of firms’ legal names to instrument headline lengths, I find standard-deviation
       increases in length lead to 7%-lower turnover, 60-basis-points-tighter-intraday-price ranges, and
       15-basis-points-return underreactions, which reverse in three months. Complexity matters more
       for less-surprising news released on quieter days to less-sophisticated investors.

       JEL: G14, G41, D83, M41

   ∗
     I would like to thank my committee of advisors from the University of Chicago’s Booth School of Business: Lubos
Pastor (co-chair), Kelly Shue (co-chair), Amir Sufi, and Richard Thaler. This paper will be presented at the AFA
meetings in January 2018 and the Q-Group meetings in May 2018. This paper was awarded “best PhD paper” at the
2016 Colorado Finance Summit and was a finalist for the BlackRock Applied Research Award. This work has benefited
from feedback at the following seminars: Boston College, Chicago Booth, Dartmouth, Rice University, Securities and
Exchange Commission, Texas A&M, University of California San Diego, University of Oklahoma, University of Oregon,
University of Virginia, Vanderbilt, Washington University-St Louis, and Wharton. Paper featured in Wall Street Journal
piece titled “You Probably Tend Not To Read Articles With Headlines That Are This Long, But Maybe You Should”
on November 13, 2017. Also featured by Matt Levine on Bloomberg View on March 10, 2017. The following individuals
connected with Seeking Alpha provided me with valuable resources: Eli Hoffmann (CEO), Selig Davis (Vice President
of Audience and Mobile), and Yoni Madar (Mobile Product Analyst).
   †
     Assistant Professor of Finance (tarik.umar@rice.edu)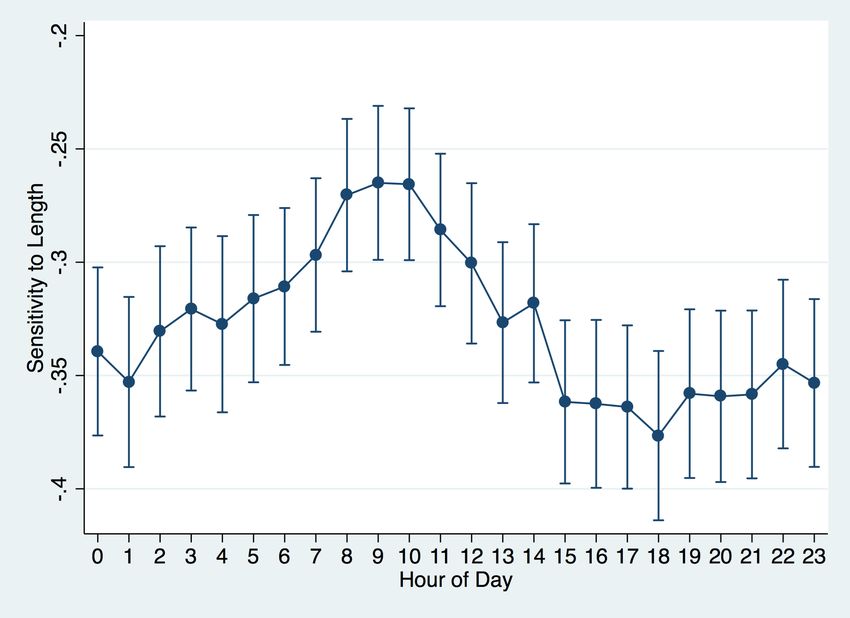
1     Introduction
       Investors must allocate their limited-attention across news (Kahneman, 1973). As the informa-
       tion investors sift through is often textual, the textual attributes of news (e.g., complexity, and
       sentiment) may meaningfully affect how investors allocate their attention and thus individual and
       market outcomes. Consistent with attributes mattering, prior studies find associations between
       textual information and market behavior. For example, more complex corporate disclosures are
       correlated with less trading by individual investors and greater-post-filing volatility. The investor-
       attention literature finds investors underreact to subtle, hard-to-find news. And, the sentiment
       literature finds investors underreact to negative sentiment in news.1 Identifying causally whether
       textual attributes matter remains a challenge because omitted variables, related to the event,
       may influence market outcomes, investor attention, and the news’ complexity and sentiment
       (Bloomfield, 2008). Furthermore, characterizing how textual attributes matter is challenged by
       high correlations between attributes, such as a positive correlation between negative sentiment
       and complexity. In this paper, I show that textual attributes affect investor attention to news
       using unique field data with randomization and isolate changes in the complexity of information
       from other attributes using an instrumental variable. Using the instrumental variable, I then
       show that the headlines of earnings announcements explain market responses to news, including
       a temporary price underreaction.
           To identify how textual attributes affect investor attention, I need a measure of investor
       attention to a particular text, variation in the text unrelated to the event reported, and random
       assignment of the varied texts to investors. To address these challenges, I analyze field data
       with randomization from Seeking Alpha, a crowdsourced-investment-research firm. On January
       3, 2016, Seeking Alpha began allowing authors of stock reports to propose two plausible titles for
       the same report. The editor assigned to review the stock report can provide a third title. The
       two-to-three plausible titles are then randomly sampled on investors who signed up to receive
       real-time-alert emails about the topic company (“title testing”). Each investor receives an email
       with only one randomly assigned title, and the emails are otherwise identical. None of the body
       of the stock report is included in the email. Investors must click a link in the email to read the
       full stock report. My chief measure of attention to a title is the number of investors who click the
   1
     For models of investor attention allocation see Gabaix and Laibson (2005); Gabaix et al. (2006); Peng (2005); Peng
and Xiong (2006); Kacperczyk et al. (2009); Bordalo et al. (2013). For work on complexity and market outcomes see Li
(2008); You and Zhang (2009); Miller (2010); Loughran and McDonald (2011); Green and Jame (2013); Lawrence (2013);
Loughran and McDonald (2014); Hwang and Kim (2016); Loughran and Mcdonald (2017). For work on sentiment and
market outcomes see Barberis et al. (1998); Antweiler and Frank (2004); Baker and Wurgler (2006); Tetlock (2007);
Tetlock et al. (2008); Engelberg (2008); Dougal et al. (2012); Hillert et al. (2014); Chen et al. (2014); Da et al. (2015);
Hartzmark and Shue (2015). For work on underreactions to news see Giglio and Shue (2014) for underreactions to
absence of news, Da et al. (2014) for underreactions to slow-moving information, Tetlock (2011) and Cohen et al. (2015)
for reactions to stale news and subtle changes in filings, Loh (2010) for underreactions to stock recommendations, and
DellaVigna and Pollet (2009), Niessner (2014) and Hirshleifer et al. (2009) for underreactions to news released on days
investors are distracted, like Fridays, around holidays, or days with many other announcements. However, Michaely
et al. (2016) find a selection effect explains the Friday effect. For evidence of limited attention of market makers see
Corwin and Coughenour (2008); Chakrabarty and Moulton (2012)

                                                            1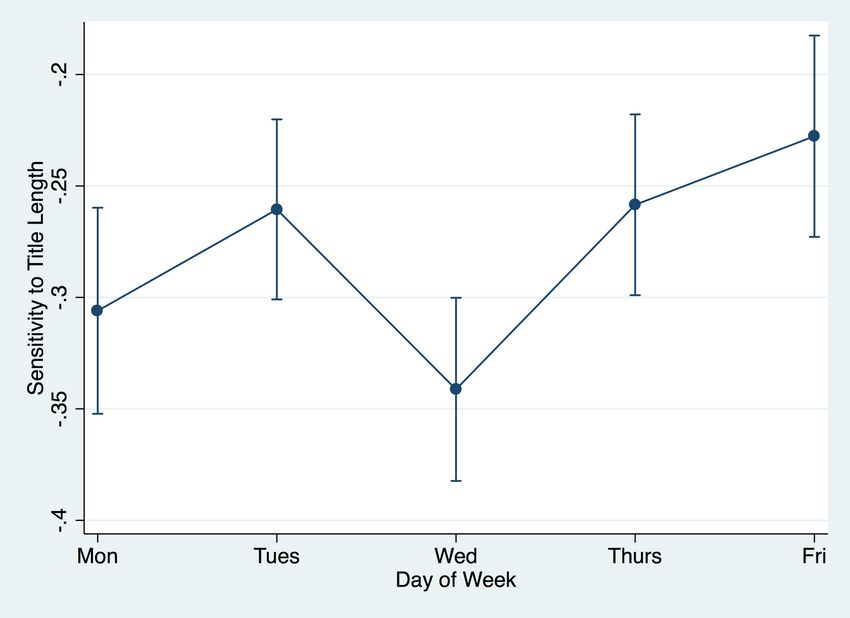
link in the email. I use the number of clicks within 30 minutes of the email being sent to focus
      on attentive and active investors. I also measure the number of investors who scrolled to the end
      of the report by title. These direct measures of attention to a specific text differ from measures
      of attention used in prior studies, including Google search volume, extreme returns, abnormal
      trading, and advertising expenses.2
         The Seeking Alpha-title-testing data allow me to employ a stock-report fixed effect to examine,
      within-a-report, how differences in title characteristics lead to differences in attention to news.
      The setting uniquely holds fixed the event discussed, as well as the topic firm, author, and
      date. The randomized assignment of titles to investors tracking the company ensures omitted
      characteristics of the recipient investors and the news event are not driving the relation between
      textual attributes and attention. In short, the title-testing data reveals what investor attention
      to the same news story would have been if a different title were chosen.
         Using the stock-report fixed effect, I find that investors are significantly more attracted to
      short and simple titles. A one-standard-deviation increase in title length leads to 12% fewer page
      views. To help appreciate the magnitude, consider that, within a firm, investors pay 8% more
      attention to stock reports released on days when the VIX is a standard-deviation higher. I find a
      similar negative relation between attention and both average word length and number of words,
      suggesting that investors prefer shorter and simpler titles. The magnitudes are surprisingly large
      given that the subjects are investors in a high-stakes setting and have indicated an interest in the
      news by signing up to receive alert emails on the company. Also, the subjects are highly-engaged
      investors, who respond within 30 minutes of an email alert. One might expect that the magnitudes
      are even larger for less-engaged and less-interested investors. I find similar magnitudes when
      comparing pairs of titles with very similar word usage and character length and when examining
      very short titles that would easily fit on a mobile phone’s screen. While conventional wisdom tends
      to recommend shorter and simpler writing, the authors of these stock reports appear to routinely
      violate the convention by proposing longer titles, which predictably garner less attention.
         I also find that negative titles attract investor attention, and positive titles repel attention.
      Using Bill McDonald’s lexicons adapted for financial texts, I measure sentiment by counting the
      number of negative and positive words in titles (Loughran and McDonald, 2011). A standard-
      deviation increase in a title’s negativity predicts a 2% increase in page views. The magnitude
      of the effect of sentiment on attention is likely attenuated as sentiment is difficult to measure,
      especially for short titles. However, the effect decreases by 20% if I control for title complexity.
      This result shows that controlling for complexity is important in studies exploring the relation
      between sentiment and market outcomes. Also, the negative attention-sentiment relation suggests
      investors are more attracted to dis-confirming news, assuming Seeking Alpha investors are mostly
      long-oriented investors.
  2
    Da et al. (2011), Bank et al. (2011), and Drake2012 uses Google Search Volume. Barber and Odean (2008) uses
abnormal trading volume. Gervais et al. (2001); Barber and Odean (2008); Hou et al. (2009) use abnormal returns.
Grullon et al. (2004); Chemmanur and Yan (2009); Fang and Peress (2009); Lou (2014); Ahern and Sosyura (2015) use
advertising expense. Yuan (2008, 2015) and Li and Yu (2012) use new market highs.

                                                       2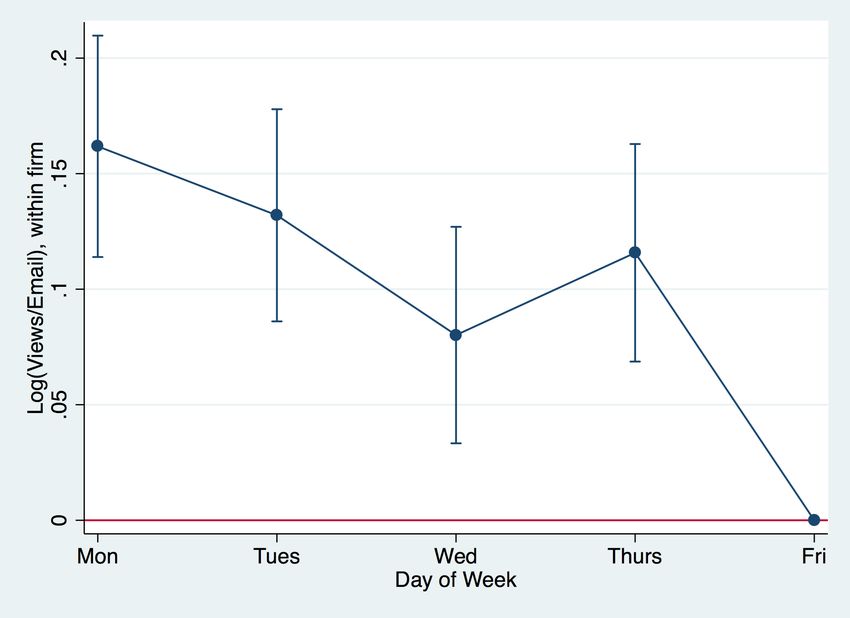
The attraction to short, simple, and negative titles is stronger when the investors tracking
      a company are less-sophisticated. I do not have direct data describing the individuals receiving
      email alerts. However, the public comment section of stock reports reveals individual identities,
      allowing me to derive measures that characterize the sophistication of investors tracking the firm.
      The average sophistication of investors who write stock reports is likely to be higher than those
      who only read reports. Also, more sophisticated investors are likely to be more numerical and
      write longer comments. Consistent with this reasoning, I find that commenters who self-report
      having an MBA and a occupation in finance tend to write more numerical and detailed comments
      than those that do not. I find the sensitivities of attention to title length and sentiment increase
      with the fraction of comments from investors who have never written a stock report and decreases
      with the numerical intensity of comments, the average length of comments, and the proportion
      of commenters with MBAs and in finance jobs.
          I also find that investors who access reports with longer titles are more thorough. The data in-
      clude the number of investors who scroll to the end of the report by title received. The underlying
      stock report is the same so that differences in the propensity to read to the end must be due to a
      selection effect. I find that investors who do access stock reports with longer titles are significantly
      more likely to read the full report. These findings are consistent with more-sophisticated investors
      being less complexity averse, which may help explain prior findings showing that cognitive abil-
      ities are related to financial outcomes.3 Even academics appear complexity averse, because an
      author’s papers on Social Science Research Network with twice the title length receive 11% fewer
      views, 13% fewer downloads, and 4% fewer citations.
          Although the title-testing data with randomization holds the context fixed, I do not write the
      sampled titles. Instead, analysts craft the titles. Therefore, longer and more positive titles might
      be more informative, reducing the need to read the stock report. Also, I have not isolated changes
      in the complexity of titles from changes in other attributes of titles.
          To resolve this concern, I use the length of a company’s legal name to instrument for title
      length. Seeking Alpha titles nearly always include a company’s name, and companies with longer
      names in an industry tend to also have longer titles. The length of a company’s legal name
      likely satisfies the exclusion restriction as legal names are chosen in the past and thus do not
      provide investors with new information. For example, company-name length is unrelated to the
      earnings surprise and tone of news. However, I do find that company-name length is negatively
      correlated with firm size, but after controlling for a polynomial of firm size, company-name length
      is not meaningfully related to other firm characteristics. Also, adding firm controls beyond firm
      size does not alter regression results, consistent with name length providing plausibly exogenous
      variation in title length conditional on firm size.
          Using the instrument, I find a negative effect of title length on page views. I also find a
      positive effect of title length on the read-to-end rate. The instrumental-variables results suggest
      investors are complexity averse and not simply reading longer titles less because longer titles are
3
    See Feng and Seasholes (2005); Grinblatt et al. (2008); Agarwal et al. (2009); Grinblatt et al. (2009, 2011).

                                                           3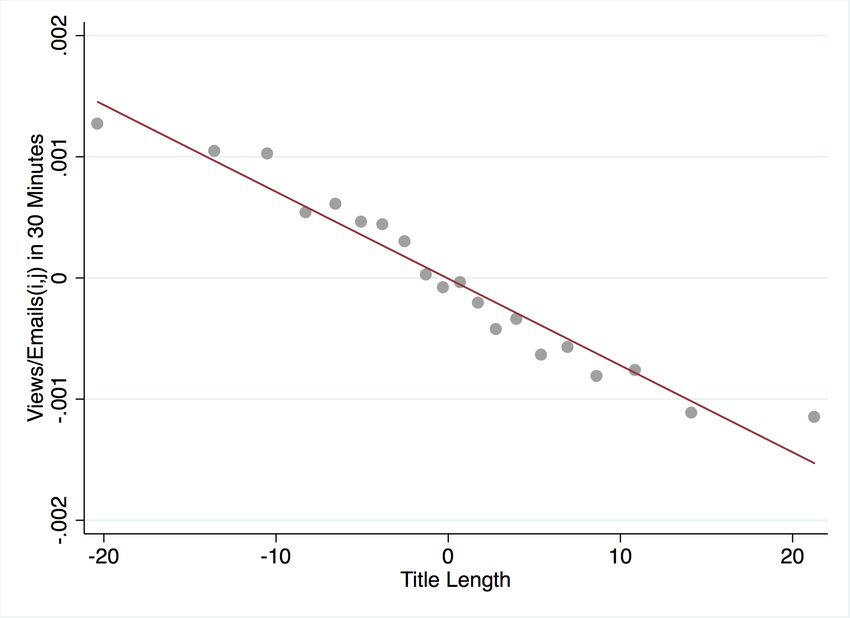
more informative. The magnitudes are not significantly different form those determined using
the title-testing data, offering a nice test of the instrument before applying the instrument to the
titles of company-earnings-press releases. I find similar results if I split title length into length
associated with content and length associated with the firm’s name. If the information story were
true, then only length associated with content should be negatively related to attention. Instead,
I find that each character associated with the name and content have nearly identical negative
effects on attention, controlling for the other.
   The evidence of complexity aversion for investors on Seeking Alpha motivates examining
whether, in aggregate, investors underreact to company-issued news releases with longer titles.
One could argue that while the behavior demonstrated by Seeking Alpha investors likely affects
individual trading activity, notably of less-sophisticated investors, the behavior may not matter
for financial markets (Barber and Odean, 2008; Barber et al., 2009; Huddart et al., 2009; Loewen-
stein et al., 2016; Engelberg and Parsons, 2016). Headline length is unlikely to affect meaningfully
the attention of sophisticated and algorithmic investors. However, if headline length does matter
for investor attention, the studies highlighted in the first paragraph suggest headlines may affect
firm and market outcomes.
   I assemble a database of approximately 480,000 company-issued-earnings releases distributed
via PR Newswire and Business Wire during 1988 to 2016. Note that I am no longer using
Seeking Alpha data but rather earnings-press-release data. To isolate variation in title length
that is unrelated to the event reported, I instrument title length with the length of the company’s
legal name.
   I find a significant negative effect of title length on abnormal turnover. A standard-deviation
increase in a title’s length predicts 7% less announcement turnover and 9% fewer trades on the
Nasdaq exchange. The magnitudes are comparable to the effects title length has on the attention
of Seeking Alpha investors and thus, support the external relevance of the Seeking Alpha results.
Also, the negative relations occur on the announcement day but not before, consistent with title
length reducing initial attention to news. The effects are robust to splits on time and firm size,
and directionally stronger for smaller firms.
   Title length also negatively affects abnormal-announcement volatility, captured by the day’s
intraday-price range. A standard-deviation increase in a title’s length predicts a 60-basis-points-
tighter-intraday-price range. Less attention to complex news appears to reduce volatility, which
contrasts with the interpretation of prior findings that complex 10-Ks correlate with greater
post-filing volatility. The length of 10-K filings may be a measure of both complexity and event
type.
   I also find evidence of return underreactions for earnings news with longer titles. A standard-
deviation increase in a title’s length predicts a 15-basis-points return underreaction for negative
news and a negligible underreaction to positive news. In other words, I find that stock prices
do not fall as much for negative news with non-informatively longer titles. I determine negative
news by comparing actual earnings to analyst expectations. The complexity effect may matter

                                                   4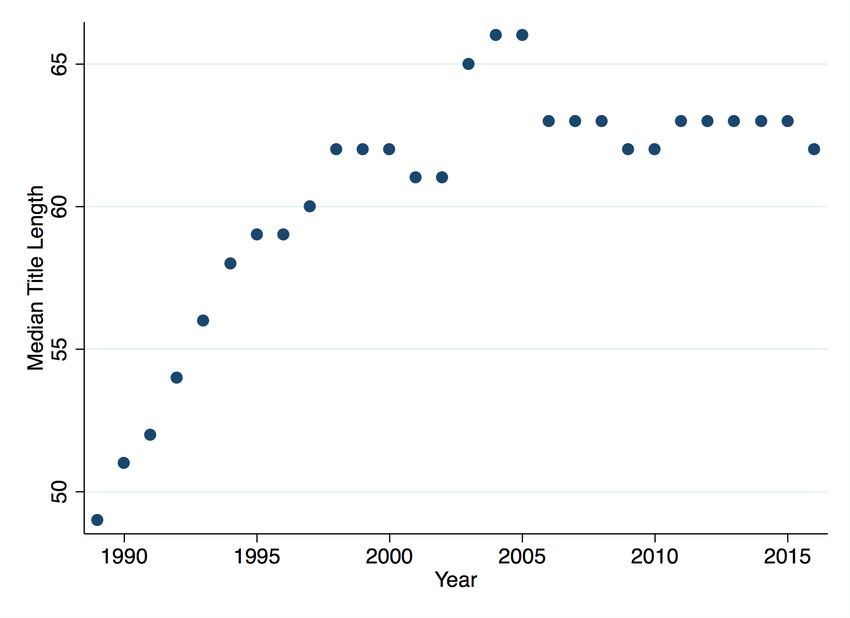
more for negative news than for positive news if shorting constraints are binding. I provide
statistical evidence of a reversal in the next three months, which is consistent with the instrument
– company-name length – capturing non-informative variation in title length.
The market effects of complexity varies with how surprising the event is, analyst coverage of
the firm, the sophistication of the investor base, and whether the release occurs in the morning
or after the market closes. First, larger earnings surprises might grab the interest of investors
and the media more than quiet news, reducing the relative importance of textual attributes
for attention to the news. Similarly, analysts likely amplify the content of an earnings release,
weakening the importance of textual attributes. Consistent with this logic complexity matters
less for bigger earnings surprises and for firms with analyst coverage. Second, more-sophisticated
investors should be less sensitive to complexity per the Seeking Alpha results. Consistent with
this logic, I find that complexity matters less when more shares are held by institutional investors.
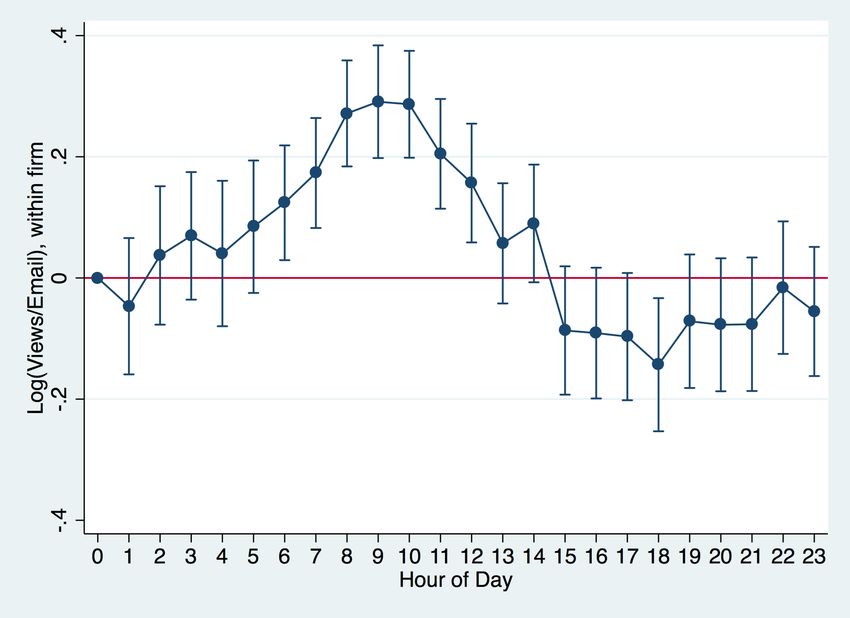
Third, I show that Seeking Alpha investors are 20% more likely to read stock reports released in
the morning relative to reports released in the afternoon. Consistent with this pattern in attention
among Seeking Alpha investors, I find that underreactions to earnings announcements due to the
complexity of headlines is greater for earnings announcements released after the market’s close.
The effect of complexity on volatile and busy days is ambiguous. On the one hand, on volatile
and busy days, investors are more time constrained and inclined to skip complex news (Hirshleifer
et al., 2009). On the other hand, textual attributes may matter less for attention on busy days
if the benefits to reading news are relatively greater or the media lowers information processing
costs by allocating more attention to financial news. Consistent with the latter reasoning, Seeking
Alpha investors are more likely to read a report released on busy-news and high-VIX days. Also,
I find the market effects of title length are greater on low-volatility and slow-news days. My
results expand on the evidence of an “Ostrich Effect” provided by Loewenstein et al. (2016), who
find that investors are less likely to login to their brokerage account on high-VIX days. Unlike
ostriches, investor demand for news increases on high-VIX days, but like ostriches, investors seem
to hide from negative returns by not logging into their accounts.
Given the effects titles have on attention to news, I next examine whether firms strategically
choose titles. The results thus far suggest firms reporting positive news should write shorter
titles. Instead, firm’s write significantly longer titles for positive news. However, firms reporting
positive news do tend to use more abbreviations, such as “Q3” for “third quarter.” I find evidence
consistent with this reasoning as firms are more likely to abbreviate such phrases for positive
earnings surprises. A firm could also adjust the firm’s name in the headline by dropping parts of
the name like “Inc.” or “Limited,” but I find no relation between the earnings surprise and the
length of a firm’s name in the headline. Also, firm’s seem to be increasingly ignoring the advice
to write shorter and simpler titles as press-release titles have been getting longer since 1988.
In addition to the aforementioned contributions, these results inform debates about how to
5write an optimal headline. Some recommend short titles, while others recommend detailed titles.4
Prior efforts to identify optimal title lengths lack identification and outcomes vary widely (Face-
book headlines: 40 characters, LinkedIn blog post headlines: 80-120 characters).5 While title
testing is becoming more popular, this paper is the first academic study to analyze title-testing
data in any field.
2 Seeking Alpha and Title-Testing
Founded in 2004, Seeking Alpha has become the leading-crowdsourced-investment-research firm,
owned by David Jackson and venture capital firms Benchmark, Accel, and DAG Ventures. The
platform is highly active, with 4 million registered investors and 85 million page views per month.6
The community includes over 10,000 contributing analysts writing stock reports and 280,000
commenters. Stock reports cover a broad range of firms, including more than 4,000 small- and
mid-cap stocks in the past year across a variety of sectors. Motivations for investors to write
stock reports include, receiving quick feedback on theses from thousands of other investors and
building public reputations. Seeking Alpha’s primary revenue source is online advertising.
The audience includes money managers, sell-side analysts, investment bankers, financial advi-
sors, business leaders, entrepreneurs, and retail investors. Over 20% of the audience are financial
professionals. Readers tend to be highly active investors. Over 50% of readers purchased stocks
in the trailing 30 days. Almost 90% of unique visitors own securities. The readers also tend to
be wealthy, with the highest percentage of readers, among any major finance website, managing
portfolios with assets greater than $50,000, $100,000, $250,000, $500,000, and $1,000,000.
Seeking Alpha hires editors to make sure stock reports are well written and not repetitive
of prior published reports. The community generates 600 submissions a day and after editorial
review, approximately 200 reports are published. The editors provide guaranteed monetary re-
wards for content: $35 basic plus $0.01 per page view, $150 guaranteed minimum for must-read,
and $500 guaranteed minimum for top-idea. Analysts build a reputation and get feedback via
comments to stock reports. The content produced is valuable. Chen et al. (2014) finds the sen-
timent of the Seeking Alpha stock reports and comments predict future returns. Only a small
proportion of articles appear to be undisclosed promotions paid for by companies, and these are
usually small drug companies (Moskowitz et al., 2017).
Starting January 3, 2016, Seeking Alpha began “title testing.” An analyst may propose two
titles for a stock report, and the editor assigned to review the stock report may propose a third
title. The three titles are sampled with random assignment on investors signed up for alerts on
the topic company. Figure 1 illustrates three example real-time alert emails sent during the title-
4
Advice to write short headlines: https://www.nngroup.com/articles/worlds-best-headlines-bbc-news/. Ad-
vice to write long headlines: https://www.poynter.org/2014/top-8-secrets-of-how-to-write-an-upworthy-headline/
255886/.
5
See https://blog.bufferapp.com/optimal-length-social-media.
6
See http://seekingalpha.com/page/who_reads_sa.
6testing program for a single report. Each email alert contains the stock report’s title in bold, the
author’s name, a time stamp, and a link to the full stock report. Notice that all elements other
than the title are the same across alert emails and that none of the body of the stock report is
included in the alert email. Also, there is only one title (news article) per email. In this example,
the proposed titles randomly assigned to investors are “Freeport-McMoRan: Capitulation?,”
“Freeport-McMoRan: Keep an Eye on Cashflows,” and “Freeport-McMoRan: Tempting, But
Risky At $4.” These alerts were sent to 8,373, 8,274 and 8,289 investors respectively. Within 30
minutes, the titles received 220, 154, and 133 clicks, respectively. Seeking Alpha’s title-testing
algorithm chooses the title with the most page views after an interval of time as the winning title.
Figure 1: Example of email alerts sent during Seeking Alpha’s title-testing program. Each of the three alert
emails contains one of the three proposed titles for a specific stock report written by Stone Fox Capital on
Freeport-McMoRan. The emails were sent to 8,373, 8,274 and 8,289 investors tracking Freeport-McMoRan,
respectively, with random assignment of titles to investors. The chief measure of attention is the number of
investors who click the “Read the full article now” link to view the body of the stock report within 30 minutes
of the alert email being sent. The titles received 220, 154, and 133 views within 30 minutes, respectively.
Email 1
Email 2
Email 3
Seeking Alpha runs title testing for over 100 stock reports per day. Seeking Alpha does not
run title testing on stock reports that editors chose as must-read or top-idea, because these are
embargoed for paying subscribers for 24 hours, and the population of paying subscribers is too
small at the moment. The ultimate audience of the stock report is global. Seeking Alpha emails
7the report in a “Daily Investing Ideas” email to over 500,000 subscribers and publishes the report
on major news feeds.
Whereas press releases are primarily distributed before the market opens or following the
market’s close, the distribution of Seeking Alpha email alerts peaks during market hours between
10AM and 1PM EST. The mean click rate in 30 minutes on email alerts is 1.5%. The click rate
is meaningfully higher for smaller and less popular companies.
As of December 2016, the Wall Street Journal and the Financial Times have not implemented
title testing, making the Seeking Alpha data unique for studying how investors respond to the
textual attributes of financial information.
3 Data Summary Statistics
Table 1: Summary Statistics
Title-testing data from Seeking Alpha, January 4, 2016, to December 2, 2016
Variable Mean SD p25 p50 p75 N
By Company
Market Capitalization (million) 11333 34497 352 1653 7525 1856
Log Market Capitalization 21.2 2.1 19.7 21.2 22.7 1856
Number of Real Time Alert Subscribers 4429 12254 620 1441 3797 1856
Length of Company’s Legal Name 21.3 7.8 16 21 27 1856
Log Length of Company’s Legal Name 3.0 0.4 2.8 3.0 3.3 1856
By Title
Title Length (characters) 48.7 17.3 36 46 59 22629
Log Title Length 3.8 0.4 3.6 3.8 4.1 22629
Fraction of Negative Words in Title (%) 4.4 9.7 0 0 0 22629
Fraction of Positive Words in Title (%) 6.9 11.5 0 0 13 22629
Fraction of Positive-Negative Words in Title (%) 2.6 15.8 0 0 11 22629
% Yield (Views/Email in 30 minutes) 1.5 1.6 0.5 1.0 1.9 22629
By Day
VIX (%) 16.1 4.0 13.4 14.7 18.2 232
Press-release data from PR Newswire and Business Wire, 1988-2016
Variable Mean SD p25 p50 p75 N
By Company
Market Capitalization (million) 1177 6278 33 120 498 15335
Log Market Capitalization 18.7 2.0 17 19 20 15335
Length of Company’s Legal Name 20.4 6.5 15 21 25 15335
Log Length of Company’s Legal Name 3.0 0.4 2.7 3.0 3.2 15335
By Press Release
Title Length (characters) 66.9 24.1 50 62 78 480718
Log Title Length 4.1 0.3 3.9 4.1 4.4 480718
Log Turnover(t) x 100 -5.4 1.6 -6.4 -5.3 -4.3 480718
Log Intraday Price Range(t) x 100 6.5 7.4 2.5 4.6 8.2 480718
Log Return(t) x 100 -0.17 7.4 -3.0 0.0 3.1 480718
3.1 Seeking Alpha Title-Testing Data
The title-testing program began January 3, 2016 and is ongoing. My sample period ends December
2, 2016, and includes 18,572 unique reports with 41,525 titles covering 3,573 unique securities.
8I match each stock report with CRSP data. I discard observations that do not match with
CRSP, including all stock reports covering OTC stocks. For this paper, I exclude stock reports
about macroeconomic events, ETFs, mutual funds, REITS, currency, retirement, and commodi-
ties. An attraction to shorter, simpler, and more negative headlines also holds for investors
following these other assets. I limit the sample to stock reports released on non-holiday week-
days. This approach reduces the sample to 9,944 unique stock reports with 22,623 titles for 1,856
companies.
For each stock report, the data include the titles associated with the stock report, the number
of emails sent by title, the timestamp of the emails (all three emails sent at same time), and an
identifier for whether the title was from the analyst (original or alternative) or from the editor.
The page-view data by title capture the number of clicks on a specific title in the 30-minutes
following an email alert. For January and February 2016, I have data on page views for all 30-
minute intervals in the 24 hours following the time an email alert is sent. For this limited period,
I also have data on the number of email alert subscribers who read the full stock report, measured
as the number who scrolled to the end of the report within 24 hours.
Each of the two-or-three titles is not equally likely to have the most page views ex-ante.
Appendix A.10 Table 20 shows the analyst’s alternative title is less likely to have the most page
views and is slightly longer and more positive when compared to the analyst’s original title. The
editor’s title is generally shorter and more positive in tone than the analyst’s original title and
is less likely to receive the most page views, even though editors are likely more experienced
at writing titles. I include dummy variables reflecting whether a title is the author’s original,
author’s alternative, or editor’s title in all regressions using Seeking Alpha data. The results in
this paper hold if I discard the editor’s title.
I supplement the data by gathering the body of stock reports and all of the comments. The
comment data help gauge the sophistication of investors paying attention to the stock. I also
collect data on the author (analyst), including the number of years as an author, the number of
followers, the number of published stock reports, whether self-reports as a finance professional,
and whether self-reports having an MBA. I gather similar data for those investors that comment
on stock reports.
In Table 1, the summary statistics show that the median firm has a market capitalization of
$1.6 billion and has 1,441 investors signed up for alert emails. The median title has 1% of email
recipients click in the first 30 minutes. The table also shows that the sentiment of titles tends
to be more positive than negative as at the 75-th percentile 13% of a title is positive and 0% is
negative. The sentiment statistics also suggest that the sentiment of titles is difficult to measure,
which may attenuate my results.
3.2 Earnings-Press-Release Data
Using Seeking Alpha-title-testing data, I show investors exhibit strong attractions to short, simple,
and negative titles. I cannot use the Seeking Alpha-title-testing data to identify the effect of title
9length on market reactions to news. Instead, I transition to a new empirical setting and examine
the effect of the lengths of headlines of company-issued-earnings-press releases on market reactions
to the releases. I focus on earnings announcements as I can measure the earnings surprises and the
announcements occur regularly for all firms, are prescheduled, and provide important information
to investors.
I collect press-release titles from PR Newswire and Business Wire for the years 1988 to 2016.
These two newswires are the primary means of distributing news for public companies. I match
earnings releases with market data from CRSP based on the date and company’s ticker symbol
used in the press release. I exclude over-the-counter stocks as these stocks are not included in
CRSP. I match earnings announcements with I/B/E/S estimates to capture analyst expectations.
I keep firms without analyst coverage. I also match earnings announcements with the latest
Compustat last-twelve-months firm characteristics released at least 6 months prior to the current
earnings announcement.
The final sample contains 480,718 earnings announcements from 15,335 firms for the years
1988 to 2016. The 25th percentile firm has 10 releases, and the 75th percentile firm has 45
releases. Approximately 60% of earnings announcements have analyst earnings estimate data
available from I/B/E/S. The median company has a market capitalization of 120 million, which
is considerably smaller than the median firm in the Seeking Alpha data of $1.6 billion.
4 Empirical Results
In all regressions, unless otherwise noted, variables are standardized for ease of comparability.
4.1 Complexity and Attention
I measure the complexity of titles by calculating the title’s length in characters, number of words,
word length, and word usage frequencies. Title length is a function of the number of words
and the average word length. Longer words tend to be more difficult to understand, and more
words require greater synthesis to interpret. Less common words may also be more challenging
to understand. I measure a word’s usage frequency by counting the number of times the word
appears in Seeking Alpha headlines from 2006 to 2015, which predates the title-testing data.7 I
then divide by the total number of words in titles for that period. I exclude company names when
calculating usage frequencies.
Table 2 shows the following empirical specification: regression of page views by title on mea-
sures of complexity by title. Page views are measured over the 30 minutes following an alert
email, capturing variation in the attention of highly engaged investors who indicated an interest
7
The results are similar if word frequency is calculated using the frequency of words in 10-K filings from 1994 to
2014.
10in the firm’s news by signing up for email alerts:
Views/Emailsi,j ∼ βTitle Complexityi,j + αj + i,j
Because the three titles i for stock report j are randomly assigned, β captures the average effect
of textual attributes on attention. The αj is the stock report fixed effect, which uniquely holds
fixed the event as well as the firm, author, event, and date. Random assignment of titles to
investors makes the distribution of omitted characteristics of the audience similar across titles in
expectation. I cluster standard errors by stock report, and the significance of the results is robust
to other forms of clustering. Throughout the paper I standardize regression variables for ease of
comparing magnitudes.
To illustrate variation in title length within a stock report holding the context fixed, consider
the following two titles.
• Bank of America is an attractive long term investment
• Bank of America is an attractive investment if your horizon is longer than a year
The first title received 195 page views in 30 minutes. The second title received 159 page views in
30 minutes.
Table 2 regression (1) shows a significant positive relation between title length and attention.
However, regression (2), which includes the stock report fixed effect, shows a significant negative
relation between title length and page views. The flip of the sign shows that the unconditional
relation is biased by omitted variables related to the event, author, date, or firm. For example,
for a larger company, the fraction of investors that access a stock report is smaller and the titles
tend to be shorter, which together would create a positive bias.
Using the stock-report fixed effect, a standard-deviation increase in title length predicts 12%-
fewer page views. This magnitude compares to the relation between the VIX and activity on
Seeking Alpha. Appendix A.9 Table 19 shows that, within a firm, investors pay 8% more atten-
tion to stock reports released on days when the VIX is a standard-deviation higher. Also, this
magnitude characterizes the behavior of investors who have indicated an interest in the news by
signing up for alert emails. Less-interested investors may have a higher sensitivity to title length.
The within-R2 is 6%, suggesting title length is an important explanatory variable for attention.8
Table 2 regression (3) shows a negative relation between attention and both the average length
of words in the title and the number of words. This result suggests that investors prefer simpler
titles with fewer words and shorter words. Regression (4) shows a negative relation between the
frequency of the least common word (relative to all past titles from 2006 to 2015) and attention.
The negative relation suggests less-common words attract more attention. These results suggest
unusual information attracts attention, but measures of length repel attention.
8
I conduct 10,000 bootstrap out-of-sample tests to evaluate the out-of-sample explanatory power of this relation.
The model is estimated using 50% of the stock reports, regressing within-stock-report page views on within-stock-report
variation in title length. Testing the model shows 95% of R2 estimates are between 5% to 7%.
11The negative relation is not driven only by titles that are very different in length or content.
Figure 2 shows a clear negative relation in levels between within-stock-report page views and
within-stock-report title length. Appendix A.1 and A.2 confirm that the negative relation can be
identified even when the sample is restricted to titles that are at most 3 characters different in
length and when the sample is restricted to titles with low- and high-word overlap. These findings
speak to the robustness of the relations and suggest that differences in information content are
not driving the results.
Table 2: Regressions of investor attention on title complexity, using Seeking Alpha-title-testing data. The
attention measure is the fraction of email alerts sent that investors click on, calculated by randomly assigned
title. Title length is measured in characters. Title length is decomposed into average word length and number
of words. The frequency of the least common word in the title (excludes firm name) is measured relative to
word usage in Seeking Alpha titles from 2006 to 2015. Regressions (2) to (4) include an article fixed effect,
which holds the event, firm, author, and date fixed. All variables are standardized, and standard errors are
clustered by article.
Page Views/Emails
(1) (2) (3) (4)
Title Length 0.04∗∗∗ -0.11∗∗∗
(0.01) (0.00)
Average Word Length -0.05∗∗∗ -0.05∗∗∗
(0.00) (0.00)
Number of Words -0.11∗∗∗ -0.11∗∗∗
(0.00) (0.00)
Frequency of Least Common Word in Title -0.01∗∗∗
(0.00)
Article FE No Yes Yes Yes
Adjusted R2 0.03 0.91 0.91 0.91
Within R2 . 0.06 0.06 0.06
Num. Articles 9947 9947 9947 9947
Observations 22629 22629 22629 22629
4.2 Sentiment and Attention
This section examines, using the Seeking Alpha title-testing data, whether the sentiment of head-
lines matters for investor attention. No prior studies have cleanly documented a relation between
title sentiment and attention holding the event, firm, author, and date fixed. On the one hand,
more positive titles may garner more attention due to confirmation bias, assuming investors on
Seeking Alpha are mostly holding long positions. On the other hand, investors may be less willing
to pay the costs of engaging with positive news. Consistent with the latter reasoning, I find a
positive relation between the negativity of titles and attention.
To measure the sentiment of titles, I count the number of positive and negative words in a
title using Bill McDonald’s lexicons (lists) of positive and negative words (Loughran and Mc-
Donald, 2011). The net sentiment of a title is the number of positive words less the number of
negative words divided by the number of words in the title. I exclude the firm’s name from these
calculations.
Table 3 regression (1) does not include an article fixed effect and suggests the raw correlation
between net sentiment and attention is not significantly different from zero. In contrast, using the
12Figure 2: Binned scatter plot illustrating the relation between title length in characters and readership
(views/emails) in the first 30 minutes following the time alert emails are sent. Title length and yield are
demeaned at the stock report level, so that “0” denotes the average yield and average title length for a single
stock report. The bin scatterplot divides the sample by title length into equal-sized groups. The mean yield
is then determined for each group and plotted as a point.
article fixed effect, regression (2) shows that positive sentiment reduces attention. This difference
suggests omitted variables related to the firm, date, and event bias the results. For example,
larger firms tend to have less positive sentiment and lower readership yields, inducing a positive
relation between net sentiment and attention. The magnitude of the coefficient suggests that
a standard-deviation increase in a title’s net sentiment predicts a 2% increase in page views.
The magnitude is likely attenuated as measuring sentiment is difficult, especially for short titles.
In regression (5), I decompose net sentiment into the fraction of positive and negative words.
Positive words are negatively related to attention, while negative words are positively related to
attention.
Because measures of complexity and sentiment are correlated, I control for title length in
regression (3). Controlling for length reduces the magnitude of the coefficient on Net Sentiment,
as estimated in regression (2), by 20%, suggesting that studies of sentiment in finance should
account for textual complexity.
4.3 Cognitive Abilities and Attention
I now examine whether the sensitivities of investor attention to title length and sentiment are
stronger for less-sophisticated investors. I would prefer to use a direct measure of the sophis-
tication of investors signed up for alert emails. However, I do not have these data. Instead, I
take advantage of individual data revealed in the actively used comment sections of stock reports
to characterize the sophistication of the topic company’s followers. About 60% of comments are
13Table 3: Regressions showing relation between title sentiment and investor attention, using Seeking Alpha-
title-testing data. Title sentiment is measured using the number of words in the title (excluding firm name)
that appear in the Bill and McDonald lexicons of positive and negative words. The number of positive and
negative words is then scaled by the number of words in the title (excluding firm name). Regressions (2) to
(4) include a stock report fixed effect. All variables are standardized, and standard errors are clustered by
stock report.
Views/Emails
(1) (2) (3) (4) (5)
Net Sentiment 0.002 -0.021∗∗∗ -0.017∗∗∗ -0.015∗∗∗
(0.008) (0.003) (0.003) (0.00)
Net Sentiment x Numerical Comments 0.008∗∗
(0.004)
Positive Sentiment -0.017∗∗∗
(0.003)
Negative Sentiment 0.007∗∗
(0.003)
Title Length -0.106∗∗∗ -0.106∗∗∗ -0.105∗∗∗
(0.003) (0.004) (0.004)
Article FE No Yes Yes Yes Yes
Adjusted R2 0.02 0.90 0.91 0.91 0.91
Within R2 0.00 0.00 0.07 0.07 0.07
Num. Articles 9947 9947 9947 9538 9947
Observations 22629 22629 22629 21731 22629
made on the day of the report’s publication, and 20% of comments are made on the following day.
Comments from investors who have contributed a stock report on Seeking Alpha previously may
be more sophisticated on average than investors who have never contributed a stock report. Also,
more-sophisticated investors may be more numerical and write longer comments. More numerical
comments have more digits relative to total characters. Lastly, investors who self-report holding
a finance job and having an MBA or CFA are likely more sophisticated, and I find these investors
write longer and more numerical comments.
Table 4 regression (3) shows that when more comments come from investors who have never
contributed a stock report, the negative sensitivity to title length is stronger. Regressions (4)
and (5) show that the sensitivity to title length appears to be weaker when comments are more
numerical and longer. Regressions (6) and (7) show a weaker sensitivity when more of the audience
appear to be finance professionals and investors who self-report having an MBA or CFA. I also
look at variation in the sensitivity with firm size and popularity since less-sophisticated investors
are more likely to be aware of larger and more popular firms (ρ = 0.7 between size and popularity)
(Barber and Odean, 2008). Regressions (1) and (2) show that when the company is larger and
more popular, the audience seems to be more sensitive to title length. These results suggest
complexity aversion is lower for more-sophisticated investors. Similarly, Table 3 regression (4)
shows that more-sophisticated investors appear to be less sensitive to the sentiment of titles.
Another way to gauge whether sophisticated investors have less complexity aversion is to
examine the reading intensity of those who click on a relatively longer title. The underlying
report is the same, and because of randomization, characteristics of the audience receiving each
title are similar. Thus, any differences in read-to-end rates (number who scroll to bottom of the
14Table 4: Regressions showing how the sensitivity of investor attention to title complexity varies in the
cross-section of investor sophistication, using Seeking Alpha-title-testing data. Title length is measured in
characters. Title length is interacted with firm size, number of followers (number of Seeking Alpha investors
signed up to receive email alerts for the topic company), the fraction of article comments from non-analysts
(Seeking Alpha investors who have never written a stock report), the average length of comments, the fraction
of characters in comments that are digits (“numerical comments”), the fraction of comments from users who
self-report having a finance job, and the fraction of users who self-report having an MBA or CFA. Each
regression includes an article fixed effect, which holds the event, firm, author, and date fixed. All variables
are standardized, and the standard errors are clustered by stock report.
Page Views/Emails
(1) (2) (3) (4) (5) (6) (7)
Title Length -0.11∗∗∗ -0.11∗∗∗ -0.11∗∗∗ -0.11∗∗∗ -0.11∗∗∗ -0.11∗∗∗ -0.11∗∗∗
(0.00) (0.00) (0.00) (0.00) (0.00) (0.00) (0.00)
Title Length x Market Cap -0.02∗∗∗
(0.00)
Title Length x Followers -0.02∗∗∗
(0.00)
Title Length x Fraction Comments Non-Analyst -0.01∗∗∗
(0.00)
Title Length x Avg. Comment Length 0.01∗
(0.00)
Title Length x Numerical Comments 0.01∗∗
(0.00)
Title Length x Fraction Comments from Finance Professionals 0.03∗∗∗
(0.01)
Title Length x Fraction Comments form MBA or CFA 0.02∗∗∗
(0.00)
Article FE Yes Yes Yes Yes Yes Yes Yes
Adjusted R2 0.91 0.91 0.91 0.91 0.91 0.91 0.91
Within R2 0.07 0.07 0.07 0.07 0.07 0.07 0.07
Num. Articles 9538 9538 9538 9538 9538 9538 9538
Observations 21725 21731 21731 21731 21731 21725 21725
Standard errors in parentheses
∗
p < 0.10, ∗∗ p < 0.05, ∗∗∗ p < 0.01
article) predicted by title length must be due to a difference in the composition of readers who
viewed the title, a selection effect. Table 5 regression (2) shows the relation between title length
and the number of investors who read the full stock report in the 24 hours following the alert
email, controlling for the number of investors who click on the stock report. The data is only
available for January and February of 2016. The coefficient on title length is positive and highly
significant. A standard-deviation increase in title length predicts a 4% higher read-to-end rate.
This finding is consistent with more-sophisticated investors being less sensitive to title length and
generally more thorough in information acquisition.
4.4 Instrument for Title Length
At this point, I still cannot formally conclude title complexity affects attention. Complexity is
correlated with other attributes, such as sentiment. Also, more complex titles might provide
more information, reducing the need to click to read the stock report. More informative titles
may also lead to better matches between an investor’s interests and the content of the report.
In the previous tests, I did split the sample to try to mitigate information differences. Again, I
showed that the negative relation with title length has a similar magnitude when estimated using
15Table 5: Regressions showing the relation between the read-to-end rate (the fraction of investors who read
the full stock report conditional on viewing the report) and title length, using Seeking Alpha-title-testing data.
Regression (2) includes an article fixed effect, which holds the underlying stock report the same. Due to data
availability, the read-to-end rate sample period is January 4, 2016, to February 29, 2016. All variables are
standardized, and the standard errors are clustered by stock report.
Read-to-End Rate
(1) (2)
Title Length 0.21∗∗∗ 0.17∗∗∗
(0.02) (0.01)
Article FE No Yes
Adjusted R2 0.04 0.72
Within R2 0.04 0.05
Number of Articles 1687 1687
Observations 4008 4008
titles that are 3 or fewer characters different and pairs of titles with 90% word overlap.
To shut down the information story, I instrument title length with the length of a company’s
legal name (not the length of the name in the title). The relevance condition is satisfied as Seeking
Alpha headlines generally include the topic company’s name and longer names predict longer titles.
The length of a company’s name is a significant component of a title’s length, making up 21% of a
title’s length on average. A monotonicity condition must hold – all companies with longer names
have on average longer titles because of their longer names. Some company names are defiers
in the sense that the companies have long legal names but commonly used abbreviations (e.g.,
“International Business Machines” uses “IBM”). Excluding any titles with abbreviated names
does not alter the relations.
The exclusion restriction is almost surely satisfied. A company’s legal name is chosen in the
past, and thus the choice is unrelated to the new information discussed in a stock report. Although
a wide variety of firm names is possible, the variety of plausible lengths is smaller. Company-name
length may be correlated with the company’s industry; for example, “ABC pharmaceuticals” is
longer than “XYZ energy.” I include SIC4-industry-by-year fixed effects in regressions to control
for differences in name length across industries and industry trends.
I examine in Table 6 the correlations between company-name length and firm characteristics.
I use Compustat’s 1988 to 2016 annual files. I match the Compustat data with data from CRSP
and ownership data from Thomson. Regression (1) shows a significant negative relation between a
firm’s book value of assets and company-name length. Therefore, I orthogonalize company-name
length to firm size by regressing name length on a third-degree polynomial of log assets and log
debt. I control for SIC4-by-year industry fixed effects and fixed effects for the date of the financial
release. I take the residuals from the regression as “Adjusted Name Length.” Regressions (2)
through (8) show that adjusted-company-name length is unrelated to other firm characteristics
including market capitalization, institutional ownership (shares held by 13-F filers), revenues,
gross margins, the company’s market beta, and age. Also, regression (6) confirms that the length
of the company’s name is unrelated to earnings surprises. One can see the within-R2 goes to
0.00 in these regressions. The lack of a meaningful relation between company-name length and
16a variety of firm characteristics suggests company-name length provides variation in title length
that is unrelated to characteristics of the firm, conditional on a company’s size and industry.9
Table 6: Using the Compustat 1988 to 2016 annual files, this table shows that log company-name length
after adjusting for firm size is mostly unrelated to firm characteristics. “Adj Name Length” is determined by
taking the residuals from a regression of log company name length on a cubic polynomial of log assets and
log debt, while controlling for SIC4-by-year industry fixed effects and fixed effects for the date financials are
released. Institutional ownership is the fraction of shares held by 13-F filers as of December 31 from Thomson.
Earnings surprise is the actual EPS versus the median analyst estimate scaled by the stock price. Market
beta is estimated using the past 5 years of monthly returns. The sample only includes firms with a December
31st year end. Standard errors are clustered by firm and the date financials are released. All variables are
winsorized at the 1% level and standardized.
Name
Adj Name Length
Length
(1) (2) (3) (4) (5) (6) (7) (8)
Total Assets -0.14∗∗∗
(0.00)
Market Capitalization -0.02
(0.02)
Institutional Ownership -0.00
(0.02)
Revenue -0.01 -0.04
(0.02) (0.03)
COGS 0.03
(0.03)
Earnings Surprise 0.00
(0.05)
Market Beta 0.01
(0.01)
Age (since IPO) -0.02
(0.02)
Adjusted R2 0.07 -0.13 -0.12 -0.13 -0.14 -0.12 -0.11 -0.11
Within R2 0.01 0.00 0.00 0.00 0.00 0.00 0.00 0.00
Observations 146020 146020 146020 136043 136043 79302 125043 49966
Table 7 regression (1) shows the first-stage regression of title length on the length of a com-
pany’s legal name. The coefficient on company-name length is positive and has a F-statistic
of 192, exceeding the threshold of 10 recommended by Stock and Yogo (2005). The quadratic
term is negative and significant, suggesting that the relation increases at a decreasing rate. In
other words, companies with very long legal names are less likely to use their full names, but
these companies still tend to have longer titles because of their longer names. I use both terms
as instruments in all instrumental variables regressions. Overall, the first stage result suggests
company-name length is highly relevant for title length. Regression (2) regresses the length of
the topic company’s name as it appears in the title on the length of the legal name. Again, there
is a strong positive relation and the R2 is 10%. I can either instrument the length of the full title
or instrument the length of the firm’s name as it appears in the title and control for the length of
other content. Either approach yields similar results, but to avoid the step of carving out a firm’s
name from the title, which requires some processing, I instrument the length of the full title.
9
For further validation of the instrument, see Appendix A.13.
17Table 7 regression (4) shows the instrumental-variable (IV) relation between title length and
attention. One cannot use the article fixed effect because I am exploiting variation in the length
of a company’s legal name. The coefficient of -0.16 is not significantly different from the OLS
coefficient of -0.10 in regression (3).
Table 7 regressions (5) and (6) examine the relation between title length and the read-to-end
rate measure. The IV coefficient of 0.52 from regression (6) is not significantly different from
the coefficient of 0.14 from regression (4). This result shows that the observed selection effect is
driven by non-informative variation in title length, suggesting that investors who are less sensitive
to title length are more thorough and sophisticated. The instrumental-variable results rule out
the competing story that the negative relation between title length and attention occurs simply
because longer titles are more informative.
Table 7: Regressions showing the relation between instrumented-title length and investor attention, using
Seeking Alpha-title-testing data. The instrumental variable is the character length of the firm’s legal name.
Regression (1) is the first-stage of title length regressed on company-name length. Regression (2) is an
alternative first-stage, in which the length of the firm’s name as the name appears in the title is regressed
on the length of the company’s legal name. Regression (3) and (4) show that title length affects the number
of investors who click to view an email. Regression (4) is the instrumental variable regression. Regressions
(5) and (6) show that title length affects the read-to-end rate, or the number of investors who read the full
report conditional on viewing the report. Regression (6) is the instrumental regression, showing that investors
who click on longer titles are also more thorough. All regressions include the number of emails sent by title,
the firm’s market capitalization, and fixed effects for the industry (SIC4) and date. I only have read-to-end
rate data for January and February 2016. Standard errors are clustered by stock report and all variables are
standardized.
(1) (2) (3) (4) (5) (6)
Title Length Name Views/ Views/ Read-to- Read-to-
Length in Title Emails Emails End Rate End Rate
OLS OLS OLS IV OLS IV
Length of Company’s Legal Name 0.15∗∗∗ 0.39∗∗∗
(0.01) (0.01)
Length of Company’s Legal Name2 -0.04∗∗∗ -0.09∗∗∗
(0.01) (0.01)
Title Length -0.10∗∗∗ -0.16∗∗∗ 0.14∗∗∗ 0.52∗∗
(0.01) (0.06) (0.02) (0.27)
Market Capitalization -0.16∗∗∗ -0.16∗∗ -0.26∗∗∗ -0.24∗∗∗
(0.01) (0.01) (0.04) (0.05)
Number of Email Alert Subscribers -0.56∗∗∗ -0.56∗∗ -0.17∗∗∗ -0.14∗∗∗
(0.01) (0.01) (0.05) (0.05)
% Adjusted R2 0.12 0.37 0.58 . 0.30 .
% Within R2 0.01 0.10 0.33 . 0.12 .
Number of Articles 9944 9944 9944 9944 1686 1686
Observations 22623 22623 22623 22623 4006 4006
Another test is to split title length into length associated with content and length associated
with the firm’s name. To do so, I remove words in the title that overlap with the firm’s name,
the first letters of each word in a firm’s name, and the ticker symbol. If the information story
were true, then only length associated with content should be negatively related to attention.
If the complexity aversion story were true, then length associated with both content and the
firm’s name should be negatively related to attention. Table 8 regression (5) shows that both
18You can also read