Commercial foods for infants and young children in Poland - A study of the availability, composition and marketing of baby foods in Warsaw, Poland
←
→
Page content transcription
If your browser does not render page correctly, please read the page content below
30%G

          Commercial foods for
       infants and young children
                in Poland

       A study of the availability, composition and marketing
                 of baby foods in Warsaw, Poland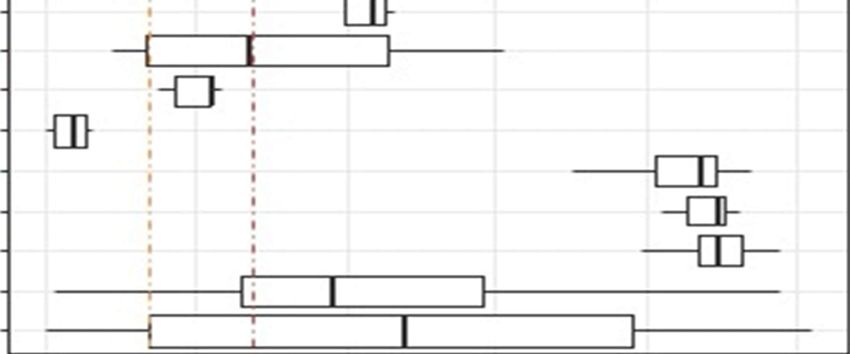
ABSTRACT
Good nutrition in infancy and early childhood is the foundation of good health and development, during childhood and
throughout adult life, but there are growing concerns that the marketing of some baby and toddler foods is undermining infant
and young child nutrition. A study conducted in partnership with the Institute of Mother and Child in Poland collected 732
commercial food and drink products for infants and young children in two districts of the Polish capital Warsaw and assessed
them against WHO criteria for foods that may be considered suitable to be marketed for infants and young children. The study
found evidence of widespread inappropriate promotion, and several areas of particular concern were identified.
Early age of introduction: 43% of the products were marketed as being suitable for infants under the age of 6 months,
which – although legal under European Union law – is in violation of the International Code of Marketing of Breast-milk
Substitutes and WHO guidance.
Inappropriate nutritional quality: more than half (58%) of the products provided more than 30% of energy (calories) from
sugars, around a quarter (24%) had sugar or other sweetening agents added, and 40% provided too few calories per 100 g
to meet infants’ needs.
Inappropriate use of composition, nutrition or health claims: most products (92%) carried a statement about composition
or nutritional aspects on the label and more than a third (39%) carried statements relating to health or development,
although Codex guidelines and WHO guidance prohibit nutrition or health claims.
Address requests about publications of the WHO Regional Office for Europe to:
Publications
WHO Regional Office for Europe
UN City, Marmorvej 51
DK-2100 Copenhagen Ø, Denmark
Alternatively, complete an online request form for documentation, health information, or for permission to quote or
translate, on the Regional Office website (http://www.euro.who.int/pubrequest).
Document number: WHO/EURO:2021-2277-42032-57827
© World Health Organization 2021
Some rights reserved. This work is available under the Creative Commons Attribution-NonCommercial-ShareAlike 3.0 IGO licence (CC BY-NC-
SA 3.0 IGO; https://creativecommons.org/licenses/by-nc-sa/3.0/igo).
Under the terms of this licence, you may copy, redistribute and adapt the work for non-commercial purposes, provided the work is
appropriately cited, as indicated below. In any use of this work, there should be no suggestion that WHO endorses any specific organization,
products or services. The use of the WHO logo is not permitted. If you adapt the work, then you must license your work under the same or
equivalent Creative Commons licence. If you create a translation of this work, you should add the following disclaimer along with the suggested
citation: “This translation was not created by the World Health Organization (WHO). WHO is not responsible for the content or accuracy of this
translation. The original English edition shall be the binding and authentic edition: Commercial foods for infants and young children in Poland: a
study of the availability, composition and marketing of baby foods in Warsaw, Poland. Copenhagen: WHO Regional Office for Europe; 2021”.
Any mediation relating to disputes arising under the licence shall be conducted in accordance with the mediation rules of the World Intellectual
Property Organization. (http://www.wipo.int/amc/en/mediation/rules/)
Suggested citation. Commercial foods for infants and young children in Poland: a study of the availability, composition and marketing of baby
foods in Warsaw, Poland. Copenhagen: WHO Regional Office for Europe; 2021. Licence: CC BY-NC-SA 3.0 IGO.
Cataloguing-in-Publication (CIP) data. CIP data are available at http://apps.who.int/iris.
Sales, rights and licensing. To purchase WHO publications, see http://apps.who.int/bookorders. To submit requests for commercial use and
queries on rights and licensing, see http://www.who.int/about/licensing.
Third-party materials. If you wish to reuse material from this work that is attributed to a third party, such as tables, figures or images, it is your
responsibility to determine whether permission is needed for that reuse and to obtain permission from the copyright holder. The risk of claims
resulting from infringement of any third-party-owned component in the work rests solely with the user.
General disclaimers. The designations employed and the presentation of the material in this publication do not imply the expression of any
opinion whatsoever on the part of WHO concerning the legal status of any country, territory, city or area or of its authorities, or concerning the
delimitation of its frontiers or boundaries. Dotted and dashed lines on maps represent approximate border lines for which there may not yet be
full agreement.
The mention of specific companies or of certain manufacturers’ products does not imply that they are endorsed or recommended by WHO in
preference to others of a similar nature that are not mentioned. Errors and omissions excepted, the names of proprietary products are
distinguished by initial capital letters.
All reasonable precautions have been taken by WHO to verify the information contained in this publication. However, the published material is
being distributed without warranty of any kind, either expressed or implied. The responsibility for the interpretation and use of the material lies
with the reader. In no event shall WHO be liable for damages arising from its use.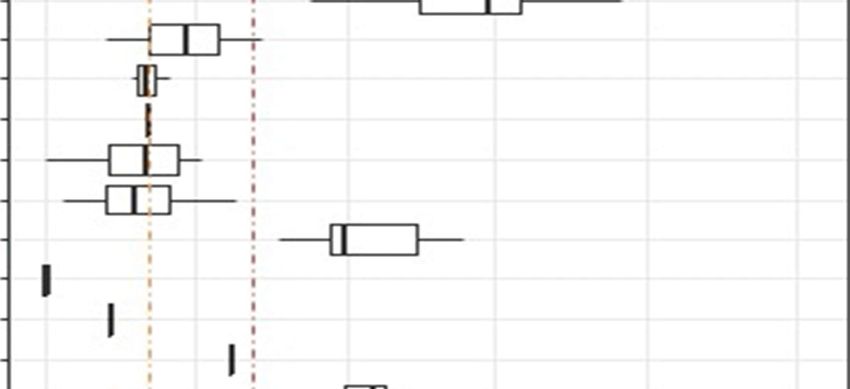
Contents
Acknowledgements .............................................................................................................. iv
1. Introduction and background ............................................................................................. 1
2. Study methodology ............................................................................................................ 3
   2.1 Aims of the study ................................................................................................................................3
   2.2 Study protocol .....................................................................................................................................3
3. Results ............................................................................................................................... 9
   3.1 Overview of products..........................................................................................................................9
   3.2 Nutritional quality of products......................................................................................................... 12
   3.3 Promotion of products ..................................................................................................................... 25
4. Conclusions ...................................................................................................................... 29
References........................................................................................................................... 32
Annex 1. Methodology for data collection of commercially produced baby food products
available in the marketplace in Poland ......................................................................................... 34
Annex 2. Categorization of foods for infants and young children used in this study................... 36
Annex 3. Draft nutrient profile model for commercially available complementary foods for
infants and young children up to 36 months old ......................................................................... 40

                                                                            iii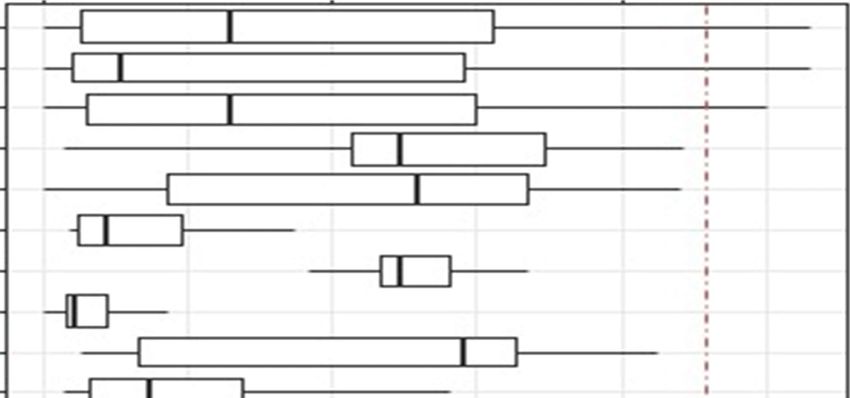
Acknowledgements

This study is a result of joint efforts of the Institute of Mother and Child in Poland and the WHO
European Office for the Prevention and Control of Noncommunicable Diseases, Moscow, Russian
Federation. The main authors of the study are João Breda, Hanna Wilska, Halina Weker, Karen McColl,
Jo Jewell and Natalia Fedkina. The authors wish to thank Margherita Caroli (European Childhood Obesity
Group, Italy), Helen Crawley (First Steps Nutrition, United Kingdom), Charlene Elliot (University of
Calgary, Canada), Ada Garcia (University of Glasgow, United Kingdom), Nathali Hirsch (independent
consultant, Denmark), Jayne Hutchinson (University of Leeds, United Kingdom), Mike Rayner (University
of Oxford, United Kingdom) and colleagues at Helen Keller International for their input into the
development of the methodology used in this study. Paloma Cuchi (WHO Representative of Poland)
reviewed the report and provided coordination at the country level.

Institute of Mother and Child in Poland
Halina Weker – study design
Hanna Wilska – study design, data analysis and checking, reviewing the report
Aleksandra Gierczak – data collection
Estera Glegoła – data collection
Anita Grochowska – data collection
Aleksandra Małachowska – data collection
Paulina Rogalska – data collection
Grażyna Rowicka – study design
Maja Sosnowska – data collection
Katarzyna Stachurska – data collection
Małgorzata Strucińska – study design
Karolina Stryjek – data collection
Małgorzata Więch – study design

WHO Regional Office for Europe, WHO European Office for the Prevention and Control of
Noncommunicable Diseases
João Breda – technical oversight, management and supervision
Ivo Rakovac – oversaw statistical analysis
Kremlin Wickramasinghe – technical oversight, management and supervision
Karen McColl – data analysis and drafting study report
Jo Jewell – devised study methodology, initiated the study, review of draft report
Natalia Fedkina – statistical analysis
Ines Lança de Morais – methodology development
Beatriz Ferreira – methodology development
Julianne Williams – reviewing the report, coordinating publication
Holly Rippin – reviewing the report, coordinating the publication
Clare Farrand – reviewing the report

This study has been produced with the financial assistance of the Bill and Melinda Gates Foundation and
the Government of the Russian Federation within the context of the WHO European Office for the
Prevention and Control of Noncommunicable Diseases.

                                                    iv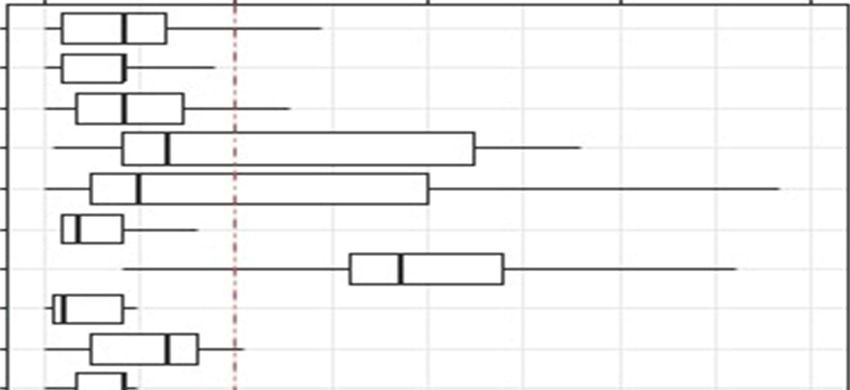
1. Introduction and background
Good nutrition in infancy and early childhood is the foundation of good health and development, during
childhood and throughout adult life (1). Appropriate infant and young child feeding practices are key to
optimal child growth and development and to preventing malnutrition in all its forms, including
overweight, obesity and diet-related noncommunicable diseases (2).
WHO recommends that infants should be exclusively breastfed for the first six months of life and
thereafter should receive nutritionally adequate and safe complementary foods while breastfeeding
continues until up to 2 years of age or beyond (3). The first three years of life present an opportunity to
influence the development of eating habits and dietary preferences, with the potential to establish
lifelong healthy dietary behaviours (4, 5).
While it has long been recognized that promotion of breast-milk substitutes undermines breastfeeding
and optimal infant and young child feeding (6), there has been growing concern that inappropriate
promotion of commercial baby and toddler foods also have the potential to undermine infant and young
child nutrition (7). Concerns relate to the potential for promotion of commercial complementary foods*
to undermine parents’ and carers’ confidence in home-produced foods, to promote dietary habits that
may encourage later obesity or other noncommunicable diseases, or to undermine breastfeeding. In
2010, the World Health Assembly called on Member States to end the inappropriate promotion of foods
for infants and young children (7), and new global guidance was agreed in 2016 to help countries take
action on this issue (8, 9) (Box 1).
Despite this globally agreed guidance, there is growing evidence of inappropriate promotion of
commercial foods for infants and young children in the WHO European Region (10, 11). Two reports
published by the WHO Regional Office for Europe in 2019 revealed evidence of widespread
inappropriate promotion in several countries (12, 13). A number of areas of particular concern were
identified:
Early age of introduction Between 10% and 60% (depending on the location) of foods
examined in the two reports were marketed as suitable for infants under the age of 6 months,
running counter to WHO’s longstanding guidance and in violation of the International Code of
Marketing of Breast-milk Substitutes (6) and the global Guidance on ending the inappropriate
promotion of foods for infants and young children (9).
Inappropriate nutritional quality Both WHO studies found high levels of total sugars, often
with half or more products containing more than 30% of calories from sugars. There was also
common use of added sugars/sweetening agents in commercial complementary foods, even
though such ingredients should not be added to foods for infants and young children. In
addition – albeit less frequently – some products contained too much or too little energy per
100 g and/or high levels of salt/sodium or saturated fat.
*
This report relates to all commercially produced foods for infants (up to 12 months) and young children (up to 36 months).
The terms “foods for infants and young children” and “baby and toddler foods” are used interchangeably within the report.
1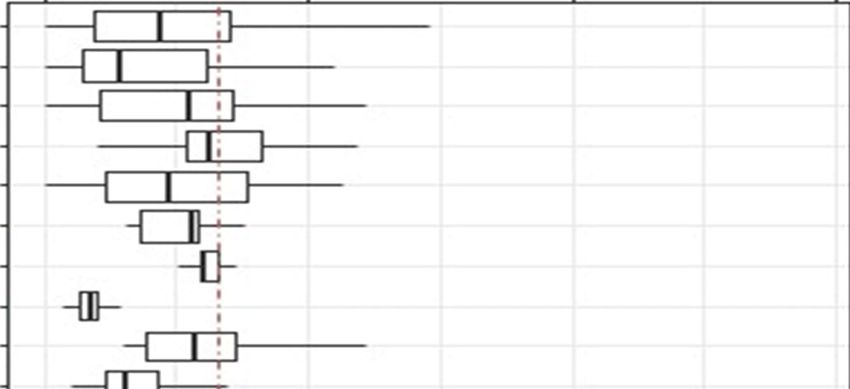
Commercial foods for infants and young children in Poland
Inappropriate use of composition, nutrition or health claims Statements about the
composition of the product or its nutrition- or health-related properties were very common on
the labels of commercial complementary foods in the countries where this was examined.
Nearly all products carried statements relating to nutrition and up to 35% carried statements
relating to health or development. This is despite Codex guidelines stating that foods for
infants and young children should not carry nutrition or health claims (14), a message
reinforced by the Code and WHO guidance (6, 9). Such claims can mislead consumers, create a
so-called “health halo” around products, and undermine parents’ confidence in breastfeeding
and their ability to feed their child with home-prepared food.
Box 1. Summary of recommendations in WHO’s Guidance on ending the inappropriate promotion of
foods for infants and young children (9)
Recommendation 1 Optimal infant and young child feeding should be promoted based on the guiding
principles for complementary feeding and feeding non-breastfed children 6–24 months
of age with an emphasis on nutrient-rich, home-prepared and locally available foods.
Recommendation 2 Products that function as breast-milk substitutes should not be promoted.
Recommendation 3 Foods for infants and young children that are not products that function as breast-milk
substitutes should be promoted only if they meet all the relevant national, regional and
global standards for composition, safety, quality and nutrient levels, and are in line with
national dietary guidelines.
Recommendation 4 The messages used to promote foods for infants and young children should support
optimal feeding and should not include inappropriate messages.
Recommendation 5 There should be no cross-promotion for breast-milk substitutes indirectly via the
promotion of foods for infants and young children.
Recommendation 6 Companies that market foods for infants and young children should not create conflicts
of interest in health facilities or throughout health systems. Health workers, health
systems, health professional associations and nongovernmental organizations should
likewise avoid such conflicts of interest.
Recommendation 7 The WHO Set of recommendations on the marketing of foods and non-alcoholic
beverages to children should be fully implemented, with particular attention given to
ensuring that settings where infants and young children gather are free from all forms
of marketing of foods high in fats, sugars or salt.
In the light of this evidence of widespread inappropriate promotion of foods for infants and young
children within the European Region, the WHO Regional Office for Europe and the Institute of Mother
and Child in Poland decided to conduct a study using the same methodology to determine the extent of
such inappropriate promotion in Warsaw, Poland.
2
2. Study methodology
To support Member States in their efforts to implement and operationalize the Guidance on ending the
inappropriate promotion of foods for infants and young children (9), the WHO Regional Office for Europe
developed a methodology for gathering information about available commercial baby and toddler
foods.

Using this methodology, a study on the availability, composition and marketing of commercial food and
drink products for infants and young children was conducted in four European countries between
November 2017 and January 2018 (12). Following feedback from the teams involved in collecting,
analysing and interpreting data from this study, some adjustments were made to the study
methodology. This revised methodology was used for a study conducted in two districts of Warsaw,
Poland, in late 2018 (the full methodology is given in Annex 1).

2.1 Aims of the study
The overall aims of the study were as follows:

    (a) to collect data on commercially available food products targeted at infants and young children
        (0–36 months) in two districts of Warsaw, Poland;
    (b) to compare the composition of these products (including nutritional content) with WHO
        guidance (9) and national food-based dietary guidelines on infant and young child feeding; and
    (c) to compare the methods used to promote these products (labelling, claims, price promotions)
        with WHO guidance.

Two alternative methods for data collection have been developed: a user-friendly mobile questionnaire
using the KoBoCollect application; and an Excel database for manual data collection. The study was
conducted in two districts of Warsaw, Poland, using the Excel database version of the methodology.

The study was conducted by the Institute of Mother and Child, a WHO partner institution in Poland, in
both low-income and high-income districts of Warsaw.

2.2 Study protocol
The study was conducted according to a protocol developed by the WHO Regional Office for Europe
(Annex 1). There were four stages:

    1. Sampling – selection of project areas and retail outlets
    2. Field worker training
    3. Data collection
    4. Analysis – cleaning and analysis of the data.

                                                    3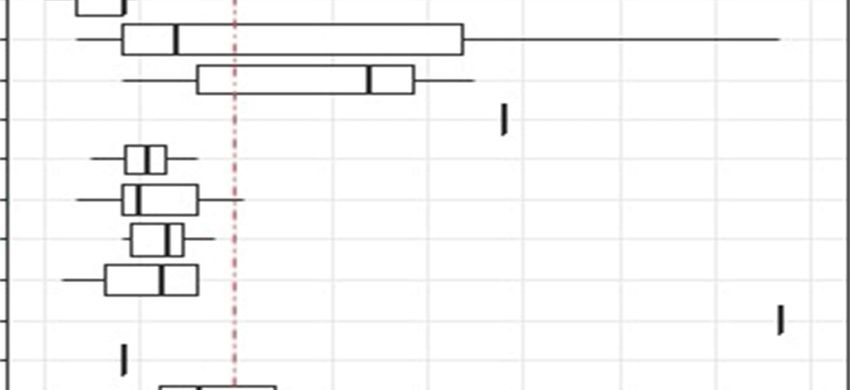
Commercial foods for infants and young children in Poland

2.2.1 Sampling methods
A flexible approach involving purposive sampling was followed, with sampling methods agreed prior to
data collection.

Data collection took place in two districts of Warsaw with different (high and low) levels of
socioeconomic development, using spatial distribution of the synthetic meter* values for families with
children. The chosen districts were Włochy (high level) and Rembertów (low level). Some demographic
and socioeconomic characteristics of the two districts are shown in Table 1.

Table 1. Demographic and socioeconomic indicators for Włochy and Rembertów districts
    Indicator                                                                         Włochy           Rembertów
    Area (1 January 2018)                                                            28.63 km2           19.3 km2

    Population (31 December 2017)                                                     41 929              24 148

          proportion at pre-working age                                               19.18%              18.95%

          proportion at working age                                                   59.75%              60.70%

          proportion at post-working age                                              21.08%              20.35%

    Live births per 1000 inhabitants (2017)                                            12.97               10.89

    Deaths per 1000 inhabitants (2017)                                                  8.47               8.28

    Natural increase/decrease per 1000 inhabitants (2017)                               4.51               2.61

    Deaths under 1 year of age per 1000 live births (2016 a)                            1.69            [not given]

    Registered unemployed by district (31 March 2018)                                   595                 393

    Revenue of district (part of city budget) per capita (2016)                     2024 złoty           533 złoty

    Occupants per 100 dwellings, 2016 a                                               181.75              239.18

    Average usable floor area of single dwelling (2016 a)                             62.1 m2             66.6 m2

    Number of registered businesses (March 2018)                                      12 853               4123

    Number of pharmacies (31 December 2016 a)                                            11                  9

a   Rocznik Statystyczny Warszawy 2017 [Statistical Yearbook of Warsaw 2017]
    Przegląd Statystyczny Warszawy 2018 [Statistical Review of Warsaw 2018]

* The synthetic meter is an index prepared to meet the needs of Warsaw city authorities. It uses more than 10 socioeconomic
factors (for example, number of people who are employed/unemployed/running businesses, number of shops and pharmacies
per head, etc.) to provide a basis for comparison of all the different districts.

                                                               4
Google Maps were used to define the sample area within the two chosen districts. A circle with a radius
of 1.5 km was drawn with its centre in the most densely populated living area of each district. Within
the marked area, the data recorders visited all shops that offered commercial complementary foods to
collect the necessary data. For the purposes of data collection, products were classified according to the
categories shown in Table 2. More detail on the definition of these categories is provided in Annex 2.

Table 2. Categories of food and drink products for infants and young children (with their associated
product codes) a
             Code     Food and drink category
               1      Dry, powdered and instant cereal/starchy foods
               1a     Dry or instant cereals/starch with or without naturally sweet foods
               1b     Dry or instant cereals/starch with an added high-protein food
               2      Soft, wet, spoonable ready-to-eat foods
               2a     Fruit purée with or without vegetables
               2b     Vegetable purée
               2c     Fruit with cereal or milk products
               2d     Vegetables with cereals or milk products
               2e     Meal with cheese mentioned in the name
               2f     Meal with fish mentioned first (as food) in name of product
                      Meal with meat or poultry or other traditional source of protein mentioned first
               2g
                      (as food) in name of product
                      Meal with meat, poultry, fish, offal or other traditional source of protein (but not
               2h
                      named as the first food in product name)
               2i     Dairy with or without fruit or other naturally sweet foods
               2j     Only meat or poultry in name of product
               2k     Only fish or other traditional source of protein in name of product
               3      Meals with chunky pieces
               3a     Meat, fish or other traditional source of protein-based tray or pot meal
               3b     Vegetable-based tray or pot meal
               4      Dry finger foods and snacks
               4a     Sweet confectionery, sweet spreads and fruit chews
               4b     Sweet snacks and finger foods
               4c     Rusks and teething biscuits
               4d     Savoury snacks and finger foods
               4e     Fruit (fresh or dry whole fruit or pieces)
               5      Juices and other non-formula drinks
               5a     Single or mixed fruit juices
               5b     Single or mixed vegetable juices
               5c     Other non-milk-based drinks
aData on products in three further categories – infant formula, follow-on formula and junior milk – were also collected but are
not reported here.

                                                               5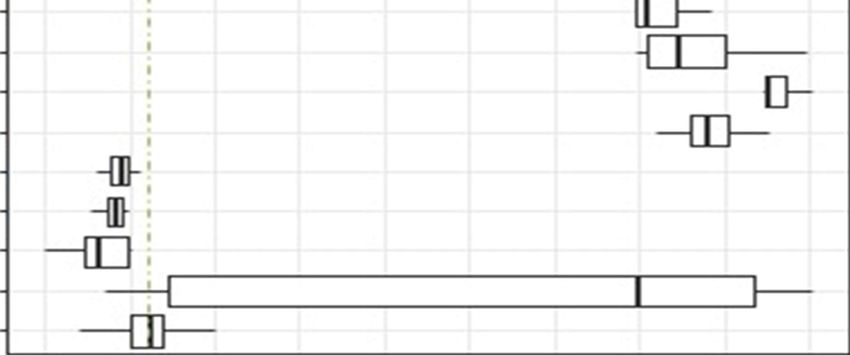
Commercial foods for infants and young children in Poland
2.2.2 Field worker training
The country team received training, via teleconference, from the WHO Regional Office for Europe and
then follow-up support by email.
Field workers responsible for data collection received training in which the purpose of the study was
outlined and the methodology explained. Field workers were provided with the study protocol and the
Excel spreadsheet and product categories translated into Polish; they then familiarized themselves with
the spreadsheet and did a trial collection of data for a given product.
2.2.3 Data collection
Following training, data collection teams were provided with a map of the assigned area with a
highlighted route. Products were entered into the Excel spreadsheet and coded for a series of indicators,
including:
location information
product category
brand and product name
age from which product is marketed
nutritional composition
marketing
visual information.
Field workers, often working in pairs, carried out the following steps:
1. Their name, affiliation and country were entered.
2. The address of the retail store was entered.
3. The type of retail store, the name of the retail store brand and whether it was located in a low-
income or high-income neighbourhood were recorded.
4. The aisle/chill cabinet with commercially produced baby food products was identified, including
the part of the store where waters labelled as suitable for infants were located. If the store did
not have any such products, the data collection team moved on to the next retail store. If the
store did have such products, this was recorded on the Excel spreadsheet ready for entry of
product-by-product data. At this stage or earlier, the team presented its authorizations and
information letters to shop managers and requested permission to carry out the data collection.
If permission was refused, the team left the store and recorded the refusal on the Excel
spreadsheet.
5. Registration of information on commercially produced baby food products: data were entered
for each product – name, brand name, food type, and lowest age group for which the product
was indicated.
6. Nutritional information: continuing with the same product, the data collection team recorded
whether a nutrition information panel was available and, if so, whether it provided information
on a per 100 g/mL and/or per serving basis. Declared nutrition information on energy, fat,
saturated fatty acids, trans fatty acids, carbohydrates, total sugars, lactose, protein and
salt/sodium was entered, where available.
67. Visual information: continuing with the same product, the presence of various types of visual
information on the package was recorded. This included cartoons, pictures of infants/young
children, pictures of mothers, pictures of bottles/teats, comparative claims, claims of
endorsement by a professional body, hypoallergenic claims, and other claims/visuals.
8. Composition, nutrition and health claims: where health or nutrition claims had been identified,
further details on the type of health and/or development claims and nutrient content claims
were recorded.
9. Pictures of the product and ingredients list: photographs of the front, back, left and right sides
of the product were taken, along with a clear picture of the ingredients list.
10. Details on sugars and flavours: given the difficulty in determining added sugars/sweeteners
from nutrient declarations, the ingredients list was then examined to record the
presence/absence of a number of particular sugars/sweeteners: sugar, sweetener, fruit juice
concentrate, corn syrup, cane syrup, dextrose, fructose, glucose, honey, lactose, malt, maltose,
molasses, sucrose, trehalose, turbinado sugar, other or no added sugars/sweeteners specified in
the ingredients list. Where the product was promoted as having a particular flavour, the flavour
was recorded.
11. Price and promotion information: the current price and the normal price of the product were
recorded, along with information on the local currency and the type of price promotions
available with the product (price reductions, free giveaways, multibuy discounts or other).
12. Complete product entry: any additional information that the field workers wished to record
about the particular product was added in a box.
13. Steps 5 to 12 were repeated for all relevant products in the store.
14. When data on all baby food products in the store had been entered, the data were submitted
(immediately or later, depending on online access).
The total number of products for which data were collected was 2683 from 44 stores in the two
districts, as shown in Table 3.
Table 3. Data collection by district and type of retail outlet
City, country District Number of shops Number of products
Warsaw, Poland Rembertów 19 1034
Włochy 25 1649
TOTAL 44 2683
2.2.4 Data cleaning and analysis
The first round of data cleaning was performed by the study investigators in Poland to eliminate any
obvious inaccuracies and duplicates (for example, multiple field workers entering the same product
details twice within the same store). The cleaned datasets were then reviewed by the WHO Regional
Office for Europe to identify any anomalies or values that seemed implausible, and clarification was
sought from the country teams if needed.
7Commercial foods for infants and young children in Poland
Data analysis was conducted by the country teams, Regional Office and report authors, according to the
indicators predefined by the Regional Office. For the majority of variables, mean, median, first quartile,
third quartile, and maximum and minimum values were calculated, along with the standard error, so
that box plot diagrams could be produced where appropriate.
Additional indicators were constructed and included in the analysis. Nutritional indicators were
constructed based on the literature review and expert advice. For example, the proportion of products
providing more than 15%, 30% and 40% of energy from total sugars was calculated. Aspects of product
promotion were compared with the International Code of Marketing of Breast-milk Substitutes (6) and
the WHO Guidance on ending the inappropriate promotion of foods for infants and young children (9).
83. Results
This chapter details the key results of the study in relation to four areas:
overview of products – types of products and target age groups for products
nutritional quality of products – the amount of energy (calories), and protein, total sugars, total
fat, saturated fat and sodium content for all products, by age group and product category
promotion of products – findings in relation to promotional aspects of product packaging and
use of nutrition and health claims.
3.1 Overview of products
In total, after cleaning, the final dataset included data on 2350 commercial foods for infants and young
children (excluding infant formula, follow-up formula and young child formula (junior milk)*). This figure
included duplicate products – that is, identical products available in different shops.
For the analyses of nutritional content and promotional aspects, duplicate products were eliminated. In
total, data on 732 unique commercial foods for infants and young children were analysed. An overview
of the numbers and types of products for which data were recorded is shown in Table 4.
The most common products were fruit purées, followed by meals with meat, poultry or fish, fruit with
cereals or milk, and dry or instant cereals.
There were a number of products on the market which WHO recommends should not be marketed as
suitable for infants and young children. For example, there were 25 sweet confectionery/spreads/fruit
chews, sweet snacks and finger foods, which WHO recommends should not be marketed for infants and
young children up to 3 years of age and should be labelled as not suitable for infants and young children
under 36 months (13). In addition, there were 98 drinks – including 57 juices and 41 non-milk drinks –
which WHO recommends should not be marketed for infants and young children up to 36 months of
age (13).
3.1.1 Target age of products
The youngest age at which it was specified that a product could be used was recorded. WHO
recommends that infants should be exclusively breastfed for the first six months of life. Under the Code,
all products marketed for children under 6 months of age are considered breast-milk substitutes and
should not be promoted (6). Under European Union rules, however, the labelling of complementary
foods as being suitable from 4 months of age is permitted (15).
A substantial proportion of products (43%) were marketed as being suitable for infants under the age of
6 months. The most common categories of foods labelled as suitable for infants under 6 months of age
were fruit and vegetable purées, meat/fish-based meals, cereals, juices and other drinks (Table 5).
*
Data on products in these categories were collected but are not reported here.
9Commercial foods for infants and young children in Poland
Table 4. Number of unique commercial food products for infants and young children analysed, by
product category
Number of
Code Food category
products
1 Dry, powdered and instant cereal/starchy foods
1a Dry or instant cereals/starch with or without naturally sweet foods 35
1b Dry or instant cereals/starch with an added high-protein food 80
2 Soft, wet, spoonable ready-to-eat foods
2a Fruit purée with or without vegetables 156
2b Vegetable purée 29
2c Fruit with cereal or milk products 95
2d Vegetables with cereals or milk products 16
2e Meal with cheese mentioned in the name 9
2f Meal with fish mentioned first (as food) in name of product 1
Meal with meat or poultry or other traditional source of protein mentioned first (as
2g 10
food) in name of product
Meals with meat, poultry, fish, offal or other traditional source of protein (but not
2h 137
named as the first food in product name)
2i Dairy with or without fruit or other naturally sweet foods 23
2j Only meat or poultry in name of product 4
2k Only fish or other traditional source of protein in name of product 0
3 Meals with chunky pieces
3a Meat, fish or other traditional source of protein-based tray or pot meal 1
3b Vegetable-based tray or pot meal 1
4 Dry finger foods and snacks
4a Sweet confectionery, sweet spreads and fruit chews 7
4b Sweet snacks and finger foods 18
4c Rusks and teething biscuits 5
4d Savoury snacks and finger foods 7
4e Fruit (fresh or dry whole fruit or pieces) 0
5 Juices and other non-formula drinks
5a Single or mixed fruit juices 50
5b Single or mixed vegetable juices 7
5c Other non-milk-based drinks 41
TOTAL 732
10Table 3. Overview of target age groups for products (the youngest age for which a product is
indicated), by product category a
Code Food category Number of Under 6 6–8 9–11 12 months
products months months months and over
1 Dry, powdered and instant cereal/starchy food
1a Dry or instant cereals/starch with or without 35 18 16 1 0
naturally sweet foods
1b Dry or instant cereals/starch with an added 80 37 31 8 4
high-protein food
2 Soft, wet, spoonable ready-to-eat foods
2a Fruit purée with or without vegetables 156 72 63 0 21
2b Vegetable purée 29 23 5 0 1
2c Fruit with cereal or milk products 95 33 49 10 3
2d Vegetables with cereals or milk products 16 4 7 0 5
2e Meal with cheese mentioned in the name 9 0 7 2 0
2f Meal with fish mentioned first (as food) in 1 0 0 0 1
name of product
2g Meal with meat or poultry or other traditional 10 2 5 2 1
source of protein mentioned first (as food) in
name of product
2h Meal with meat, poultry, fish, offal or other 137 44 50 14 29
traditional source of protein (but not named as
the first food in product name)
2i Dairy with or without fruit or other naturally 23 3 16 4 0
sweet foods
2j Only meat or poultry in name of product 4 2 2 0 0
2k Only fish or other traditional source of protein 0 0 0 0 0
in name of product
3 Meals with chunky pieces
3a Meat, fish or other traditional source of 1 0 0 0 1
protein-based tray or pot meal
3b Vegetable-based tray or pot meal 1 0 0 0 1
4 Dry finger foods and snacks
4a Sweet confectionery, sweet spreads and fruit 7 0 0 1 6
chews
4b Sweet snacks and finger foods 18 0 5 2 11
4c Rusks and teething biscuits 5 0 0 1 4
4d Savoury snacks and finger foods 7 0 3 0 4
4e Fruit (fresh or dry whole fruit or pieces) 0 0 0 0 0
5 Juices and other non-formula drinks
5a Single or mixed fruit juices 50 34 10 0 6
5b Single or mixed vegetable juices 7 6 1 0 0
5c Other non-milk-based drinks 41 35 4 0 2
TOTAL 732 313 274 45 100
aTotal number of unique commercial food and drink products for infants and young children (all products excluding breast-milk
substitutes, follow-on formula and growing-up milks, with duplicates eliminated).
11Commercial foods for infants and young children in Poland 3.2 Nutritional quality of products Nutrient information was present on the label of 98% of products, although there was some variation in the nutrients that were included in the nutrient declarations. There was no labelling of trans fatty acid content, reflecting the fact that such declarations are not required by European Union labelling laws. On the basis of the information on the labels, the nutrient contents of the products were recorded. This included energy (kilocalories [kcal] and kilojoules [kJ]), fat, saturated fat, carbohydrates, sugars, protein (g/100 g), and sodium (mg/100 g).* Where figures were stated as “less than” (
Box 2. Interpreting nutrient data and box plot diagrams
 Results are shown for energy, protein, total sugars, total fat, saturated fat and sodium (Fig. 1–6). Energy density
 results are shown on a kcal/100 g basis. As explained above, other nutrients are presented on a g or
 mg/100 kcal basis to allow valid comparisons between dry products that have to be reconstituted with water or
 milk before consumption and ready-to-eat products.
 Each figure shows a series of box plots that illustrate the data for the nutrient concerned. The box plot at the
 top of each diagram represents the total of all unique products (i.e. excluding duplicates and infant
 formula/follow-on formula and young child formula/junior milk). The next four box plots show results for
 products categorized according to the age group for which they are marketed. The box plots for each product
 category then follow. The final two boxes represent products that listed sugar, concentrated fruit juice or
 another sweetening agent on their ingredients list (“added sugar”) and those that did not list a sweetening
 agent on the ingredients list (“no added sugar”).
 For each box plot, the vertical line inside the box represents the median; the left and right sides of the box
 represent the first and third quartiles, respectively; and the horizontal lines (whiskers) show the minimum and
 maximum values (excluding outliers).
 Outlying values are not shown on the box plots because they distort the scale and make visual interpretation
 and comparisons difficult. A more complete picture of the total dataset is described in the text, with description
 of the minimum and maximum values and notable outliers.
 With respect to the box plots, there remains some variation between figures in the scales used on the
 horizontal axis. It is important, therefore, to pay careful attention to the scale indicated on the horizontal axis of
 each figure. Although the outliers are not shown, the text refers to some of these high values and clarification is
 provided in places to help with interpretation. Dotted lines to illustrate some general reference values (for
 instance, 15% of energy from sugars) are also shown, and these should help with interpretation.

3.2.1 Energy
Infants and young children need energy- and nutrient-dense food and drink as they can eat a limited
volume of food at mealtimes. Their daily energy needs increase from approximately 600 kcal at 6–8
months of age to 900 kcal by 12–23 months. Breast milk provides 69 kcal/100 g, so ideally foods should
not have an energy density much lower than this. The nutrient profile model proposed by the WHO
Regional Office for Europe suggests a minimum energy density of at least 60 kcal/100 g for several
product categories (13).

On the other hand, foods that are very energy-dense – particularly foods that are nutrient-poor and
those that are consumed as snacks – may contribute to excess energy intake.

Interpretation of energy density values needs to consider that some values are declared for a food in a
dry or concentrated form – namely, cereal products and some concentrated or powdered drinks to
which water or other liquid have to be added. For dry products, Codex recommends that the energy
density should be at least 400 kcal/100 g on a dry weight basis (14).

                                                          13
Commercial foods for infants and young children in Poland
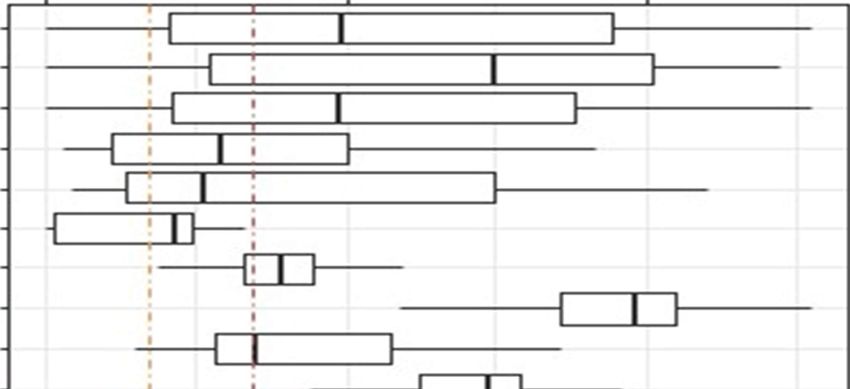
Fig. 1. Energy density of products, by age group and product category
kcal/100 g
Cat. No. 0 100 200 300 400
Overall 722
Less than 6 months 305
6–8 months 274
9–11 months 45
12+ months 98
Dry, powdered and instant Dry or instant cereals/starch with or without naturally sweet foods 1a 35
cereal/starchy food Dry or instant cereals/starch with an added high-protein food 1b 80
Fruit purée with or without vegetables 2a 156
Vegetable purée 2b 29
Fruit with cereal or milk products 2c 95
Soft, wet, spoonable Vegetables with cereals or milk products 2d 16
ready-to-eat foods Meal with cheese mentioned in the name 2e 9
Meal with fish mentioned first (as food) in name of product 2f 1
Meal with meat/poultry/other traditional source of protein mentioned first (as food) in name of product 2g 10
Meal with meat/poultry/fish/offal/other traditional protein source (but not named as first food in product name) 2h 137
Dairy with or without fruit or other naturally sweet foods 2i 23
Only meat or poultry in name of product 2j 4
Meals with chunky pieces
Meat, fish or other traditional source of protein-based tray or pot meal 3a 1
Vegetable-based tray or pot meal 3b 1
Sweet confectionery, sweet spreads and fruit chews 4a 5
Sweet snacks and finger foods 4b 18
Dry finger foods and
Rusks and teething biscuits 4c 5
snacks
Savoury snacks and finger foods 4d 7
Single or mixed fruit juices 5a 50
Juices and other non- Single or mixed vegetable juices 5b 7
formula drinks Other non-milk-based drinks 5c 33
Products with added sugar 175
No added sugar 547
60 kcal/100 g
14The box plots in Fig. 1 show that some soft, wet, spoonable products and drinks have an energy density
lower than the recommended 60 kcal/100 g. This is the case for more than half the fruit purées, nearly
all the vegetable purées, and some of the fruit or vegetables with cereals or milks. It is of particular
concern that more than half the products marketed for infants under 6 months (all categories
combined) provide less than 60 kcal/100 g. Marketing of products in the soft, wet, spoonable categories
with a lower energy density should not be permitted, and manufacturers need to reformulate their
products to provide at least 60 kcal/100 g. The WHO Regional Office for Europe recommends that juices
and other drinks should not be marketed as suitable for infants and young children under 36 months.
For dry products, all the dry or instant cereals (without added high-protein food) are below the
400 kcal/100 g recommended by Codex.
These results suggest that there are many products on the market – 40% of our sample (291/722) – that
have an inappropriate energy density, providing too few calories per 100 g to meet infants’ needs.
3.2.2 Protein
Infants and young children need to obtain adequate amounts of high-quality protein, with daily intakes
of animal-source foods or a combination of grains and pulses (legumes). Existing Codex standards and
European Union regulations set minimum protein levels, ranging from 3 g to 7 g/100 kcal, for some food
categories (meat, fish, poultry or cheese-based meals or dishes, cereals with added protein, some dairy
products). The levels also vary depending on the prominence of a protein source in the product’s name
(i.e. where a meat, fish or poultry protein source is mentioned first in the name of a product). The
nutrient criteria for foods for infants and young children proposed by the WHO Regional Office for
Europe also propose lower limits for protein, which range from 2.2 g to 7 g/100 kcal depending on the
food category (13).
WHO proposes an upper limit of 5.5 g/100 kcal for dry, instant cereals (13). Although few upper limits
for protein have been established, there are some concerns that high protein levels in the diets of
infants and young children might potentially contribute to later overweight and obesity.
Fig. 2 shows the variation in protein levels, by food categories. The 3 g/100 kcal line is shown as an
indicative guide. The product categories used for these analyses are slightly different to those in the
nutrient profile model proposed by the WHO Regional Office for Europe, thus a more detailed
examination of the product labels would be required to map products to the nutrient profile model
categories and assess all the specific protein criteria. Preliminary analysis, however, suggests that most
products contain more than the proposed minimum levels of total protein, but that some meat, poultry
or fish-based ready-to-eat foods may not meet the proposed minimum total protein requirements.
15Commercial foods for infants and young children in Poland
Fig. 2. Protein content of products, by age group and product category
g/100 kcal
Cat. No. 0 5 10 15
Overall 719
Less than 6 months 304
6–8 months 274
9–11 months 45
12+ months 96
Dry, powdered and instant
Dry or instant cereals/starch with or without naturally sweet foods 1a 35
cereal/starchy food
Dry or instant cereals/starch with an added high-protein food 1b 80
Fruit purée with or without vegetables 2a 156
Vegetable purée 2b 29
Fruit with cereal or milk products 2c 95
Soft, wet, spoonable Vegetables with cereals or milk products 2d 16
ready-to-eat foods Meal with cheese mentioned in the name 2e 9
Meal with fish mentioned first (as food) in name of product 2f 1
Meal with meat/poultry/other traditional source of protein mentioned first (as food) in name of product 2g 10
Meal with meat/poultry/fish/offal/other traditional protein source (but not named as first food in product name) 2h 136
Dairy with or without fruit or other naturally sweet foods 2i 23
Only meat or poultry in name of product 2j 4
Meals with chunky pieces
Meat, fish or other traditional source of protein-based tray or pot meal 3a 1
Vegetable-based tray or pot meal 3b 1
Sweet confectionery, sweet spreads and fruit chews 4a 5
Sweet snacks and finger foods 4b 18
Dry finger foods and
Rusks and teething biscuits 4c 5
snacks
Savoury snacks and finger foods 4d 7
Single or mixed fruit juices 5a 50
Juices and other non- Single or mixed vegetable juices 5b 7
formula drinks Other non-milk-based drinks 5c 31
Products with added sugar 175
No added sugar 544
3 g/100 kcal
163.2.3 Sugars
The total sugar content of the products, where declared on the label, was recorded. It was not possible
to determine the amount of free sugars (which are the basis for WHO guidelines) or added sugars
(which are referenced in existing European Union legislation) based on the nutrient declaration alone.
To obtain a better picture of the added or free sugar content, additional information was captured from
the label – namely, the presence of sugars or any other sweetening agents on the ingredients list.
Existing standards and legislation set some upper limits for added sugars in very limited categories
(< 7.5 g and < 5.5 g/100 kcal for dry or instant cereals, depending on whether a high protein food has
also been added). These thresholds have been subject to much criticism for not being sufficiently strict.*
WHO has proposed some other criteria in relation to sugars, which indicate that products with high
sugar levels should not be marketed as suitable for infants and young children; and in other cases, it
recommends that products with more than 15%, 30% or 40% of calories from total sugars, depending on
the category, should carry a front-of-pack flag on the label/packaging to show the proportion of energy
from total sugar (13).
The maximum total sugar content ranged from 0 g/100 kcal to just over 25 g/100 kcal (for apple, carrot
and banana purée).
Overall, the products tend to have a relatively high total sugar content, with over three quarters of them
providing more than 15% of energy (calories) from sugars and over half (58%) providing more than 30%
of energy from sugars (Fig. 3). In relation to WHO’s proposed nutrient criteria, more than half the
instant, dry cereals with an added high protein food (category 1b) would have to carry a front-of-pack
flag with total sugar content because more than 30% of calories come from sugars. This is also the case
for all the fruit purées (2a) and fruit with cereal or milk products (2c) and half the vegetable purées (2b).
Similarly, more than a quarter of products in the vegetables with cereals or milk products category (2d)
would have to carry a front-of-pack flag with total sugar content because sugars provide more than 20%
of the calories. Around half the products in categories 2e, 2f and 2g (puréed or semi-puréed meat,
poultry, fish or cheese-based ready-to-eat products) have more than 15% of calories from sugars and
would therefore have to carry a front-of-pack flag with sugar content under the proposed WHO criteria.
(In category 2h this proportion was less than half.) All the products in the sweet confectionery, sweet
spreads and fruit chews category (4a) provided more than 40% of calories from sugars, while half the
products in the sweet snacks and finger foods category (4b) provide more than 30% of energy from
sugars; according to the proposed WHO criteria, these products should not be marketed as suitable for
infants and young children. Fig. 3 clearly shows very high sugar levels in juices and other non-milk-based
drinks (5a–c); WHO proposes that these products should not be marketed as suitable for infants and
young children up to the age of 36 months.
*Objection to a delegated act: specific compositional and information requirements for processed cereal-based food and baby
food. European Parliament resolution of 20 January 2016 on Commission Delegated Regulation of September 2015
supplementing Regulation (EU) No. 609/2013 of the European Parliament and of the Council as regards the specific
compositional and information requirements for processed cereal-based food and baby food (C(2015)06507–2015/2863(DEA)).
17Commercial foods for infants and young children in Poland
Fig. 3. Total sugar content of products by age group and product category
g/100 kcal
Cat. No. 0 10 20
Overall 719
Less than 6 months 305
6–8 months 274
9–11 months 45
12+ months 95
Dry, powdered and instant
Dry or instant cereals/starch with or without naturally sweet foods 1a 35
cereal/starchy food
Dry or instant cereals/starch with an added high-protein food 1b 80
Fruit purée with or without vegetables 2a 156
Vegetable purée 2b 29
Fruit with cereal or milk products 2c 95
Soft, wet, spoonable Vegetables with cereals or milk products 2d 16
ready-to-eat foods Meal with cheese mentioned in the name 2e 9
Meal with fish mentioned first (as food) in name of product 2f 1
Meal with meat/poultry/other traditional source of protein mentioned first (as food) in name of product 2g 10
Meal with meat/poultry/fish/offal/other traditional protein source (but not named as first food in product name) 2h 136
Dairy with or without fruit or other naturally sweet foods 2i 23
Only meat or poultry in name of product 2j 4
Meals with chunky pieces
Meat, fish or other traditional source of protein-based tray or pot meal 3a 1
Vegetable-based tray or pot meal 3b 1
Sweet confectionery, sweet spreads and fruit chews 4a 5
Sweet snacks and finger foods 4b 18
Dry finger foods and
Rusks and teething biscuits 4c 5
snacks
Savoury snacks and finger foods 4d 7
Single or mixed fruit juices 5a 50
Juices and other non- Single or mixed vegetable juices 5b 7
formula drinks Other non-milk-based drinks 5c 31
Products with added sugar 175
No added sugar 544
15%E 30%E (= % of energy (calories) from sugars)
18While in many products the sugar content would be derived from sugars naturally present in fruit,
vegetables or milk, around a quarter of products (24.3%) had sugar or another sweetening agent as one
of their ingredients. The most declared sweetening agents were “fruit juice concentrate” (14%) and
sugar (12.7%).
3.2.4 Fats
Data were recorded on the levels of total fat and saturated fat in products; the results are shown in
Fig. 4 and 5. In addition, the study initially intended to collect data on the trans fatty acid content of
products, but these data were generally not available from the nutrition information on labels, since this
is not required under European Union labelling law.
3.2.4.1 Total fat
Fat provides essential fatty acids and fat-soluble vitamins, which are important for the diets of infants
and young children, as well as increasing energy density. There are concerns, however, that excessive
intake of fats may contribute to higher energy intakes and increase the risk of childhood obesity and
diet-related noncommunicable diseases later in life (16). Based on the existing evidence, it is
recommended that total dietary fat intake should be reduced gradually, depending on the physical
activity of the child, from 40–60% of total energy intake at around 6 months of age, to 30–35% of total
energy intake at 24 months, and to 25–35% from 2 years onwards throughout childhood.
Existing European Union legislation and Codex standards set upper limits for lipids in some food
categories. The nutrient profile model proposed by the WHO Regional Office for Europe also proposes
maximum levels for total fat, ranging from 4.5 g/100 kcal to 6 g/100 kcal, depending on the product
category (13).
The only category with a sizeable proportion of products containing more than 4.5 g of total fat per
100 kcal was for wet, spoonable products with only meat or poultry in the product name (Fig. 4). The
sample size for this category was very small (n = 4), however, making it hard to draw any general
conclusions.
19Commercial foods for infants and young children in Poland
Fig. 4. Total fat content of products, by product category and age group
g/100 kcal
Cat. No. 0 2 4
Overall 720
Less than 6 months 305
6–8 months 274
9–11 months 45
12+ months 96
Dry, powdered and instant
Dry or instant cereals/starch with or without naturally sweet foods 1a 35
cereal/starchy food
Dry or instant cereals/starch with an added high-protein food 1b 80
Fruit purée with or without vegetables 2a 156
Vegetable purée 2b 29
Fruit with cereal or milk products 2c 95
Soft, wet, spoonable Vegetables with cereals or milk products 2d 16
ready-to-eat foods Meal with cheese mentioned in the name 2e 9
Meal with fish mentioned first (as food) in name of product 2f 1
Meal with meat/poultry/other traditional source of protein mentioned first (as food) in name of product 2g 10
Meal with meat/poultry/fish/offal/other traditional protein source (but not named as first food in product name) 2h 137
Dairy with or without fruit or other naturally sweet foods 2i 23
Only meat or poultry in name of product 2j 4
Meals with chunky pieces
Meat, fish or other traditional source of protein-based tray or pot meal 3a 1
Vegetable-based tray or pot meal 3b 1
Sweet confectionery, sweet spreads and fruit chews 4a 5
Sweet snacks and finger foods 4b 18
Dry finger foods and
Rusks and teething biscuits 4c 5
snacks
Savoury snacks and finger foods 4d 7
Single or mixed fruit juices 5a 50
Juices and other non- Single or mixed vegetable juices 5b 7
formula drinks Other non-milk-based drinks 5c 31
Products with added sugar 175
No added sugar 545
4.5 g/100 kcal
203.2.4.2 Saturated fat
No specific limits for saturated fatty acids in foods for infants and young children are proposed in
current European Union legislation, Codex standards or the nutrient criteria proposed by the WHO
Regional Office for Europe. More generally, for children over the age of 2 years and adults, WHO
recommends that less than 10% of dietary energy should come from saturated fatty acids. For food
products, 10% of calories from saturated fat equates to 1.1 g of saturated fat per 100 kcal.
Some categories – particularly in dairy foods (with or without fruit) (2i) and rusks/teething biscuits (4c) –
had a proportion of products with more than 1.1 g saturated fat per 100 kcal (Fig. 5).
3.2.4.3 Trans fats
The methodology developed for this and similar studies is intended to collect data on the trans fatty acid
content of products (12). However, these data were not available from the nutrition information on
labels for the current study, since there is no requirement in European Union law to label trans fatty
acid content.
It is not appropriate for foods for infants and young children to contain industrially produced trans fatty
acids. The nutrient profile model proposed by WHO is clear that no foods for infants and young children
should contain any industrially produced trans fatty acids (13).
21Commercial foods for infants and young children in Poland
Fig. 5. Saturated fat content of products, by product category and age group
g/100 kcal
Cat. No. 0 5 10 15
Overall 720
Less than 6 months 305
6–8 months 274
9–11 months 45
12+ months 96
Dry, powdered and instant
Dry or instant cereals/starch with or without naturally sweet foods 1a 35
cereal/starchy food
Dry or instant cereals/starch with an added high-protein food 1b 80
Fruit purée with or without vegetables 2a 156
Vegetable purée 2b 29
Fruit with cereal or milk products 2c 95
Soft, wet, spoonable Vegetables with cereals or milk products 2d 16
ready-to-eat foods Meal with cheese mentioned in the name 2e 9
Meal with fish mentioned first (as food) in name of product 2f 1
Meal with meat/poultry/other traditional source of protein mentioned first (as food) in name of product 2g 10
Meal with meat/poultry/fish/offal/other traditional protein source (but not named as first food in product name) 2h 137
Dairy with or without fruit or other naturally sweet foods 2i 23
Only meat or poultry in name of product 2j 4
Meals with chunky pieces
Meat, fish or other traditional source of protein-based tray or pot meal 3a 1
Vegetable-based tray or pot meal 3b 1
Sweet confectionery, sweet spreads and fruit chews 4a 5
Sweet snacks and finger foods 4b 18
Dry finger foods and
Rusks and teething biscuits 4c 5
snacks
Savoury snacks and finger foods 4d 7
Single or mixed fruit juices 5a 50
Juices and other non- Single or mixed vegetable juices 5b 7
formula drinks Other non-milk-based drinks 5c 31
Products with added sugar 175
No added sugar 545
22You can also read