Child Health Report - Office of the Medical Health Officer Population Health 2018 - Interior Health Authority
←
→
Page content transcription
If your browser does not render page correctly, please read the page content below
Child Health Report

            Office of the Medical Health Officer
                             Population Health
                                          2018
Interior Health Child Health Report 2018

This report has been compiled for and is brought to the Interior Health Authority Board under
Order in Council by a Medical Health Officer, pursuant to section 73 of the Public Health Act
of British Columbia (BC). It describes a significant and/or time sensitive risk to the health of
persons residing in BC’s interior region, and provides recommendations for which the health
authority is responsible.

Suggested Citation:

Office of the Medical Health Officer. 2018. Child Health Report. Interior Health Authority.
Kelowna, British Columbia, Canada.

ii | P a g e
Interior Health Child Health Report 2018

Introduction from the Medical Health Officer
This report tells a story of children aged 0 to 18 years living in the southern
interior of B.C. Children depend on caregivers and their communities; they put
their trust in us. The social, emotional, intellectual and physical development that
occurs during childhood lays the foundation for a lifetime of health and
accomplishments.
You can’t improve what you don’t measure. In this report, we present a selection
of indicators that describe the health status of children in IH. The intention of this
report is to encourage thought, reflection, conversation and the desire to know and do more. We hope
to engage our internal and external partners about important questions such as: What do we need to
know to make the changes that will benefit children? What needs to change to make more of a
difference? How can we make this happen?
All children deserve to have the building blocks of success available to them in ways that are accessible
and acceptable. This may mean different things for different families and it is the responsibility of adult
caregivers and communities to be responsive to all children’s needs. Research indicates children that
grow up in less heathy environments are more prone to experience obesity, failure in school, pregnancy
and criminality in their teens; obesity, elevated blood pressure and depression in their 20’s and 30’s;
coronary heart disease and diabetes in their 40’s and 50’s; and premature aging and memory loss in
older years.1 Support networks in childhood help to prevent these and other negative outcomes by
setting the stage for lifelong success.
The mandate for Interior Health (IH) to contribute to healthy childhood development is explicitly
indicated in the Healthy Families BC Policy Framework.2 One of the focused Interventions Streams is
Healthy Early Childhood Development and recommended strategies are outlined in the report. Within
the British Columbia (B.C.) Guiding Framework for Public Health, improving maternal child health is
identified as one of the overarching goals.3
Recently an updated Growing up in B.C. 2015 report was released in partnership with the Office of the
Provincial Health Officer (PHO) and the Representative for Children and Youth.4 This comprehensive
report on the well-being of children in B.C. has a particular focus on more vulnerable children, namely
Aboriginal children and children in care. Furthermore, the Office of the PHO and Child Health BC have
recently released a report on the health and wellbeing of children and youth in B.C.5 Our report
compliments these prior publications by providing more granular detail specific to the IH region.
Thank you for taking the time to learn about the children living in the southern interior of B.C. Together
we can make a difference.

Sincerely,

Dr. Sue Pollock MSc, MD, FRCPC
Medical Health Officer

iii | P a g e
Interior Health Child Health Report 2018

Executive Summary
This report documents selected child health indicators, which identify strengths and vulnerabilities
across the southern interior of B.C. This knowledge is intended to raise awareness, start conversations
and bring people together who can contemplate and plan change. This report is intended for IH staff,
community partners and the public.

Providing children with the best possible opportunity for healthy growth and development is the
overarching goal of all communities. IH has the primary responsibility for some essential services;
however, our role in many healthy childhood development programs (e.g. mental health and education)
is often supportive or advisory rather than one of direct delivery. We need to continue to strengthen our
partnerships with other provincial ministries, community stakeholders and families to provide the best
possible advantage to our children.

The life course trajectory model examines how various conditions at different critical stages affect
peoples’ outcomes later on in life - both positive and negative. It is recognized that interventions in
childhood are particularly influential as this is the time of tremendous physical, neurological and
emotional growth. Evidence shows that interventions made in the earliest stages of life, prenatal and in
early childhood, provide the greatest returns. By recognizing the power of investing in children, we can
make a positive difference in future health and success of individuals.

Canadian children are some of the most fortunate in the world as they experience high life expectancies
and low infant mortality rates. However, this advantage is not universally felt and there remain
subgroups of children with less favourable outcomes. Infant mortality rates are a stark example of
differences in outcomes that B.C. First Nations people experience when compared to others in the
province. Vulnerable groups including Aboriginal people and children in care are not extensively detailed
in this report; however, both groups have been a focus of the most recent Growing up in B.C. 2015
report which describes the barriers these children experience in achieving good health.4

Children from conception to age 18 years are included in this report. There are 18 indicators included
based on a subset of indicators from the Growing up in B.C. 2010 report.6 Most indicators are examined
by geographic distribution.

Maternal smoking is one indicator where all Local Health Areas (LHAs) in IH fared worse than the
provincial average which suggests that this behaviour could be a priority for additional IH-specific
interventions. Youth were also twice as likely to report daily smoking compared to their provincial
counterparts (2.9% vs. 1.5%).

Exclusive breastfeeding rates at six months were low, with only 50% of IH mothers following the B.C.
recommended guideline of exclusive breastfeeding to six months.

The infant mortality rate for IH is lower than the provincial rate but geographic variation is evident (2.2-
4.5 deaths/1,000 live births) across the Health Service Delivery Areas (HSDAs).

iv | P a g e
Interior Health Child Health Report 2018

The IH rate for up-to-date immunizations of two year olds continues to be at par or exceed the
provincial rate in three of four IH HSDAs. Kootenay Boundary remains substantially below the provincial
average for immunization coverage in this age group.

Physical and social vulnerabilities among kindergarteners have been increasing in IH since 2007, whereas
emotional, language and communication vulnerabilities appear to have generally remained stable. More
IH kindergartners are cavity-free compared to the provincial average (69% vs 67%).

Economically, children in IH are more vulnerable than the provincial average; a higher proportion of
young children are in low income families (20.3 % vs 18.5%) and a higher proportion of children access
food banks (4.6% vs 3.8%). Economic stress is one of the most significant negative factors in healthy
childhood development.

Youth in IH are more likely than the provincial average to report the presence of a caring adult in their
lives and regular engagement in vigorous physical activity. IH youth are equally likely to report
good/excellent mental health but are slightly less likely to report a healthy weight compared to their
provincial counterparts. IH youth are also slightly less likely to attain a dogwood high school certificate
compared to the provincial average. Acute mental health hospitalizations among youth appear to be
increasing in IH.

Children at risk is an index indicator that combines information that measures economic stress,
education, crime, children in care and infant mortality. Overall, IH fares better than the provincial
average, however there are LHAs along the western border that are among the ten worst LHAs in B.C.

Injury is a significant issue in IH and rates exceed that of the province, with the exception of children
under one year of age. Self-harm injuries become significant in IH youth aged 15-19 years.

Average asthma rates in IH are lower than that of the province (10% vs 11%) although there are LHAs
including Trail, Princeton, South Okanagan and Penticton where the rates exceed that of B.C.

For most indicators, variation exists across IH LHAs, with some faring better than the provincial average
and some worse. The findings of this report highlight a west to east gradient; the western portion of the
health authority shows overall higher vulnerabilities compared to the east with the central portion of
the health authority falling in-between.

Only a portion of an individual’s health is influenced by direct health care, with the balance determined
by the influence of the social determinants of health, environment and genetics. Addressing the social
determinants of health is critical to determining which groups have the greatest need and what targeted
actions could be considered.

v|Page
Interior Health Child Health Report 2018

In this report, a series of recommendations are proposed for consideration. The following
recommendations are intended to begin addressing the gaps in health outcomes seen across geographic
areas and within vulnerable population groups:

    1. Interior Health should convene a cross portfolio working group to provide direction, leadership
       and accountability for maternal child health in IH.

               a. The working group should include representation from the First Nations Health
                  Authority.
               b. The working group should be responsible for identifying priorities, setting goals,
                  identifying outcomes, and monitoring the progress on implementation of both the goals
                  and the recommendations in this report.
               c. The working group should engage with families, youth and communities to incorporate
                  their perspectives.

    2. The Medical Health Officers, Epidemiologists and maternal child & youth health program staff
       should develop and implement a surveillance system to measure and periodically report key
       childhood indicators across the age continuum (0 to 18 years).

               a. The selection of indicators should align with provincial indicators and reflect IH
                  priorities.
               b. Vulnerable populations should be stratified to inform programming and monitor
                  progress.

    3. Interior Health should conduct a scan and evaluate current child health programs to ensure they
       are evidence-based and effective. Evaluation should incorporate an equity lens to determine if
       services are available, accessible and acceptable to families.

    4. New or modified IH services for children should ensure proportionate universality, allowing
       equal access to care, with a focus on reducing barriers for the most vulnerable groups.

    5. The maternal child & youth health program should continue to engage and expand internal and
       external partnerships to improve children’s health, including Aboriginal partner communities
       and organizations.

vi | P a g e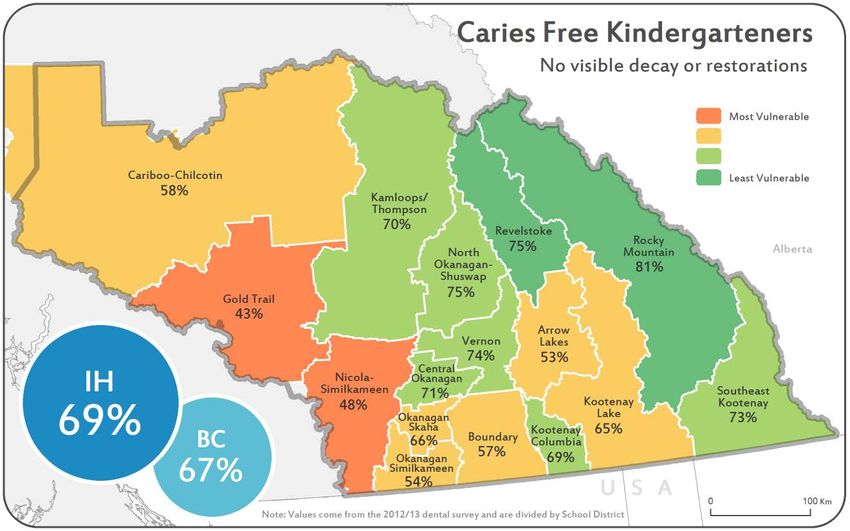
Interior Health Child Health Report 2018

Acknowledgements
The production of this document would have not been possible without the contribution of the
following individuals:

    •    Child Health Data Working Group:
             o Nadine Johnson
             o Ruth Johnson
             o Penny Liao-Lussier
             o Jamie Marshall
             o Brenda Marsman
             o Jennifer May-Hadford
             o Karen Omelchuk
             o Valerie Pitman
             o Dr. Sue Pollock
             o Yolanda Short
             o Judy Sturm
             o Dr. Tom Warshawski
             o Emily Watt
             o Danielle Wilson
    •    Office of the Medical Health Officer:
             o Megan Black
             o Bimal Chhetri
             o Dr. Trevor Corneil
             o Gillian Frosst
             o Dr. Kamran Golmohammadi
             o Brent Harris
             o Dr. Silvina Mema
    •    BCCDC:
             o Michael Otterstatter

An additional thank-you to all other individuals, not listed above, who contributed to this report through
providing input into draft copies, or contributing to information listed in Appendices A and B.

vii | P a g e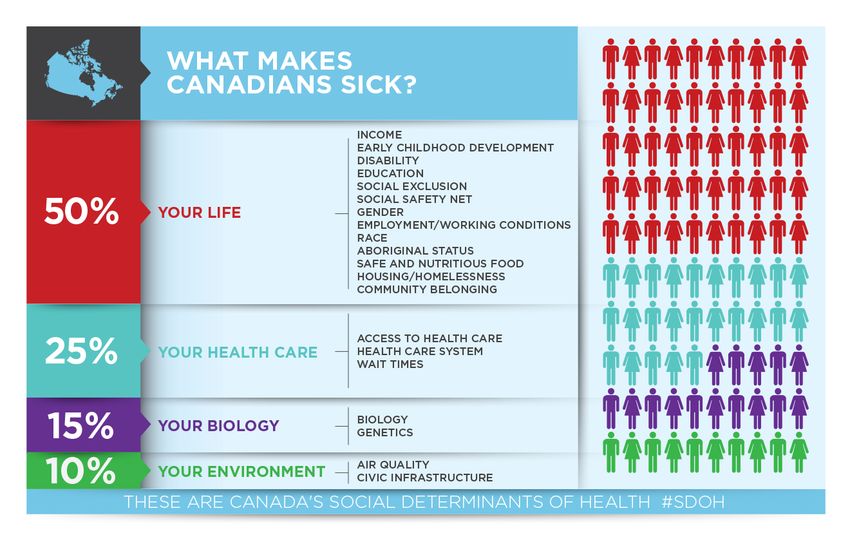
Interior Health Child Health Report 2018

Table of Contents
Introduction from the Medical Health Officer ........................................................................ iii
Executive Summary .............................................................................................................. iv
Acknowledgements ............................................................................................................. vii
Population ............................................................................................................................ 1
Process and Approaches ........................................................................................................ 2
   Visioning & Development ...............................................................................................................2
      Maps .....................................................................................................................................................................3
      Summary Map .......................................................................................................................................................3

Indicators .............................................................................................................................. 4
   Smoking During Pregnancy .............................................................................................................4
   Exclusive Breastfeeding at 4 to 6 Months ........................................................................................6
   Infant Mortality .............................................................................................................................8
   Two Year Old Up-To-Date Immunization .........................................................................................9
   Early Childhood Developmental Vulnerability ...............................................................................11
   Dental Screening ..........................................................................................................................13
   Children and Youth Living in Low Income Families .........................................................................14
   Hospitalization for Mental Health .................................................................................................16
   Caring Adult .................................................................................................................................18
   Mental Well-Being .......................................................................................................................19
   Healthy Weight ............................................................................................................................20
   Physical Activity ...........................................................................................................................21
   Tobacco Use .................................................................................................................................22
   High School Completion ...............................................................................................................23
   Children at Risk ............................................................................................................................24
   Hospitalization for Injury ..............................................................................................................25
   Asthma Prevalence.......................................................................................................................28
   Food Security ...............................................................................................................................29
   Summary Indicator – Cumulative Risk ...........................................................................................31

Discussion ........................................................................................................................... 33

viii | P a g e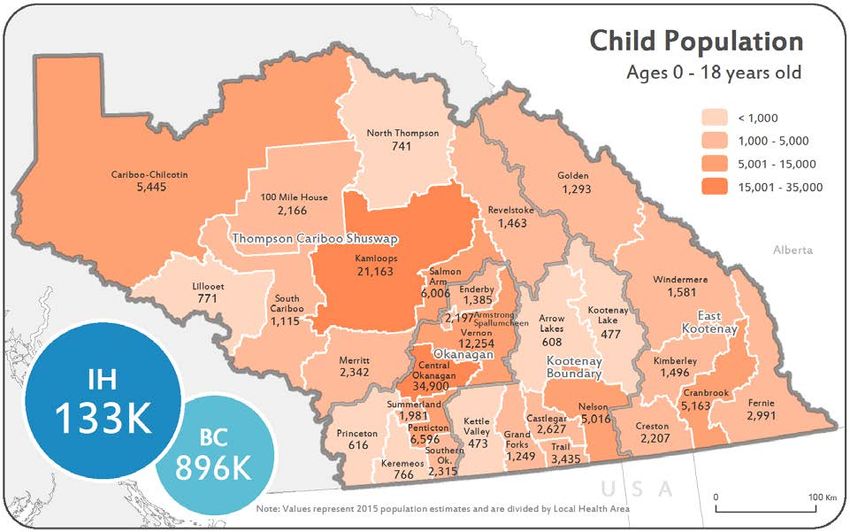
Interior Health Child Health Report 2018

Recommendations ............................................................................................................... 35
Conclusion ........................................................................................................................... 36
References........................................................................................................................... 37
Appendix A First Nations - IH ............................................................................................... 40
Appendix B: Data Sources .................................................................................................... 41

ix | P a g e
Interior Health Child Health Report 2018
Population
Interior Health is one of five regional health authorities in B.C. and is located in the south-central portion
of the province. There are two additional health authorities that are not geographically tied: Provincial
Health Services Authority (PHSA) and the First Nations Health Authority (FNHA).
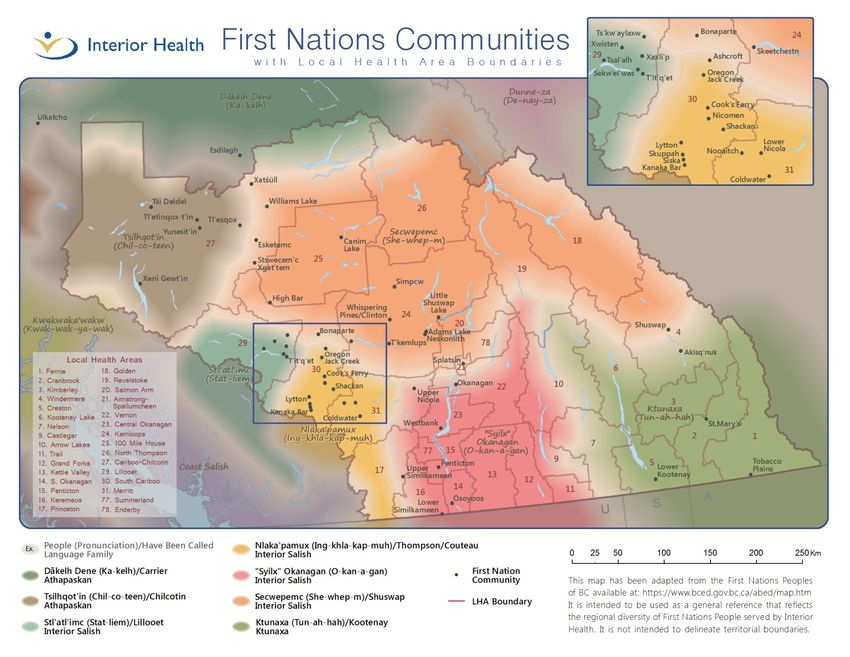
Interior Health is situated within the traditional, ancestral and unceded territories of the seven Interior
Nations peoples: Ktunaxa, Syilx, Secwepemc, Tsilhqot’in, Dalkelh Dene, Stl’atl’imc, and Nlaka’pamux
Nations. We acknowledge that residents of Interior Health gather on Indigenous lands and we are
grateful to the leaders of the Nations for meaningful partnerships that are forming and continuing. The
traditional territories of the seven Interior Nations are depicted in Appendix A.
The IH catchment area covers 215,000 km2 and has an estimated population of 743,471 (2016).7 About
18% (n=133,000) of the population in IH is under the age of 19 years, a similar proportion to B.C. (19%).
Approximately 8% of the population identifies as First Nations (status and non-status), Metis or Inuit.
About 36% of aboriginal population self-identify as Metis (n=16,200). IH is divided into four geographic
administrative Health Service Delivery Areas (HSDA): East Kootenay (EK), Kootenay Boundary (KB),
Okanagan (OK) and Thompson Cariboo Shuswap (TCS). The HSDAs are further divided into LHAs as
documented on Map 1. Map 1 also outlines the estimated population of children aged 0-18 years in
each LHA.
Map 1. Child Population Aged 0-18 Years, IH.
Source: PEOPLE 2016, BC Stats, Ministry of Technology, Innovation and Citizens' Services, 2016
1|PageInterior Health Child Health Report 2018 Process and Approaches Visioning & Development This report was developed by a Child Health Data Working Group (working group) on behalf of the Chief Medical Health Officer. This group was comprised of members from the Office of the Medical Health Officer (MHO), Aboriginal Health, Public Health – Promotion and Prevention, Allied Health, Strategic Information, Mental Health and Substance Use, IH Perinatal and Child Health Network (2013-2015) and a community pediatrician. The indicators presented in this report are a subset of indicators from Growing up in BC.6 The indicators were selected by the working group and, in some cases, in consultation with external partners. The indicator selection process included a survey of working group members, ranking of choices and data availability reviews. Selected indicators were matched to a list of nationally recommended childhood indicators to ensure comparability.8 Our indicators also align with the recently released Office of the Provincial Health Officer and Child Health BC joint report on the health and wellbeing of children and youth in B.C.5 Group consensus ultimately identified eighteen indicators as the most appropriate to broadly represent the childhood experience in IH and to highlight some of the key issues related to childhood development. Indicators chosen are not intended to be exhaustive; instead they highlight a broad spectrum of measures, encouraging further thought and exploration to inform future program planning and evaluation. Data sources used in this report are outlined in Appendix B. Data sources were selected based on availability of recent and local level data, as well as validity. At minimum, data are provided at the HSDA level. Where available, more granular School District (SD) or LHA level data are provided. Notable trends are highlighted in the text. 2|Page
Interior Health Child Health Report 2018
Maps
Throughout the report, maps are coloured to highlight the most vulnerable 10% and the least vulnerable
10% of LHAs and SDs. This method is used to detect geographic trends across the IH region. The most
vulnerable LHAs and SDs may be identified for intervention, while the least vulnerable LHAs or SDs may
be used to inform best practice. The colours and their meanings are described in Table 1.
In some cases there are “ties” (identical scores) where a division should occur. In this instance, both
regions are coloured to the “more extreme” category. Numbers on the map are rounded, however non-
rounded numbers are used to assign rankings. The result is that some LHAs appear to have the same
value but are coloured differently. Due this classification method, the reader is encouraged to examine
the range and spread of the values in and between categories. When the differences in values are small,
and there is no geographic trend, colour classifications may be less meaningful than when the
differences in values are larger or a geographic trend is apparent.
Summary Map
A summary map has been developed to represent a composite score of several indicators presented in
this report. Each LHA is assigned a score for included indicators, the total is averaged and rankings are
assigned. Results are presented in Cumulative Risk Map (Map 9). This map is an unweighted index that
is particular to this report and its indicators; however, cumulative health index scores are commonly
used both in primary care and public health to report multiple indicators together.9,10
Table 1. Description of Categories Used on Maps
Colour Classification No. of SDs No. of LHAs Points
Map Legend
(on Map) (approximate) (n=16) (n=31) (Risk Summary)
Top 10% 2 3 0 Least Vulnerable
Upper 50-89% 6 13 3 -
Lower 11-49% 6 12 7 -
Bottom 10% 2 3 10 Most Vulnerable
3|PageInterior Health Child Health Report 2018 Indicators Smoking During Pregnancy Smoking during pregnancy increases risk for miscarriage, perinatal mortality, low birth weight, premature birth and congenital anomalies. Not only does maternal smoking have a profound influence on the development of the fetus and newborn, it can also have long lasting, ongoing negative impacts on the future health of the child. Smoking during pregnancy is strongly linked to the social determinants of health. In Canada, younger mothers (
Interior Health Child Health Report 2018

Despite the relatively high rate of maternal smoking in IH, the prenatal smoking rate appears to be
declining. From April 2004 to March 2009, the average IH prenatal smoking rate was 16.1%, while the
rate declined to 12.4% between April 2014 and March 2015. This may be a reflection of a broader
declining trend in smoking; during the same periods smoking in the general B.C. population declined
from 15.1% to 13.6%. B.C. has the lowest smoking rate in Canada and overall smoking rates continue to
decline throughout the country.13

5|Page
Interior Health Child Health Report 2018

Exclusive Breastfeeding at 4 to 6 Months
Breastfeeding is recognized as the best possible start to life for babies. Breast milk provides optimal
nutritional and immunological protection to developing infants. Breastfeeding also fosters emotional
nurturing and attachment of infants and toddlers. Benefits of breastfeeding continue to be seen
throughout life. The World Health Organization (WHO) and Health Canada both recommend exclusive
breastfeeding for the first six months and after that, continuing to breastfeed up to 2 years, or more,
along with age-appropriate solid foods.14

The exclusive breastfeeding indicator measures the proportion of babies, aged four to six months, who
were assessed by the Public Health Nurse (PHN) to be exclusively breastfed when they visited the PHN
at a well-baby appointment. Exclusive breastfeeding is defined as consuming only breast milk without
the supplementation of food or other liquids (including water). The values reported need cautious
interpretation as some public health nurses were applying a less stringent definition, allowing some
solid food introduction or rare supplementation. More stringent processes are currently being adopted
in IH that will allow this rate to be determined more precisely. About 70% of babies born in IH had this
measure assessed between June 2013 and June 2016. It is unclear how the breastfeeding practices of
the unmeasured 30% would affect rates reported on Map 3.

           Map 3. Exclusive Breastfeeding at 4 to 6 Months, June 2013 to June 2016

                                     Source: Panorama, June 2013 - 2016

6|Page
Interior Health Child Health Report 2018 Over the three year reporting period, half of babies aged six months are reported to be exclusively breastfed. Rates for LHAs with relatively small populations such as Keremeos, Kettle Valley, and Kootenay Lake may fluctuate from year to year and rates should be interpreted with caution. Breastfeeding rates in IH do not follow a strong geographic pattern. According to 2011 Canadian Community Health Survey, 40.3 percent of B.C. mothers exclusively breastfed their infants for the first six months. 7|Page
Interior Health Child Health Report 2018

Infant Mortality
Infant mortality refers to the death of a live born baby during the first 12 months of life. The Infant
Mortality Rate (IMR) is the number of deaths per 1,000 live births in a specified population. IMR is a
commonly used measure of population health and well-being.15 It is influenced by a multitude of factors
including maternal health, quality and access to medical care, and socioeconomic factors. Extreme
prematurity, congenital malformations and Sudden Infant Death Syndrome have been identified as
major causes of infant mortality. Sleep-related factors contribute to the majority of sudden infant
deaths, which may be preventable though implementation of programs promoting safe sleep practices.
Although the IMR for IH is lower than the provincial rate, geographic variation is evident (2.2-4.5
deaths/1,000 live births) across the HSDAs (Table 2).

           Table 2. Infant Mortality Rate, 2004-2011 (Infant Deaths/1,000 Live Births)

          Region                         EK           KB            OK           TCS           IH           B.C.
          Infant Mortality
                                        3.6           2.2          3.4           4.5           3.6          3.9
          Rate
           Source: British Columbia Vital Statistics Agency. Selected Vital Statistics and Health Status Indicators
                                                        (2004-2011)

In Canada, the IMR rises with the proportion of the population experiencing low income. First Nations
people also have higher infant mortality rates than the general.16 This is disparity is believed to be true
for B.C. aboriginal communities as well. For example, while First Nations/Aboriginal/Metis peoples make
up 6.6% of the general population in Island Health, they are markedly overrepresented among infant
deaths (33%) and sudden infant deaths (50%).17 This is a stark example of how income and ethnicity
affects an infant’s survival, providing a strong rationale to enhance services, both health care and social
services, to allow infants to survive at identical rates regardless of socioeconomic status, geographic
location and ethnic descent.

                          With the purpose to decrease IMR in IH as well as eliminate population-specific
                          disparity in incidence of infant mortality, it is necessary to comprehensively
                          review underlying causes of infant deaths so that appropriate action can be
                          taken to avoid deaths that are preventable. A multi-disciplinary Infant Mortality
                          Review Committee has been formed to this effect so that monitoring and
                          comprehensive review of infant mortality in IH can lead to recommendation for
                          action.

8|Page
Interior Health Child Health Report 2018
Two Year Old Up-To-Date Immunization
Vaccination is one of the most effective and cost efficient health interventions.18 Continued uptake of
vaccination is critical to prevent outbreaks and ensure the sustained health of the population. Significant
morbidity can arise when children are infected with vaccine preventable diseases such as measles,
mumps and pertussis. Public health resources can be heavily utilized when outbreaks occur and require
public health management.
The two year old up-to-date (UTD) immunization indicator measures children that are up- to-date on all
recommended vaccines by the child’s second birthday. Children that do not meet this standard may be
partly vaccinated, on a parent directed delayed schedule (which may or may not result in the child
eventually catching up on recommended vaccines) or may be completely unvaccinated.
Figure 1. Two Year Old Up-to-Date Immunization Rates, 2011-2016
Source: BCCDC, Immunization for Children by their Second Birthday, 2011-2016
9|PageInterior Health Child Health Report 2018 The vast majority of childhood vaccinations are given by PHNs in IH. The two year old UTD immunization rates in IH’s HSDAs generally exceed that of B.C., with the exception of KB. The KB rate is consistently well below that of both the IH and B.C. averages (Figure 1). Lower vaccination rates, such as those observed in KB, leave populations vulnerable to future outbreaks. In 2013, 2014 and 2015 there were significant spikes in the incidence of pertussis (whooping cough) in KB. Outbreaks of pertussis have also occurred in other areas in B.C. The increasing rate of pertussis demonstrates the need for continued vigilance and focus on maintaining high rates of immunization throughout IH and the need for enhanced focus in areas with lower coverage. 10 | P a g e
Interior Health Child Health Report 2018

Early Childhood Developmental Vulnerability
The Early Development Index (EDI) measures children’s readiness for kindergarten. It examines and
summarizes the culmination of experiences and learnings children have in their critical first five years of
life. The EDI is a good predictor of adult outcomes, including social, health and education. For example,
children who are vulnerable in kindergarten are at least twice as likely to experience academic failure in
later grades.19

The EDI measures five domains20:
• Physical Health and Well-Being (e.g. physical co-ordination, readiness to learn [i.e. not hungry])
• Language and Cognitive Development (e.g. basic literacy, numeracy)
• Social Competence (e.g. works well with others, responsible for actions, independent)
• Emotional Maturity (e.g. pro-social behaviour)
• Communication Skills and General Knowledge (e.g. able to communicate and understand)

The EDI can be used to identify regions and communities with the highest proportion of vulnerable
children. This knowledge is helpful in directing targeted planning and service provision to children with
the highest needs. Some of these programs are directly provided or facilitated within the health care
system including nutrition, speech and autism services. Disadvantaged children that participate in early
childhood development programs demonstrate improved outcomes that extend into adulthood.21

        Figure 2. Kindergartener Vulnerabilities as Measured by the EDI, 2004-2016, IH

                            Source: Human Early Learning Partnership, UBC, 2004 - 2016

11 | P a g e
Interior Health Child Health Report 2018
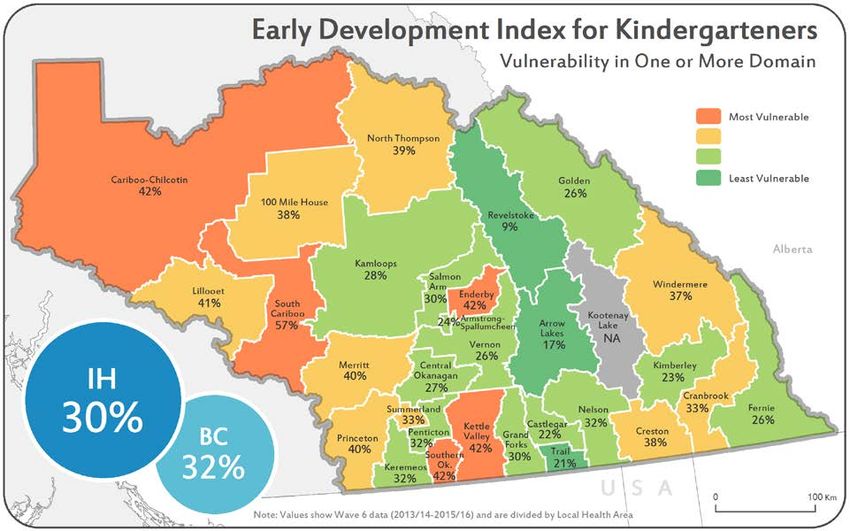
Map 4. Early Development Index for Kindergarteners, Vulnerable On One Or More Domain
2013/14-2015/16
Source: Human Early Learning Partnership, UBC, 2013/14 - 2015/16
Figure 2 indicates that physical and social vulnerabilities have increased in IH since the 2004 to 2007
cycle, which is consistent with the provincial trend.22 This increase is an ongoing area of research at the
B.C. Human Early Learning Partnership. The overall increasing rates of vulnerability on one or more
domain (3% increase since 2004 to 2007) indicates more children are at risk for less advantageous
outcomes including not graduating from high school. This provides rationale for enhanced intervention
and increased investment in the early years. Many communities in B.C. are using the EDI as a
“thermometer” of need to direct resources and planning for young children.
Overall kindergarteners in IH are less likely to be vulnerable on one or more domain than the B.C.
average (30% vs 32%). The western portion of IH has increased EDI vulnerability (Map 4) when
compared to the central and eastern portion. The impact of the increased vulnerabilities of western
LHAs on other indicators highlighted in this report may help explain this EDI gradient.
12 | P a g eInterior Health Child Health Report 2018
Dental Screening
Children who come from families with a lower socioeconomic status are more likely to experience poor
oral health. This can have implications on quality of life including pain and infections. Poor dental health
can lead to problems with eating, speaking, playing and learning.23 Early prevention measures include
sharing information about oral hygiene practices, applying fluoride, promoting healthy eating and
removing barriers to treatment. All of these measures have been shown to improve oral health in
children and adults.24,25
Every three years, public health dental professionals across B.C. screen kindergarten children for
evidence of visible decay, broken enamel, and treated caries. In 2012/13 the B.C. Dental Survey of
Kindergarten Children screened 89% of children enrolled in public, private and First Nations schools in
IH.
Map 5. Proportion of Kindergartners that are Free of Visible Decay or Restorations,
2012/2013
Source: BC Dental Survey of Kindergarten Children, 2012/13
Results showed large discrepancies in dental health across IH SDs (Map 5). For example, the proportion
of students who are caries free in the Rocky Mountain SD (81%) far exceeds rates in SDs such as Gold
Trail (43%), Nicola-Similkameen (48%), Arrow Lakes (53%) and Okanagan-Similkameen (54%). Aboriginal
children have higher rates of dental decay when compared to their non-Aboriginal counterparts.26
Despite these discrepancies, the proportion of children that were caries free in 2012/13 was nearly 10%
more than in the previous survey performed in 2006/07.27
13 | P a g eInterior Health Child Health Report 2018
Children and Youth Living in Low Income Families
Low income has far reaching consequences. For example in neighborhoods with low income, children
are more likely to be born pre-term and small for gestational age. In addition to negative prenatal
outcomes, children from families with low income are 2.5 times more likely to have impaired physical
abilities such as vision, hearing, speech and mobility and are more likely to exhibit delayed vocabulary
development. They are also more likely to demonstrate high levels of aggression.28 An individual’s
success in adulthood is impacted by poverty in their early years. For example, children that experience
ongoing poverty (especially poverty in preschool years) have lower high school graduation rates,
significantly impacting their success as an adult.29
Children and youth living in low income families indicator measures the proportion of children (0 to 17
years) in families with low income, using Statistics Canada’s Low-income measure after tax (LIM-AT).
LIM-AT is a fixed percentage (50%) of median adjusted after-tax income of households observed at the
person level, where 'adjusted' indicates that a household's needs are taken into account. A family is
considered to be low income when their income is below the LIM-AT for their family type and size.
Figure 3. Percentage of Children in Low-Income Families Based on Low-Income Measure
After Tax (LIM-AT), 2010
Source: Statistics Canada. National Household Survey 2011
Children with economic stress may have increased health needs and may experience barriers in
accessing health services. Kootenay Boundary HSDA demonstrated a higher prevalence of children and
youth living in low income households than other HSDAs (Figure 3). Overall, in IH, the percentage of
children in low-income families is 19.5 % for children and youth aged less than 18 years of age, and
20.3% for children less than six years of age. Overall IH has higher proportion of children in low income
14 | P a g eInterior Health Child Health Report 2018 families compared to B.C. average (19.1 % and 18.5 %, for children and youth less than 18 years and less than six years respectively). First Nation children are more likely to experience poverty than other Canadian children.30 The low income indicator included in this report is based on the 2011 National Household Survey which includes First Nations respondents living in the reserves. This indicator will continue to be evaluated as data becomes readily available on other comparable measures of poverty/low-income such as Low Income Cut-Off (LICO) and Market Basket Measure (MBM). This is especially important since non-response rates for the 2011 National Household Survey ranged from 25-59% in IH. However, the LIM-AT reported here are comparable to the low income indicator (based on LICO) in the provincial report on the health and well-being of children and youth in B.C.5 These indicators will also be considered in program planning and evaluation if they have enhanced availability and granularity (e.g. LHA/city/community/census tract level). 15 | P a g e
Interior Health Child Health Report 2018

Hospitalization for Mental Health
It is reported that on average 15% of children and youth in B.C. communities are dealing with mental
health disorders, impacting their functioning at home, at school, with peers and in the community.31
Positive mental health has been identified as a priority by the Ministry of Health.32 Community based
mental health services intended for children are offered by the Ministry of Children and Family
Development (MCFD) through various programs. In addition, primary care providers provide mental
health support and some children, who have the ability to pay, can receive support from private mental
health professionals. Some intensive, specialized mental health services reside outside of IH, such as
inpatient and outpatient treatment at the B.C. Children’s Hospital in Vancouver.

Under exceptional circumstances, children are admitted into acute care facilities for mental health
conditions or in response to self-harm events that require intensive short-term management. Rates of
admissions to hospital are not the preferred method for monitoring community mental health as they
are highly influenced by characteristics of the system and availability of community based mental health
resources. In addition, hospital admissions only recognize the most severe cases and do not represent
the average child struggling with mental health needs not requiring hospitalization. Despite the
limitations of this measure, it remains one of the most available and demonstrates the acute care needs
children and youth have experienced in our region.

               Figure 4. Adolescent (Ages 10-19) Mental Health Hospitalization Rate
                                                2010/11-2014/15

                 Source: Health Ideas, BC Ministry of Health, 2010/11-2014/15 (Ministry of Health, 2016)

16 | P a g e
Interior Health Child Health Report 2018 Rates of mental health admissions appear to be increasing in IH (Figure 4). Provincially rates have also increased but not at as great a rate as in IH. TCS has the highest average admission rate over the 5 years reported, potentially indicating gaps in primary care services. 17 | P a g e
Interior Health Child Health Report 2018

Caring Adult
The availability of supportive adults outside of school and family has been shown to be a protective
factor in adolescent lives. A new question in the McCreary Centre Society Adolescent Health Survey asks
students whether they have an adult in their community, other than a parent or teacher, who cares
about them. This strength based indicator draws attention to the meaningful role that every person
plays in ensuring adolescent well-being. Strength based indicators acknowledge and measure a known
protective factor or a factor that could facilitate resilience within a population.

McCreary Centre Society Adolescent Health Survey (2012/13)33 data show that students with a
relationship with a local adult that cares are more likely to feel the activities they engaged in are
meaningful, their ideas are listened to and to feel good about themselves.

A higher proportion of students across IH report having a relationship with a caring adult outside their
school or family compared to the B.C. average (66% vs. 61%) (Table 3). The highest proportion was
reported amongst EK youth with TCS and KB regions not far behind.

 Table 3. Students Aged 12-19 Reporting a Relationship With a Local Adult Who Cares, 2013

          Region                   EK          KB           OK          TCS           IH   B.C.
          Local adult who
                                  69%          67%          63%         68%         66%    61%
          cares
                         Source: McCreary Centre Society Adolescent Health Survey, 2013

18 | P a g e
Interior Health Child Health Report 2018
Mental Well-Being
Mental health and emotional development are indicators of overall well-being and can predict adult
health, educational results and positive social outcomes. Students in IH and across B.C. report good or
excellent mental health at similar rates (Table 4). Compared to IH and B.C., youth in KB and EK report
slightly higher levels of positive mental health (83%, 82%), whereas OK rates are slightly lower (80%).
Only youth attending main stream public schools were eligible to be included in the McCreary Centre
Society Adolescent Health Survey. This survey design may exclude some youth who may be at higher risk
for poor mental well-being (e.g. youth not attending school). Because of this limitation, rates provided
may overestimate the proportion of youth in IH experiencing good or excellent mental well-being.
Table 4. Students Aged 12-19 with Good/Excellent Mental Health, 2013
Region EK KB OK TCS IH B.C.
Mental Health
Very good or 82% 83% 80% 81% 81% 81%
excellent
Source: McCreary Centre Society Adolescent Health Survey, 2013
19 | P a g eInterior Health Child Health Report 2018
Healthy Weight
Healthy weight in childhood is an important indicator of healthy behaviours including good nutrition and
appropriate levels of physical activity. Weight can also influence the risk of diabetes and mental health
challenges stemming from negative body image. The McCreary Centre Society’s Adolescent Health
Survey asks youth to self-report height and weight measurements and from this, body mass index (BMI)
is calculated. A healthy BMI is defined as falling between the 3rd and 97th percentile, classifying
severely underweight and obese adolescents as unhealthy. These self-reported measurements are
prone to inaccuracies related to body image, social pressures, optimistic estimates, or simply not
knowing current measurements.34 Nevertheless, it remains a highly-used health indicator.
In IH and across B.C., females aged 12 to 19 are more likely to report a healthy weight than males. A
higher proportion of males in IH reported a healthy weight (73%) than their provincial counterparts
(70%), whereas IH females were less likely to report a healthy weight (77%) compared to the provincial
average (81%). IH youth living in OK were most likely to report healthy weights (77%), whereas those
living in TCS were least likely to (73%) (Table 5). Summary information is not available allowing
unhealthy weights to be stratified into overweight and underweight.
Table 5. Students Aged 12-19 with Healthy BMI, 2013
Region EK KB OK TCS IH B.C.
Males 79% 70% 72% 69% 73% 70%
Healthy Weight -
Females 70% 79% 82% 76% 77% 81%
Self-reported BMI
Total 75% 75% 77% 73% 75% 76%
Source: McCreary Centre Society Adolescent Health Survey, 2013
20 | P a g eInterior Health Child Health Report 2018
Physical Activity
Physical activity is critical to healthy weight and well-being.35 Active lifestyles and sedentary behaviours
learned in childhood are likely to carry through to adulthood.36 Physical activity includes activities that
are designed to increase heart rate (e.g. sports) and activities that inadvertently do so (e.g. chores).
Regular physical activity can improve attention and learning, develop self-confidence, increase
cardiovascular fitness, and cultivate physical literacy.37
Youth classified as physically active had participated in activities that made them breathe hard for at
least 60 minutes every day in each of the previous seven days (Table 6). In IH, 18% of youth aged 12 to
19 years old reported this level of physical activity compared to 16% across B.C. Adolescents living in EK
and TCS reported some of the highest levels of physical activity across the province (27% and 28%).
Females in the OK fell below the provincial average. Across all IH regions females report significantly
lower rates of daily physical activity than males. Interestingly, self-reported healthy weights show the
reverse trend, where adolescent females were more likely to report healthy weights than males. The
relatively low proportion of youth reporting physical activity is partly a function of the measure chosen.
Table 6. Percentage of Students Ages 12-19 who Exercise for at Least 60 Minutes per Day,
2013
Region EK KB OK TCS IH B.C.
Males 27% 23% 23% 28% 25% 22%
Physical Activity - At
Females 13% 12% 11% 13% 14% 12%
least 60 min daily
Total 20% 18% 17% 20% 18% 16%
Source: McCreary Centre Society Adolescent Health Survey, 2013
21 | P a g eInterior Health Child Health Report 2018
Tobacco Use
The 2013 McCreary Centre Society Adolescent Health Survey’s definition of tobacco use includes
cigarettes, cigars or cigarillos, chewing tobacco, electronic cigarettes, or using a hookah.
Table 7. Tried Smoking and Daily Smoking in Past 30 Days among Students Ages 12 to 19
Years Old, 2013
Region EK KB OK TCS IH B.C.
Tried Smoking 29% 31% 29% 27% 29% 21%
Tobacco Use
Used daily - Past 30 days 3.5% 3.1% 2.9% 2.7% 2.9% 1.5%
Source: McCreary Centre Society Adolescent Health Survey, 2013
The proportion of youth in IH who have tried tobacco was higher than the provincial average (29% vs.
21%) (Table 7). Province wide, IH has the highest proportion of students that smoke daily. Over the past
ten years, regional and provincial trends demonstrate a 13% decline in the proportion of youth who
have tried smoking, which is a significant and meaningful decrease in this risk behaviour.
22 | P a g eInterior Health Child Health Report 2018
High School Completion
Not graduating from high school is associated with lower health status, lifelong learning participation,
social cohesion and life satisfaction. It results in increased risk taking behaviours. In addition, not
graduating from high school reduces economic potential, a powerful lifelong determinant of health. Low
levels of education can perpetuate through multiple generations with children born to parents without
high school education more likely to experience similar negative outcomes.38
The ability to achieve a Dogwood high school certificate (i.e. High School graduation) is a culmination of
experiences, life situations, environment and personal factors. For some individuals, services provided
by the health authority such as speech therapy and occupational therapy are essential in achieving
graduation. From a population level, high school graduation rates inform areas with immediate and
potential future needs as populations with lower educational attainment may require additional health
services throughout their life course.39
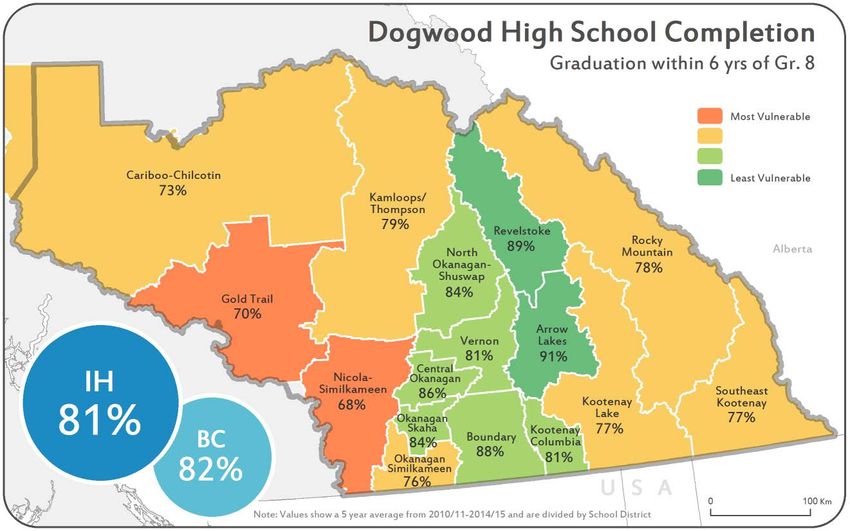
Map 6. Proportion of Individuals Graduating with a Dogwood High School Diploma within 6
Years of Beginning Grade 8, 2010/11-2014/15
Source: BC Ministry of Education 2010/11 – 2014/15
The westernmost portion of IH has the lowest rates of Dogwood high school completion in IH (Map 6).
Aboriginal students also have a significantly lower rate of Dogwood High School completion than their
non-Aboriginal counterparts (in 2006, 47% vs 79%).40 Given the strong association between education
and health status, this information is important for future health care planning as well as managing
current intervention services.
23 | P a g eInterior Health Child Health Report 2018
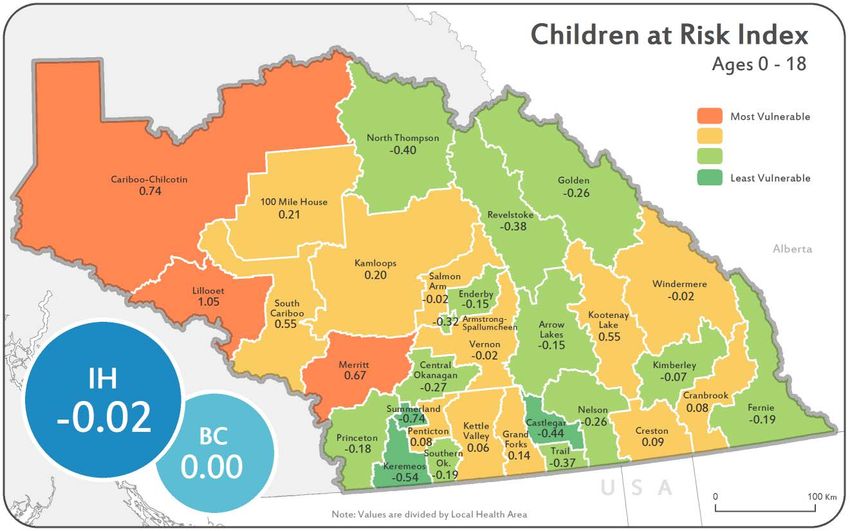
Children at Risk
At-risk children represent a critical demographic for whom early intervention could make a considerable
impression on their adult lives.41 The Children at Risk Composite Index provides a snapshot of estimated
vulnerability of children.42 The index includes the following risk measures: families receiving income
assistance, children in care, infant mortality, reading levels and serious juvenile crime. Together these
factors are weighted and used to estimate the degree of vulnerability children experience in LHAs across
B.C. This indicator assigns a negative (better outcomes) or a positive value (worse outcomes) to the
geographic region based on how their children compare to the B.C. average.
Map 7. Children at Risk Index, Ages 0-18 Years, 2012, IH
Source: BC Stats Socio-Economic Indices, 2012
IH has a broad spectrum of risk, -0.93 to 1.17. Of the 77 LHAs ranked across the
province, Summerland (-0.74), Keremeos (-0.54) and Castlegar (-0.44) predict
some of the highest levels of child well-being and were ranked among the top
ten in B.C. (Map 7). In contrast, children in Lillooet (1.05), Cariboo-Chilcotin
(0.74) and Merritt (0.67) are expected to be at the highest risk of negative
outcomes and were ranked among the bottom 10 in B.C. Geographically these
high risk regions are clustered in the western portion of IH, revealing a high
degree of inequity in child well-being across IH.
24 | P a g eInterior Health Child Health Report 2018
Hospitalization for Injury
Injuries are the leading causes of death among people aged 1 to 44 years.43 Injuries can either be
intentional (e.g. self-harm, assault) or unintentional (e.g. motor vehicle collisions, sporting injuries).
Successful injury prevention relies on a multi-faceted approach including education, legislation,
regulation, surveillance, prevention tactics, community support and infrastructure.28
Figure 5. Average Yearly Unintentional and Intentional Injury Hospitalization Rates, by HSDA
and Age Group 2009/10 - 2013/14
Source: Discharge Abstract Database, Ministry of Health, BCIRPU Injury Data Online Tool 2009/10-2013/14
(BC Injury Research and Prevention Unit 2016)
The BC Injury Research and Prevention Unit (BCIRPU) reports that between 2006 and 2011, 142 IH
children and youth (aged 0 to 19 years) lost their lives to unintentional and intentional injuries.
Childhood injury hospitalization rate (183 hospitalizations per 100,000 population per year) is highest in
EK. Injury rates increase as children age with the exception of children aged 1 to 4 and 5 to 9 years
where a relatively constant injury rate is seen (Figure 5). Aboriginal people have higher injury rates when
compared to non-Aboriginal residents.44
25 | P a g eInterior Health Child Health Report 2018
Figure 6. Average Yearly Unintentional and Intentional Injury Hospitalization Rate, by
Sex and Age Group, IH, 2009/10-2013/14
Source: Discharge Abstract Database, Ministry of Health, BCIRPU Injury Data Online Tool 2009/10-2013/14
(BC Injury Research and Prevention Unit 2016)
Males sustain more injuries than females across all ages; however this becomes more apparent in older
youth (15-19 years) where males have 1.85 times the hospitalization injury rate as females (Figure 6).
Higher risk for injury in males and increasing gender gap with age is a well-known phenomenon and
research is focused on this disparity.45
The mechanism of injury changes as children age as shown in Table 8. Falls are the most common
mechanism of injury for 0 to 14 year olds. Transport related injuries climb steadily with age until they
become the most common mechanism of injury in 15 to 19 year olds. Intentional injuries (i.e. self- harm,
suicide and assault) become much more significant in 15 to 19 year olds and are only second to
transport related injuries in this age group.
26 | P a g eInterior Health Child Health Report 2018
Table 8. Common Injuries by Age Group, IH, 2009-2014
Age Group Injury Hospitalizations
(Years) (per 100,000 Population)
Suffocation/Choking 7.09
Foreign Body 7.09
Unintentional Poisoning 7.74Interior Health Child Health Report 2018
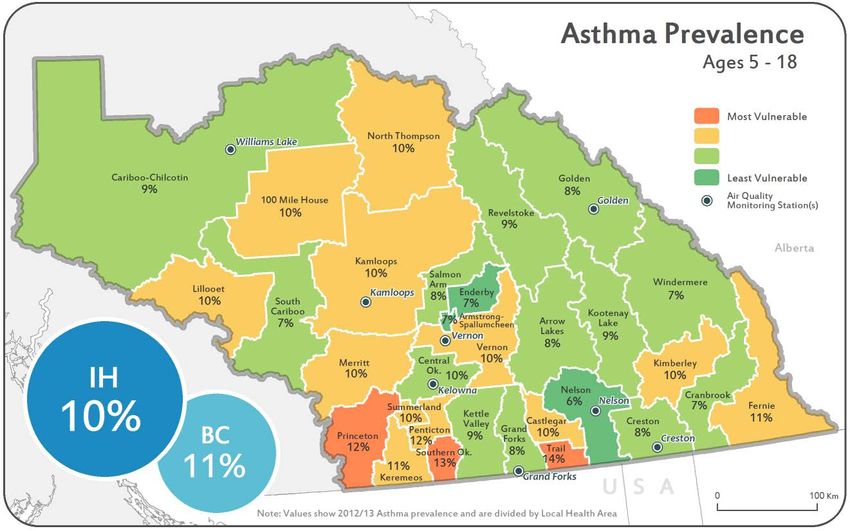
Asthma Prevalence
Asthma is a chronic condition that affects over 10,000 children (aged 5 to 18 years) across the IH
region.46 Asthma is the most common chronic disease in children. Symptoms include wheezing,
coughing, and shortness of breath. Poor air quality is a key risk factor for children with asthma.47 Indoor
air quality triggers include the presence of mold, dust mites, allergens and tobacco smoke. Outdoor air
quality can also trigger asthma exacerbations. Outdoor air quality can be impacted by motor vehicle
emissions, heavy industrial activities, wood combustion and forest fires. Children with persistent asthma
have increased school absenteeism48 potentially affecting their school performance. Children with
asthma will have increased contact with the health care system when medical management is required
to control symptoms.
Map 8. Asthma Prevalence in Children 5 to 18 Years Old, 2012/13, IH
Source: Primary Health Care Registry (Discharge Abstract Database, MSP, PharmaCare and PharmaNet), 2012/13
The prevalence rate of childhood asthma in IH is lower than that of B.C. (10% vs 11%). Map 8 shows the
LHAs with the highest rates are most southerly and along the United States border. They include Trail
(14%), South Okanagan (13%) and Princeton (12%). Trail and the South Okanagan (Osoyoos) have
permanent air quality monitoring stations. The lowest rates are scattered throughout IH, without an
apparent pattern.
28 | P a g eInterior Health Child Health Report 2018
Food Security
Poor nutrition and hunger are known to affect children’s memory, energy levels, and ability to focus.
Food banks and other charitable organizations across IH help provide nutritious food to families and
children who rely on this support.
Table 9. Number and Percentage of Children under Age 18 Using Food Banks, 2015
Region EK KB OK TCS IH B.C.
Number of unique children using
food banks 823 600 1,998 2,239 5,659 31,527
Percent of children in HSDA using
food bank 5.9 4.6 3.4 5.8 4.6 3.8
Source: Food Banks Canada, Hunger Count 2015
Approximately 4.6% of all children in IH used a food bank in 2015 which exceeds the B.C. rate of 3.8%. A
greater proportion of children in EK and TCS (5.9 and 5.8%, respectively) rely on food banks than in the
other two IH HSDAs (Table 9). Nearly 6,000 children in the IH region relied on food banks to meet their
nutritional needs in 2015. Other organizations (e.g. churches, food gleaning), not affiliated with Food
Banks Canada, also provide food to families in need. This may result in the counts that Foodbanks
Canada provides underestimating of the proportion of families that are utilizing charity to acquire
sufficient food.
Figure 7. Percentage of All Food Bank Users That Are Under 18 Years Old, 2012-2015
Source: Food Banks Canada, Hunger Count 2015
29 | P a g eInterior Health Child Health Report 2018 In 2015, 41 food banks operated across IH and of food bank users in IH, 32% are children. Between 2012 and 2014, EK saw a significantly declining proportion of children food bank users, despite a stable provincial rate (Figure 7). Acquiring food from charitable organizations is one way to measure food insecurity and represents relatively extreme food insecure situations. Some families have inadequate resources to provide a healthy variety and supply of food but do not visit food banks. This situation will also negatively impact healthy childhood development. 30 | P a g e
Interior Health Child Health Report 2018
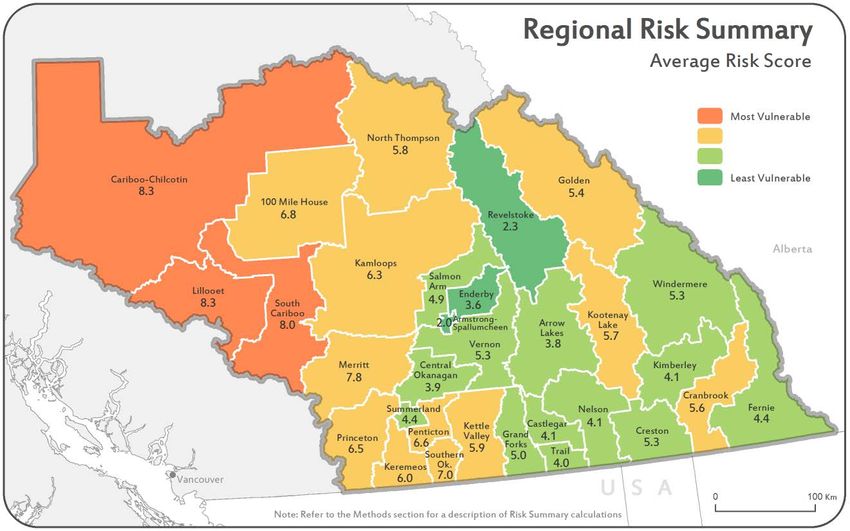
Summary Indicator – Cumulative Risk
This indicator is a summative measure that combines the following indicators:
• Smoking During Pregnancy
• Exclusive Breastfeeding at 4 to 6 months
• Early Development Index for Kindergarteners
• Caries free Kindergarteners
• Dogwood High School Completion
• Children at Risk Index
• Asthma Prevalence
All indicators that were presented in this report at either the LHA or SD level are included. The map
highlights areas that are at higher or lower risk over the broad indicators included. This is valuable in
identifying areas with higher global needs and indicates areas that have need for geographically focused,
overarching interventions. Public Health actions should be universal (everyone has access), but with
scale and intensity that is proportionate to disadvantage and need. Identification of areas with higher
concentration of need can help steer resourcing decisions to communities and populations that need
more or different services to achieve the same positive outcomes. There continues to be need in areas
that are not highlighted.
Map 9. Cumulative Risk
31 | P a g eYou can also read