Curry County Community Health Assessment 2018 - 2018 Curry County Community Health Assessment - Advanced Health
←
→
Page content transcription
If your browser does not render page correctly, please read the page content below

Curry County
Community Health Assessment 2018

                  2018 Curry County Community Health Assessment - 1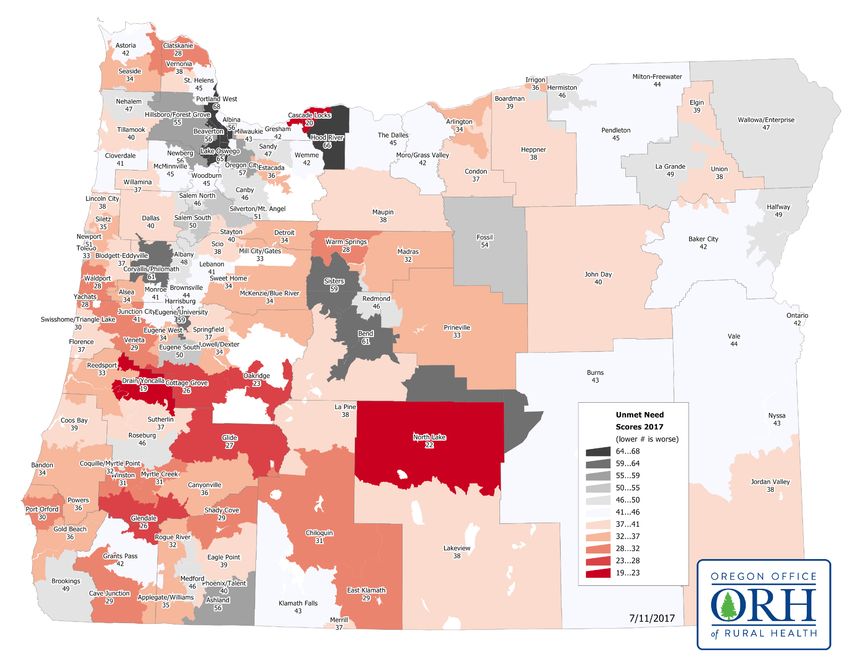
Acknowledgments
Curry Community Health Assessment Committee

Beth Barker-Hildalgo, Oregon Coast Community Action, South Coast Head Start
Beth Beasley, Curry Community Health
Ben Cannon, Curry Community Health
Bevin Hansell, Oregon Health Authority
Lisa Hendricks, Advanced Health
Heidi Hill, Advantage Dental
Cheryl McDermott, Curry Health Network
Cameron McVay, AllCare Health
Linda Maxon, Coast Community Health
Georgia Nowlin, AllCare Health Community Advisory Council, South Coast Regional Early
Learning Hub
Virginia Razo, Curry Health Network
Belle Shepherd, Oregon Health Authority
Cindy Shirtcliff, Advantage Dental
Dori Statton, Advanced Health Community Advisory Council
Kari Swoboda, AllCare Health
Jeri Lynn Thompson, Tolowa Dee-Ni Nation
Laura Williams, Advanced Health, South Coast Regional Early Learning Hub

                                          e
                                       tag
                                    Advan

                                                       l
                                                   nta
                                                 De

                                            Consulting & Technical Writing by:
                                            V Consulting & Associates Inc.
                                     2018 Curry County Community Health Assessment - 2
Contents
Acknowledgments                                                                  2
Introduction and Purpose                                                         1
 Community Health Assessment Approach & Model
 Collaborative Partner Key Requirements
 Plans and Processes requiring Community Health Assessments
 Vision & Values of Community Health Assessment Process
 Social Determinants of Health & Health Equity Framework
 Types of Data, Data Collection, Data Sources and Limitations
Demographics                                                                     6
 Introduction to Curry County
 Population Growth & Characteristics
Neighborhood and Physical Environment                                           11
 Housing
 Homelessness
 Transportation
Economic Stability                                                              18
 Income
 Poverty
 Employment And Unemployment
Education                                                                       23
 Children And Early Learning
 Absenteeism, Graduation & Education Attainment
Food                                                                            28
Community                                                                       32
Health Care System                                                              38
 Insured and Uninsured
 Access To Providers
 Health Facilities
 Access To Specific Services
Health Behaviors                                                                47
 Alcohol and Other Drugs
 Opioid and Other Drug Use
 Vaccinations
Health Status And Outcomes                                                      54
 Mortality
 Mental Health and Suicide
 Oral Health
 Maternal And Child Health
Gaps and Next Steps                                                             63
Appendices                                                                      64
Primary Data Collection Summary                                                 65
 Process & Methods
 Primary Data Themes

                                                2018 Curry County Community Health Assessment - 3
Introduction and Purpose
The 2018 Community Health Assessment (CHA) is a view into the health status of the people that
live in Curry County. The assessment process results in an increased understanding of key health
issues facing the community, aids in better planning of services and helps to identify strengths
and challenges to address with health care resources. The development of the assessment also
engages community members by listening to their perceptions and experiences about what
influences health. The process includes comprehensive data collection and analysis, working
across multiple sectors and bringing many local organizations together.

2018 marks the first time all of the partners collaborated on a single health assessment, with
a desire to reduce duplicity and share resources. The process of the CHA is as important and
vital to the community as the document that is produced. The resulting CHA document assists
organizations in planning and prioritizing efforts that ultimately improve health outcomes, the
health of individuals and communities.

Community Health Assessment Approach & Model
The 2018 Community Health Assessment committee began meeting in 2017 to build a
collaborative including the local hospital, the local federally qualified health center, public
health, early learning and child focused groups, the local Coordinated Care Organizations (CCO),
tribal representation, dental organizations and many other vital health and human service
organizations. The desire to pool resources, reduce duplication of effort and meet individual
requirements for health assessments drove the group to engage with a consultant to lead and
facilitate the 2018 Community Health Assessment in the fall of 2017.

 Organization Partners in 2018 Curry Community Health Assessment

 Curry General Hospital                              Advantage Dental
 Oregon Coast Community Action (ORCCA)               Coast Community Health Center
 Curry Health Network                                Curry Community Health
 Advanced Health (formerly WOAH)                     Tolowa Dee-Ni Nation
 AllCare Health                                      Oregon Health Authority
 South Coast Regional Early Learning Hub

The Mobilizing for Action through Planning and Partnerships (MAPP) model was the approach
chosen by the committee. The MAPP process is a national best practice. It is a community driven
process that results in engagement of new stakeholders, provides a broad understanding of
community health issues and helps to identify both strengths and challenges related to health
in a community. Due to resources and time required for a robust MAPP process, the committee
agreed upon a modified MAPP model with a time line of November 2017-April 2018.

                                       2018 Curry County Community Health Assessment - 1
Community Input: Data Analysis & Writing
Secondary Data Collection
Kickoff & Visioning Primary Data Collection November 2017-February Review & Finalize
& Analysis
November 2017 December 2017-January 2018 April 2018
November 2017-January 2018
2018
The work of the CHA was completed by both the consultant and the CHA committee. The CHA
committee provided leadership to the process, assisted with primary data collection including
focus groups and surveys and were key in engaging community voice and input. Specific
methods of data collection are outlined in the data section.
Collaborative Partner Key Requirements
Many community organizations are required to complete a health assessment. The regulatory
bodies that require these assessments vary widely in their frequency, focus and requirements for
assessments. They include a broad spectrum of organizations, from the IRS to the Oregon Health
Authority. Although vastly different, the regulatory requirements for assessments all articulate a
need for community organizations to seek to understand strengths and needs in a community to
better prioritize health efforts and services.
There are many requirements that are shared across all entities that are required to go through a
community health assessment process.
Overlapping Key Requirements for Community These include having a balance of types
Health Assessments of data, community engagement and
input, population based health status
data and some level of prioritization of
health issues in the community.
Population
Based-Health
Status Data
Primary & Community
Secondary Engagement
Data & Input
Prioritization of
Health Issues
2018 Curry County Community Health Assessment - 2Plans and Processes Requiring Community Health Assessments
CHNA Required by IRS
Focus is to identify and assess access and needs of community
the hospital is serving.
Documentation must include written report.
See Patient Protection and Affordable Care Act requirements
for 501(c)3 hospitals.
Led by hospital
Community Health
Needs Assessment Every 3 years
CCO Required by Oregon Health Authority
Purpose is to assess entire community served by CCO, not just
Medicaid population. Tied to responsibility of CCO in creating
the Triple Aim: Better care, better health and reduced costs.
Led by CCO, with CAC involvement.
Coordinated Care Proposed to be every 3 years
Organization
Public Health
Accreditation Collaborative process resulting in a comprehensive community
health assessment.
Led by County Public Health with collaborative partners
Every 5 years
Other
Other includes Federally Qualified Health Centers (FQHCs), Head
Start, Early Learning Hubs, Tribal Health Centers
Various time lines/frequency/requirements and
population focus
2018 Curry County Community Health Assessment - 3Vision & Values of Community Health Assessment Process
One of the first processes in the MAPP process is to have the committee discuss their vision for a
healthy community and the values related to assessing and planning for that vision.
• We believe health is very connected to the social determinants of health such as education,
employment, housing and food
• We believe in building on our strengths, not only looking at barriers and needs in our assessment
process
• We believe it is important to focus on health equity and address inequities data when we are able
to while also remembering our rural county has inequities to urban counties in the state
• We believe there is value in building on previous assessment work while not duplicating effort
• We recognize that this assessment cannot focus on all things related to health but it does identify
areas we can impact
• We believe that the process we go through engages consumers of health services and incorporates
the voices of those we serve
• We believe addressing poverty as a root cause of poor health is important
• We believe reducing child abuse and chronic stress in families improves health
Social Determinants of Health & Health Social Determinants of Health
Equity Framework
The CHA committee recognizes that multiple factors
in a community impact the health of individuals,
$ $
families and communities. These are often called
the Social Determinants of Health. The term Social
Determinants of Health is defined by the World
economic neighborhood
Health Organization as “the conditions in which demographics and physical
people are born, grow, live, work and age. These stability environment
circumstances are shaped by the distribution
of money, power and resources.” The social
determinants of health influence health inequities.
Health inequities are the avoidable, unfair and unjust
differences in health status seen within and between
individuals and communities.
education food community
The traditional way to approach health assessments
and health improvement was to focus on status,
outcomes and health care services. More recent
research and practice has expanded that perspective,
to recognize that health is more than health care,
more than just what happens at the doctor’s office. heath care health health
system behaviors outcomes
2018 Curry County Community Health Assessment - 4Health care itself is an important influence on health,
What affects health worldwide?
but socioeconomic factors, our physical environment
and our individual behaviors also greatly influence our
health.
Health Behaviors
Many community health models suggest that up to Socioeconomic Tobacco use
Factors Diet and exercise
40% of the health in the community is related to Education Alcohol use
socioeconomic factors. Employment 40% Unsafe sex
Income 30%
Social Support
Community Safety
Health Care
Types of Data, Data Collection, Data Sources Access to care
Quality of care
and Limitations 10%
20%
Physical
Data used in the community health assessment Environment
Built Env
Natural Env
included primary and secondary data, qualitative and
quantitative data. Secondary data is data collected Source: County Health Rankings and Roadmap, Robert Wood Johnson
by another organization or group. Examples are rates Foundation and Kings County Hospitals for a Healthier Community, King
County Community Health Assessement 2015-2016
of morbidity and mortality from Oregon Health Authority or demographic data from the US
Census. Secondary data at the county level was used most often, but when available and reliable
zip code and/or census tract data was available it was highlighted. Newer data was valued over
older data, although some sources were older by necessity as the data is no longer being tracked
or isn’t available in newer years and illustrates an important point about health status. Due to
small population numbers in some areas of the county, multiple years were sometimes grouped
together emphasizing trends over time instead of one-year snapshots on some data points, an
important consideration for rural community assessments.
Primary data collection was collected by focus groups and surveys. Details of the primary data
collection methodology and results can be viewed in the Appendix.
The Community Health Assessment has limitations, it is not meant to cover every possible
factor that influences health, or every possible health related data point being tracked. It is not
meant to be a complete list of all community health needs or health data. It relies heavily on
other secondary data assessments and there are notable gaps in readily available local, county
and national data. The CHA is not a rigorous research study or a process designed to evaluate
the efficacy of services or community organizations. It is intended to provide a macro view
of community data, help to identify strengths, assets and challenges and engage community
in the process of addressing inequities and improving overall community health. Lastly, the
CHA document is intended to be built on and added to over the years, complimenting other
assessments and not standing alone.
2018 Curry County Community Health Assessment - 5Demographics
Introduction to Curry County
Curry County is a rural county located along the Pacific Coast in the
Southwest corner of Oregon. Its boundaries include the Pacific Ocean on the West, California
on the South, Coos County to the North and Josephine County on the West. The County was
recognized as a county in 1855 and is the 25th most populated county (out of 36) in the state.
The county has an approximate population of 22,600 residents, encompassing 1648 square
miles of land. The rugged mountainous terrain includes hundreds of lakes, rivers and streams
stretching from mountains, through the Redwoods and to the Pacific Ocean. There are many
unincorporated and isolated rural communities, presenting challenges for transportation and
access to services. The three incorporated cities include Brookings, Gold Beach and Port Orford.
The entire county is designated as rural, by the Oregon Office of Rural Health.
2018 Curry County Community Health Assessment - 6Population Growth & Characteristics
Curry County, like many other rural counties has witnessed a slower population growth than the
state over the last several decades. Curry County did see a significant influx of residents in 2008-
2010 but then the rate of change dipped and slowed beginning in 2010.
Rate of population change, 2002-2016, Curry County
4.5%
4.0%
3.5%
3.0%
2.5%
Pe rce n t
2.0%
1.5%
1.0%
0.5%
0.0%
-0.5%
-1.0%
O reg on Curry County
Y ear
2002-2004 2004-2006 2006-2008 2008-2010
2010-2012 2012-2014 2014-2016
Source: PSU Population Research Center Annual Population Report
The median age of residents in Curry County is 55 years old, much older than the state median
age of 39 years old. Curry County has an older population than the rest of the state, with
the percentage of those over 60 years of age steadily increasing and accounting for a larger
percentage of overall population. According to census estimates, 30% of the county population
was over 65 years of age in 2015. The percentage of those over 60 years old is expected to
increase to close to 40% by 2030. Also notable is that only 16% of the population is less than 17
years old compared to 21% in Oregon.
Age distribution, 2011-2015 Curry County and Oregon
Oregon
Curry County
0% 10% 20% 30% 40% 50% 60% 70% 80% 90% 100%
Age 0-4 Age 5-17 Age 18-24 Age 25-34 Age 35-44 Age 45-54 Age 55-64 Age 65+
Source: US Census Bureau, American Community Survey 2011-2015
2018 Curry County Community Health Assessment - 7“We have retirees that need lots of assorted medical care, several types of which
are not available locally.” —Survey Participant
According to 2015 census estimates, there are more White residents in Curry County, than
any other race or ethnicity, accounting for 87.5% of the population. The remainder of the
population self-identifies as 6.29% Hispanic, 3.31% Multi-racial, 1.91% Native American, .55%
Asian.
Non-English language speakers average around 4.55% of the total Curry population,
considerably lower than the State and National averages which hover around 21%. Spanish is
the most common non-English language spoken, 2.83% of the total population of Curry County
are native Spanish speakers.
Veterans, 2011-2015 Curry County and Oregon
17.45%
9.97%
Curry County O reg on
Source: US Census Bureau, American Community Survey 2011-15
Curry County has a large population of veterans, close to double the state average. The
veterans in Curry County are also older. The majority of Veterans in Curry county served in
Vietnam, 3.13 times greater than any other conflict (Data USA 2018).
Veteran community by age, 2011-15
Curry County and Oregon
O reg on
Curry County
0% 20% 40% 60% 80% 100%
A g e 18-34 A g e 35-54 A g e 55-64 A g e 65-74 A g e 75+
Source: US Census Bureau, American Community Survey 2011-15
2018 Curry County Community Health Assessment - 8Curry County also has a higher percentage of people with disabilities than the state average.
Many of those with disabilities are 65 or older in the county.
“Curry County has more disabled people than we realize, including veterans with
PTSD and hyper-vigilance.” —Focus Group Participant
Disabilities, 2011-2015
Curry County and Oregon
50%
40%
30% 25.77%
20% 14.42%
10%
0%
Curry County O reg on
Disability by age, 2011-2015
Curry County and Oregon
O reg on
Curry County
0% 20% 40% 60% 80% 100%
Under A g e 18 A g e 18 - 64 A g e 65 +
Source: U.S. Census Bureau, 2011-2015 American Community Survey 5-Year Estimates
2018 Curry County Community Health Assessment - 9Indicators Key
The indicator table provides an overview of indicators in the county/
=higher (than State)
service area, including comparison with Oregon overall averages,
percent/percentages.
=lower (than State)
Demographic
Findings
Indicator
(Curry County vs. Oregon)
Population Overall growth
Percent Hispanic or Latino
Race & Ethnicity
Percent Native American
Spanish
Decreasing percent of Spanish speakers
Speakers
Percent population 55 and older
Age Percent under 18 years old
Percent families with children
Veterans Percent veterans, mostly men
Percent disability
Disability
Percent over age 65 with disability
2018 Curry County Community Health Assessment - 10Neighborhood and Physical
Environment
Physical environment is one important social determinant of health. Where
somebody lives and how they move around from place to place to access basic services such
as grocery stores, health care and work greatly influences health. Physical environment such
as indoor and outdoor air quality also affects health outcomes. Exposure to environmental
toxins and other hazards such as lead influence health conditions. Opportunities for physical
recreation, either built or natural, affects health behavior.
Outdoor air quality is a strength in Curry County, consistently better than state and national air
quality. The wildfire season in 2017 was particularly damaging and affected the air quality, but
up until then, the particulate matter in the air was significantly lower than National Ambient
Air Quality standards. Physical environment, including air quality and recreational opportunities,
was overwhelming chosen as the biggest strength of the county, by participants in the 2018
CHA surveys and focus groups.
“Quality of air we breath, most especially during the fire season and how many of
us in the community suffered and still are from the damaging effects of the poor
air quality we breathed in during two months from the now historic Chetco Bar
Fire in 2017.” —Survey Participant
“Having just moved here, I would say air quality, location, general environment is
a strength, meaning it isn’t like Los Angeles.” —Focus Group Participant
Indoor air quality data is difficult to gather in the county, but many focus group and survey
participants mentioned it as being poor in the county.
“Quite a few houses have mold issues and are in general need of repair.” —Focus
Group Participant
Natural outdoor recreation opportunities are many in the county. According to available online
data, there are 40 parks in the county. There are also multiple trails for hiking, biking and
recreation and dozens of beaches, lakes, forests and streams (Oregon Hometown locator). The
weather can impact outdoor recreation while access to built walking and running paths are
2018 Curry County Community Health Assessment - 11limited in the county.
“We don’t have much indoor walking during rainy season or indoor swimming
pool, we need both I think.” —Survey Participant
Recreation and fitness facilities, 2010-2015
Curry County and Oregon
20
18
rater per 100,000 population
16
14
12
10
8
6
4
2
0
1 2 3 4 5 6
Curry County Oregon
Source: US Census Bureau, County Business Patterns
There are limited built environment recreation opportunities, including limited walking and
bike lanes, sidewalks and established gym facilities. The rate of establishments is higher than
the state average but the number of establishments is still low at four total facilities in the
entire county.
2018 Curry County Community Health Assessment - 12Housing
Where people live is core to quality of life. Housing availability and quality is a well-established
social determinant of health. Household quality problems such as overcrowding, incomplete
kitchen or plumbing facilities and cost burden are experienced by 39% of the population in
Curry County, higher than the State average (US Census Bureau, American Community Survey
2011-2015).
Household costs are related to availability. 35% of households in Curry County (estimated
3,971 households) are cost burdened, meaning their rent or mortgage exceed 30% of their
household income, this is higher than state levels. According to the recent Brookings Housing
Needs Assessment (October 2017), the majority of the households (in Brookings) that are cost
burdened have an annual income between $20,000-35,000, making a strong case for more
affordable housing options and rentals. Availability of housing was second only to poverty in
the biggest concern for focus group and survey participants of the 2018 CHA process.
“HUGE lack of affordable housing for the working class just adds to our problems.
Even making above minimum wage a person/family has to pay a large percentage
of their income just to have a roof over their head, that is often sub-par and
leaves them with little to meet other requirements of living in our society. In this
community one is LUCKY to find something that is under 50% of your income,
this is outrageous and sets our community up for failure in the long run.”—Survey
Participant
“Too much planning efforts for expensive housing and not enough in affordable,
family housing.” —Survey Participant
“We can’t attract people to fill positions because there is no housing, we need
more affordable housing inventory.” —Focus Group Participant
The median value of homes has decreased in the county since 2006. Curry County also has
higher percentages of housing dedicated to seasonal or recreational use, close to 50% of vacant
housing is used for seasonal, recreational or occasional use. The 2017 Brookings Housing Needs
Assessment also listed that in Brookings, 49.8% of vacant housing is seasonal or recreational use
in 2010, climbing to an estimated 61.1% in 2017 and projected to be 70% in Brookings alone by
2025, showing an increasing trend.
“Housing is limited. Some of its from vacation housing, making rent too high or
not even available. Its why we have so many mobile homes here.” —Focus Group
Participant
2018 Curry County Community Health Assessment - 13Vacant housing units by housing market classification
2011-2015 Curry County
vacant housing
units for sale
17%
vacant housing
units for rent
11%
vacant housing units for other use
*vacant housing units for other
72% use includes vacation rentals
Source: US Census Bureau, American Community Survey
Housing affordability and availability was consistently listed as a concern related to recruitment
of professionals to the area, specifically in the health care and education industries.
“I’ve come here from California, I can get a nice house way cheaper here but I
can’t find a place to rent while I shop. Affects doctors and teachers, I had a week
to find a house when I moved here for a job and settled for something I’m not
happy in.” —Focus Group Participant
2018 Curry County Community Health Assessment - 14Homelessness
People experiencing homelessness, defined by anyone who lacks a fixed, regular and
adequate nighttime residence, was listed as a significant concern in the 2018 CHA
primary data focus groups and surveys. The number of homeless adults is increasing
according to the annual point in time count.
The number of homeless students is also increasing and trending up county wide and
in most districts. Homelessness in youth can include those without a permanent home
but also includes those doubled up or “couch surfing.”
“We see more grandparents living with their kids and their kids’ kids or single
parents going to live with other families. It affects large swaths of youth that
don’t have a bed or a regular room of their own.” —Focus Group Participant
Homeless count, 2011-2016
Curry County
180
160
number of persons
140
120
100
80
60
40
20
0
2011 2017
Curry County - a ll homeless persons
Source: Oregon Housing and Community Services 2011-2017
2018 Curry County Community Health Assessment - 15“Homelessness has increased, we have couch surfers that don’t learn the skills they
used to in school.” —Focus Group Participant
Homeless students (K-12) by district, 2013-2016
Curry County
160
140
120
number of homless students
100
80
60
40
20
0
2013 2014 2015 2016
Central Curry SD 1 Port O rford-Lang lois SD 2CJ
Brook ing s-Harbor SD 17C A LL- Curry County
Source: Oregon Department of Education
Transportation
Limited public transit and the geographical distance and terrain affects transportation to work,
school and health care, particularly for those with limited resources. According to US Census
estimates, 85.5% of workers drive to work (2015), 0% used public transit, slightly over 8%
walked in Curry County. Transportation, particularly to medical appointments was a consistent
issue brought up in both focus groups and by survey participants.
“Transportation is a problem, some people don’t have a car or reliable car or they
can’t afford gas.” —Focus Group Participant
“Transportation is limited, most transportation here is special support from
friends, if you don’t have friends you don’t get transportation.”—Focus Group
Participant
2018 Curry County Community Health Assessment - 16Indicators Key
=higher (than State)
The indicator table provides an overview of indicators in the county/
service area, including comparison with Oregon overall averages, =lower (than State)
percent/percentages.
Neighborhood and Physical Environment
Findings
Indicator
(Curry County vs. Oregon)
Housing
Vacant housing dedicated to recreational/vacation or occasional use
Availability
Cost burdened households in rentals & homes with mortgages
Housing Costs
Median value of a house since 2006
Housing Quality
Severe household problems
and Type
Homeless students by district trending up
Homelessness
Homeless adults trending up
Air Quality Outdoor air quality
Recreation and
Recreational facilities
Fitness
2018 Curry County Community Health Assessment - 17$ $
Economic Stability
Income
Economic stability is a social determinant of health and it includes issues
such as poverty, income, employment and unemployment. Income and income inequality is
directly linked to an individual’s health. Income inequality has been shown to have health
impacts including increased risk for poor health and increased risk of death. The average and
median incomes in Curry County are lower than state levels. Poverty levels are increased in the
County, compared to state and national percentages.
Annual family income,
2012-2016 Curry County and Oregon
$90,000 $84,441
$80,000
$70,000 $65,479
$60,802
$60,000
$50,241
$50,000
$40,000
$30,000
$20,000
$10,000
$-
A verag e Fam ily Incom e Median Fam ily Incom e
Curry County O reg on
Source: US Census Bureau
When compared to state and national wages, the county has more of its jobs in the lower wage
categories, most in the under $40,000 annual salary.
2018 Curry County Community Health Assessment - 18Distribution of various wage buckets, 2015
Regional, Oregon, National
18%
16%
14%
12%
10%
8%
6%
4%
2%
0%
Coos, Josephine & Curry Oregon National
Source: American Community Survey PUMS 1-Year Estimate
Poverty
The percentage of the population living in poverty in the county ranges 17-18% depending on
source.
Poverty in Oregon
Better State Average Worse
Curry County
17.7%
2018 Curry County Community Health Assessment - 19Poverty affects those in older age categories disproportionately in Curry County,
compared to state averages. Those over 64 years of age are over twice as likely to be
living in poverty than people of the same ages statewide. Furthermore, women are
more likely than men to be living in poverty in Curry County. 48.5% of children under
18 live below 200% of the federal poverty level in the county, according to 2011-2015
census estimates.
Poverty level by age
Curry County and Oregon, 2012-2016
50%
45%
40%
35%
30%
25%
20%
15%
10%
5%
0%
A ll ag es Under 5 5-17 years 18-34 years 35-64 years 65 years and
older
A g e G ro u p
Curry County O reg on
Source: U.S. Census Bureau
2018 Curry County Community Health Assessment - 20Another indicator of poverty includes children who are eligible for free or reduced lunches at
school. In Curry County, 60% of children are eligible, more than the state average (51%) and
higher than neighboring Coos county.
Students receiving free and reduced lunch
select schools in Curry County, 2010-2016
100
90
percent of students
80
70
60
50
40
30
20
10
0
Azalea Middle Brookings-Harbor *Driftwood Gold Beach High Kalmiopsis *Pacific High Riley Creek
School High School Elementary School School Elementary School School Elementary School
01-07-10 01-07-12 01-07-14 01-07-16
Source: Oregon Department of Education
Employment and unemployment
Employment and annual census of employees has been trending up in Curry County since 2014,
a trend consistent across the region.
Annual census of employees, 2007-2016
Curry County
7200
7000
6800
6600
Number
6400
6200
6000
5800
5600
5400
2007 2008 2009 2010 2011 2012 2013 2014 2015 2016
Source: US Bureau of Labor Statistics
2018 Curry County Community Health Assessment - 21Unemployment remains higher than the state average but has been trending down since 2009,
a positive trend. Unemployment in Curry County in 2017 was 6.9%.
Unemployment, 2006-2017
Curry County and Oregon
15%
10%
5%
0
2006 2007 2008 2009 2010 2011 2012 2013 2014 2015 2016 2017
Curry County O reg on
Source: US Bureau of Labor Statistics
Indicators
The indicator table provides an overview of indicators in the county/
service area, including comparison with Oregon overall averages, Key
percentage/percentages.
=higher (than State)
Economic Stability
=lower (than State)
Findings
Indicator
(Curry County vs. Oregon)
Income
Income
Individuals with lower wage jobs
Living in poverty
Living in
Living in poverty over 65 years of age
poverty
Children live at or below 200% Federal Poverty Level
Free and
Reduced-price Students qualifying for free and reduced lunch
lunches
Unemployment Percentage unemployed
$ $
2018 Curry County Community Health Assessment - 22Education
Education is an important social determinant of health, as education
increases a person’s overall health also often increases. More education has
been shown to be linked to longer life and increased income, while lower
education attainment can be linked with poor health, higher levels of crime, unemployment
and increased stress.
Children and Early Learning
Children in Curry County have benefited from early learning programs like Head Start. The rate
of students enrolled in Head Start is significantly higher than state averages, a clear strength of
the community.
Students in Head Start 2014
(per 10,000 children)
35.25 Curry County
8.84 Oregon
Source:assessment
Kindergarten US Department of are
scores Health & Human
close Services,
to state Administration
averages, with Hispanicfor Children
childrenand Families
scoring
slightly better than state scores in Curry County.
“Healthy communities have support and recognition and focus on children. They
are our future.”—Survey Participant
Childcare availability was listed as a concern in the 2018 CHA focus groups. Data from the
National Data System for Child Care showed 20 providers registered in Curry County, but only
15 choosing to be listed. All of the providers listed are in Brookings with the exception of one in
Langlois and one in Gold Beach.
“We need more accessible, safe child care and activities, safe bike paths, being
able to not stress about where my kids are and if they are safe while you are at
work.” -Focus Group Participant
2018 Curry County Community Health Assessment - 23“We have a childcare issue limiting families from being able to find jobs and stick
with them, leading to decreased basic needs for the families.” -Survey Participant
Kindergarten assessment scores, 2016-2017
Curry County and Oregon
Multi-Ethnic
Hispanic
W hite alone
Male
Fem ale
Total Population
0 2 4 6 8 10
assessment score*
Curry County
Oregon Source: Oregon Department of Education
*assessment score on a 0-10 scale
Absenteeism, Graduation & Education Attainment
Absenteeism in school is an indicator related to education. Curry County has higher percentages
of absenteeism in 8th and 11th graders, with physical reasons being listed as the highest reason
for absenteeism. One in four 8th graders missed between 3-10 days of school in 2017.
Absenteeism in 8th graders, 2017
Curry County and Oregon
100%
80%
60%
40%
20%
0%
None 1-2 days 3-5 days 6-10 days 11-15 days 16 or more
days
Curry County
O reg on Source: Oregon Healthy Teens Survey 2017
2018 Curry County Community Health Assessment - 24“We have a low graduate rate, knowledge deficit and hopeless abound.” —Focus
Group Participant
High school graduation has been slightly lower in Curry County than Oregon since 2011 similar
to neighboring Coos County. Latest available data shows 72.6% of ninth graders graduated
from high school in their cohort (4 years later) in 2015-16.
4 year cohort graduation rates, 2008-2016
Curry County and Oregon
90
80
70
60
50
40
30
20
10
0
2008-09 2009-10 2010-11 2011-12 2012-13 2013-14 2014-15 2015-16
O reg on Curry County Source: Oregon Department of Education
“We have a low emphasis on education.” —Focus Group Participant
When compared to the state, Curry has fewer people with bachelors, graduate or professional
degrees than state averages.
“With loss of logging and fishing industry its been hard. We used to have 400 kids
in high school, now there are only about 100.” —Survey Participant
2018 Curry County Community Health Assessment - 25Educational attainment 2011-2015
Curry County and Oregon
100%
Graduate or professional degree
90%
80% Bachelor's degree
70%
Associate's degree
60%
50% Some college, no degree
40% High school graduate
30% (includes equlvalency)
20% 9th to 12th grade, no diploma
10%
Less than 9th grade
0%
O reg on Curry County Source: Us Census
People in Curry County with less educational attainment are more likely to be living in poverty.
Poverty status by educational attainment, 2011-2015
Curry County and Oregon
50%
45%
40%
35%
30%
25%
20%
15%
10%
5%
0%
Less than high school High school graduate Some college or associate's Bachelor's degree or
graduate (includes equivalency) degree higher
Curry County Oregon Source: Us Census
2018 Curry County Community Health Assessment - 26Indicators
The indicator table provides an overview of indicators in the county/
Key
service area, including comparison with Oregon overall averages,
percentage/percentages. =higher (than State)
=lower (than State)
Education
Findings
Indicator
(Curry County vs. Oregon)
Students in Head Start
Early Childhood
Graduation
Graduation
Rates
People with bachelors or advanced degrees
Educational
Attainment Percentage of high school graduates living in poverty
2018 Curry County Community Health Assessment - 27Food
Eating nutritious food and maintaining a healthy diet are important
to individual health. Poor nutrition has been shown to increase risk
for various chronic health conditions and to increase morbidity and
mortality. A healthy food environment includes access to healthy foods and food security.
Access to food has many facets including the cost, distance and availability of fresh and
healthy food options. The USDA defines food insecurity as lack of access to enough food for
all members in a household and limited or uncertain availability of nutritionally adequate
foods. 1 in 4 children (24.5%), aged 18 and younger in the county remain food insecure,
higher than the state average. Overall, residents of Curry County experience more food
insecurity than in the state as whole.
Adults and children with food insecurity, 2015
Oregon and Curry County
25%
20%
15%
10%
5%
0%
overall children 18 and younger
Population
Oregon Curry County Source: Feeding America, 2015
Twenty percent of 8th graders in Curry County answered yes when asked if they ate less than
they felt they should because there wasn’t enough money to buy food. This is higher than
the 14% state average (Oregon Healthy Teens Survey 2017).
Access to healthy foods has improved since the 2013 Community Health Assessment and is
better than some counties in the state. The food environment index for Curry County is 6.9,
the same as neighboring Coos County. The food environment index is based a scale of one
to ten, with (0) being the worst and (10) being the best. 5% of the county has limited access
to healthy foods, according to the USDA Food Security Survey, Feeding America 2014 survey.
2018 Curry County Community Health Assessment - 28“We don’t have fresh enough food. You know what they say…small communities
get the least fresh food and its true here in Gold Beach.” —Survey Participant
33.3% of the population in Curry County lives in a food desert, which is slightly better than
state averages but still identifies a need. A food desert is defined as a low-income census tract
where a substantial share of residents have low access to a supermarket or large grocery store.
“As to food, I notice a distinct lack of freshness of everything food wise. Buy fresh
and its bad two days later. Everything comes “fresh” to Gold Beach is already at
the end of its freshness.”—Focus Group Participant
Women, Infants and Children (WIC) and the Supplemental Nutrition Assistance Program (SNAP)
benefits are public programs designed to address food access and insecurity. The rate of stores
that accept either WIC or SNAP benefits is more than state averages, indicating a program asset
and strength while also
SNAP (2016) and WIC (2011) authorized stores indicating a large number
Curry County and Oregon of residents qualifying for
benefits.
“SNAP and WIC
WIC
have increased
availability.”—
Survey Participant
SNAP
0 5 10 15 20 25 30 35
Rate per 100,000
Oregon Curry County
Source: US Department of Agriculture, Economic Research Service 2011
Youth drinking water four times a day or more
2017 Curry County and Oregon
50.4% 49.4% 50.2%
33.0%
Grade 8 Grade 11
Curry County Oregon
Source: Oregon Healthy Teen Survey, 2017
2018 Curry County Community Health Assessment - 29Eating five or more servings of fruits and vegetables a day is lower, for adults, in Curry than
Oregon. 48% of 8th graders have consumed soda 1-3 times in the past 7 days, while water
consumption in 8th graders is lower than state averages, according to 2017 Healthy Teens
Survey.
Adults consuming at least 5 servings of fruits
and vegetables a day, 2012-2015 “When parents are
either not working and
Curry County and Oregon depressed or are working
20.3% multiple wage jobs, they
don’t and can’t prepare
healthy food. We need
a low-cost walk-in fresh
food store, combined
with education on quick,
low cost, healthy food
5.9% preparation.” —Focus
Group Participant
Curry County O reg on
Source: Oregon BRFSS County Combined Dataset 2012-15
What 8th graders drink 2017 Curry County
Curry County and Oregon
Oregon
25%
20%
14.4%
15%
9.7% 9.6%
10% 6.4% 6.4%
3.9% 4.0% 5.0% 3.7%
5% 2.1% 2.0% 1.2%
0%
Daily 100% juice Daily soda Daily fruit-flavored Daily energy drink Daily sports drink Daily milk
(not diet) beverage (not (not diet)
100% juice)
Source: Oregon Healthy Teen Survey, 2017
2018 Curry County Community Health Assessment - 30Indicators
The indicator table provides an overview of indicators in the county/
Key
service area, including comparison with Oregon overall averages,
percent/percentages. =higher (than State)
=lower (than State)
Food
Findings
Indicator
(Curry County vs. Oregon)
Food Insecurity Adults and children living with food insecurity
SNAP authorized retailers
Food Access
WIC authorized stores
8th graders drinking sodas
Soda
Consumption Adult soda consumption
Fresh Food
Adults consuming fruits and vegetables
Consumption
2018 Curry County Community Health Assessment - 31Community
Indicators related to community include social connections and crime. Social
associations are one way to measure social connectivity and social cohesion
in a community. Lack of social connectivity and resulting isolation can
influence health outcomes of individuals and community.
The number of membership organizations such as service organizations like Rotary or
Zonta, sports groups, political organizations, clubs and professional organizations indicate
volunteerism and connectivity. The rate of such associations in Curry County (2014) is 11.5 per
100,000 population, higher than Oregon’s average of 10.4 per 100,000, a strength in the county.
“The library and book clubs have saved my life because they are a supportive
environment.” —Focus Group Participant
Membership organizations
2014 Curry County and Oregon
Oregon
Curry County
0 2 4 6 8 10 12 14 16 18 20
Rate per 100,000
Source: County Business Patterns, 2014
Participants in the 2018 CHA focus groups and surveys universally chose social support including
religious and spiritual values as the second biggest strength in the community. The third biggest
strength were the people that live here, similar to neighboring rural counties.
While social associations are strong, many individuals indicate that they still don’t have
adequate social and emotional support. 23% of individuals in the county say they don’t have
adequate social and emotional support. Nearly one in three (27%) youth state that they are
neither working or in school, indicating disconnection from community. This is higher than state
averages.
2018 Curry County Community Health Assessment - 32“Need to address people who isolate themselves, pockets of isolation here.
We could improve a lot of things by spending more time together, building
relationships, solving problems more together. Sometimes it only takes one
person to reach out and reduce isolation.” Focus Group Participant
Disconnected youth, 2010-2014 Individuals without adequate social
Curry County and Oregon or emotional support, 2006-2012
Curry County and Oregon
27%
23.2%
15.2%
15%
Curry County Oregon Curry County Oregon
Source: Measure of America, using American Community Survey Data
Bullying in schools is also an indicator of social cohesion. 29.3% of 8th grade youth in Curry
County experienced bullying in 2017, near the state average (Oregon Healthy Teens Survey
2017). The top reason for bullying was appearance (weight, clothes, acne or other physical
characteristics), followed by gender (someone thought you were gay, lesbian or bisexual). The
trend/percent of youth experiencing bullying is decreasing.
Youth experiencing bullying, 2005-2017
Curry County and Oregon
100%
80%
60%
40%
20%
0%
2005 2007 2013 2015 2017
Curry County Oregon
Source: Oregon Healthy Teens Survey
2018 Curry County Community Health Assessment - 33Violent crime is lower than state averages. Violent crime was trending up until 2009 until it
began to decline again in Curry County.
Violent crime, 2004-2013
Curry County and Oregon
350
300
250
200
150
100
50
0
2004 2005 2006 2007 2008 2009 2010 2011 2012 2013
Curry County Oregon
Data Source: Federal Bureau of Investigation, FBI Uniform Crime Reports
The number of convictions for methamphetamine and heroin in the county are also on a
downward trend.
Convictions for Methamphetamine and Heroin, 2012-2016 Curry County
35
Methamphetamine convictions
30 Heroin convictions
Total number of convictions
25
20
15
10
5
0
2012 2013 2014 2015 2016
Data Source: Federal Bureau of Investigation, FBI Uniform Crime Reports
2018 Curry County Community Health Assessment - 34The institutionalized population or jail incarceration rate is higher than the state and has been
on an upward trend since 1980.
Jail incarceration, 1980-2014
Curry County and Oregon
350
300
250
200
150
100
50
0
1980 1985 1990 1995 2000 2005 2010 2013
Curry County Oregon Trend (Curry) Trend (Oregon)
Source: Vera Project, Bureau of Justice Statistics (BJS) Annual Survey of Jails (ASJ) and
Census of Jails (COJ). 1980-2014
The percentage of youth that report being intentionally hit or physically hurt by an adult in
2017 is nearly one in three (26.8%), higher than neighboring Coos County and state averages
(Oregon Healthy Teens Survey 2017). However, the number of founded child abuse cases in the
county is trending down. The victimization rate in Curry County is considerably lower at 8.2 per
1,000 children than state rates which hover close to 14 per 1,000 (DHS Child Welfare Data Book
2016). The number of children in foster care in the county in 2017 was 43. Foster care placement
stability, which is the number of children in foster care with two or fewer placements, as a
percentage of total number of children in foster care, is one of the worst in the state, ranking
32nd out of 36 counties in Oregon at 48.5% (Children’s First Child Data Book, 2017).
2018 Curry County Community Health Assessment - 35“There is a lot of dysfunction and violence in mixed households/mixed houses
and families that are mixed. You lose control of your family unit when mixed.
Just because you have a warm bed you can’t rationalize the other horrors and
violence because its better than living in a car, sometimes it’s not.”
—Focus Group Participant
Child abuse reports*
2010-2016
Curry County
50
40
30
20
10
0
2010 2011 2012 2013 2014 2015 2016
*founded child abuse reports
Source: Child Welfare Data Book. 2010-16
Curry County had approximately fifty two law enforcement officers across all agencies (Oregon
Annual Uniform Crime Reports, 2016) in 2016.
“There isn’t any law enforcement here. We can’t even recruit them, no money
for them and too few of them. No regular policing, only if there is a severe drug
issue. Really no policing in the mountains, it’s scary.” —Focus Group Participant
2018 Curry County Community Health Assessment - 36Indicators Key
The indicator table provides an overview of indicators in the county/ =higher (than State)
service area, including comparison with Oregon overall averages,
percent/percentages. =lower (than State)
Community
Findings
Indicator
(Curry County vs. Oregon)
Social
Social associations/membership organization involvement
Associations and
Volunteerism
Social and Individuals without adequate social support
Emotional
Support Disconnected youth
Violent crime
Crime and
Child abuse and neglect
Safety
Foster care stability
2018 Curry County Community Health Assessment - 37Health Care System
The health care system provides services to prevent and treat disease. It
influences the health of individuals, families and communities. Health
disparities, often created by the social determinants of health, affect access
to health care services.
Insured and uninsured
Health insurance influences access to health care services. Curry County has a higher percentage
of the population on publicly funded insurance, which includes Medicaid/Oregon Health Plan/
OHP, Coordinated Care Organizations, Medicare and The Veterans Administration/VA. Estimates
from Oregon DMAP and RUPRI, indicate that 65.8% of the population in the county was on
either Medicaid, Medicare or both in 2017, this is higher than previous year estimates. The
percentage of people on public insurance within the county is highest in Port Orford, followed
by Brookings and then Gold Beach. 47.4% of those on Medicaid in Curry County, from 2011-
2015, were 18-64 years old, 31.8% were under 18 year old and 20.8% were 65 years or older (US
Census 5 year estimates).
Public insurance coverage by zip code, 2011-2015
100%
90%
80%
67.7%
70%
60%
49.6%
49.7%
50%
39.1% 41.4%
40% 34.6% 35.7% 34.3%
30% 27.7%
19.1%
20% 16.6% 17.7%
8.2%
10% 6.5%
7.7% 7.6%
0%
Port O rford 97465 G old Beach 97444 Brook ing s 97415 Curry County
Medicare coverag e Any public coverag e
VA H ealth Care Medicaid / means-tested public coverag e
Source: U.S. Census, American Community Survey 2011-2015
The percentage of people with health insurance has been increasing statewide since
2011, with a sharp increase in 2015. It is estimated that 96.8% of Oregonians were
covered by insurance in 2016 (Oregon Annual Health Insurance Report, 2018).
2018 Curry County Community Health Assessment - 38Access to providers
Access to providers and specific health services is another element of access to health
care services. Access to primary care providers has increased since 2008, although the
area continues to be experiencing a health care provider shortage. The Oregon Office
of Rural Health designates Curry County a Medically Under-served Area (MUA), a Health
Professional Shortage Area (HPSA), and a Health Professionals Shortage Area for Dental
and Mental Health Providers. These designations show Port Orford as the highest unmet
need in the county, followed by Gold Beach and then Brookings (Oregon Office of Rural
Health 2017).
In 2016 the county had 18.0 FTE/Full Time Equivalent Primary Care providers, including
Internal Medicine Physicians, Family Medicine Physicians and General Practice Physicians.
(Oregon Office of Rural Health 2018). The majority of providers are in Brookings
followed by Gold Beach.
Access to primary care, 2004-2014
Curry County and Oregon
120
100
rate per 100,000
80
60
40
20
0
2004 2005 2006 2007 2008 2009 2010 2011 2012 2013 2014
Curry County
Oregon
Source: US Department of Health & Human Services, Health Resources
and Services Administration, Area Health Resource File
2018 Curry County Community Health Assessment - 39Overall scores of unmet health care needs, 2017
6
Source: Oregon Office of Rural Health 2018
“Access to doctors is a huge problem. Just one example—I have been trying to get
an appointment for my daughter for a prescription refill for over six months and
can’t get anyone to even call me back.”—Focus Group Participant
2018 Curry County Community Health Assessment - 402016 Provider Numbers (FTE=Full Time Equivalent)
• 8.5 FTE Family Medicine Physicians
• 1.0 FTE General Practice
• 8.8 FTE Internal Medicine Physicians
• 1.5 FTE Obstetricians/Gynecology
• 1.4 FTE Pediatricians
• 9.6 FTE Nurse Practitioners
• 5.2 FTE Physician Assistants
• 7.1 FTE Dentists
• 1.9 FTE Psychiatrist/Psychologist
• 3.0 FTE Licensed Social Workers
• 3.0 FTE Licensed Counselors, LMFT, Psychologists
Source: Oregon Office of Rural Health 2018
Health Facilities
While Curry General Hospital in Gold Beach, Oregon has been in existence for more than 66
years, Curry Health District dba Curry Health Network was only established in October 1983.
Located in America’s Wild Rivers Coast, the District is bounded in the north by Elk River (north
of Port Orford), south by Pistol River (south of Gold Beach) and includes Agness (a 35-mile drive
west along the Rogue River).
The District is a municipal corporation, a form of local government as an Oregon Special District
(Health Dis-trict) and derives a portion of its operating revenue from a tax base. It has been
granted 501(c)(3) status by the Internal Revenue Service, and as such, has the exemptions and
rights that such status affords. A board of five elected directors governs the District.
Curry General Hospital is certified as a Critical Access Hospital and is the sole hospital serving
Curry County, located in the county seat of Gold Beach, Oregon. The aged hospital was replaced
in 2017 with a 62,900 square foot state-of-the-art facility. The Network owns and operates Curry
Medical Center in Brookings, Curry Medical Practice and Curry Medical West in Gold Beach, and
Curry Family Medical in Port Orford.
Curry Health Network offers emergency medical services; inpatient and outpatient services;
primary and specialty care including non-interventional cardiology, general surgery, urology,
gynecology, orthopedics and pain management; cardiopulmonary services including
rehabilitation; physical, occupational and speech therapy; laboratory and imaging services; and
an inpatient pharmacy.
2018 Curry County Community Health Assessment - 41The mission of Curry Health Network is healthy communities with efficient, quality health care;
our vision is to be the region’s premier rural healthcare system. We share the values of integrity,
compassion, accountability, stewardship, teamwork and excellence.
Recruitment and retention of providers was listed consistently as a concern in focus groups and
survey participant comments.
“We have a problem with the availability of good doctors that stay so you can
keep on seeing them. It’s an inconvenience to drive 100 plus miles to see a good
doctor or specialist.”—Survey Participant
“Access to health care providers who stay in the area for more than a year and
provide quality care, we don’t have that here.” —Survey Participant
“Providers, it’s hard to get them here and to stay. They can’t get their kids into
good schools or have housing problems and so they move.” —Focus Group
Participant
Access to Specific Services
Access to dentists in Curry County is more difficult than statewide. The rate of dentists has been
lower in the county for the last several years. The percentage of adults who have had no dental
exam in the past year is also higher at 33.9% (BRFSS 2006-2010). Youth are also less likely to
have accessed dental
Rate of dentists per 100,000
care in the county
Curry County and Oregon
than in the state.
90 71.3% of 8th graders
80 and 59.8% of 11th
70 graders in the county
rate per 100,000
60 accessed dental care
50 in 2017 (Oregon
Healthy Teens Survey
40
2017).
30
20
10
0
2010 2011 2012 2013 2014 2015
Curry County O reg on
Source: US Department of Health & Human Services, Health Resources
and Services Administration, Area Health Resource File. 2015
2018 Curry County Community Health Assessment - 42The percentage of a population that has preventive screenings is an indicator of access to
care, specifically the quality and availability of care and timeliness of access. The screenings
provided the most often include cholesterol testing, blood sugar testing, colon cancer screening
by sigmoidoscopy or colonoscopy and mammogram. Curry County performs fewer screenings
than the state overall. Mammograms are particularly lower for Curry County women age 50-74.
Blood sugar testing is the only screening that exceeds state percentages.
“We don’t have access to affordable and quality preventative health care. A lot
of people have health issues, or they let it go too long and can’t get preventative
care.” —Survey Participant
Preventive Screenings 2012-2015 Curry County and Oregon
Cholesterol Checked
Blood Sugar Test (A1c)
Sigmoidoscopy or Colonoscopy
Mammogram
0 10 20 30 40 50 60 70 80
Percent of applicable* population
Curry County
Oregon Source: BRFSS 2012-2015
*Applicable populations:
Percent cholesterol checked within last 5 years; Percent blood sugar test in past 3 years; Percent current on
colorectal cancer screening, 50-75 years old; Percent of mammogram w/in past 2 years 50-74 years old.
*pap test numbers too small in Curry County to be statistically reliable
2018 Curry County Community Health Assessment - 43You can also read