Community Health Assessment 2017-2021 - Approved by the Horizon Community Health Board 09-10-2018 - naccho
←
→
Page content transcription
If your browser does not render page correctly, please read the page content below
Community Health Assessment
          2017-2021
       Approved by the Horizon Community Health Board 09-10-2018

                                                              1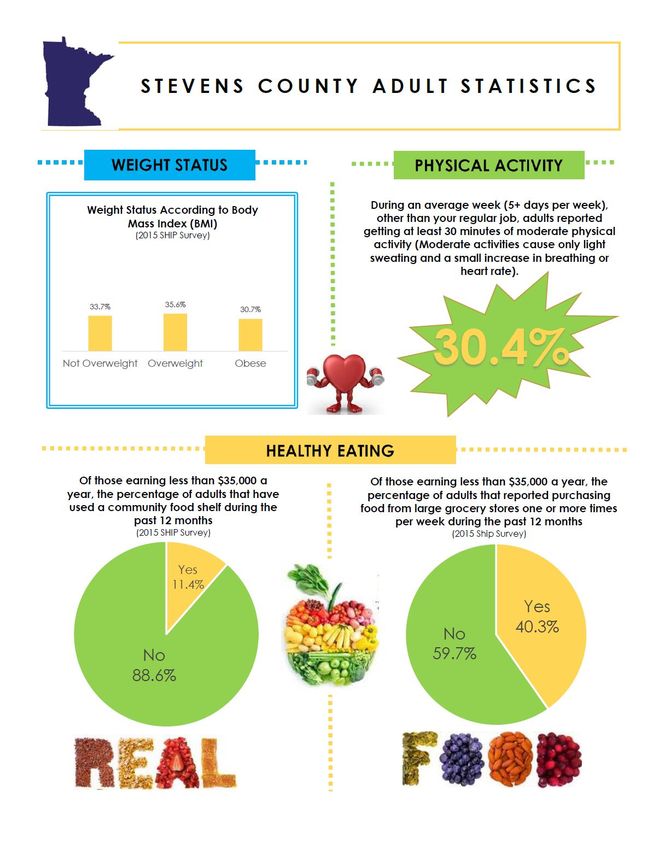
CONTENTS
A Message to the Community…………………………………………………………………………….……. 4
Executive Summary…………………………………………………………………………………………….……. 5
Introduction……………………………………………………………………………………………………….…….. 6
      What is health? .................................................................................................... 6

      What creates health? …………………………………………………………………………………….… 6

      What is health equity? ……………………………………………………………………………….…… 6

The Community Health Assessment Model, Process and Challenges ………………….….. 7
      The Community Health Assessment Model …………………………………………………….…… 7

      The Community Health Assessment Process ……………………………………………….………. 7

      The Challenges of a Community Health Assessment ……………………………………..………. 8

Data Collection and Analysis ………………………………………………………………………….……….. 10
      Primary Quantitative Data Collection …………………………………………………….………….. 11

      Secondary Quantitative Data Collection ………………………………………………….…………. 12

      Qualitative Data Collection ………………………………………………………………….…………… 12

      Public Input and Distribution …………………………………………………………….……………… 12

The People ……………………………………………………………………………………………….……..………. 13
      Aging ………………………….……………………………………………………………….…………………… 14

      Race, Ethnicity and Growing Diversity ………………………….………….………………………….. 15

      Income …………………………………………………………………………………………………………… 16

      Employment and Benefits ………………………………………………………………………………… 17

      Food Access and Insecurity ………………………………………………………………………………. 17

Our Children …………………………………………………………………………………………………………….. 18
      Premature Births …………………………………………………………………………………………….. 19

      The State of our Children ………………………………………………………………..……………….. 19

      Adverse Childhood Experiences ………………………………………………………………………… 21

Opportunity and Our Health ……………………………………………………………………………………. 23
                 Adult Douglas …………………………………………………………………………. 25

                                                                                                                               2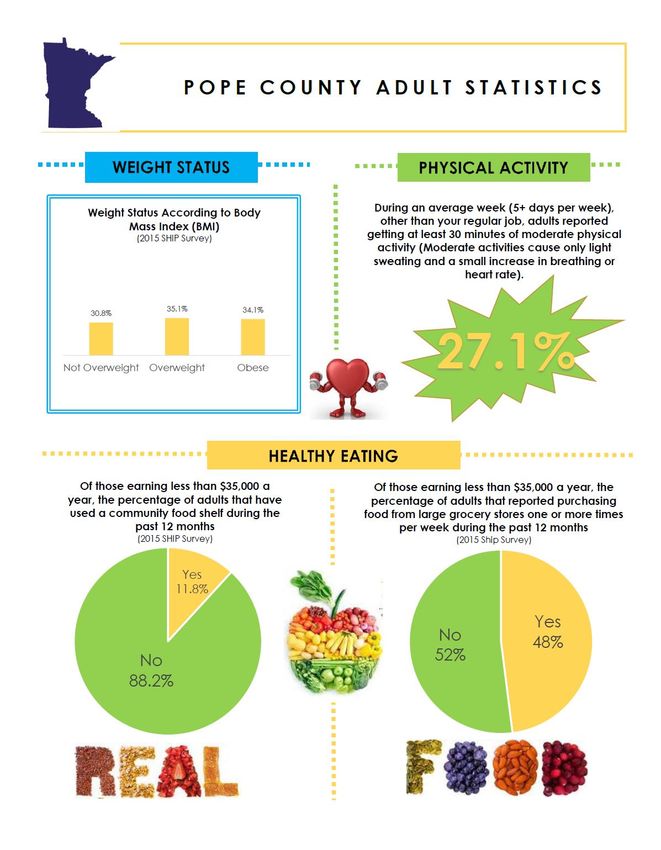
Adult Grant ……………………………….……………………………………………… 27

           Adult Pope ………………………….……………………………………………….…… 29

           Adult Stevens ………….…………………….………………………………….………. 31

           Adult Traverse …………………………………………………………………….…….. 33

           Youth Douglas ……………………………………………………………….………….. 35

           Youth Grant ………………………………………….…………………………………… 37

           Youth Pope ……………………………………………………………….………………. 39

           Youth Stevens ……………………………………………………….…………………… 41

           Youth Traverse ……………………………………………………….………………….. 43

Chronic Disease and Leading Cause of Death …………………………………………………………… 45
     Chronic Disease ……………………………………………………………………………………………….. 45

     Leading Cause of Death …………………………………………………………………………………….. 45

     Heart Disease ……………………………..……………………………………………………………………. 45

     Cancer …………………………………………………………………………………………………………….. 46

     Unintentional Injury ………………………………………………………………………………………….. 46

     Chronic Lower Respiratory Disease …………………………………………………………………….. 46

Belonging and Our Health …………………………………………………………………………………………. 47
Contributing causes of these Health Challenges ………………………………………………………… 48
     Education …………………………………………………………………………………………………………. 48

     Housing ……………………………………………………………………………………………………………. 49

     Child care …………………………………………………………………………………………………………. 50

     Transportation ………………………………………………………………………………………………….. 51

     Violence ……………………………………………………………………………………………….…………… 51

     Public Health Infrastructure ………………………………………………………………………………… 51

Conclusion ……………………………………………………………………………………………..…………………… 53
Attachment A, Community Partnership Team …………………………………………………….……… 54
Attachment B, Community Assets and Resources ……………………………………..…………….… 56
Resources ……………………………………………………………………………………………………………………. 58

                                                                           3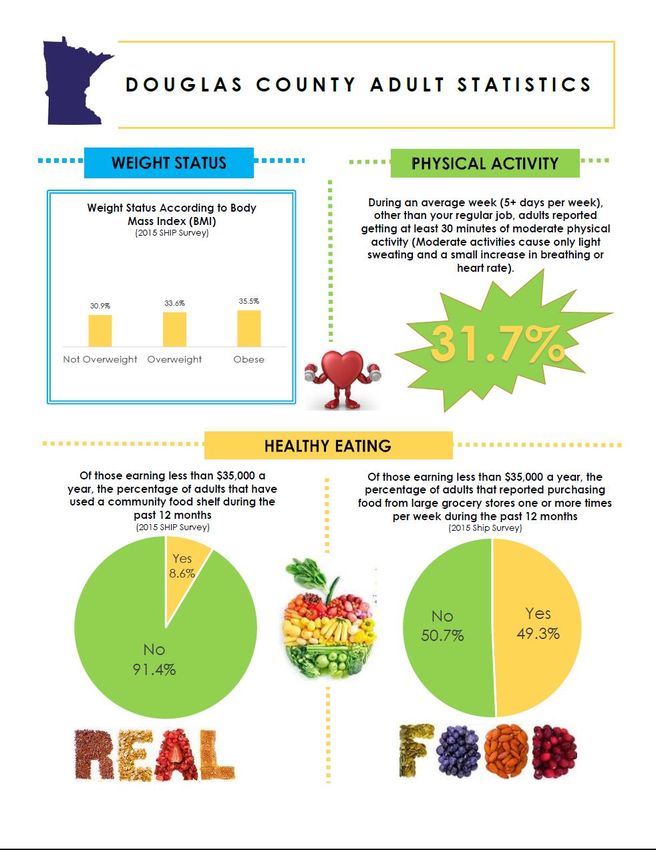
A Message to the Community
Horizon Public Health, in collaboration with multiple community partners, is proud to present
the 2017-2021 Community Health Assessment. This document represents a comprehensive
review and analysis of data regarding health issues and the needs of individuals and
communities throughout the 5-county Horizon Public Health service area, which includes the
counties of Douglas, Grant, Pope, Stevens and Traverse. The Community Health Assessment
also represents the opinions, observations and perspectives of the people that live, work, and
play in our communities.
Partnership and collaboration are the essence of this Community Health Assessment and that is
truly one of the greatest benefits of compiling this report. The process itself allows us to more
closely examine the health status of our population together with our community partners,
residents, businesses and other interested persons in order to determine the priority health
needs within the Horizon service area. Knowing our health priorities, in turn, helps mobilize
organizational and community resources to address these issues.
It is our intent that this Community Health Assessment will provide useful information to public
health officials, health care providers, policy makers, and area organizations, community
groups, and individuals who are interested in improving the health status of the community. By
providing additional insight into our health status, it also has the potential to play a significant
role in influencing our course of action supporting health, wellness and prevention in our
community.
From here, Horizon Public Health, again in partnership with the community, now begins the
process of outlining a Community Health Improvement Plan to address the priority health
issues. The Community Health Improvement Plan will provide a vision and lay the groundwork
for community partners to come together in implementing a systematic approach to addressing
the priority health issues identified in the Community Health Assessment. More importantly,
the Community Health Improvement Plan will provide a foundation to stimulate strategic new
partnerships and collectively, elevate and maximize the health status of all people in our
community.
Please join us in this groundbreaking work as we begin this exciting journey toward better
health!

Together toward better health!
Sandra L. Tubbs, PHN, Administrator
Horizon Public Health

                                                                                                   4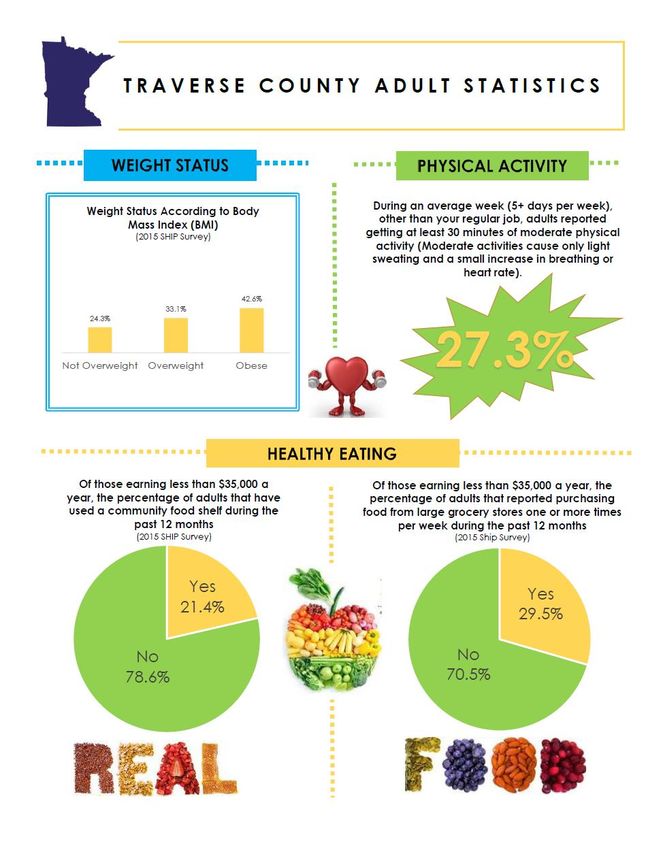
Executive Summary
The Horizon Community Health Assessment is an effort to learn about the people and the
communities within the 5-county Horizon Public Health service area which includes the
counties of Douglas, Grant, Pope, Stevens and Traverse. Beginning in 2017, the Horizon
Community Health Board initiated the process to identify and describe the health of the
community served, the factors that contribute to our health challenges, and the existing
community assets and resources that can be mobilized to improve the community’s health. The
assessment helps ensure that local resources are directed toward those areas where they can
make the greatest and most timely impact. The Community Health Assessment is foundational
to improving and promoting the health of a community.
The Community Health Assessment is a collaborative process involving the systematic collection
and analysis of data and information to provide a sound basis for decision-making and action. It
was conducted in partnership with other organizations and members of the community from
the five-counties. The Community Partnership Team, representing hospitals, school districts,
mental health providers, the Hispanic Community, child care, social services and early
childhood initiatives, among others, met frequently to review and analyze data, hear the results
of key informant interviews and community focus groups, and ultimately to consider the
priority issues impacting our five-counties.
A community-based view of health implies that real health for all individuals can only be
achieved when the community as a whole is healthy. That requires a community that
encourages and supports not only physical health, but economic, environmental, social,
psychological, and political health as well. In this document, you will find a wide array of
indicators and information about the conditions and the factors affecting health, as well as
indicators of health status.

                                                                                               5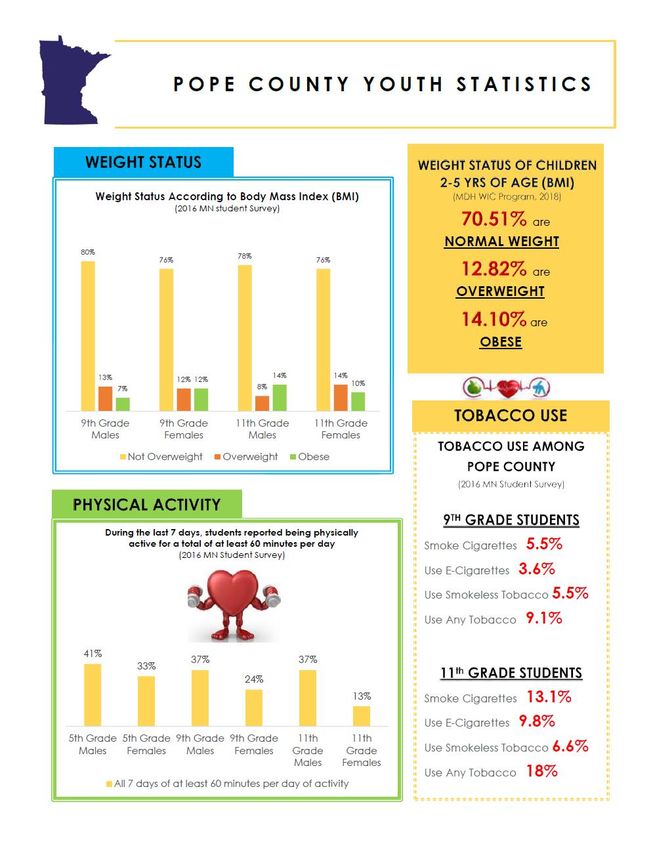
Introduction
What is health?
While we all may have our own personal definition of “health”, the World Health Organization’s
(WHO) definition is often cited when attempting to describe health. According to WHO, health
is “a state of physical, mental and social well-being and not merely the absence of disease or
infirmity”. If we support this definition, then anything and everything in our lives that impacts
our bodies, our minds, our inner beings, and our surroundings has the potential to impact our
health. We can no longer totally support the concept that we are all individually and solely
responsible for our own personal health. Rather, we are all in this together. That is exactly the
definition of public health….” what we do collectively to assure the conditions in which all
people can be healthy”.
As we have collected data and individual and community perspectives about the state of
“health” in the 5 west central counties of Douglas, Grant, Pope, Stevens and Traverse, the same
message resonated again and again. If we are to reach our optimal state of individual health,
then we must join together and take a broad look at our policies, at all of those with whom we
interact, and at all that surrounds us. Only then can we hope to create a community and an
environment that supports a “state of physical, mental and social well-being” for all.
What creates health?
In 2015, the population of the United States spent an estimated $3.2 trillion on health care
costs. However, despite this expenditure, a study by the U.S. National Research Council,
published in 2013, showed that Americans die at a younger age and experience more illness
and injury than people in other developed countries. This confirms that access to health care
alone clearly does not create health.
So, what does create health? During the past two decades, the public health community's
attention has been drawn increasingly to the social determinants of health (SDOH)—the factors
apart from medical care that can be influenced by social policies and shape health in powerful
ways. The World Health Organization's Commission on the Social Determinants of Health has
defined SDOH as “the conditions in which people are born, grow, live, work and age” and “the
fundamental drivers of these conditions.” Our health is affected by many factors such as
genetics, the environment, the existence or absence of relationships and social networks,
where we live, our finances or lack of them, as well as our lifestyle. But while individual
behaviors cannot be overlooked, it is the policies and processes that shape the daily
circumstances of our lives that really creates health.
What is health equity?
By health equity, we mean everyone has the opportunity to attain their highest level of health
and no one is prevented from being healthy by unjust or unfair social policies and practices.
Inequities are created when barriers prevent individuals and communities from accessing these
conditions and reaching their full potential. How do we achieve health equity? We value all
people equally. We optimize the conditions in which people are born, grow, live, work, learn

                                                                                                6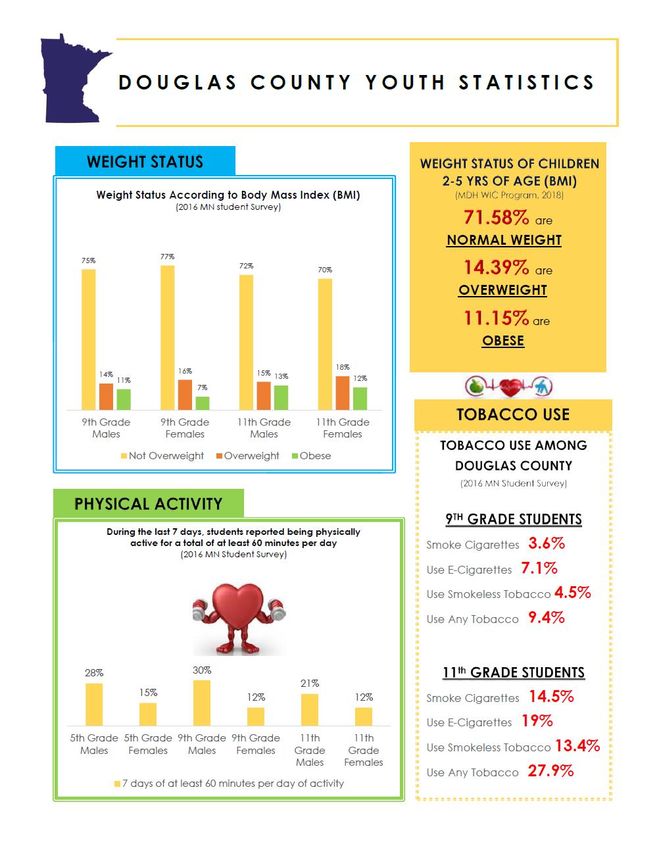
and age. We work with other sectors to address the factors that influence health, including
employment, housing, education, health care, public safety and food access. We understand
that we all share the responsibility of creating healthy communities where everyone can thrive,
instead of each of us being solely responsible for our health. We can only be healthy when the
conditions in our community’s support everyone’s health.

The Community Health Assessment Model, Process and Challenges
The community health assessment model
Preliminary planning for the community health assessment process initially began in the fall of
2016 with exploration of various models commonly used as the framework for community
health assessment. Having reviewed several options, the evidence-based model Mobilizing for
Action through Planning and Partnerships (MAPP) was selected.
This community-driven strategic planning process includes, as its base, four separate but
complimentary assessments:
   1.   Community Health Status Assessment;
   2.   Community Themes and Strengths Assessment;
   3.   Forces of Change Assessment;
   4.   Local Public Health System Assessment.
By completing these assessments, a broad perspective of the people, the environment, the
political and situational influences, and the state and local public health capacity is obtained.
The MAPP process also encourages broad community and stakeholder involvement which
further contributes to the validity and integrity of the assessment, in particular when used to
develop the community health improvement plan. Given some time restrictions and staff
limitations, the Community Partnership Team (CPT) utilized a modified version of the MAPP
model in order to complete the assessment.
The community health assessment process
The 2017-2021 Horizon Public Health Community Health Assessment (CHA) process was
conducted to identify the current state of health, as well as the priority health issues and
challenges facing the community. The community health assessment is a means of learning
more about what factors contribute to good health and those that contribute to poorer health
status for some in the community. It is also a means of identifying areas which present
opportunities for health improvement and the resources that currently exist within the
community to address those opportunities. The process was initiated in January 2017 with the
formation of a 5 county Community Partnership Team (CPT), comprised of community
members, leaders, providers, and partners representing various public and private sectors and
organizations within the five-counties. (Members of the Community Partnership Team and the
organization/sector represented by each team member can be found on Attachment A).
Having previously developed strong cross-sector partnerships through various collaborative
initiatives, the CPT became acclimated to the MAPP model and then quickly moved to the data
collection and analysis phase of the assessment. Learning and working together, the CPT

                                                                                                    7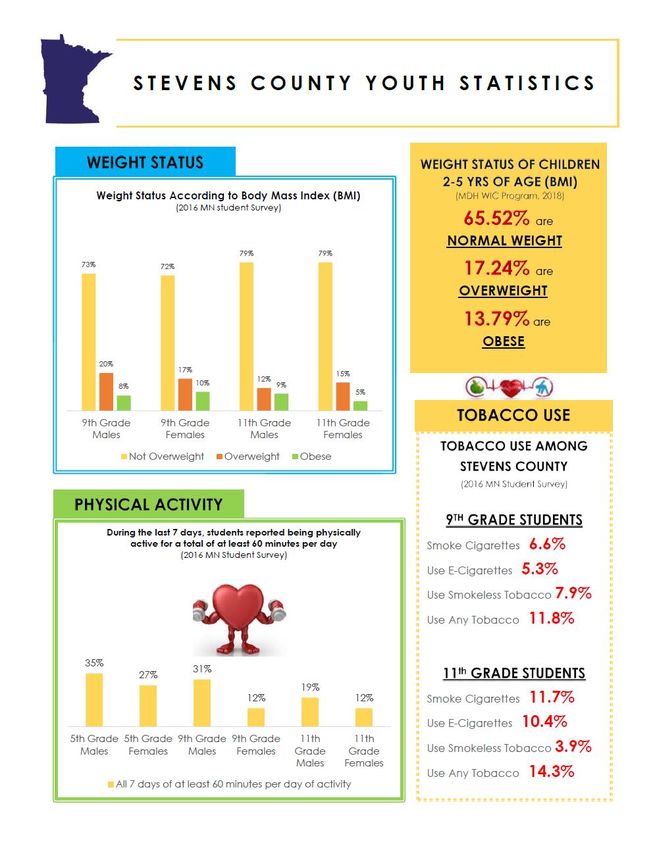
reviewed demographic, socioeconomic, behavioral risk factor, environmental and quality of life
indicators in order to gain a common understanding of the current state of health.
Between January and July 2017, four face-to-face CPT meetings were convened. Due to the
large 5-county geographic area from which the CPT members traveled, the first 3 meetings
were replicated in 2 different locations in order to minimize CPT member travel and maximize
member participation. In addition to the face-to-face meetings, the CPT members received
frequent email communication in which they were provided additional statistical data along
with summaries of key informant interviews, focus groups, and listening sessions that were
conducted in between the face-to-face meetings. By doing so, CPT members were able to
review and gain an understanding of the data prior to the face-to-face meetings. The face-to-
face meeting time could then focus more intently on the data analysis and determination of the
meaning/relevance of the data to the overall community health assessment as well as the
availability of community assets and resources. The final face-to-face meetings of the CPT
brought all members together at a single location in order to complete the two-phase
prioritization process. The first phase of the process involved the use of a multi-voting process
whereby the list of 15 potential community health issues was reduced to the Top Seven:
           o   Lack of adequate and affordable transportation
           o   Drug use
           o   Access to mental health services
           o   Lack of community member engagement
           o   Adverse/negative childhood experiences (ACEs)
           o   Stigma associated with mental health
           o   Lack of adequate and affordable child care
Following the identification of these top seven issues, the Hanlon prioritization method was
then utilized to identify the top two or three community health concerns. The Hanlon method
applies an unbiased, objective perspective using a set of scoring criteria to identify the priority
areas of focus. Upon completion of the Hanlon method, two issues clearly topped the priority
list when the following factors were considered:
           o The Size of the Problem
           o The Seriousness of the Problem
           o The Effectiveness of Interventions/Feasibility/Actionable
Through the use of the two-phase prioritization processes, the community health issues
determined to be of greatest significance and therefore, to be addressed in the Horizon
Community Health Improvement Plan, were Adverse Childhood Experiences (ACEs) and Drug
Use.
The challenges of a community health assessment
Conducting a community health assessment that spans 5 rural counties presents a number of
challenges that may be less significant for a local health department that serves a single county,
such as:

                                                                                                      8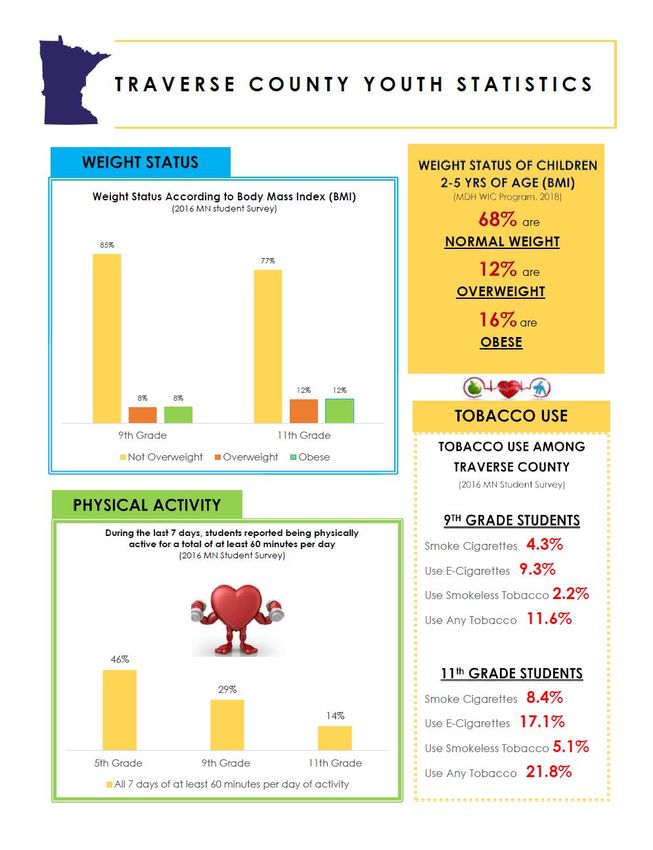
The challenge of a large geographic area –

Horizon Public Health serves a 5-county rural area that spans 2,987 square miles in West
Central MN with the population density ranging from 59.1 per square mile in Douglas County to
5.8 residents per square mile in Traverse County. Travel between county seats can take more
than an hour. This poses a significant challenge when bringing community partners together, as
the travel becomes a barrier to community partner participation. Likewise, conducting
community focus groups or listening sessions can require replicating the same community input
sessions 5 times, once in each county, in order to gather broad community involvement in the
community health assessment process.
The challenge of coordinating the community health assessment with the community health
needs assessments conducted by non-profit hospitals –

Within the 5-county geographic area served by Horizon Public Health, there are 5 local
hospitals, one in each county. Coordination of the community health assessment process with
the non-profit hospitals’ community needs assessment process is both encouraged and desired.
Yet achieving that goal is challenging at best. The largest of the 5 hospitals is a county-owned
facility and therefore not subject to the community needs assessment requirement. Two of the
other hospitals are community-based, and while still required to complete a community needs
assessment, both are on different time schedules and have implemented different processes to
complete their respective needs assessment. The 2 remaining hospitals are owned by much
larger parent organizations that typically dictate both the process and the timeline.
Unfortunately, other than sharing the results of our respective community health assessments,
true coordination of the process has been virtually impossible.
The challenge of data collection –

While data alone cannot fully tell the story of any community, it is a critical element for
informing dialogue among community members, policy makers, and business leaders. Yet the
scope and quantity of data available for analysis as part of the community health assessment
process can be overwhelming. That challenge becomes even more overwhelming when the
county-level data from 5 counties must be compiled and analyzed. In some instances, because
of the very small populations, county-level data is not made available due to the potential for
individual identification. And frequently, because of the significant variation in the populations
of the 5 counties, merging the data into a 5-county composite often does not accurately reflect
the meaningfulness of the data. The implication of this is that the data collection and analysis
process can be excessively time consuming and can reveal conflicting implications and
conclusions from one county to the next.
The challenge of community input –

Bringing the voice of the community to the community health assessment is at the heart of the
process. Yet, this becomes more challenging and time-consuming when soliciting community
input from five different counties with differing perspectives. Whether bringing the Community

                                                                                                 9
Partnership Team together or gathering community input through focus groups, key informant
interviews, or listening sessions, assuring that all voices are heard requires intentionality and
time.
So many issues; so little time and resources –
Through the community health assessment process, many important issues and topics that
influence the health of our communities were revealed and each of them has an impact on a
segment of the population. Yet not every possible issue could be addressed. This community
health assessment provides snapshots of many data points to draw an overall picture of health
and the conditions that create it. It can only say a little, about a lot of topics.
Data Collection and Analysis
Application of the MAPP assessment model is based on partnership and collaboration among all
relevant public health partners, and between the public health system and the community. The
Horizon Public Health Community Partnership Team (CPT) served as the core team of
community partners that were instrumental in conducting the MAPP assessment. The model
applies a 4-pronged assessment process for the collection and analysis of data.
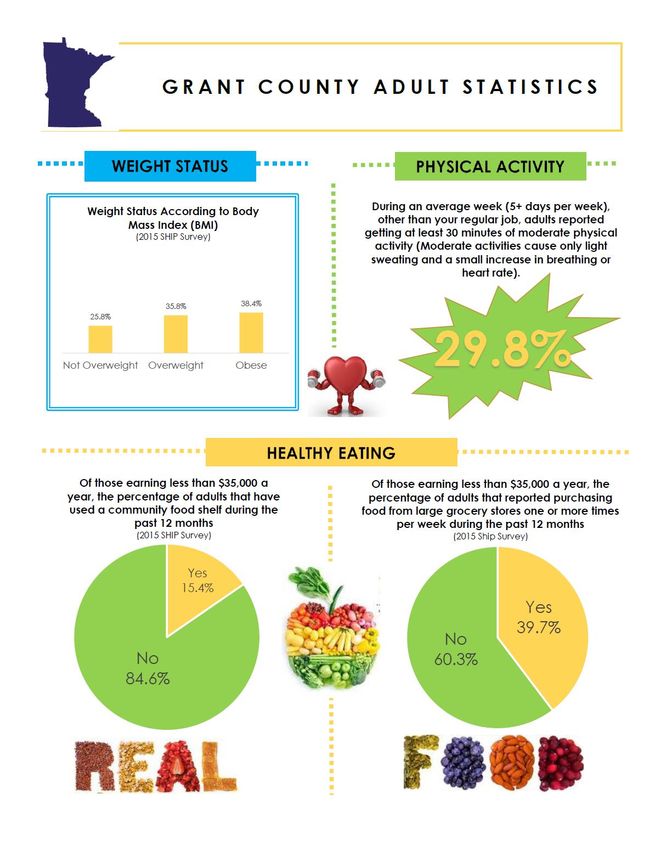
The Community Health Status Assessment identifies priority community health and quality of
life issues. Questions answered include: "How healthy are our residents?" and "What does the
health status of our community look like?" As part of this assessment, the Community
Partnership Team (CPT) reviewed survey data from a 2015 5-county community health survey
conducted by the Horizon Public Health Statewide Health Improvement Partnership (SHIP). The
CPT also reviewed survey responses from the Age Friendly Initiative survey of Douglas County
Seniors conducted in 2016. Along with the public perspective, the CPT reviewed statistical data
from a variety of sources that provided a glimpse at the health status of the community
including demographic data, health behavior data, morbidity and mortality data and
environmental health data.
The Community Themes and Strengths Assessment provides a deeper understanding of the
issues that residents feel is important by answering the questions: "What is important to our
community?" "How is quality of life perceived in our community?" and "What assets do we
have that can be used to improve community health? Together with the results of the 2015
SHIP survey described above, key informant interviews were conducted with representatives of
local social service agencies, area high school counselors, domestic violence advocates, child
care providers, law enforcement officials, early childhood coordinators, and emergency
department managers. A focus group discussion was held with Conexiones, comprised of
members of the Latino community in Stevens County. The CPT reviewed the public input
provided through the surveys and key informant interviews and also conducted an informal
SWOT (Strengths, Weaknesses, Opportunities and Threats) analysis to identify the underlying
strengths and accepted community norms.
The Local Public Health System Assessment (LPHSA) focused on all of the organizations and
entities that contribute to the public's health in the 5-county Horizon Public Health service area.
10The LPHSA is intended to answer the questions: "What are the components, activities,
competencies, and capacities of our local public health system?" and "How are the Ten
Essential Services being provided to our community?" The Local Public Health System
Assessment was conducted by a 7-member subcommittee of the CPT including Horizon Public
Health staff, Community Health Board members, a hospital representative and a representative
from a local mental health provider. Scoring strongest among the 10 essential services was the
system’s ability to diagnose and investigate health problems and health hazards (Essential
Service 2). Ranking least among the essential services was the system’s ability to evaluate
effectiveness, accessibility, and quality of personal and population-based health services
(Essential Service 9) and research for new insights and innovative solutions to health problems
(Essential Service 10).
Finally, the Forces of Change Assessment focused on identifying forces such as legislation,
technology, and other impending changes that affect the context in which the community and
its public health system operate. This assessment is intended to answer the questions: "What is
occurring or might occur that affects the health of our community or the local public health
system?" and "What specific threats or opportunities are generated by these occurrences?"
Along with a brief and informal SWOT analysis conducted by the CPT, the results of the more
extensive Horizon Public Health SWOT analysis conducted as part of its Strategic Planning
process were also reviewed.
Primary Quantitative Data Collection
In 2015, the Horizon Statewide Health Improvement Partnership (SHIP) conducted a community
health assessment survey of the 5-county area. The mailing to 6,883 randomly selected
residents of the 5 counties, consisted of a letter explaining the purpose of the survey,
instructions for which household member was to complete the survey (the household member
with the most recent birthday) and a paper copy of the 56-question survey. Survey participants
received 2 copies of the questionnaire, mailed 1 month apart. Of the 6,883 residents to whom
surveys were distributed, 1,833 surveys were returned for a 26.2 % return rate. The data was
statistically weighted to account for sample design and differential response by gender and age.
In 2016, the survey data was analyzed by the Minnesota Department of Health and the results
of that data analysis were returned to the Horizon SHIP staff, who have shared this data
extensively with the SHIP Community Partnership Team, the Horizon Community Health Board,
and as a vital component of this community health assessment process.
In addition to the 5-county SHIP survey, an aging and disability survey of seniors age 50+ was
also conducted in March of 2016 to explore areas that would improve the health and quality of
life for older adults in the Douglas County area. A total of 548 survey responses were received
via postal mail, representing a response rate of 10.2% from the 50-64-year-old population that
was surveyed, 27.9% from the 65-79 age group, and 23.2% from those age 80 and above.
Finally, the County Case Managers serving the elderly and disabled population throughout the
five-counties distributed surveys to a sampling of the individuals served to gather their
perspectives on the current status of and the unmet needs of the elderly and disabled
population, with approximately 15 responses received.
11Secondary Quantitative Data Collection
Secondary quantitative data was obtained from national, state and local data sources. Data
sources included, but were not limited to, the U.S. Census, Centers for Disease and Control
Prevention (CDC), the Behavioral Risk Factor Survey, Minnesota Department of Health County
Health Tables, the Minnesota Student Survey and County Health Rankings. These data sources
supplemented the primary quantitative data from the 2015 Horizon SHIP survey and the Aging
and Disability Survey of Douglas County seniors to provide a broader picture of the health of
the five-counties served by the Horizon Community Health Board.
Qualitative Data Collection
In addition to the three surveys, the following key informant interviews, open forums, focus
groups and community listening sessions were conducted:
Key Informant Interviews:
o Social Services representatives in Pope and Stevens County
o University of Minnesota Morris Community Engagement Coordinator
o Early Childhood Initiative Director in Grant County
o Center-based Child care Director at YMCA
o Law Enforcement representatives at City and County law enforcement agencies
o Hospital Emergency Room Director in Douglas County
o Inpatient Mental Health and Chemical Health Treatment Program Director
o High school counselors
o Someplace Safe Director in Douglas County
Open Forums:
o Family child care providers attending County Child Care Association meeting
o Region IV Mental Health Consortium “Conversations” group with representatives
from the five Horizon Public Health counties
Focus Groups:
o Conexiones group (Represents the Hispanic population in Stevens County, most
of whom are non-English speaking)
Summaries of those community input interviews and sessions were compiled, presented to the
Community Partnership Team, and analyzed along with the results of the SHIP survey and the
Age-Friendly survey throughout the community health assessment process.
Public Input and Distribution
Public input from the community was encouraged and invited throughout the 6-month
community health assessment process between February and July 2017. The Horizon Public
Health website included announcements of opportunities for public comment along with
instructions and contact information for providing public comment. Community Partnership
Team members were also asked to share the community health assessment data and process
with their respective organizations with an invitation to comment. Upon completion of the
Horizon Community Health Assessment, the document will be available on the Horizon Public
12Health website for public viewing and comment. The finalized community health assessment
document will also be distributed to the members of the Community Partnership Team and to
community partner organizations with whom Horizon Public Health frequently collaborates.
Horizon Public Health will encourage further distribution, as applicable, by Community
Partnership Team members.
The People
Geographically, Minnesota is largely a rural state despite the fact that more than half of the
state’s population resides in the 7-county Twin Cities metropolitan area in the east-central
region of the state. The Horizon Public Health service area reflects much of Minnesota’s rural
geography, encompassing 5 counties, each of which is comprised of many small communities.
It is important to note that the 5-county Horizon service area is not a singular place with a
singular fate but rather a patchwork of numerous different communities, some of which are
agricultural based, and others known as recreational gems.
The 2016 Minnesota population estimates indicates that Horizon Public Health serves an
estimated aggregate population of 67,510 people. By county, the population breakdown is as
follows:
Douglas County - 37,456
Grant County - 5,956
Pope County - 11,049
Stevens County - 9,693
Traverse County - 3,356
Total 5-county population – 67,510
Source: Minnesota County Health Tables, 2016
And while there has been a slow growth in the 5-county total population between the Census
periods in 2000 and 2010, this increase was not experienced equally by all 5 counties. Douglas
County’s population reflected a 9.7% growth over that 10-year period, significantly more than
Minnesota’s 7.8% increase. However, the remaining four counties actually experienced
population decreases ranging from 2.1% to 13.9%. This shifting population landscape causes
uncertainty in terms of a community or county’s ability to attract and retain working age adults,
preserve its community vitality and maintain a thriving (or stable) economy.
It is also important to look at future population projections. The following chart projects the
total population of the five individual counties from 2015 to 2045, reflecting a very modest gain
in population of 1,918 people over the next 3 decades. However, as the graphs below indicate,
while the total population projections show a slow increase up until the year 2030, there is a
13subsequent decline in population following 2030 resulting in nearly steady population
projections over the next 30 years.
Horizon Public Health Service Area's Projected Population
72500
72000
71500
71000
70500
70000
69500
69000
68500
68000
67500
67000
2015 2020 2025 2030 2035 2040 2045
Population
Source: MN State Demographic Center, 2014
The Aging of the People
According to the 2016 Minnesota County Health Tables, there are 1,175,263 people 60 years of
age or older living in Minnesota, equivalent to 21% of the state’s population. The over-60
population distribution for the 5 individual Horizon counties in 2016 is displayed on the graph
below. When comparing the Horizon service area counties to the state of Minnesota, the
population age 60 and older is substantially higher, with 29% of the current population over 60
years of age. Communities with aging populations will be confronted with challenges, as well as
opportunities to identify innovative approaches to meet the unique and diverse needs of aging
Minnesotans.
Percentage of People 60 years of age and older,
2016
40%
35%
30%
25%
20%
15%
10%
5%
0%
Horizon Douglas Grant Pope Stevens Traverse State of MN
Source: MN Health Statistics, 2016
14The Race, Ethnicity and Growing Diversity of the People
Once a very demographically homogenous state, Minnesota’s racial and ethnic diversity is
increasing rapidly in some areas as can be identified by the table below. While Minnesota is
still far from the most diverse state in the United States, recent trends indicate this may be
changing. In Minnesota, more than 80% of the population is comprised of a non-Hispanic white
population. However, between years 2000 to 2014, the non-Hispanic white population grew by
only 2% (107,000 people) while the combination of all other populations of color grew by 74%
(430,700 people).i
Shown below is a table that lists the populations of certain ethnicities as a proportion of
Minnesota’s and the 5-county area’s total population (County Health Rankings, 2015).
In Minnesota, 81.4% of its population is classified as White, while the five Horizon counties all
show more than 94% of their populations classified as White. Stevens County has the highest
percent of Black or African Americans, Asian, Hispanic or Latino Origin, and Native Hawaiian
and Other Pacific Islander population when compared to the other four counties. However,
much of this increased racial diversity can be linked to the presence of the University of MN
Morris campus, which attracts students and faculty from across the state. Traverse County has
the highest percentage of American Indian or Alaskan Native residents.
Minnesota Douglas Grant Pope Stevens Traverse
White 81.4% 98.8% 98.8% 98.2% 95.0% 94.8 %
Black or African American 5.7% 0.9% 0.2% 0.8% 1.3% 1.0%
American Indian or Alaskan Native 1.3% 0.6% 1.3% 0.6% 2.3% 6.1%
Asian 4.7% 0.7% 0.5% 0.6% 2.2% 0.5%
Hispanic or Latino Origin 5.1% 1.3% 1.8% 1.1% 4.1% 2.0%
Native Hawaiian and Other Pacific
0.1% 0% 0% 0% 0.2% 0%
Islander
Source: County Health Rankings, 2016
Probably the greatest growth among minority populations in the Horizon region is a result of
the influx of Latino individuals and families. This is increasing the diversity of the Horizon
communities, as families are immigrating to West Central MN to work within labor industries in
the 5-county area or joining other family members who previously immigrated. Still others are
moving to West Central MN to attend school. Even though Douglas County has the largest
number of Latino residents, Stevens County has, by far, the highest percentage out of the total
population as shown in the graph below.
15Horizon Communities Latino Population
4.5%
4.0%
3.5%
3.0%
2.5%
2.0%
1.5%
1.0%
0.5%
0.0%
Douglas Grant Pope Stevens Traverse
Source: County Health Rankings, 2015
Income
Minnesota has a much higher median income when compared to the Horizon service area,
which is not surprising given that the more populous metro areas typically have higher incomes
which may drive the statewide average up.
Household median income in MN and the Horizon area
Adjusted to 2016 dollars
$70,000
$60,000
$50,000
$40,000
$30,000
$20,000
$10,000
$0
Douglas Grant Pope Stevens Traverse State of MN
Source: US Department of Commerce, Bureau of Economic Analysis
Nonetheless, the disparity in median income impacts all aspects of the lives of those living in
the Horizon service area. In a January 2017 report issued by the Minnesota State Demographic
Center, Greater Minnesota: Refined and Revisited, researchers found that rural, small town and
large town residents who work a full-time schedule are 2 or more times more likely to live in
poverty than urban residents who do so.
Poverty decreases opportunities in education, employment and living conditions. It can
significantly increase obesity rates by forcing individuals and families to rely on less expensive
sources of food, which tend to be high in calories and low in nutritional value.
16Employment and benefits
The average annual unemployment percentages in the Horizon service area do vary. Grant
County has the highest annual unemployment rate of the 5 counties at 4.9% in 2015, which was
down from 8.8% in 2008. Stevens has the lowest annual unemployment rate with just a 3.2%
annual unemployment rate in 2015, down from 5.6% in 2008. Overall, unemployment rates
have gone down in all five-counties when compared with 2008 rates.
Percent of Individuals Unemployed in Horizon and MN, 2015
6%
5%
4%
3%
2%
1%
0%
Douglas Grant Pope Stevens Traverse State of MN
Source: Minnesota Department of Employment and Economic Development
Food Access and Insecurity
Hunger is a significant problem that exists in pockets throughout the five-counties. This is
evidenced by the high demand for food packages at the United Way Mobile Food Drops, county
food shelves, the school-based food shelves that have been established in a number of area
schools and the high usage of the “Back Pack Attack” programs, which provide supplemental
food packages for children over the weekend.
In addition to the problem of food shortages, the lack of access to affordable, nutritious, and
culturally appropriate foods in underserved and low- and moderate income communities, also
known as “food deserts” exist in the Horizon service area. Grant County contains a sizable food
dessert which engulfs over half of its square miles. The US Department of Agriculture has
identified the existence of these food deserts, which are shown in the map below:
Source: USDA Food Access Research Atlas, 2015
17Our Children
Early childhood is a critical time to maximize the opportunity for a healthy future. Access to
and utilization of prenatal care helps to ensure healthy pregnancy outcomes by preventing
premature births and low birth rates, both of which can contribute to infant mortality and high
costs of care. The concept of prenatal care encompasses several measures including discussing
a mother’s healthy choices and body changes; prenatal testing and counseling; treating
potential medical complications such as gestational hypertension, diabetes and anemia;
promoting optimal weight gain; testing for sexually transmitted infections; oral health
assessment and treatment; and maternal mental health and substance abuse screening. Below
are statistics that show the percentage of adult’s women receiving prenatal care in the first
trimester. Overall, the percentages have consistently exceeded 80%, with the exception of
Traverse County, which has had significant fluctuations, likely due to the very, very small
number of births per year. Notwithstanding Traverse County, the remaining four Horizon Public
Health counties have prenatal care rates above the MN State average.
Percent of mothers receiving Prenatal Care in the 1st Trimester (2012-2016)
State of Minnesota – 78.6%
Douglas County – 90.0%
Grant County – 85.4%
Pope County – 85.6%
Stevens County – 88.3%
Traverse County – 59.6%
Source: Minnesota Department of Health Vital Statistics Trend Report
Each year, approximately 3,792 births occur in the Horizon Public Health service area. Of those
births, the vast majority occur to women residing in the Douglas County area.
Number of live births
2,500
2,000
1,500
1,000
500
0
Douglas County Grant County Pope County Stevens County Traverse County
Source: Minnesota Department of Health Vital Statistics Trend Report
18Premature Births
Premature births can occur as a result of many different factors. However, premature birth
factors may increase for women who are pregnant with more than one child, have poor
nutrition, have certain health conditions such as high blood pressure and diabetes, as well as if
they have had physical injury or trauma. Premature births are births that occur prior to 37
weeks of pregnancy, with the normal duration of pregnancy being between 37 and 40 weeks.
The results of premature births can lead to both short and long-term health issues. These
conditions can cause chronic health conditions, as well as an increased likelihood for behavioral
and psychological problems.ii
The graph below indicates the percentage of premature births in Minnesota and by county. As
the graph indicates, there is a fairly consistent percentage of premature births for the Horizon
service area with only a slight increase from the 2007-2011 time span to the 2012-2016 time
span. Despite significant fluctuations in Grant and Traverse Counties due to the very small
number of births each year, between 2012 and 2016, all five of the counties had premature
birth rates that were fairly consistent with the statewide average.
Percentage of premature births in Minnesota and Horizon
(5 county radius)
8%
6%
4% Horizon
Minnesota
2%
0%
1997-2001 2002-2006 2007-2011 2012-2016
Source: Minnesota Center for Health Statistics, 2017
The State of our Children
One in every five Minnesota families with children has at least one child with a special health
need. Estimates of children with special health needs in Minnesota range from 160,000 to
200,000. Children and youth with special health needs are those who have, or who are at
increased risk for, a chronic physical, developmental, behavioral, or emotional condition. They
also require health and related services of a type or amount beyond that generally required.
This definition is purposely broad, inclusive, and not condition specific. It recognizes that all
children and youth with special health needs, regardless of their condition, require a well–
functioning, community–based system of resources to reach their full potential.
The KIDS COUNT Data Center contains more than 100 measures of child well-being at the
national, state, and county level. The table below compares the 5 Horizon counties to the State
19of MN for a subset of those measures and provides an overview of the state of well-being of
children residing in the Horizon Public Health service area.
Douglas Grant Pope Stevens Traverse
MN County County County County County
Demographics 2015
Total Child Population 1,282,412 7,773 1,274 2,270 2,057 687
Child Population as a % of Total Population 23% 21.2% 22.0% 20.9% 23.3% 20.8%
Economic Well-Being
% of children living in poverty, age 0-17 13.0% 11.4% 15.1% 13.0% 8.6% 22.7%
% of students receiving free/reduced-price
37.6% 30.1% 35.6% 31.0% 27.7% 48.5%
lunches
# of mothers and children receiving WIC 167,796 879 212 290 235 73
% of children without health insurance (ages
3.0% 2.8% 4.3% 4.2% 3.0% 5.3%
0 – 19)
Median household income $63,459 $56,819 $50,570 $53,267 $54,323 $46,764
Education, Grades K - 12
# public school enrollment K-12 855,867 5,346 1,073 1,316 1,544 536
% of limited English proficient (LEP) students 7.9% 0.4% 0.5% 0.5% 2.5% 0.7%
% of special education students 13.5% 15.5% 13.7% 21.3% 16.0% 20.7%
% of public school student dropouts 5.5% 8.0% 2.8% 3.7% 1.7% 4.3%
Safety
Child abuse and neglect rate per 1,000 4.6 11.9 6.9 7.4 2.4 4.3
Child out-of-home placement rate per 1,000 10.6 9.4 6.9 19.6 7.2 21.4
Children arrested for a serious crime rate per
11.1 14.0 3.5 4.8 1.2 0.0
1,000
Kids Count Minnesota: 2017 Fact Sheet
20You can also read