Impact of Weight Reduction Measures on Obesity Reduction - The Case of Canada
←
→
Page content transcription
If your browser does not render page correctly, please read the page content below
Athens Journal of Health & Medical Sciences - Volume 8, Issue 1,
                               March 2021 – Pages 25-52

       Impact of Weight Reduction Measures on Obesity
               Reduction - The Case of Canada
          By Stavroula Malla*, Solomon Akowuah± & K. K. Klein‡
      Obesity, and its related comorbidities, has become a pressing global health concern.
      This study follows an integrated approach of evaluating the health-related cost savings
      associated with the reduction of obesity incidence in Canada. A combination of meta-
      analysis and simulation using measured nationwide Body Mass Index data revealed that
      a reduction in calorie intake could lead to a 5% to 10% weight loss, which could result
      in a nontrivial health-related average savings of CAD$ 1.93 billion. This can be
      potentially achieved through the implementation and promotion of health-claims on low-
      calorie diets. Stronger economic policies such as the introduction of subsidies on healthy
      foods and taxes on high calorie diets could potentially lead to socially optimal calorie
      consumption. A combination of initiatives and regulatory policy options are also
      discussed, which could stimulate prosperity by reducing the obesity epidemic.

      Keywords: obesity, prevalence, meta-analysis, cost of illness approach, health-claims,
      regulatory policies

Introduction

      Obesity is one of the biggest drivers of preventable chronic diseases and
healthcare costs worldwide. More than 2.1 billion people, or almost 30% of the
global population are overweight or obese (Ng et al. 2014). The obesity issue is
likely to worsen if the current trend continues—by 2030 it is estimated that almost
half of the world’s adult population will be overweight or obese (Kelly et al.
2008). In 2016, total health expenditure in Canada was about $228 billion, or
$6,299 per person, representing 11% of Canada’s GDP (CIHI 2017). It is no doubt
that this crisis is not just a pressing health concern but also a threat to the global
economy, and it requires immediate attention. This paper quantifies the potential
benefits arising from the reduction of obesity incidents, potentially from weight
reductions measures. The paper also attempts to analyse the potential benefits of
obesity interventions measures like health claims on food products. The analysis
provides context for a discussion of the potential regulatory policies and initiatives
to address the obesity epidemic.
      The increasing health care cost burden, morbidity rates, and mortality rates in
Canada and other developed countries resulting from preventable diseases are a
cause for great concern (CIHI 2013, WHO 2003). A significant number of these
preventable health risk diseases are diet related. As a result of changing dietary and
lifestyle patterns, certain diseases like obesity, hypertension, diabetes mellitus,

*
  Associate Professor, Department of Economics, University of Lethbridge, Canada.
±
  Professional Affiliate, Department of Economics, University of Lethbridge, Canada.
‡
  Professor, Department of Economics, University of Lethbridge, Canada.

    https://doi.org/10.30958/ajhms.8-1-2                           doi=10.30958/ajhms.8-1-2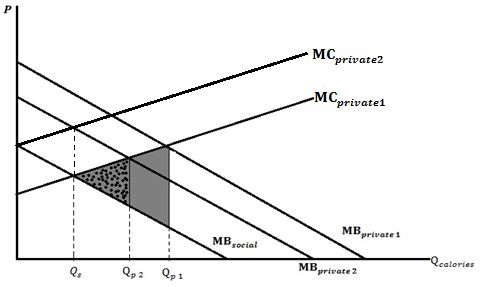
Vol. 8, No. 1             Malla et al.: Impact of Weight Reduction Measures on Obesity…

cardiovascular disease (CVD), and many others have become increasing causes of
disability and premature deaths (WHO 2003).
     Mounting evidence on awareness of the strong correlation between diet and
health, coupled with increasing cost of health care in Canada have kindled interest
in functional foods (Malla et al. 2013)1. Governments, policy makers, and interest
groups are now focusing attention on the promotion of functional foods (Health
Canada 2009). Health Canada has approved the use of 16 health claims on
functional foods and food products since the year 20002. For example, in 2014
Health Canada approved a health claim that consumption of ground whole
flaxseed would lower blood cholesterol3. It has been shown that excess
consumption or absence of certain vital nutrients in our daily diets is the main
cause of most of the preventable diseases (Health Canada 2012). Obesity, which is
a preventable health risk disease, has been shown to be a major public health issue
in Canada (e.g., Godin et al. 2015, Katzmarzyk et al. 2001, Roberts et al. 2012).
Increased calorie consumption is positively associated with obesity (e.g., Fontana
et al. 2007, Redman et al. 2007). Cutler et al. (2003) suggested that increasing
obesity incidence in the U.S. could be attributed to increased caloric intake.
     Obesity has been shown to be a primary risk factor to quality of life in terms
of morbidity and mortality (e.g., Edwards 2007, Katzmarzyk et al. 2001). Studies
have also shown that obesity is the major risk factor for diseases such as heart
disease and diseases of pulmonary circulation, cancer, cerebrovascular diseases
(such as hypertension and stroke), and diabetes (e.g., Alter et al. 2012,
Birmingham 1999, Tan 2011). Luo et al (2007) estimated the number of deaths
due to obesity in Canada in 2004 to be 8,4144. Katzarzyk (2001) estimated that
13.5 percent of the deaths recorded in Canada in 2001 could have been avoided in
the absence of obesity.
     Birmingham (1999) estimated that the direct cost of obesity in Canada in
1997 to be $1.8 billion, a figure representing 2.4 percent of the total health care
expenditure in that year. In 2005, the total cost of obesity was $4.3 billion (Public
Health Agency of Canada 2009). In 2008, the cost of obesity was estimated to be
$4.6 billion (Public Health Agency of Canada 2011). This figure is regarded as a
very conservative estimate since only eight of the diseases closely linked to
obesity were taken into consideration. In 2006, a similar study that included the
costs of 18 chronic diseases closely linked to obesity, found the total cost of
obesity to be about $7.1 billion (Public Health Agency of Canada 2011). The rate

1
 See Hobbs et al. (2014) for in-depth analysis and discussion of functional foods across a
number of countries.
2
 The generally accepted definition of health claims in Canada is "any representation in
labelling or advertising that states, suggests, or implies that a relationship exists between
consumption of a food or an ingredient in the food and a person's health" (Health Canada
2012).
3
 For more details and complete list of approved health claims in Canada, see http://hc-sc.gc.ca/
fn-an/label-etiquet/claims-reclam/assess-evalu/index-eng.php.
4
 It is important to note that there is a significant difference between the methods used in both
years so care must be taken when comparing the year 2000 figure to the 2004 figure. For
example, while the 2004 study was based on all adult deaths, the 2000 study was based on
deaths up to 65 years.

                                              26
Athens Journal of Health and Medical Sciences March 2021
of increase in health care expenditure in Canada was 7 percent per year from 2000
to 2010 (CIHI 2013). With continuous increases in health care costs, morbidity
and mortality, it is important to put in place measures that minimize—if not
eliminate—the incidence of obesity in Canada.
Several clinical studies have assessed the effects of calorie restriction on
human body composition and weight using mainly controlled trials.5 Other studies
have assessed the effects of measures like investments in research and
development (R&D), subsidies and taxes on obesity incidence (e.g., Alston et al.
2013, Cash et al. 2005, Leicester and Windmeijer 2004, Rickard et al. 2013,
Mytton et al. 2007, Tiffin and Arnoult 2011). Although some studies have assessed
the effects of health claims on other diseases like cholesterol levels and coronary
heart disease (CHD) (e.g., Malla et al. 2016), a lot still remains to be done on the
direct impacts of government-regulated health claims on obesity incidence in
Canada.
It is important to empirically examine the effects of calorie restriction on
obesity incidence using actual nationwide Body Mass Index (BMI) data, and
further calculate the associated health-related cost savings. This study uses an
integrated approach to examine the effect of calorie restriction on obesity/
overweight prevalence and the associated health care savings and related
regulatory policies. In addition, this study analyses how implementation of
government policies and regulations could help reduce obesity incidence, thereby
resulting in a reduction of health care expenditures in Canada. Several other policy
options and their implications are discussed.
The paper begins by describing the current situation with respect to regulatory
policies and obesity, including discussion of functional foods, health claims, and
consumers’ responses. Estimates are made of the potential savings in health-
related costs from potentially allowing health claims on low calorie diets and
obesity. The analysis features a set of scenarios (base, low, and ideal) with
different assumptions about weight loss, health impacts, and the relationship
between obesity prevalence and health costs. These scenarios provide insights into
the relative magnitude of potential health benefits, and explore the sensitivity of
the results to key assumptions. A discussion of policy implications closes the paper.
This integrated approach allows us to systematically, consistently, and broadly
analyse the issue of obesity and make policy recommendations that could
significantly contribute to the reduction of the obesity epidemic. The study uses
available Canadian data, but the findings are applicable to other constituencies as
well. As former World Health Organization (WHO) Director-General Margaret
Chan noted: "Not one single country has managed to turn around its obesity
epidemic in all age groups" (WHO 2013). Obesity has become a big public health
problem worldwide, a crisis that is not just a pressing health concern but a threat to
the global economy as well. Hence, tackling obesity requires more sustainable
5
For example, Civitarese et al. 2007, Colman et al. 2009, Fontana et al. 2004, Fontana et al.
2007, Guarente and Picard 2005, Heilbronn et al. 2006, Kok et al. 2005, Larson-Meyer et al.
2006, Racette et al. 2006, Redman et al. 2007, Redman et al. 2009, Villareal et al. 2006, Weiss
et al. 2007.
27Vol. 8, No. 1 Malla et al.: Impact of Weight Reduction Measures on Obesity…
obesity related research and policy analysis as well as a coherent, sustained
portfolio of initiatives, potentially implemented on a large scale.
Regulatory Policies and Obesity
Functional Foods and Health Claims
Health Canada acknowledges that diets can alter one’s risk of developing or
aggravating certain chronic health conditions (Health Canada 1998). The
increasing economic burden of some diet related preventable diseases and the
mounting evidence of the strong correlation between diet and health have attracted
several policy responses from the government and other stakeholders (Health
Canada 1998). Such responses have included mandatory nutrition labelling and the
promotion of functional foods and health claims. Functional food consumption has
the potential to improve well-being and reduce health care cost. There is no
generally accepted definition for functional foods around the world. However,
Health Canada (1998) defines functional food as "a food similar in appearance to,
or may be a conventional food, is consumed as part of a usual diet, and is
demonstrated to have physiological benefits and/or reduce the risk of chronic
disease beyond basic nutritional functions"6.
Great efforts are being made to create awareness of the benefits of the nutrient
content of foods such as the use of health claims. The main aim of these measures
is to facilitate healthy eating choices that will, in the long run, translate into a
healthier population and a reduction in steadily increasing health care costs (Malla
et al. 2013).
A health claim on foods establishes a relationship between good health and
the consumption of a food or food product. The generally accepted definition of a
health claim in Canada is "any representation in labelling and advertising that
states, suggests, or implies that a relation exist between the consumption of food or
food constituent and health" (Health Canada 2012). According to Health Canada,
health claims can take two main forms: generic claims and product specific
claims7. Health Canada categorizes health claims into four main groups8:
therapeutic, disease risk reduction, functional claims, and general health claims9.
The Food and Drug Act governs health claim usage on food and food products.
Before a new health claim is approved and allowed to be used, a petitioner must
apply to Health Canada and provide scientific evidence backing the claim. The
evidence submitted by the petitioner is evaluated using three main criteria:
causality, generalizability, and quality assurance (Health Canada 2009). The
6
An example of a functional food is food high in fibre, which is noted for reducing one’s risk
of developing certain types of cancer.
7
Generic claims can be used on any food item—if the item meets the criteria set out for the use
of that claim—while product specific claims cannot be used for any food unless that specific
food carrying the claim has undergone registration and enough supporting evidence has been
provided.
8
For more detailed discussion please see Hobbs et al. 2014.
9
Functional claims were formerly known as structural/functional claims.
28Athens Journal of Health and Medical Sciences March 2021
causality criterion requires applicants to provide evidence establishing that the
consumption of the food influences health outcomes. This is done mostly by
providing human-based studies that establish a clear link between the consumption
of the food and health. The generalizability criterion requires that the claim must
be meaningfully generalizable to the broader population or a segment of the
population. Lastly, the food on which the claim is used must conform to quality
standards. If the claim is on a novel food, then a separate application for the novel
food must be submitted either prior to, or with, the health claim application
(Health Canada 2009)10. It is important to note that health claims that place the
food under the definition of a drug needs pre-market approval and a regulation
amendment (Health Canada 2009).
Health Claims and Consumer Responses
We begin by establishing a link between the use of health claims and the
consumption of healthy diets. Specifically, we assert that the introduction of a
health claim on low calorie diets and reduction in obesity will significantly
encourage the consumption of low-calorie diets and discourage the consumption
of high calorie diets. This assertion is based on the findings from numerous
scientific/nutrition studies that suggest a strong correlation between the
consumption of healthy (i.e., low calorie) foods and improved health; and, also,
the findings from a comprehensive review of studies on health claims and
consumer demand. In 2002, a joint WHO and FAO expert consultation on Diet,
Nutrition and the Prevention of Chronic Diseases identified diet and lifestyle
changes to be significantly related to the increasing epidemic of chronic diseases
in the world (WHO 2003). Per the consultation, not only will changes in one’s diet
affect a person’s present health conditions, it will also affect that person’s future
chances of developing any of the chronic diseases (like cancer, diabetes, etc.).
Health claim usage has been shown to significantly improve the
understanding of the relationship that exists between diet and health (e.g.,
Barreiro-Hurlé et al. 2010, Williams 2005). Several studies found that consumers
value health claims and health information that link the consumption of healthier
foods or food constituents to reduced risk of certain diseases (e.g., Brown and
Schrader 1990, Levy and Stokes 1987, Moon et al. 2011, Williams 2005). In
addition, evidence suggests that consumers are willing to pay price premiums for
the benefits they derive from healthy or health-enhancing food products (e.g.,
Barreiro-Hurlé et al. 2008, Larue et al. 2004, Marette et al. 2010, Maynard and
Franklin 2003, Milligan et al. 2010, Teratanavat and Hooker 2006, West et al.
2002). The paragraph below provides evidence of instances where the
introduction/promotion of health information/health claims resulted in an increase
(decrease) of healthy (unhealthy) food products.
Ippolito and Mathios (1991) examined the market of ready-to-eat cereals for
the periods preceding and after a ban on health claims usage on cereal products in
10
According to Health Canada novel foods are foods that have been produced through new
processes, that do not have a history of safe use as a food, or that have been modified by
genetic manipulation (Health Canada 2020).
29Vol. 8, No. 1 Malla et al.: Impact of Weight Reduction Measures on Obesity…
the US. The authors found that in addition to the improvement of consumer
awareness of the link between fibre consumption and development of cancer, there
was a significant increase in fibre cereal consumption after the ban on the health
claim was lifted. There was a significant shift of market share towards high-fibre
cereals when health claim usage was allowed11. Lalor et al. (2011) examined how
health claims on foods influence peoples’ reactions towards those foods. It was
observed that health claims had a significant impact on the purchasing power of
the elderly, women with young children, and people with close friends/relatives
suffering from certain diseases. Aschemann-Witzel and Hamm (2010) found that
consumers preferred food products with health claims and nutritional information
to those without. Consumers who purchased food products with health claims
perceived the food to be much healthier than similar foods without health claims.
Levy and Stokes (1987) empirically examined the influence of a claim linking the
consumptions of foods rich in fibre and the prevention of certain types of cancer.
Findings from the study suggested that Kellogg Company’s campaign to promote
the health claims led to a significant shift in market share from non-high fibre
cereals to high-fibre cereals12. Brown and Schrader (1990) used a cholesterol
information index to assess the impact of cholesterol information on the demand
for shell eggs in the US13. Cholesterol information led to a decrease in per capita
shell egg consumption from 16% to 25%. A positive interaction was observed
between egg price and cholesterol, which suggested a reduction in absolute price
elasticity of shell eggs resulting from availability of cholesterol information.
Kozup et al. (2003) argued that health claims can have a significant impact on
product attitudes and purchase intentions even in the absence of nutritional
information and suggested that if health claims can be justified, their usage could
be very beneficial to restaurants.
Although the studies discussed above provide evidence of a significant link
between health claim usage and foods that carry the claim, it must be noted that
having the health claims alone might not necessarily yield the required results. It is
necessary that the claims have the endorsement of a trusted authority like the
government (Wansink and Cheney 2005). Furthermore, the success of the health
claim also depends on specific efforts aimed at promoting the awareness of the
claim—the link between good health and consumption of the foods that carry the
claims (Aschemann-Witzel and Hamm 2010).
Considering obesity, mounting evidence suggests that there is a strong link
between calorie restriction and weight loss (e.g., Fontana et al. 2007, Redman et al.
11
Weighted fibre content increased by 7% after the health claim was allowed (i.e., an increase
from 1.64 grams per ounce in 1978–1984 to 1.75 grams per ounce in 1985–1987).
12
There was a progressive increase in the market share of high-fibre cereals during the entire 48
weeks of assessment. Twenty-four weeks into the campaign, there was also a sharp increase in
the market share of Kellogg company’s All-Bran product (which is very rich in fibre). An
increase of market share from 0.99% to 1.46% was recorded (i.e., representing a relative
increase of 47%). The sales of other high-fibre products of Kellogg Company rose by 0.3%,
which represented a relative increase of about 14%.
13
The study defined cholesterol information as the relationship between the presence of
cholesterol in diet and the development of arterial diseases—diseases associated with high
blood cholesterol.
30Athens Journal of Health and Medical Sciences March 2021
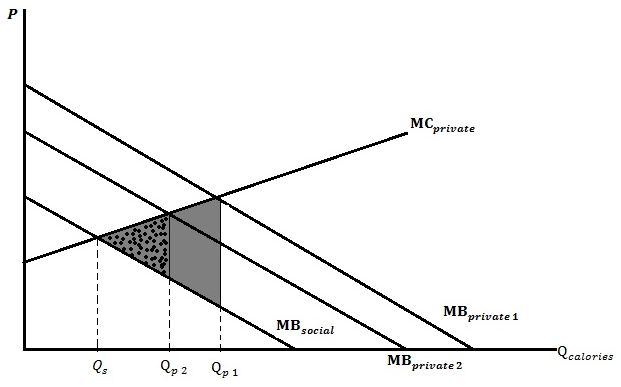
2007, Redman et al. 2009, Weiss et al. 2007). Figure 1 graphically depicts the
impact of health claims on the consumption of unhealthy diets— in this case the
consumption of high calorie diets. The publicly funded nature of the health care
system in Canada and many other countries leads to a moral hazard problem
whereby individuals might not make private diet choices that are socially optimal
as the consequences of such poor diet choices are borne by others. This implies
that people might tend to under-consume healthy foods and over-consume
unhealthy foods. A negative externality is created when an individual or group of
people making poor diet choices fails to fully pay for the cost of their actions
(Alston et al. 2012, Elston et al. 2010, Strand 2005). According to Elston et al.
(2010), a significant portion of the expenditure on publicly funded health
insurance programs goes towards obesity related costs.
Figure 1. Impact of Health Claims on the Intake of High Calorie Diets
Information asymmetry
Health care externality
Source: authors’ calculation.
The health benefits from functional foods cannot be easily evaluated by
consumers without labelling. In the absence of health information on food products
that inform consumers of the benefits or dangers of the nutritional contents of
foods, individuals have less incentive to make socially optimal diet decisions.
Consumers might not even know the health benefits/costs of the food. Individuals
might consider only the immediate satisfaction ( ) derived from making
such diet choices (consumption of high calorie diets) without having full
information of the benefits/costs associated with the food. Studies suggest that
some consumers might not act rationally in their diet choices since they place
more importance on the satisfaction they get from excess calorie consumption and
neglect the long-term implications on their health (Ananthapavan et al. 2014,
Alston et al. 2012, Efrat and Efrat 2012, Swinburn, et al. 2011, Cawley 2010,
Moodie et al. 2006). Loewenstein et al. (2007) and Alston et al. (2012) suggest
that individuals place higher weights on present benefits; therefore, they easily
rationalise that the immediate satisfaction from their diet choices exceeds the long-
31Vol. 8, No. 1 Malla et al.: Impact of Weight Reduction Measures on Obesity…
term cost of such choices. According to Efrat and Efrat (2012), not all individuals
can be considered as free agents when it comes to matters concerning their diet
choices (e.g., children are not able to make rational diet decisions). Likewise,
because of physiological, self-control, and cognitive challenges, some adults also
are not able to make healthy diet choices.
It is sometimes argued that there is abundant health information on the risk of
excessive calorie intake and obesity. However, comparing the level of health
information provided by food manufacturers and suppliers to that provided by the
government shows a significant difference. Information from the government is
significantly less (Efrat and Efrat 2012). Since food manufacturers and suppliers
are driven by the profitability of their activities, the information they provide may
not necessarily be in the best interest of the consumer (Cawley 2004).
Furthermore, evidence suggests that mere access to this information does not
necessarily guarantee that consumers will be able to fully understand or interpret
the information to serve as guidance for their diet decisions (Rothman et al. 2006).
Considering the market failures that result from health care externalities,
irrational consumer behaviour, and information asymmetry, it is important that
some form of government intervention be introduced. If the government approves
and promotes the use of a health claim on low calorie diets and obesity, it is
expected that some consumers will revise their preference for high calorie diets
and switch to a lower calorie one. Although consumers might not pay directly the
full cost of poor diet choices, their utility for high calorie diets could be reduced
when they become more aware of the health risks and costs of high-calorie diets
and the benefits of low-calorie diets. In addition, the approval of a health claim by
a credible source like the government will boost consumer confidence in the
message that the health claim carries. Thus, the marginal private benefit curve will
shift from to corresponding to a reduction in caloric
intake from to (in Figure 1). This will also lead to a reduction in the loss
to society (DWL) from the gray shaded area to the dotted area. Although the
health claim could reduce the private optimal quantity closer to the socially
optimal, further stricter policies would be needed to reach the socially optimal
level ( ). This is because even in the presence of health information, consumers
might still not consume at the optimal level because of the existence of health care
externalities.
Therefore the literature suggests that health claims for low calorie diets should
lead to a reduction in calorie intake, consistent with the expectation that credible
health claims reduce the consumers’ information problem. In this context, if it
helps bolster consumer confidence, the regulatory landscape governing health
claims might facilitate the establishment of credible health claims by the private
sector. We now turn to an evaluation of the prevalence and determinants of obesity
and of the economic benefits of the low calorie diets health claims.
32Athens Journal of Health and Medical Sciences March 2021
Methods of Analysis
Cost of Illness approach is used to estimate the potential economic benefits of
improved health resulting from obesity intervention policy in Canada14. The COI
approach generates relatively conservative estimates and has some precedence in
the literature. The COI approach is considered an effective analytical tool to
estimate health-related cost savings (e.g., Gray et al. 1998, Gyles et al. 2010, Malla
et al. 2007, Malla et al. 2016).
The analysis is summarized in three steps. First, if the approval of health
claims for low calorie diets encourages reduction in caloric intake, the potential
weight loss in the population is estimated. These estimates are based on an
extensive review of the scientific literature measuring the effects of calorie
restriction on individuals’ weight and insights from a review of consumer
literature. Second, the reduction in obesity prevalence due to restriction of calories
in the daily diets of individuals is estimated, based on simulations of the dataset.
Finally, the reductions in health-related costs from the reduced prevalence of
obesity are estimated. These estimates are based on available data and peer-
reviewed scientific literature. A "Base" scenario set of estimates is provided, along
with a sensitivity analysis around the core assumptions to give "Low" and "Ideal"
scenarios.
Step 1: Calorie Restriction and Weight Loss
Step one estimates the potential weight loss that will result from reduced
caloric intake. We conducted a meta-analysis of medical/nutrition literature that
was based on dietary intervention studies (human controlled clinical trials).
Clinical trials on the influence of calorie restriction (CR) on human body
composition have suggested that the reduction of caloric intake has a non-trivial
influence on the weight of people who practice it (e.g., Fontana et al. 2007,
Redman et al. 2007, Redman et al. 2009, Tsai and Wadden 2006, Villareal et al.
2006, Weiss et al. 2007). The restriction of calories in one’s diet takes two main
forms: low-calorie diets (LCD) and very low-calorie diets (VLCD). LCD is the
restriction of caloric intake to about 800–1500 kcal/day while VLCD is the
restriction of caloric intake to about 250–800 kcal/day (Initiative 1998). Findings
from studies suggest that the effects of both interventions on weight loss after a
year are not significantly different from each other (Wadden et al. 1994).
To estimate the weight loss resulting from restricting one’s caloric intake, a
meta-analysis of several human clinical studies assessing the impact of CR on
weight was conducted. A computer search of Medline (via OVID) was conducted
with the key words "calorie restriction" and "weight loss" or "weight reduction".
14
Other methods to estimate the cost of illness that have been used by other researchers include
Willingness to Pay (WTP), the Disability-Adjusted Life Years approach (DALY), Quality-
Adjusted Life Years (QALYs), Cost Benefit Analysis, Healthy Years of Life Gained (HYLG),
and Cost-Utility (cost effectiveness). While acknowledging that other methods could be used to
estimate health-related cost savings, considering the nature of analysis to be conducted and the
data available, the most suitable method is a variation of the COI approach.
33Vol. 8, No. 1 Malla et al.: Impact of Weight Reduction Measures on Obesity…
Moreover, an extensive search of the references of relevant studies was performed.
The main criterion used for accepting and including studies into the meta-analysis
was that the weight intervention should include at least one form of calorie
restriction in diets. This reduces the possibility of including studies where weight
loss was achieved accidentally, or CR was not the intended intervention. Table A.1
in Appendix 1 gives a detailed presentation of the findings from the meta-analysis.
The available results suggest that, on average, CR will result in 10.61 percent
1.42 percent loss in weight within a period of one year.
Based on peer-reviewed evidence of strong correlation between health
claims/health information promotion and consumer demand for healthy food
products, it can be inferred that if the necessary attention is given to the health
claim on low calorie diets and obesity, the intake of calories could be significantly
reduced. The analysis is based on clinical trials’ recommended levels for calorie
restriction and the associated weight loss estimates, as well as a review of
consumers’ economics literature.
Step 2: Reduction in Obesity Prevalence Resulting from Weight Loss
Step two involves estimating the reduction in obesity prevalence from the
restriction of calories in the daily diets of individuals. A weight reduction
simulation was performed on the dataset to observe the effect of the estimated
weight loss in step one on obesity prevalence in Canada. In other words, the study
ran a simulation of the dataset to observe the changes to obesity prevalence in
Canada if overweight or obese people were to reduce their weight by 10.61
percent 1.42 percent. To simplify the analysis, the estimated weight loss was
rounded to 10 percent. To evaluate the corresponding reduction in obesity
prevalence resulting from reduced intake of high calorie diets, the weight loss
estimate in step one was deducted from the actual weights of Canadians who are
either overweight or obese. The BMI of everyone in the dataset was then
recalculated to evaluate the "new" prevalence of obesity in Canada resulting from
the estimated weight reduction. The new obesity prevalence estimate was then
compared to the obesity prevalence prior to the imposition of the weight reduction
restriction to evaluate the reduction in obesity prevalence associated with the
reduction of caloric intake. To ensure robustness of the estimate, the analysis was
repeated by considering another scenario. A modest weight loss of 5 percent was
used to re-run the simulation. According to the U.S Food and Drug Administration
(FDA), a weight loss of even 5 percent is considered as clinically significant
(Moyer 2012).
Step 3: Health-related Cost Savings Resulting from Reduction in Obesity Prevalence
The final step in the analysis is to estimate the potential health-related cost
savings to Canada resulting from calorie restriction. In 2006, obesity was
estimated to cost Canada a total of $7.1 billion (Public Health Agency of Canada
2011). Out of this amount, $3.2 billion was in direct cost, while the remaining $3.9
34Athens Journal of Health and Medical Sciences March 2021
billion was indirect15. In order to estimate the potential health-related cost savings,
the 2006 obesity cost estimate was adjusted to reflect current monetary values. The
consumer price index for health and personal care data from Statistics Canada was
used to adjust the 2006 estimate of $7.1 billion to a 2018 level of $8.44 billion
(Statistics Canada 2019). A similar adjustment of disease cost was done by Gyles
et al. (2010) and Malla et al. (2016).
To estimate the potential health-related cost savings, we established the
relationship between reduction in obesity prevalence and reduction in health care
expenditure on the disease. Although a reduction in prevalence will result in a
reduction in cost, the magnitude of the change in health care expenditure that
would result from reduction in overweight/obesity prevalence is unclear. We
consider different scenarios to estimate the potential health-related savings. The
first scenario, "Ideal", assumes an optimistic relationship between reduction in
prevalence and health-related cost savings. It is assumed that there is a linear 1:1
relationship between reduction in the incidence of a disease and health-related cost
savings (i.e., a 1 percent reduction in the prevalence of obesity will result in a 1
percent reduction in cost). This is consistent with the approach used in Gray et al.
(1998), Malla et al. (2007) and Malla et al. (2016).
A second scenario, "Base", was considered where the various cost components
of the disease (direct cost: hospital care, physician, drugs, all other health costs;
and indirect costs) were taken into consideration in establishing the relationship
between changes in prevalence and changes in health cost savings (a similar
approach was used by Gyles et al. 2010)16. Table A.2 in Appendix 2 provides a
summary of the percentage reduction in the various components of health care cost
resulting from a 1 percent reduction in obesity prevalence. To make the analysis
comparable to the "Ideal" case scenario, a weighted average of the percentage
reductions in the various components of obesity cost resulting from a 1 percent
reduction in the prevalence of obesity is evaluated17. This gives a 1:0.83
relationship between reduction in disease prevalence and reduction in health care
expenditure. That is, a 1 percent reduction in the prevalence of obesity will result
in a 0.83 percent reduction in health care expenditure on the disease. In evaluating
the weighted average, we used the total cost of each obesity cost component as its
respective weight. The evaluated weighted average was then used to estimate the
total health-related cost savings corresponding to the total percentage reduction in
obesity prevalence.
Finally, a third scenario, "Low", which considers a more conservative
relationship between reduction in disease prevalence and health-related cost savings
was examined. The "Low" scenario assumes that there is a 1:0.5 relationship
between reduction in the incidence of a disease and health-related cost savings
(i.e., a 1 percent reduction in the prevalence of obesity would result in a 0.5
15
Direct cost includes hospital care expenditure, physician services, drug cost, health research
cost, cost of services of other health professionals, and other health care cost. The indirect cost
is mainly the cost incurred due to productivity loss resulting from mortality and morbidity
(Public Health Agency of Canada 2014).
16
For more details on "Base" scenario calculations, see Appendix 3.
17
The expenditure incurred on each component of the total health cost is used as its weight.
35Vol. 8, No. 1 Malla et al.: Impact of Weight Reduction Measures on Obesity…
percent reduction in health-related cost). In summary, the scenarios are based on a
wide-ranging set of assumptions and the results will necessarily be sensitive to
these assumptions. Where possible the assumptions are based on insights from
peer-reviewed scientific literature. To ensure the estimates are as robust as
possible, and consistent with previous studies using the COI method (e.g., Gray et
al. 1998, Gyles et al. 2010, Malla et al. 2007, Malla et al. 2016), different scenarios
provide a range of outcomes.
Data
Different sources of data were used for different aspects of the analyses. For
the estimation of obesity prevalence, confidential micro-level data from the 2015
Canadian Community Health survey (CCHS) provided by Statistics Canada were
used. Furthermore, a combination of data from the 2015 CCHS and data obtained
through reviews of medical and nutritional literature based on human clinical trials
was used to perform the weight reduction simulation. The 2015 CCHS data were
based on measured heights and weights. It has been shown that data based on self-
reported heights and weights tends to underestimate the prevalence of obesity
(Bélanger‐Ducharme and Tremblay 2005, Goldman et al. 2011, Le Petit and
Berthelot 2005, Tjepkema 2006, Torrance et al. 2002).18 A possible explanation of
this problem is that people are more inclined to increase their height estimates and
reduce their weights when self-reporting (Tjepkema 2006). Hence, it is essential to
use data based on measured heights and weights.
Even though more recent versions of the CCHS are available, this study uses
only the 2015 CCHS. The decision was made based on two main reasons— the
annual versions provide data on mostly self-reported heights and weights of
Canadians and the focus of the data is not on nutrition. The 2015 CCHS dataset
compiled information from all 10 provinces in Canada focusing on people aged 1
and over. A total of 20,487 people were sampled. The sampling strategy used
ensured that the data fairly represented the Canadian population. Among the
groups of people excluded from the study are people under the age of 18 years,
full-time members of the Canadian Forces, people living in the Territories, First
Nation Reserves or Crown Lands, in prisons or care facilities and some remote
areas. The final sample sized after eliminating individuals with only self-reported
heights and weights, non-responses and missing information was 9,300. The study
made use of the sampling weight provided by the 2015 CCHS.
18
The comparison of the 1978–1979 Canada Health Survey (measured data) to the 1981
Canada Fitness Survey (self-reported data) by Torrance et al. (2002) indicated that, while the
latter reported the percentage obese to be 9 percent, the former reported the percentage of
people obese to be 13 percent. Moreover, comparing the 1988 Campbell Survey on Well-Being
(self-reported data) with the 1986–1992 Heart Health Survey (measured data) also revealed
that the percentage of people obese was 10 percent and 14 percent respectively. In addition, the
estimated percentage of Canadians obese in 2003 (estimate based on self-reported heights and
weights) was 15.2 percent, which is significantly below the 2004 estimate of 23.1 percent,
which was based on measured heights and weights (Tjepkema 2006).
36Athens Journal of Health and Medical Sciences March 2021
Results
Two main results from the COI analysis are presented in this section. The first
part of this section presents findings from the weight loss simulations resulting
from possible implementation and promotion of the health claim on "low calorie
diets and obesity". The second part presents the results of the potential health-
related cost savings estimations corresponding to the evaluated reductions in
obesity prevalence. Various cases were considered in evaluating the potential
reduction in obesity prevalence resulting from a weight loss simulation of the 2015
CCHS dataset. The cases considered include 10 percent and 5 percent weight loss
simulations performed on 100 percent, 60 percent, and 30 percent of overweight
and obese individuals in the 2015 CCHS to estimate the potential reductions in
obesity prevalence in Canada. Table 1 gives the details of 10 percent and 5 percent
weight loss simulations on all persons overweight or obese. The process was
repeated by performing the simulation on 60 percent and 30 percent randomly
selected individuals who are overweight or obese, respectively. The simulation on
the randomly selected people was repeated several times to estimate the final
overall impact of the 5% and 10% weight loss.
Table 1. Simulation Results after Weight Loss Estimate is Applied to Overweight
and Obese Individuals
Prevalence of overweight and obesity after weight loss is applied to all persons overweight
or obese
Percentage Prevalence before Prevalence after weight Percentage change in
Weight Loss weight loss loss prevalence
Overweight Obesity Overweight Obesity Overweight Obesity
% % % % % %
5% 35.24 26.97 32.14 20.01 -9 -26
10% 35.24 26.97 26.55 14.55 -25 -46
Prevalence of overweight and obesity after weight loss is applied to 60% randomly selected
individuals who are overweight or obese
5% 35.24 26.97 33.29 22.84 -6 -15
10% 35.24 26.97 29.64 19.53 -16 -28
Prevalence of overweight and obesity after weight loss is applied to 30% randomly selected
individuals who are overweight or obese
5% 35.24 26.97 34.34 24.87 -0.3 -8
10% 35.24 26.97 32.51 23.21 -8 -14
Source: authors’ calculation.
Table 1 shows that by imposing a 10 percent weight loss restriction on all
persons overweight or obese, overweight and obesity prevalence reduces from
35.24 percent to 26.55 percent and 26.97 percent to 14.55 percent, respectively.
This results in a reduction of the overweight and obesity prevalence by 25 percent
and 46 percent, respectively. Similarly, after imposing a 5 percent weight loss
restriction on the data, overweight and obesity prevalence reduces from 35.24
percent to 32.14 percent and 26.97 percent to 20.01 percent, respectively. That is,
37Vol. 8, No. 1 Malla et al.: Impact of Weight Reduction Measures on Obesity…
overweight and obesity prevalence reduces by 9 percent and 26 percent,
respectively.
To test the sensitivity of these results, we relaxed the assumption that the
health claims will be successful in persuading all overweight and obese persons to
reduce their weight (i.e., 100 percent success rate). Assuming a 60 percent success
rate of the health claim, we repeatedly and randomly selected 60 percent of the
overweight and obese people to apply 5 and 10 percent weight loss restrictions on
them. Overweight and obesity prevalence were reduced by 16 percent and 28
percent, respectively, after a weight loss restriction of 10 percent was imposed.
Similarly, a 5 percent weight loss restriction resulted in overweight and obesity
prevalence reduction of 6 and 15 percent, respectively.
Finally, the process was repeated by considering a more conservative success
rate of a health claim. After a weight loss of 10 (5) percent was randomly and
repeatedly applied to 30 percent of the overweight and obese people, overweight
and obesity prevalence were reduced by 8 percent and 14 percent, respectively (3
percent and 8 percent, respectively).
Potential Health-Related Cost Savings Resulting from the Reduction in Obesity
Prevalence
The results from all three scenarios of the simulations are presented in Table 2
(i.e., the situation where the weight loss simulations are performed on all, 30%,
and 60% of people overweight or obese). When a 10 percent weight loss
simulation was performed on all overweight or obese persons, the potential health-
related cost savings for the ideal, base, and low scenarios are $3.89 billion, $3.23
billion, and $1.94 billion, respectively. Similarly, when a 5 percent weight loss
simulation was performed on all overweight and obese persons, the potential
health-related cost savings for the ideal, base, and low scenarios are $2.18 billion,
$1.81 billion, and $1.09 billion, respectively. Moreover, when a 10 percent weight
loss simulation was performed on 60 percent randomly and repeatedly selected
overweight or obese individuals from the dataset, the potential health-related cost
savings for the ideal, base, and low scenarios are $2.33 billion, $1.93 billion, and
$1.16 billion, respectively. Likewise, when a 5 percent weight loss simulation was
performed on 60 percent of individuals, the potential health-related cost savings
are $1.29 billion, $1.07 billion, and $650 million for the ideal, base, and low
scenarios, respectively. Finally, when a 10 (5) percent weight loss simulation was
performed on 30 percent randomly and repeatedly selected overweight/obese
individuals, obesity health-related cost reduces by $1.18 billion, $980 million, and
$590 million ($660, $550, and $330 million), respectively.
The results are summarized in three main scenarios and presented in Table 3.
Obesity health related cost of $3.89 billion could be saved if "all" individuals
overweight/obese lose 10 percent of their weight, based on an optimistic
assumption that a 1 percent weight loss would result in a 1 percent reduction in
obesity health related cost. Similarly, for the base/expected scenario, $1.93 billion
in health-related cost could be saved, if "60%" of individuals (overweight/obese)
lose 10 percent of their weight, based on 1:0.83 ratio between prevalence change
38Athens Journal of Health and Medical Sciences March 2021
and cost. Lastly, regarding the pessimistic or very conservative scenario, health
related cost savings could be $330 million if "30%" of overweight/obese
individuals lose 5% of their weight, given a prevalence change to cost ratio of
1:05. In summary, health related cost savings due to the reduction of obesity/
overweight prevalence, potentially due to implementation/promotion of health-
information/health-claims on "low calorie diets and obesity", could be very
significant and could be projected to amount to $1.93 billion (base case/expected).
Table 2. Health-Related Cost Savings Estimation
Reduction in health-related cost after weight loss is applied to all persons obese/overweight
Percentage Total reduction in
Percentage reduction Total health
Relationship reduction in health expenditure
in obesity prevalence care cost of
between health care cost on obesity as a result
as a result of: obesity in
Scenario change in as a result of: of: (billion CAD $)
Canada
prevalence
5% 10% (billion CAD 5% 10% 5% 10%
and cost
weight weight $) weight weight weight weight
loss loss loss loss loss loss
Low 26 46 8.44 1:0.5 13 23 1.09 1.94
Base 26 46 8.44 1:0.8 21 38 1.81 3.23
Ideal 26 46 8.44 1:1 26 46 2.18 3.89
Reduction in health-related cost after weight loss is applied to 60% randomly selected individual who are
obese/overweight
Low 15 28 8.44 1:0.5 8 14 0.65 1.16
Base 15 28 8.44 1:0.8 13 23 1.07 1.93
Ideal 15 28 8.44 1:1 15 28 1.29 2.33
Reduction in health-related cost after weight loss is applied to 30% randomly selected individual who are
obese/overweight
Low 8 14 8.44 1:0.5 4 7 0.33 0.59
Base 8 14 8.44 1:0.8 6 12 0.55 0.98
Ideal 8 14 8.44 1:1 8 14 0.66 1.18
Source: authors’ calculation.
Table 3. Summary of Cases/Scenarios of Health-Related Cost Savings
Groups Cases/Scenarios Health care savings
All individuals overweight/obese + 10% weight
Optimistic $3.89 billion
loss simulation + 1:1
60% randomly and repeatedly selected
Expected overweight/obese individuals + 10% weight loss $1.93 billion
simulation + 1:0.83
30% randomly and repeatedly selected
Pessimistic overweight/obese individuals + 5% weight loss $330 million
simulation + 1:0.05
Source: authors’ calculation.
39Vol. 8, No. 1 Malla et al.: Impact of Weight Reduction Measures on Obesity…
Policy Implication
Findings from this study confirmed that implementation and promotion of a
health claim on low calorie diets and obesity as an intervention policy to tackle the
obesity menace could have significant implications on consumption of calories,
obesity incidence, and health care expenditures in Canada. Our findings suggest
that obesity incidence could be reduced by 8 to 46 percent if the health claim were
implemented and promoted. Accordingly, health care expenditures could be
reduced by a base amount of $1.93 billion, ranging between $330 million and
$3.89 billion. Therefore, attention should be given to the health claim and, if
possible, implemented and promoted.
Three main types of market failures could be associated with the problem of
obesity: information asymmetry, irrational consumer behaviour, and health care
externalities. While education of the general populace and the introduction and
promotion of health claims on low calorie diets and obesity could address the
problem of information asymmetry and irrational consumer behaviour, policies
such as subsidies and taxes could address the problem of the health care
externalities. The existence of these three types of market failures provides an
economic justification for the government to introduce stronger policies like taxes
on high calorie foods and subsidies on low calorie foods. Information on both the
health benefits and the potential public health-related cost savings could provide
further bases for such intervention. Freebairn (2010) argued for government
intervention by citing two main sources of obesity spillover effects—the use of
revenue generated from general taxes to finance health care costs and the
insufficient contributions by obese individuals in the form of income taxes to
government revenue (i.e., obese people take too many sick days so they are less
productive).
These policies could significantly reduce the incidence of obesity since it
could discourage excess consumption of high-calorie foods and encourage the
consumption of low-calorie ones. Studies suggest that price reduction of healthy
foods significantly encourages the consumption of such foods (e.g., Epstein et al.
2006, French 2003). Goldman et al. (2011) found that increasing the prices of high
calorie foods resulted in the reduction of obesity in the long run in the U.S. Such
intervention policies are important because some individuals will make diet
choices that are privately but not socially optimal. Even in the presence of perfect
information and health claims, consumers will consume more foods with high
calories than the socially optimal amount due to health care externality.
Consumers over-consume unhealthy products if they do not bear the full cost of
their poor diet choices. This results from the nature of the publicly funded health
care system in Canada. Hence, the privately optimal level might be significantly
higher than the socially optimal level, as depicted in Figure 2.
The introduction of specific policies like subsidies on low calorie diets could
further discourage the intake of high calorie diets and could result in a socially
optimal outcome. Figure 2 shows how a subsidy on low calorie diets could result
40Athens Journal of Health and Medical Sciences March 2021
in further reduction of caloric intake following a reduction due to a health claim19.
With the appropriate amount of subsidy, the marginal private benefit curve will
shift from to (where the marginal private benefit curve
coincides with the marginal social benefit curve), corresponding to a reduction in
caloric intake from to . At , people will consume at the socially optimal
level where there is no loss to the society. It is, however, important to note that not
all subsidies will result in the above outcome. For instance, it is argued that the
introduction of subsidies on certain food products like corn and other cereal
products in the U.S. contributed to the problem of obesity (Pollan 2007, Ludwig
and Pollack 2009). Such subsidies are believed to make high calorie foods cheaper
and more abundant. On the other hand, findings from studies (e.g., Chang and
Lauderdale 2005), including this present study, suggest that obesity is correlated
with income. As such, "thin subsidies" might be regressive and in the long run
contribute to the obesity epidemic (Muller et al 2017).
Figure 2. Impact of Subsidies and Fat Taxes on Caloric Intake
Shift due to tax
Shift due to health claims
Shift due to subsidy
Source: authors’ calculations.
An alternative to a subsidy on low calorie foods would be a government-
imposed Pigovian tax on high calorie diets. Okrent and Alston (2012) found taxing
of calories to be a significant way to reduce obesity prevalence and increase net
social benefits. An example of such taxes is a "fat tax", which is intended to
discourage the consumption of unhealthy foods that likely lead to obesity and its
19
All other things being equal, the introduction of subsidies on foods that are low in calories
but are close substitutes to those that are high in calories might entice consumers to substitute
the low calorie diets for the high calorie ones.
41Vol. 8, No. 1 Malla et al.: Impact of Weight Reduction Measures on Obesity…
related health problems (e.g., Cash et al. 2005, Leicester and Windmeijer 2004,
Mytton et al. 2007). Similar to such a policy is the tax on tobacco products, which
has led to a significant reduction of tobacco consumption and improved health in
the UK (e.g., Mytton et al. 2007). Other countries with such taxes include Hungary
(where there is a public health tax on sugary drinks and unhealthy foods) and
Mexico—where there is 10% tax on sugary drinks and 8% tax on unhealthy
snacks (FPI Australian Governments 2017). Figure 2 shows the impact of a fat tax
on the price and quantity of unhealthy foods consumed, such as high calorie diets.
Imposition of the appropriate amount of tax on high calorie diets (or foods high in
fats) increases the price of high calorie foods, causing the marginal cost private
curve to shift upwards to the left from to , as depicted in
Figure 2. Therefore, the quantity demanded of high calorie foods will be reduced
from to . At , and there is no deadweight loss to society20.
Proper implementation of fat taxes on high calorie foods could discourage the
consumption of unhealthy foods. Giesen et al. (2012) found taxes on high calorie
diets to be more effective than subsidies on low calorie diets. However, numerous
studies have shown that if such taxes are not properly implemented, they could
cause more harm than the intended good, as in the case of Denmark (e.g.,
Chouinard et al. 2007, Taylor 2013). Denmark abolished the "fat tax" just a year
after its implementation. Among the challenges of using taxes as an intervention
measure to address obesity problems are the substitution effect and the elasticity of
demand for the food product on which the tax is imposed. Imposing taxes on
certain food products might lead to the substitution of unhealthier foods which
could further worsen the obesity problem. Moreover, depending on how
responsive consumers are to changes in the price of such products, an intervention
policy based on tax might or might not be successful. For example, a tax on food
products with fairly elastic demand might be successful in reducing the quantity
demanded of such products. However, irrespective of how high a tax on an
unhealthy food may be, if the product is highly inelastic, the impact of the tax
might be minimal or totally ineffective. The challenge for policy makers is to
accurately measure the responsiveness of the demand for the unhealthy diets.
Another challenge associated with the implementation of taxes on unhealthy diets
is how to accurately measure the "healthiness/unhealthiness" of a food product.
Thus, a tax intervention policy might be successful or not depending on factors
like the nature of the product (i.e., necessity, luxury, availability/proximity of close
substitutes, time period, etc.).
Conclusion
Increasing mortality and morbidity rates, in addition to the continuous rise in
health care costs, have become significant health and policy concerns in Canada
and the world at large. The total economic impact of obesity is about $2 trillion a
20
In practice, though the introduction of tax might cause a reduction in caloric intake towards
the socially optimal level, such reduction might not necessarily coincide with the socially
optimal level.
42Athens Journal of Health and Medical Sciences March 2021
year or 2.8% of world GDP, while nearly 30% of the global population is
overweight or obese. Obesity, which is strongly associated with several diseases, is
increasingly becoming a pressing health care concern. We assessed the potential
economic benefits of the reduction of obesity incidence, which, potentially, could
be achieved by the successful implementation and promotion of the health claim
on low calorie diets and obesity in Canada using nationwide Body Mass Index
data. The study followed an integrated approach that enabled us to systematically,
consistently, and broadly analyse the issue of obesity and, in turn, to make policy
recommendations that could significantly contribute to the reduction of the obesity
epidemic.
Findings from the simulation of actual data on measured heights and weights
of Canadians suggested that a 5 to 10 percent weight loss arising from a reduction
in caloric intake due to potential implementation and promotion of health-
information/health-claim on "low calorie diets and obesity" results in nontrivial
health-related cost savings. The mean health-related average cost savings was
projected to be $1.93 billion (base case). Based on the findings, several policy
recommendations were discussed. It was shown that even a modest weight loss
resulting from lower caloric intake (i.e., 5 percent), could significantly reduce the
incidence of obesity in Canada and thereby lead to a reduction in the health care
expenditure on the disease. This study recommends the following main intervention
measures to tackle the obesity problem: the implementation and promotion of a
health claim on low calorie diets and obesity; nationwide introduction of obesity
education campaigns; the introduction of subsidies on healthy foods with low
calorie contents; and the introduction of taxes on unhealthy foods with overblown
calorie contents.
Obesity has become a crisis that is not just a pressing health concern but also a
threat to the global economy. In general, in order to reverse the health burden of
obesity, a systemic and sustained portfolio of initiatives that could be delivered at
scale is needed— no single intervention is likely to have a significant overall
impact. Education and personal responsibility are critical elements of any program
aiming to reduce obesity incidence and related health care costs; however they are
not sufficient on their own. Hence, a combination of initiatives and co-operation of
all sectors involved (e.g., media organizations, educators, healthcare providers,
consumers, public sector), as well as government interventions, will be required to
change public health outcomes and to reduce health costs.
In closing, this study provides vital findings and recommendations regarding
the pressing health and economic concern of obesity. It generated reasonable
estimates of the potential benefits from the reduction of obesity incidents,
potentially from health claims, as well as followed an integrated approach of
examining the obesity epidemic while emphasising the regulatory policies and
initiatives to address the issue. However, we acknowledge some unavoidable
limitations and fruitful areas for further research regarding the available market
data on products carrying health claims and the extent to which a health claim has
actually stimulated increased consumption of low-calorie diets. As more
information regarding the efficacy of specific health claims and updated nationwide
BMI data become available, it will allow a further refinement of the estimates
43You can also read