Efficiency improvement opportunities for personal computer monitors: implications for market transformation programs
←
→
Page content transcription
If your browser does not render page correctly, please read the page content below
Energy Efficiency
DOI 10.1007/s12053-013-9191-0

 ORIGINAL ARTICLE

Efficiency improvement opportunities for personal computer
monitors: implications for market transformation programs
Won Young Park & Amol Phadke & Nihar Shah

Received: 29 June 2012 / Accepted: 10 December 2012
# The Author(s) 2013. This article is published with open access at Springerlink.com

Abstract Displays account for a significant portion of             Keywords PC monitor energy efficiency .
electricity consumed in personal computer (PC) use,                Cost-effectiveness . Market transformation
and global PC monitor shipments are expected to
continue to increase. We assess the market trends in
the energy efficiency of PC monitors that are likely to
occur without any additional policy intervention and               Introduction
estimate that PC monitor efficiency will likely
improve by over 40 % by 2015 with saving po-                       The total global electricity consumption of personal
tential of 4.5 TWh per year in 2015, compared to                   computer (PC) and monitor stocks, including note-
today's technology. We discuss various energy-                     book computers, in the residential sector was estimat-
efficiency improvement options and evaluate the                    ed to be about 140 TWh in 2008, and of the electricity
cost-effectiveness of three of them, at least one                  consumption, monitors are estimated to account for
of which improves efficiency by at least 20 %                      30–40 TWh (IEA 2009).1 Among the key components
cost effectively beyond the ongoing market trends.                 of a PC system, displays (i.e., monitors) are responsi-
We assess the potential for further improving effi-                ble for a significant portion of energy consumption in
ciency taking into account the recent development                  a PC system, accounting for 15–35 % of the system's
of universal serial bus-powered liquid crystal dis-                consumption (IEA 2009; Delforge 2011; Horowitz
play monitors and find that the current technology                 2011). The wide range of estimates for the share of
available and deployed in them has the potential to                PC energy consumption attributable to monitors is
deeply and cost effectively reduce energy consumption              because average unit energy consumption (UEC) of a
by as much as 50 %. We provide insights for policies               1
                                                                     While the estimate from IEA (2009) is limited to the residen-
and programs that can be used to accelerate the adoption           tial sector, the electricity consumption of PC monitors for all
of efficient technologies to further capture global energy         sectors in the USA was estimated to be 13–23 TWh/year for
saving potential from PC monitors which we estimate to             2010 (Delforge 2011). The US PC monitor shipments accounted
                                                                   for about 17 % of the global shipments in 2010 (DisplaySearch
be 9.2 TWh per year in 2015.
                                                                   2011a). Assuming that PC monitor stock and PC monitor ship-
                                                                   ments have the same share for the USA versus the rest of the
                                                                   world, using the factor 17 % for a rough estimate, the global
W. Y. Park (*) : A. Phadke : N. Shah                               electricity consumption of PC monitors in 2010 is estimated to
Environmental Energy Technologies Division,                        be 76–135 TWh across all sectors. This paper is based on annual
Lawrence Berkeley National Laboratory,                             global PC monitor shipments that include all sectors and fo-
Berkeley, CA, USA                                                  cused on energy consumption contributed from the new
e-mail: WYPark@lbl.gov                                             shipments.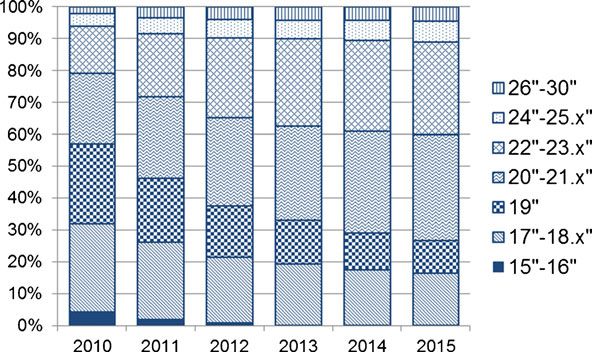
Energy Efficiency

PC varies highly with the system specifications and                 products with a tuner or receiver and computer capability
power management scheme applied to the system.                      that are sold as TVs) are out of the scope of this paper.
    An assessment of efficiency improvement opportu-                   This paper also focuses on LCD monitors which are
nities in PC monitors is needed for three reasons. First,           expected to dominate worldwide sales, amounting to an
policies to facilitate the adoption of cost-effective ef-           expected 99 % of global PC monitor shipments by 2015
ficiency improvements in PC monitors are necessary                  (DisplaySearch 2011a). In this paper, we assess recent
to correct market failures such as uncaptured econom-               technology trends and their impact on the energy effi-
ic and environmental benefits available from reduced                ciency of PC monitors, and related efficiency improve-
PC monitor energy consumption. Although other re-                   ment programs. However, detailed program design
cent studies (IEA 2009; Connection Research 2010)                   questions are out of the scope of this paper. We also
addressed computer energy efficiency and consump-                   assess technologies that can improve the efficiency of
tion issues, none of these studies assess the cost-                 PC monitors beyond this trajectory in a cost-effective
effectiveness2 of efficiency improvement options in                 manner, and provide insights on policies that can accel-
detail for PC monitors. Such assessment is needed                   erate their adoption. We consider efficiency improve-
for designing appropriate policies and market transfor-             ment options that are technically feasible, practical to
mation programs, e.g., energy efficiency standards and              manufacture, and could be realized in the short term
financial incentive programs, to facilitate the adoption            (over the next 3 years), as the rapid evolution of tech-
of cost-effective efficiency improvements. Second, the              nology in the display market makes a forecast over a
literature focused on PC monitors is limited and was                longer time scale highly uncertain and therefore not very
published before the ongoing large-scale transition                 useful from a policy perspective. We obtained the data
from cold cathode fluorescent lamp (CCFL) backlit                   for this paper primarily from the following sources: a
liquid crystal display (CCFL-LCD) monitors to light-                review of the literature including technical reports, Dis-
emitting diode (LED) backlit LCD (LED-LCD) mon-                     playSearch reports,3 the ENERGY STAR database,4
itors. LED-LCD monitors are likely to be at least 50 %              international conferences, technical exhibitions, and
and 90 % of the PC monitor shipments in 2012 and                    interviews with manufacturers and experts in the field.
2015, respectively (DisplaySearch 2011a). Third, in-                   The remainder of this paper is organized as follows:
formation and communications technology (ICT)                       In “Overview of PC monitor market and energy con-
appliances such as PCs, laptops, and monitors are                   sumption trends” section, we present an overview of
internationally traded, used in a similar manner glob-              the PC monitor market, technology trends, and energy
ally, and subject to internationally recognized energy              consumption trends. In “Efficiency improvement
efficiency specifications such as ENERGY STAR                       options and related trends for PC monitors” section,
(Waide 2011). Hence, the results of this analysis are               we assess technologically feasible energy-efficiency im-
likely to be applicable in several countries (see “Over-            provement options, adoption trends of such options, and
view of PC monitor market and energy consumption                    the impact of these options on energy consumption of
trends” section for details).                                       PC monitors. We also review recent developments in
    This paper focuses on desktop PC monitors with a                universal serial bus (USB) direct current (DC)-powered
diagonal screen size between 15 and 30 in. and a pixel
                                                                    3
density greater than 5,000 pixels per square inch, which is           DisplaySearch has been providing reliable information and
                                                                    analyses on the display market and related industries which
designed to display information from a computer via one
                                                                    are widely used in the industry. For PC monitors, DisplaySearch
or more signal inputs. PC monitors with a tuner or receiver         provides quarterly updated global/regional PC monitor shipment
are included as long as they are sold to consumers as               data, analysis of the display market and technology trends, and
computer monitors, but notebook computer screens, dig-              PC monitor manufacturing costs and average market prices.
                                                                    4
                                                                      The displays modeled in data used here meet ENERGY STAR
ital picture frames whose primary function is to display
                                                                    Displays Specification Version 5 which went into effect on
digital images, signage displays, and televisions (TVs; i.e.,       October 30, 2009. Although ENERGY STAR-registered prod-
                                                                    ucts typically represent energy-efficient models in the market,
                                                                    the consumption of ENERGY STAR products as of September
2
  In this analysis, cost-effectiveness is defined as cost of con-   2011 can be regarded to represent the majority of the market at
served energy (CCE), the annualized investment in more expen-       that time. See the discussion under the subsection “PC Monitor
sive equipment or component needed to provide a unit of energy      Energy Consumption” in “Overview of PC monitor market and
saved (kilowatt-hour), less than electricity price.                 energy consumption trends” section for details.
Energy Efficiency
monitors that need to employ energy-efficient technol- monitor market is expected to increase (see Fig. 2),
ogies due to the limitations on power inherent in USB- and screens with resolutions of 2.07 MP or less are
powered systems. In “Cost-effectiveness analysis” sec- likely to continue to dominate the market. The
tion, we present a cost of conserved energy (CCE) shipment-weighted average number of pixels per screen
analysis to assess the cost-effectiveness of options iden- has been increasing since 2010, mainly due to the in-
tified in “Efficiency improvement options and related crease of LED backlight's market share (compare Fig. 2
trends for PC monitors” section. “Policy insights to with Fig. 1). Higher resolution monitors, e.g., enhanced
accelerate adoption of efficient PC monitors” section performance display (EPD),6 accounting for less than
offers suggestions for accelerating the adoption of effi- 3 % of the global market, are not expected to increase
cient technologies, and in “Global savings potential for significantly in market share within the short term.
efficiency improvement in PC monitors” section, we While high resolution displays generally consume more
estimate the energy savings potential of such adoption. electricity than low resolution ones, PC monitors with
“Conclusions” section presents concluding remarks. resolution higher than 1,920×1,080 consist of a niche
market. Although we do not separately discuss the im-
pact of high resolution monitors such as EPD on energy
Overview of PC monitor market and energy consumption in PC monitors, we account for the impact
consumption trends of resolution on energy consumption by selecting major
product groups identified by screen size and resolution,
Global PC monitor shipments which represent 93 % and 96 % of the market in 2012
and 2015, respectively (see “Global savings potential
Since the early 2000s, the global PC monitor market has for efficiency improvement in PC monitors” section), in
undergone a major transition from traditional CRTs to estimating PC energy consumption.
LCDs (IEA 2009; DisplaySearch 2011a).5 As shown in
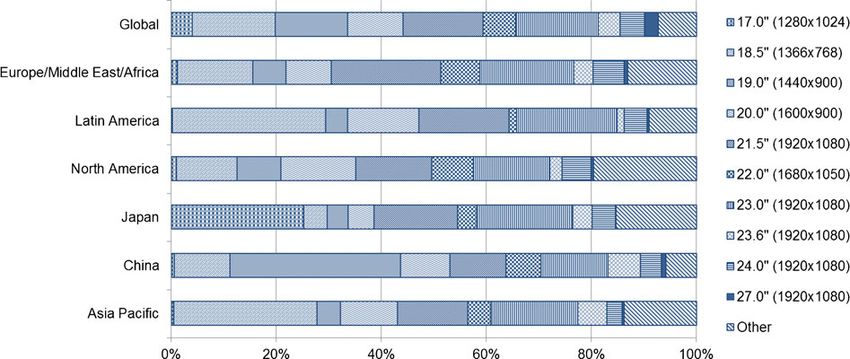
Fig. 1, global PC monitor shipments are expected to Screen size
experience continual growth through 2015 and reach
230 million units, including all-in-one PCs (i.e., integrat- Although 17- to 19-in. monitors were dominant in the
ed PCs) in 2015. A large-scale transition is also ongoing market, manufacturers and DisplaySearch expect the
and expected to continue from CCFL-LCDs to LED- share of 20- to 23-in. monitors to increase from 37 %
LCDs, resulting in further substantial improvements in in 2010 to over 60 % in 2015 (see Fig. 3). A further
efficiency. Fig. 1 illustrates DisplaySearch's forecast that increase in monitor screen size beyond 26–30 in. is not
LED backlights will capture more than 70 % of the global likely to be significant.
PC monitor shipment from 2013 onward. From 2010 to 2015, the average screen size (mea-
While desktop PC shipment is expected to either sta- sured diagonally) and total annual shipments are pro-
bilize just over 150 million units or decrease slightly from jected to increase by 7 % and 19 %, respectively,
this level from 2011 onward (DisplaySearch 2011a), PC leading to a 35 % increase in the aggregate screen
monitor purchase is expected to continue to increase area of annual PC monitor shipments. Figure 4 shows
through 2015 driven by upgrades, increased adoption of the average monitor screen area per unit and global
larger screen sizes, use with notebook computers, or dual shipments for 2010 and 2015, as well as the expected
monitor use (DisplaySearch 2011a; Alexander 2010). transition from CCFL backlight to LED backlights in
terms of shipments and screen area. While the increase
Screen resolution in both screen size and shipment is likely to increase
energy consumption, the transition from CCFL-LCDs
The share of 1,920×1,080 resolution screens, i.e., (inefficient) to LED-LCDs (efficient) is expected to
approximately 2.07 megapixels (MP), in the PC reduce UEC. Figure 4 provides a picture illustrating
the cumulative effect of both factors.
5
Global CRT monitor shipment in 2009 was only 1.2 million
units, which accounted for 0.7 % of total PC monitor shipments
6
in 2009 (DisplaySearch 2011a). From 2010 onward, Display- According to ENERGY STAR's definition, an enhanced-
Search has stopped tracking CRT monitor shipment arguably performance display must have a native resolution greater than
because of low and falling market share for CRT monitors. 2.3 megapixels (ENERGY STAR 2012a).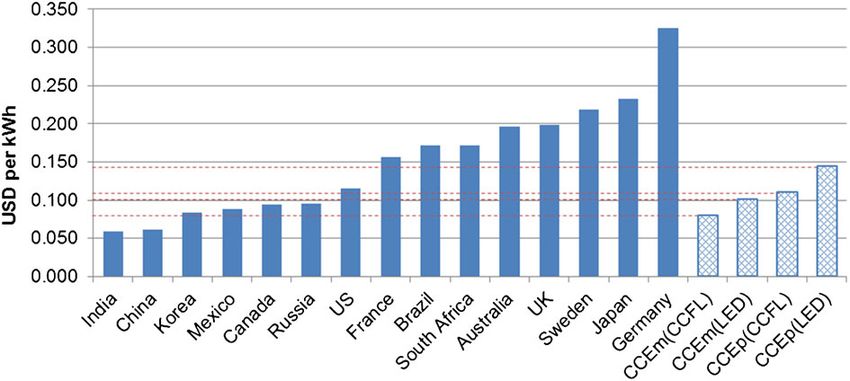
Energy Efficiency

Fig. 1 Actual (Q1 2010–Q2
2011) and forecasted (Q3
2011–Q4 2015) global PC
monitor shipments

    There are only limited regional differences and     the short term.7 Hence, we have not focused on OLED
significant global similarity in PC monitor screen      technology here.
(i.e., LCDs) and LCD backlight technology (see             Another technology trend in the digital display
Fig. 5), although there are regional differences in     market is 3D-capable displays. However, the share
screen size/resolution preferences and the market       of 3D-capable monitors in the desktop PC monitor
share of LCD backlights. Major brands distribute        market was less than 0.5 % (less than one million
similarly designed PC monitors with similar             units) in 2011 (DisplaySearch 2012b) and is not
energy consumption characteristics across many          likely to increase significantly in the short term at
regions. For example, as of August 2011, 89 %           least until 3D technologies become more conve-
of Samsung's LCD monitors on the global market,         nient to use (e.g., glass-free 3D) and 3D-ready
which represent the highest share (~15 %) of the        monitors become more affordable to consumers.8
market from one manufacturer, have qualified for        An existing 3D display in 3D mode requires addi-
ENERGY STAR Version 5 (Samsung Electronics              tional 3D image processing and results in a rela-
2011). The top five global brands (Samsung, Dell,       tively lower brightness level due to additional
LG, HP, and Acer) and the top five original equip-      films or 3D glasses in comparison to 2D mode.
ment manufacturers (OEMs) (Samsung, LG, TPV,            Therefore, manufacturers may increase brightness
Chimei, and Qisda) account for more than 50 %           level and correspondingly increasing power con-
and 80 %, respectively, of the global PC monitor        sumption in 3D mode in comparison to 2D mode
market (DisplaySearch 2011a). Hence, our analysis       (Park et al. 2011). Manufacturers are overcoming
does not consider separate efficiency options and       this increase in energy consumption by improving
costs for different regions of the world, as these      screen technologies, including 3D technologies.
are globally applicable, but does take into account     While we do not focus on 3D-capable PC mon-
regional differences in screen size, resolution, and    itors here, all the efficiency improvement options
market share of backlight technologies. According-      studied here for 2D monitors are also applicable to
ly, the research presented in this paper is applica-    3D-capable monitors.
ble to PC monitors in most countries.
                                                        7
Emerging trends                                           In the TV industry, Samsung and LG announced in January
                                                        2012 that they would provide 55″ OLED TVs first to the
                                                        market, even though they had demonstrated 30-in. class OLED
Organic light-emitting diodes (OLEDs) are expected      TVs since a few years ago. Medium-size (20–30 in.) OLEDs are
to begin penetrating into the PC monitor market from    not expected to be cost competitive against LCDs in the short
2013 onward, but reach only 0.4 million units (less     term.
                                                        8
                                                          For example, LG has launched glass-free 3D monitors (LG
than 0.5 % of the global market) in 2015. It does not
                                                        D2500N-PN, 25-in.) in early 2012, with a market price of
appear that new screen technology such as OLEDs         approximately $1,900, while the price of typical 25-in. LED-
will become popular in the PC monitor market within     LCD monitors is less than $300.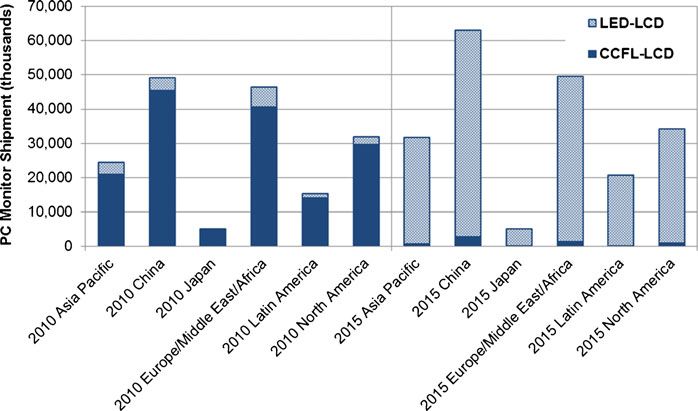
Energy Efficiency

Fig. 2 Global PC monitor
shipment distribution by
resolution and average
number of pixels per screen
(actual shipment: Q1 2010–
Q2 2011, forecast: Q3
2011–Q4 2015)

   In spite of concerns about the potential impacts                Further, non-registration of certain PC monitor
of emerging technology trends such as new dis-                     models with ENERGY STAR does not necessarily
plays (e.g., OLEDs), higher resolution, and 3D                     imply that such monitors do not meet ENERGY
capability on energy consumption in PC monitors,                   STAR specifications. A test performed by the US
we see that the dominant screen technology (i.e.,                  Environmental Protection Agency (US EPA) during
LCDs) and screen size (combined with resolution)                   2008–2009 on a sample of ten monitors showed
are more important than these emerging trends                      that eight of the ten tested non-ENERGY STAR
which are not significant now (in terms of market                  computer monitors met the then applicable ENER-
share) or expected to grow significantly in the PC                 GY STAR Version 4 criteria and performed similar-
monitor market and whose energy consumption                        ly to tested ENERGY STAR registered models (US
and savings impact are still low and uncertain                     EPA 2009). The European Union (EU) region has
within the time horizon and the global scale con-                  also been experiencing similar market share trends
sidered in this paper.                                             for ENERGY STAR PC monitors (IDC 2010; EC
                                                                   2011). Table 1 summarizes the market compliance
PC monitor energy consumption                                      of ENERGY STAR PC monitors for the US and
                                                                   EU regions.
Average on-mode power of PC monitors                                  In addition, as discussed above, major brands
                                                                   distribute similarly designed PC monitors across
To estimate the energy consumption of PC monitors,                 many regions to capitalize on economies of scale.
we use the database of PC monitors registered in 2011              Thus, given that the top five brands and the top
under ENERGY STAR Version 5. The rapid rate of                     five OEMs dominate the global PC monitor market
LCD monitor technology improvement is evident. The                 and the 2011 rate of compliance with ENERGY
market penetration rate of ENERGY STAR-registered                  STAR is estimated to be over 70 %, the power
LCD monitors during 2009 was 90 %.9 In 2010, a year                consumption of ENERGY STAR PC monitors is
after the introduction of the new Version 5 specifica-             likely to be representative of average models on
tions, the market share of ENERGY STAR qualified                   the global market.
products was 43 % and is estimated to have increased                  A 20-in. ENERGY STAR-registered LCD mon-
to about 70–80 % in 2011 (ENERGY STAR 2011a, b).                   itor consumes 10–25 W in on-mode (ENERGY
                                                                   STAR 2011b), while LED-LCD monitors are on
                                                                   average more efficient than CCFL-LCD monitors
9
  Since the new specification, i.e., Version 5, was updated dur-   by about 10–30 %. We calculated simple mean on-
ing 2009 and officially went into effect in October 2009, the      mode power per unit screen area for ENERGY
shipment data used for calculating market compliance may have      STAR-qualified products. As seen in Table 2,
comprised a blend of products qualified under the old and new
specifications (ENERGY STAR 2010). The majority of the             CCFL- and LED-LCD monitors consume 0.018
90 % is estimated to be Version 4-qualified monitors.              and 0.015 W/cm2, respectively, on average and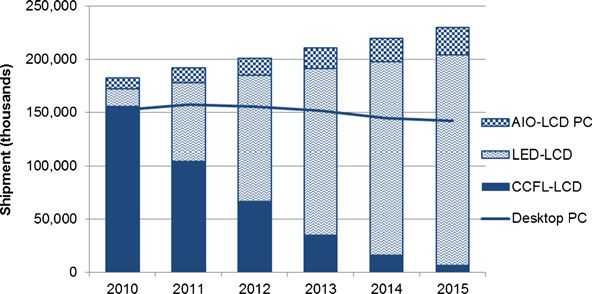
Energy Efficiency

Fig. 3 Global PC monitor
shipment distribution by
screen size (actual shipment:
Q1 2010–Q2 2011, forecast:
Q3 2011–Q4 2015)

about 0.5 W in sleep mode10 (see Table 2 and                       sales and increased screen size. Figure 7 shows PC
Fig. 6).                                                           monitor energy consumption contributed from annual
                                                                   global shipments.
PC monitor energy consumption from annual shipment

To estimate PC monitor energy consumption from an-                 Efficiency improvement options and related trends
nual shipment, we calculated average watts per square              for PC monitors
centimeter for each product group categorized by back-
light type, resolution, and screen size11 from ENERGY              As discussed in “Introduction” section, this paper fo-
STAR-registered monitors. Multiplying each average                 cuses on efficiency improvement options for LCD PC
watts per square centimeter by annual shipment of each             monitors which are expected to continue to dominate
product group, the total annual electricity consumption            worldwide sales, i.e., 99 % by 2015.
contributed by PC monitors shipped globally in 2011 is                An LCD, unlike other self-emissive flat-panel12 dis-
estimated to be about 6.8 TWh. If efficiency is frozen at          plays such as plasma display panel (PDP) and OLED, is a
2011 levels, the annual electricity consumption contrib-           non-emissive display that uses a backlight, e.g., CCFL or
uted from 2015 global monitor shipment will increase to            LED, as a light source. An LCD is made up of millions of
7.6 TWh, even though the share of LED backlights is                pixels consisting of liquid crystals (LCs) that can alter
expected to significantly increase because of increased            their crystalline orientation when voltage is applied, result-
                                                                   ing in different transparency levels. The light from the
10
   Most recent PC monitors consume less than 1 W in standby
                                                                   light source first passes through a polarization film, gets
mode, since many major economies have been adopting “1 W           modulated by the LCs, and appears as a red, blue, or green
Policy” since the International Energy Agency (IEA) proposed       pixel after passing through a color filter (Fraunhofer IZM
in 1999 that all countries harmonize energy policies to reduce     2007). Thin film transistor (TFT) technology13 on glass is
standby power, setting the target of a maximum of 1 W per
device. The mean value of ENERGY STAR qualified monitors
                                                                   used to drive or control the orientation of the LCs, i.e.,
used in the report is 0.4 W in sleep mode and 0.3 W in off mode.   pixels. Figure 8 shows a typical LCD structure.
According to the results from Standby and Off-mode Energy             When viewed in terms of change in luminance (can-
Losses In New Appliances Measured in Shops (SELINA) proj-          dela per square meter) as light travels through the LCD
ect in EU, the mean values of off and standby modes power
consumption in 2009–2010 are 0.5 and 0.6 W, respectively (Da
                                                                   screen, LCDs' overall efficiency appears to have signifi-
Silva et al. 2010).                                                cant further potential for improvement, since the final
11
   15.6″ (1,366×768), 17″ (1,280×1,024), 18.5″ (1,366×768),
19″ (1,440 × 900, 1,280 × 1,024), 20″ (1,600 × 900), 21.1″         12
                                                                      The term “panel” generally refers to the entire assembly of
(1,680 × 1,050, 1,600 × 1,200), 21.3″ (1,600 × 1,200), 21.5″       layers, excluding electronics such as the drive circuit, the image
(1,920×1,080), 22″ (1,680×1,050), 23″ (1,920×1,080), 23.6″         circuit, and the power supply unit.
                                                                   13
(1,920×1,080), 24″ (1,920×1,080), 25″ (1,920×1,080), 26″              A TFT is a transistor whose electrical current-carrying layer is
(1,920×1,080), and 27″ (1,920×1,080, 2,560×1,440).                 a thin film, typically made of silicon.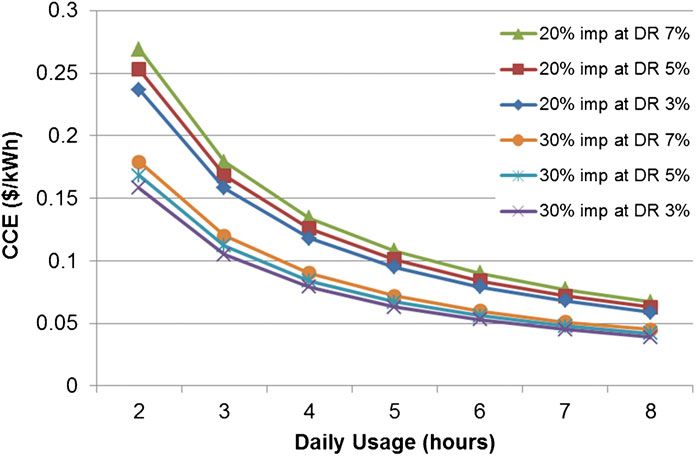
Energy Efficiency

Fig. 4 Global monitor an-
nual shipments and total
screen area (actual shipment
2010 vs. forecast 2015)

luminance delivered out of the LCD is generally less than       reproduction capability and contrast ratio) or lead to
10 % of the initial luminance coming out of the backlight       reduction in overall costs (e.g., high transmittance
unit. This is because two crossed polarizers, a color filter,   LCD panels require fewer optical films or backlight
and TFT arrays in the LCD panel absorb a significant            lamps), are more likely to be adopted on their own
amount of light from the backlight unit (Shieh et al. 2009;     without additional policy intervention compared with
Park et al. 2011). The required backlight luminance is          options which predominantly improve only efficiency.
therefore highly sensitive to the panel transmittance and       Furthermore, electricity costs for PC monitors and
optical film efficiency, making even small improvements         corresponding savings from efficiency improvement
in these yielding large payoffs in terms of required lumi-      are a relatively minor component of the total costs
nance and therefore overall efficiency. For example,            over the lifecycle of the monitor in many countries,
when panel transmittance improves from 7 % to 8 %,              presenting an additional rationale for policy intervention
required backlight luminance drops by about 10–15 %.            to improve efficiency.14 Thus, efficiency is unlikely to

Efficiency improvement options and trends                       14
                                                                   A 23-in. LCD monitor consuming 30 W used for 8 h a day for
                                                                365 days at an electricity price of 10 cents/kWh has an electric-
Efficiency improvement options, which also lead to              ity cost of $8.8/year. Thus, a 20 % efficiency improvement for
                                                                such a 23-in. LCD monitor will lead to saving of $1.8/year.
concurrent improvement in other desirable product
                                                                However, this is less so in places such as the EU, e.g., at 30–
characteristics (e.g., LED backlighting leads to thin-          40 cents/kWh, the energy savings benefit could be a significant
ner/lighter monitors and better picture quality in color        fraction of the market price.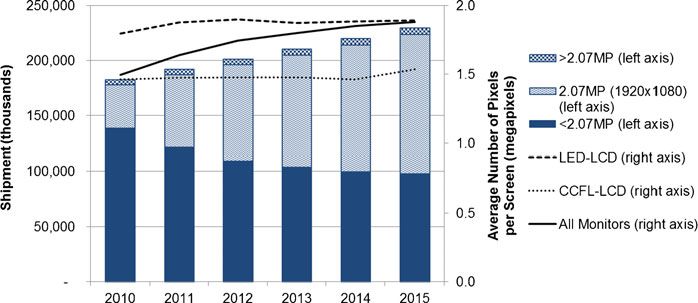
Energy Efficiency

Fig. 5 Actual (2010) and
forecasted (2015) shipments
showing market transition
by region and screen
technology

be a major consideration in price-sensitive consumer's         monitor market and energy consumption trends” sec-
selection of PC monitors in many countries. Although           tion. The efficiency of LED backlight units is itself
we assess several efficiency improvement options and           also expected to improve as a result of developments
analyze their impact on PC monitor electricity consump-        in advanced LED structure, phosphors, thermal man-
tion, we limit our analysis of cost-effectiveness to those     agement, and beam angles. Material cost reduction is
options which are unlikely to be adopted on their own          an intrinsic motivation for manufacturers to achieve
since they do not directly lead to improvement in other        high efficiency in their LED backlights. The luminous
desirable characteristics of PC monitors. Table 3 sum-         efficacy of LEDs available for use in LCD monitors is
marizes LCD monitor efficiency-improvement options             70–90 lm/W in 2011–2012, and expected to go be-
which are also discussed in further detail below.              yond 100 lm/W in 2013 (DisplaySearch 2011b; Park
                                                               et al. 2011; US DOE 2011). Driven by this efficiency
Backlight sources                                              improvement, the average number of LED lamps used
                                                               for a 23-in. LCD monitor is expected to decrease by
Major manufacturers have reduced the number of                 about 43 % in 2015, compared to 2011 (DisplaySearch
lamps used in CCFL-LCD monitors smaller than                   2011b).
20 in. from four lamps to two, thereby reducing power
consumption by about 30 % (DisplaySearch 2011b;                Optical films
Lee 2010). Also, LED-LCD monitors are more effi-
cient than CCFL-LCD monitors by about 10–30 %,                 Improving the amount of light that can pass through
and expected to dominate the market in the short to            optical films without compromising on their function
medium term as discussed earlier in “Overview of PC            (e.g., light uniformity) reduces the amount of backlight

Table 1 Market penetration of ENERGY STAR PC monitors

                                                 2009                                    2010                  2011

Applicable version of ENERGY STAR                Version 4 (January–September)           Version 5             Version 5
                                                 Version 5 (October–December)
US                                               90%                                     43%                   70–80%a
                                                                                                  b
EU                                               75% (first half)                        60–70%                70–80%c
                                                 49% (second half)
a, b, c
    Authors' estimates based on the below sources
Source: ENERGY STAR 2010, 2011a, 2012b; EC 2011; IDC 2010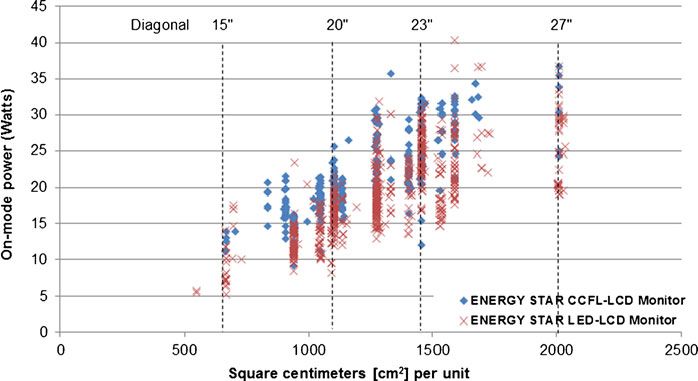
Energy Efficiency

Table 2 On-mode power per unit screen area by backlight             more efficient than other LCD panel structures such as
                 N        Mean       Min        Max        Std.     VA and IPS. However, manufacturers are likely to
                                                                    gradually increase the share of these (i.e., VA and
CCFL-LCD         396      0.018      0.008      0.027      0.003    IPS) LCD panel structures in LCD monitors, from
LED-LCD          731      0.015      0.007      0.025      0.003    6.5 % in 2011 to about 15 % in 2013 (DisplaySearch
                                                                    2011c). This is because the demand for LCD monitors
Unit: watts per square centimeter (W/cm2 )
                                                                    larger than 20 in. is increasing due to an increased
Source: ENERGY STAR (2011b)                                         preference for better viewing angles driven by users
Std. standard deviation                                             watching visual content through the Internet, DVDs,
                                                                    or TV tuners, and the fact that TN LCD panels do not
needed to achieve an equivalent screen luminance, result-           deliver a wide viewing angle, high contrast ratio, and
ing in a corresponding reduction of the electricity con-            good gray scale in comparison to the other panel
sumption of LCD monitors. Optical films have been                   structures. Although manufacturers have been improv-
combined in many ways to reduce material costs (i.e.,               ing the viewing angle of current TN-based LCDs with
total cost of the backlight unit) as well as to increase            the help of optical films, the TN panel's inherently
efficiency. For example, if a reflective polarizer15 is ap-         narrow viewing angle, low contrast ratio, and imper-
plied, LCD monitor efficiency could be further improved             fect gray scale are still limiting factors in marketing
by 20–30 % (DisplaySearch 2011b; 3M 2011a). Howev-                  large TN monitors. Instead, manufacturers are improv-
er, most LCD monitors meet the current energy efficiency            ing the panel transmittance of IPS- and VA-based
standards such as ENERGY STAR specifications even                   LCD monitors in larger monitors. For example, low-
without a reflective polarizer. A reflective polarizer, such        voltage-driven LC materials would allow manufac-
as 3M Vikuiti™ Dual Brightness Enhancement Film                     turers to use narrower low-resistance data lines, result-
(DBEF), is being used only for a few high-end models                ing in high cell aperture ratio and therefore higher LC
of LCD monitors with vertical alignment (VA) or in-                 panel transmittance than can currently be used. It is
plane switching (IPS) structure whose panel transmit-               expected that LCD panel transmittance for IPS and VA
tance is low but picture quality is good. Twisted Nematic           structures will improve from 4–6 % to levels of 6–
(TN) structure that has been employed in most LCD                   10 % in 2015, compared to levels of 5–6.5 % in 2010
monitors is more efficient than VA and IPS structures.              (DisplaySearch 2011b; Park et al. 2011).
Even though the DBEF contributes significantly to power
savings, it is a proprietary technology that is sometimes           Power management—brightness control
viewed as unnecessary from a perspective focused solely
on cost reduction in a cost-competitive market. (For the            In general, PC monitors incorporate backlight dim-
purposes of this paper, we use DBEF not as an endorse-              ming in relation to usage pattern. For example, PCs
ment of any particular technology, but as an illustration of        dim and subsequently turn off the screen after a certain
the energy savings potential available from optical films.)         time period of user inactivity,16 and users can also
                                                                    customize sleep settings for their preferences. In addi-
High panel transmittance                                            tion to this default power management scheme used in
                                                                    PC monitors, there are three other types of brightness
Improvement in LCD panel transmittance decreases                    control methods.
the luminance that the backlight must achieve and
therefore allows manufacturers to reduce the number
                                                                    Backlight dimming in relation to image signals Since
of lamps in the backlight unit. As discussed earlier, the
                                                                    an LCD is a non-emissive display, dark parts of a
TN structure being applied to most LCD monitors is
                                                                    picture are created by blocking the polarized light with
15
   A reflective polarizer recovers a certain type of polarized      LC orientation adjusted in each pixel. In this case, the
light, which cannot be transmitted through the rear polarizer of
the LCD panel, by reflecting this portion of light back to the
                                                                    16
backlight unit and depolarizing it so that the light can be newly      According to ENERGY STAR computer requirement (EN-
polarized to transmit back to the panel (DisplaySearch 2011b;       ERGY STAR 2011b), “Display Sleep Mode shall be set to
Park et al. 2011).                                                  activate after no more than 15 minutes of user inactivity.”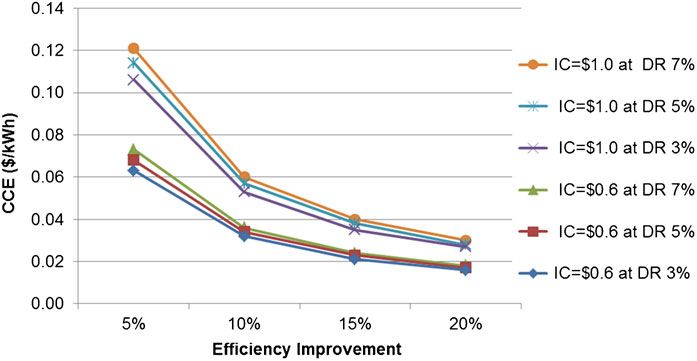
Energy Efficiency

Fig. 6 LCD monitor power
consumption vs. screen size

LCD backlight is still on and consuming the same                     While dimming backlights according to dynam-
amount of power. Employing technology to locally                  ically changing pictures (i.e., 1D or 2D dimming)
dim the backlight lamps behind the dark parts of                  can be an effective way to reduce power consump-
an image can lead to reduction in backlight elec-                 tion and enhance dynamic contrast ratio, its use is
tricity consumption. The simplest dimming option                  much more limited in displaying static images
is to dim the whole backlight by a universal                      such as high-resolution photos and characters on
amount varying by frame, which is called zero-                    a desktop PC monitor screen. First, dimming the
dimensional (0D), complete, or global dimming.                    backlight may result in degradation of legibility
This option can be applied to all types of back-                  and colors (Chang et al. 2004). Second, existing
lights. Backlight dimming in relation to user inac-               1D dimming techniques may cause users to per-
tivity or ambient light conditions, generally called              ceive side effects such as blurred images and par-
automatic brightness control (ABC), can also be                   tially dimmed block segments on the backlight
generally regarded as part of this method. Another                behind the LCD screen. Third, white backgrounds
option is to dim part of the backlight area depend-               on websites and popular software programs such
ing on input image, which has two variations: (1)                 as Microsoft Word and Excel reduce the total
one-dimensional (1D), partial, or line dimming;                   energy savings available from dimming technology
and (2) two-dimensional (2D) or local dimming.                    in LCD monitors. Even if the screen is assumed to
Local dimming of LED-direct backlights is more                    be operated in black background, white characters
effective at reducing power consumption than par-                 or a moving mouse cursor may be blurred on the
tial dimming of LED-edge backlights.17 However,                   black background. As high-resolution and sharp-
only partial or complete dimming methods are                      ness are important factors for consumers to choose
applicable to PC monitors since most PC monitor                   PC monitors, these are limiting factors for manu-
products, excluding high performance professional                 facturers in using more advanced dimming than
monitors, employ LED-edge backlights to reduce                    0D dimming. Although manufacturers are motivat-
costs and make displays thinner.                                  ed to use such advanced dimming for battery-
                                                                  operated displays such as laptop screens, they are
                                                                  not likely to use advanced dimming methods for
                                                                  typical desktop PC monitors.
17
   “LED-direct” or “LED full-array” configuration means that
the LEDs are uniformly arranged behind the entire LCD panel.
Unlike LED-direct models, “LED-edge” or “Edge-lit backlight”
                                                                  Backlight dimming in relation to ambient light condi-
configuration means that all of the LEDs are mounted on sides
of the display. Majority of PC monitors has an edge-lit config-   tion Windows 7 provides adaptive brightness, a fea-
uration on only one side.                                         ture that enables a computer with a light sensor on
Energy Efficiency
Fig. 7 Estimated PC moni- 10
tor energy consumption
from annual shipment
Electricity Consumption
8
6
(TWh)
LED-LCD
4
CCFL-LCD
2
0
2011 2012 2013 2014 2015
the display to automatically adjust the brightness to save energy by preventing PC monitors from being
match the lighting conditions in user computer's left on when people leave the room. However, the
surroundings (Microsoft Corporation 2012). In case way how occupancy sensors work is similar to
the ambient light level decreases from 300 to 10 lux, existing PC's power management scheme related
it is reasonable to expect a power reduction of about to user inactivity. It is also difficult to determine
20 % (ENERGY STAR 2012a), although the effect the average effect of occupancy sensors or isolate
varies with manufacturers' setting. However, it is still their individual effect from other power manage-
difficult to determine the average effect of ambient ment methods on PC monitor's on-mode power
light sensors on total energy consumption of a PC consumption.
monitor because sufficient data on the varied light-
ing conditions where PC monitors are typically used Low voltage direct current (DC)-powered monitors—
across regions and sectors is not available (see efficiency-related trend
“Option 3: Ambient Light Sensor” section for
details). DC-powered monitors are expected to have several
advantages in terms of energy efficiency, portabil-
Backlight dimming in relation to user presence Occu- ity, and easy applicability to off-grid areas where
pancy sensors or motion sensors might also help DC power sources are available. For example,
Fig. 8 Typical structure of a liquid crystal display (LCD)Energy Efficiency
Table 3 LCD monitor efficiency improvement options
Components Improvement options Notes
Backlight unit Backlight source CCFL to LED transition Cost increase
Adopted by manufacturers due to improved product
quality
Expected to be accelerated by economies of scale
and technological learning (BAUb)
High LED efficacy Cost reduction in the long term (BAU)
Technical barrier in thermal management and short
term cost increase from adoption of much higher
efficiency LEDs (i.e., high power LEDs) than BAU
Optical films Optimized combination of films Trade-offs in material cost, ease of manufacture, and
efficiency (BAU)
Reflective polarizer (DBEFa) Cost increase, proprietary technology
LCD panel Improvement in panel transmittance by Proprietary technology
optimizing pixel design, functional layers, R&D investment required but driven by cost
e.g., polarizer, color filter, and data line reduction (BAU)
Power management Brightness control based on computer Efficiency improvement varies with settings and
usage patterns usage patterns (BAU)
Brightness control based on ambient Efficiency improvement varies with settings and
light condition ambient light condition
Brightness control (local dimming) based Efficiency improvement varies with manufactures'
on image signals design scheme. The use of local dimming in PC
monitors is more limited than in TVs
Other Low voltage DC powered monitors (e.g., High-efficiency LCD panel required
USB-powered monitors) Cost increase for the LCD panel but likely cost
neutral for the monitor set
a
DBEF (dual brightness enhancement film) produced by 3M
b
BAU options are likely to be adopted regardless of policy intervention
manufacturers are developing monitors which can consumed by an end use, so USB-powered mon-
be powered with just one or two USB cables. The itors need to employ very efficient technologies.
limited power transmitting ability of a USB cable Specifically, the USB 3.0 protocol permits up to
limits the total amount of power that may be 4.5 W of power output (USB 2011). In 2010, 3M
demonstrated that a 18.5-in. LED-LCD monitor
could consume 40 % less power (i.e., reducing
Table 4 Average usage (hours per day) of PCs and monitors at
power from 14.0 to 8.3 W) by using a high
on-mode transmittance LCD panel and a reflective polarizer
(i.e., DBEF), and drawing power through two USB
Category Sector US EU
3.0 ports (Siefken et al. 2011). In 2011, 3M ex-
Desktop Office 2.2–5.2 6.2 panded the technology to a 23-in. USB-powered
Home 2.9–6.3 4.3
monitor, claiming 9 W power consumption (3M
Laptop Office 2.2–5.2 7.2
2011b). At the International Consumer Electronics
Show (CES) in January 2012, AOC18 demonstrated a
Home 2.9–6.3 3.8
Monitor Office 2.2–5.2 7.1
18
Home 3.4–6.4 3.5 AOC (Admiral Overseas Corporation), an electronics compa-
ny headquartered in Taiwan, produces LCD monitors and LCD
Sources: ENERGY STAR (2011c) and IVF (2007) TVs which are sold worldwide.Energy Efficiency
Table 5 Cost of conserved electricity (CCE) for reflective polarizers
Screen size/resolution Backlight ΔPon-modea (W/unit) ΔCmb ($/unit) CCEmc ($/kWh) ΔCpd ($/unit) CCEpe ($/kWh)
21.5″ (1,920×1,080) CCFL 4.7 3.4 0.079 4.7 0.109
LED 3.6 3.2 0.097 4.4 0.134
23.0″ (1,920×1,080) CCFL 5.0 3.8 0.081 5.2 0.111
LED 3.8 3.7 0.104 5.4 0.152
Weighted average CCFL 4.8 3.5 0.080 4.9 0.110
LED 3.7 3.5 0.101 4.9 0.144
Assumptions: discount rate=5 %, economic lifetime=6 years, daily usage=5 h
a
Average power saving per unit=(average on-mode power of 2012 standard models estimated by authors)−(estimated average on-
mode power of 2012 models with reflective polarizer)
b
Incremental manufacturing cost=(manufacturing cost for 2012 standard models predicted by DisplaySearch)−(manufacturing cost for
2012 standard models with reflective polarizers estimated by authors)
c
Cost to the manufacturer of conserved energy which is calculated by Eqs. 1 through 3 at IC=ΔCm
d
Incremental price=(average market price for 2012 standard models predicted by DisplaySearch)−(price for 2012 standard models
with reflective polarizer estimated by authors)
e
Cost to the final user of conserved energy which is calculated by Eqs. 1 through 3 at IC=ΔCp
new 22-in. USB-powered monitor which is available in screen sizes by 2015, compared to 2011 levels,
the market, in addition to AOC's other USB-powered due to improvements in LED efficacy, LED pack-
monitors. aging technology, and LCD panel transmittance
The future of DC-powered monitors as a main- (DisplaySearch 2011b; Park et al. 2011). In addi-
stream technology is still uncertain. At present, tion to these technological options which are
sufficient market data does not exist to estimate expected to be implemented even without policy
the future market share of DC-powered monitors. action, PC monitor efficiency can be further im-
However, the technical capacity to make and de- proved by 20–30 % by the addition of an optical
ploy these low-powered monitors exists currently, film such as a reflective polarizer. Reflective polar-
illustrating the efficiency potential available for PC izers are a mature technology, although currently
monitors. There are significant additional advan- restricted in use only to a few high-end models.
tages to DC-powered monitors. First, DC-powered DC-power monitors such as USB-powered moni-
monitors have lower costs and increased efficiency tors with efficient LCD panels are currently feasi-
due to the elimination of electronic components ble that can reduce power consumption by 40–
required for conventional alternating current (AC) 50 %, compared to typical monitors currently on
powered systems, e.g., power cord and AC/DC the market. Ambient light sensor is also a com-
converter. Second, DC-powered monitors do not mercially available option for manufacturers to
need to adapt to different AC input voltages across choose to improve efficiency of PC monitors. In
regions. Third, DC-powered monitors allow expan- the next section, we discuss the cost-effectiveness
sion to new power sources such as Ethernet, in- of these three efficiency improvement options for
ductive/wireless power transfer, solar, or even fuel LCD monitors.
cells (Siefken et al. 2011; Lee 2010).
In summary, significant further improvement in
power consumption is not expected for CCFL- Cost-effectiveness analysis
LCD monitors, as manufacturers are not likely to
invest further in making CCFL-LCD monitors Cost of conserved energy (CCE) is a metric used to
more efficient due to their decreasing market assess the desirability of energy efficiency policies.
share. LED-LCD monitors are expected to have a Estimating CCE for a policy option involves calculat-
reduced (30–42 % lower) number of LEDs across ing the cost of saving electricity which can then beEnergy Efficiency
Fig. 9 Sensitivity of cost
per unit of conserved elec-
tricity (CCEm) to daily us-
age and discount rates
Assumption: economic lifetime=6 years (imp=improvement potential, DR=discount rate)
compared to the cost of providing electricity, to the and energy savings for the ith product category (Energy
utility or consumer.19 We calculate CCE from two Savingsi), as follows:
perspectives: First, considering the incremental cost
annualized ICi
to the manufacturer, which we label CCEm, and sec- CCEi ¼ ð1Þ
energy savingsi
ond, the incremental cost to the consumer which
includes retailer markups20 on the incremental manu- where
facturing cost, which we label CCEp. The former " #
estimate can be used for assessing the cost- discount rate
annualized ICi ¼ ICi
effectiveness of upstream incentive programs (e.g., 1 ð1 þ discount rateÞlifetimei
manufacturer incentives), whereas the latter can be
ð2Þ
used to assess that of downstream incentive (e.g.,
consumer incentives) or minimum energy perfor-
mance standards (MEPS) programs. kWh
Energy Savingsi ¼ Power reduced ðwattsÞ ð3Þ
CCE is estimated by dividing the annualized incremen- year
tal cost (IC) that is required to add the efficiency improve- hours 365 days 1 kW
daily usage
ment option by the annual energy savings due to the day year 1; 000 W
efficiency improvement. Product categories are defined
by screen size and backlight type (e.g., 23-in. LED-LCD where lifetimei is the PC monitor economic lifetime.
monitor). The CCE for the ith product category is calcu- All PC monitors in the ith product category are as-
lated using annualized IC for the ith product category (ICi) sumed homogeneous. Thus, total annual energy savings
from the ith product category will be calculated by Energy
19
We do not include program administration and implementa- Savingsi times the annual sales of the ith product category.
tion costs in this cost-effectiveness analysis, as we are assessing
cost-effectiveness to the consumer of standards and labeling
programs, as well as incentive programs. Typical customer Energy savings
incentive program administration costs in the USA are in a
range of 8–38 % of the total program costs (Friedrich et al.
We estimate energy savings of an efficiency im-
2009).
20
For the purposes of this paper, retailer markups are based on provement option based on the incremental reduction
the US market. from the baseline PC monitor power consumption.Energy Efficiency
Source for energy prices: IEA 2011, US EIA 2010, McNeil 2008, Rosen and Houser 2007
Fig. 10 Energy prices and cost per unit of conserved electricity (CCE)
The baseline is calculated from the ENERGY STAR 6.4 h per day.21 ENERGY STAR uses 5.2 h per day as a
Version 5-registered PC monitors listed on the EN- default value for the average usage of PC monitors in its
ERGY STAR website as of September 2011. As office equipment savings calculator (ENERGY STAR
discussed in “Overview of PC monitor market and 2011d). For the European region, estimates of average
energy consumption trends” section, this dataset can daily usage of monitors range from 3.5 to 7.1 h (IVF
be treated as representative of average PC monitors 2007), or 2 to 8 h by sector of use (EU-ENERGY STAR
sold in that year. 2011). For the purposes of this analysis, we assume that
average daily usage at on-mode is 5 h for all monitors,
and perform a sensitivity analysis in the range of 2 to 8 h
Economic lifetime
to account for country-specific variations (Table 4).
The economic lifetime, or replacement cycle, of PC
monitors can vary with region, income, sector of use,
Discount rate
and consumer lifestyle. US EPA uses 5 years as a
default value for the average lifetime of PC monitors
Residential and commercial sectors may use various
in the ENERGY STAR office equipment savings cal-
methods to finance the purchase of appliances. A
culator (ENERGY STAR 2011d). For the European
technical support document, prepared by US Depart-
region, estimates of lifetime range from 3.5 to 7 years,
ment of Energy (DOE), of energy efficiency programs
with an average of 6 years (IVF 2007). In this analysis,
for consumer products analyzed that the average dis-
we assume an average lifetime of 6 years.
count rates are 4.8 % for residential consumers and
6.2 % for commercial consumers (US DOE 2009). We
Average usage assumed an average discount rate of 5 % for all cases,
21
Computer usage patterns also vary with region, sector Estimated average operating hours for PC monitors are cate-
gorized into user behavior patterns for both residential and
of use, consumer lifestyle, and power management
commercial uses: “power managed and turned off,” “not power
scheme applied to the system. For the USA, the aver- managed and turned off,” “power managed and left on,” and
age daily usage of PC monitors ranges from 2.2 to “not power managed and left on”.Energy Efficiency
Table 6 Estimate of incremental costs for a 23-in. USB-powered monitor
Base model LED backlit LCD monitor, 23″, 1,920×1,080
Components Sub-components Change in efficiency Change in cost
Backlight unit Optimized optical film stack (a) +20–30 % ↑ $4.8–5.0
Backlight lamps/LED driver (b) ↓ $0.7–1.0
LCD panel Optimization for efficient LCD panel (c) +10–20 % ↑ (unknown)
Other electronics Power supply and AC power cable (d) +5–10 % ↓ $4.5–5.5
Authors' estimates as of Q3 2011 products based on DisplaySearch (2011b, d, e)
and perform a sensitivity analysis in the range of 3 % adopting the selected options are generally propor-
to 7 % to account for country-specific variations. tional to screen area or independent of screen size.
Thus, any size variation does not largely affect
Product categories analyzed cost-effectiveness.
Although we assess several efficiency improvement Option 1: reflective polarizers
options and analyze their impact on PC monitor elec-
tricity consumption, we limit our analysis of cost- We focus on assessing the cost-effectiveness of adopt-
effectiveness to those options which are unlikely to ing reflective polarizer films which reduce energy
be adopted in the absence of policy intervention. For consumption by 20–30 % and are unlikely to be wide-
the cost-effectiveness analysis, we selected two prod- ly adopted in the market in the absence of any market
uct categories (21.5 and 23 in.) which become the transformation policy action.
most common screen sizes through 2012. While the We assumed that reflective polarizers improve
selected product groups together represented about PC monitor efficiency by at least 20 % regardless
15 % of the global PC monitor shipments in 2010, of backlight source (see “Efficiency improvement
they are expected to account for about 31 % and options and related trends for PC monitors” sec-
41 % of the market in 2012 and 2015, respectively tion for details). A 20 % reduction in required
(DisplaySearch 2011a). The results of our analysis backlight luminance can lead to a corresponding
for selected screen sizes also hold for other screen 20 % savings in backlight lamp cost. Hence, the
size categories since the costs and benefits of incremental cost of using a reflective polarizer is
Fig. 11 Sensitivity of cost
per unit of conserved elec-
tricity (CCEm) for ambient
light sensors
Assumption: economic lifetime = 6 years, daily usage = 5 hours (IC=incremental cost, DR=discount rate)Energy Efficiency
Table 7 Cost of conserved electricity (CCEm) for 23-in. LED- selected product groups have a CCEm with a range of
LCD monitors
$0.08/kWh and $0.10/kWh and a CCEp with a range of
Option Savings CCEm ($/kWh) $0.11/kWh and $0.15/kWh.
potential CCE is inversely proportional to hours of use, i.e.,
if hours of use are halved (2.5 h a day from our
Reflective polarizer 20–30% 0.070–0.104
assumption of 5 h/day), CCE will double (see Eq. 1
Efficient LCD panel 10–20% 0.077–0.256a
and 3). Further, reflective polarizers increase efficien-
(indicative)
cy by 20–30 % (versus our assumption of 20 %);
USB-powered monitor with 50% 70 %)f (>85 %)
Potential level for standards – 72 % 65 %
Potential level of incentives/labels – 34 % 29 %
a
DisplaySearch (2011a)
b
Authors' estimates based on ENERGY STAR-qualified monitors and the discussion in “Efficiency improvement options and related
trends for PC monitors” section
c
(A): reflective polarizer, (B): USB-powered system with high-efficiency LCD panel, including reflective polarizer
d
Market penetration rate of monitors that are estimated to meet ENERGY STAR Version 5
e
ENERGY STAR 2012a
f
Predicted market penetration rate of monitors that meet the corresponding efficiency level. Majority of LED-LCD monitors are
expected to meet the efficiency levelEnergy Efficiency
Fig. 12 Possible levels for
standards, labeling, and in-
centive programs
Option 2: efficient LCD panels and DC-powered monitors Table 6). First of all, manufacturers may need to
optimize the currently employed film stack when
Although efficient LCD panels22 required for DC- adding a reflective polarizer to the film stack ((a)
powered monitors would cost more than the aver- in Table 6). Here, we consider only the material
age LCD panels available today, the final LCD cost of a reflective polarizer. Second, higher
monitor set can be manufactured without many brightness achieved by the optimized film stack
electronic components typically required in AC- allows manufacturers to reduce the number of
powered PC monitors such as power cord and LEDs or enables the LEDs driven at a lower
AC/DC converter, leading to further cost reduction power level ((b) in Table 6). Here, we assume that
in packaging and shipping. a 20–30 % reduction in backlight luminance can
In fact, the total manufacturing cost for USB- lead to a corresponding 20–30 % savings in back-
powered DC monitors is not likely to increase light lamp cost. Then, manufacturers need to use a
compared to conventional AC-powered PC moni- low power-driven LCD panel to optimize the LCD
tors (Lee 2010). For example, the on-line market for the USB-powered system ((c) in Table 6).
price of AOC 22-in. (actual screen size, 21.5″) However, the incremental cost of this particular
E2251FWU (1,920×1,080, USB-powered) is avail- element (i.e., efficient LCD panel) is difficult to
able from about $150 upward (as of September estimate. Lastly, as the efficiency of power supply
2012),23 while the average market price of 21.5- units is generally between 85 % and 95 % (Park et
in. 1,920 × 1,080 LED-LCD monitors in the US al. 2011), a DC-powered system is expected to
market is recently estimated at about $148 as of become more efficient than conventional AC-
third quarter of 2012 (DisplaySearch 2012a). powered system by at least 5 %. Additional cost
To be specific, we estimated the incremental reduction in the packaging and shipping process
costs of a 23-in. USB-powered monitor (see seems possible, but is not included in this
estimate.
If the incremental manufacturing cost to opti-
22
Efficiency improvement of most commercially used LCD mize the LCD panel for the USB-powered system
panel technologies (e.g., high panel transmittance discussed in is in a range of $0.2 and $1.7 (see Table 6), both
“Efficiency improvement options and related trends for PC the cost savings and the incremental costs for 23-
monitors” section) usually requires R&D investment because it
involves a non-linear process of re-engineering the whole panel, in. USB-powered monitors could be similar in the
and would involve changes in other components as well as the range of at least $5 to $7, effectively cancelling
manufacturing process. Here, we consider efficiency of LCD each other out. This is borne out by the example
panels currently achievable without additional R&D investment cited above.
within the specific context of DC-powered monitors.
23
Based on the search “AOC E2251FWW” at www.google.- The incremental cost for efficient LCD panel (op-
com/shopping. timized for the USB-powered system) may vary as itEnergy Efficiency
Fig. 13 Global PC monitor
electricity consumption for
annual shipment
involves a non-linear process of re-engineering the decreases from 300 to 10 lux, it is expected to
whole panel, and would involve changes in other bring a power reduction of about 20 % (ENERGY
components as well. Assuming that the incremental STAR 2012a). According to the PC monitor indus-
cost for the efficient 23-in. LED-LCD panel with a try,25 the material cost of an ambient light sensor
saving potential of 20 % is $1.7, where the USB- for PC monitors is in a range of $0.6 and $1.0 per
powered monitor is likely to be cost neutral, the unit as of the first quarter of 2012. If we assume
CCEm (at 5 % of discount rate, 6 years of eco- that a 5–20 % (i.e., Δ0.95–3.8 W) energy saving
nomic lifetime, and 5 h of daily usage) for the is possible for 23-in. LED-LCD PC monitors, the
efficient LCD panel only is $0.077/kWh. Assum- CCEm (at 5 % of discount rate, 6 years of eco-
ing that the incremental cost for the efficient 23-in. nomic lifetime, and 5 h of daily usage) for the
LED-LCD panel with a saving potential of 20 % ambient light sensor is in a range of $0.017/kWh
is $9, the CCEm for the USB-powered monitor24 and $0.114/kWh, which could be regarded as cost
with the efficient LCD panel is $0.100/kWh, effective. Figure 11 shows CCE for LED-LCDs
which is less than an average electricity price of versus efficiency improvement at various combina-
many countries (see Fig. 9), while the CCEm for tions of discount rates and incremental material
the efficient LCD panel is $0.256/kWh. The $9 costs.
accounts for about 4.4 % of a normal 23-in. Ambient light sensors might enable TVs and PC
LED-LCD monitor set (as of second quarter of monitors being used at home to reduce energy
2011, DisplaySearch 2011d). Thus, DC monitors consumption. For example, the majority of TV
are likely to be cost effective and provide savings viewing in the USA occurs between 0 and
on the order of approximately 50 % from current 100 lux (Wold 2011)26 where ambient light sen-
levels as long as the incremental cost for efficient sors work effectively. However, as already dis-
LCD panels is less than about 4–5 % of the LCD cussed in “Efficiency improvement options and
monitor price. related trends for PC monitors” section, it is diffi-
cult to more accurately determine the average
Option 3: ambient light sensor effect of ambient light sensors on energy consump-
tion of a PC monitor because sufficient data on
Ambient light sensors are commercially available, the varied lighting conditions where PC monitors
and their material cost does not vary with screen
size or resolution. As discussed in “Efficiency
25
improvement options and related trends for PC We got the cost information from a top-tier manufacturer, but
monitors” section, in case the ambient light level the identities of the expert we interviewed and the manufacturer
source are kept confidential at the interviewees' request.
26
Wold (2011) is based on data collected from 60 residences
24
Total savings potential=50 %, total net incremental cost= over a 7-day time period in October 2011 in both the Washing-
$8.8. ton, DC, USA and Sacramento, CA, USA metro areas.You can also read