Phase separation and scaling in correlation structures of financial markets
←
→
Page content transcription
If your browser does not render page correctly, please read the page content below
Phase separation and scaling in correlation
                                            structures of financial markets
                                            Anirban Chakraborti1,2,* , Hrishidev3 , Kiran Sharma4 , and Hirdesh K. Pharasi5
                                            1 School   of Computational and Integrative Sciences, Jawaharlal Nehru University, New Delhi-110067, India
                                            2 Centro   Internacional de Ciencias, Cuernavaca-62210, México
                                            3 Indian Institute of Science Education and Research, Pune-411008, India
                                            4 Chemical & Biological Engineering, Northwestern University, Evanston, Illinois-60208, USA
                                            5 Instituto de Ciencias Fı́sicas, Universidad Nacional Autónoma de México, Cuernavaca-62210, México
                                            * anirban@jnu.ac.in
arXiv:1910.06242v3 [q-fin.ST] 22 Jul 2020

                                            ABSTRACT

                                            Financial markets, being spectacular examples of complex systems, display rich correlation structures among price returns
                                            of different assets. The correlation structures change drastically, akin to phase transitions in physical phenomena, as do
                                            the influential stocks (leaders) and sectors (communities), during market events like crashes. It is crucial to detect their
                                            signatures for timely intervention or prevention. Here we use eigenvalue decomposition and eigen-entropy, computed from
                                            eigen-centralities of different stocks in the cross-correlation matrix, to extract information about the disorder in the market.
                                            We construct a ‘phase space’, where different market events (bubbles, crashes, etc.) undergo phase separation and display
                                            order-disorder transitions. An entropy functional exhibits scaling behavior. We propose a generic indicator that facilitates the
                                            continuous monitoring of the internal structure of the market – important for managing risk and stress-testing the financial
                                            system. Our methodology would help in understanding and foreseeing tipping points or fluctuation patterns in complex systems.

                                            Introduction.—       Even before we could completely recover from the long-lasting effects of the global economic downturn in
                                            2007-081 , we are threatened by another impending economic crisis that has been triggered by the coronavirus (COVID-19)
                                            pandemic. The last crisis had brought us both predicament and hope! Predicament, since the traditional theories in economics
                                            could not predict, not even warn, the near complete breakdown of the global financial system. Hope, since one began to witness
                                            signs of change in economic and financial thinking, including the very fact that there is deeper (and less understood) link
                                            between macroeconomics and finance2–4 , which certainly merits more attention. Undoubtedly, the financial market serves as an
                                            ideal candidate for modeling a complex system5, 6 , which is generally composed of many constituents of diverse forms and
                                            nature but largely interconnected, such that their strong inter-dependencies and emergent behavior change with time. Thus, it
                                            becomes almost impossible to describe the dynamics of the complex system through some simple mathematical equations,
                                            and new tools and interdisciplinary approaches are much needed. Historically, financial markets have often exhibited sharp
                                            and largely unpredictable drops at a systemic scale– ‘market crashes’7 . Such rapid changes or ‘phase transitions’ (not in the
                                            strict thermodynamic sense8, 9 ) may be in some cases triggered by unforeseen stochastic events or exogenous shocks (e.g.,
                                            coronavirus pandemic), or more often, they may be driven by certain underlying endogenous processes (e.g., housing bubble
                                            burst). These events are akin to phase transitions8–10 in physical phenomena, having interesting dynamics. New insights
                                            and concepts, such as systemic risk, tipping points, contagion and network resilience have surfaced in the financial literature,
                                            prompting people to better monitor the highly interconnected macroeconomic and financial systems and, thus, anticipate future
                                            economic slowdowns or financial crises.
                                                As a spectacular example of a complex system11, 12 , the financial market13–16 displays rich correlation structures17, 18 , among
                                            price returns of different assets, which have often been visualized as correlation-based networks19–21 with the identification of
                                            dominant stocks as influential leaders and sectors as communities22–24 . The correlation structures often change drastically,
                                            as do the leaders and communities in the market, especially during market events like crashes and bubbles7 . Therefore, the
                                            continuous monitoring of the complex structures of the market correlations becomes very crucial and practical17, 25, 26 . Recently,
                                            Pharasi et al.17, 18 used the tools of random matrix theory to determine market states and long-term precursors to crashes, and
                                            confirmed that during a market crash all the stocks behaved similarly such that the whole market acted like a single huge cluster
                                            or community. In contrast, during a bubble period, a particular sector got overpriced or over-performed, causing accentuation of
                                            disparities among the various sectors or communities. However, there are no existing formal definitions of market crashes or
                                            bubbles; in fact, a certain arbitrariness exists in declaring a market event as a crash or bubble. Hence, it is extremely difficult to
                                            detect the signatures of these events so that we can timely intervene or prevent them.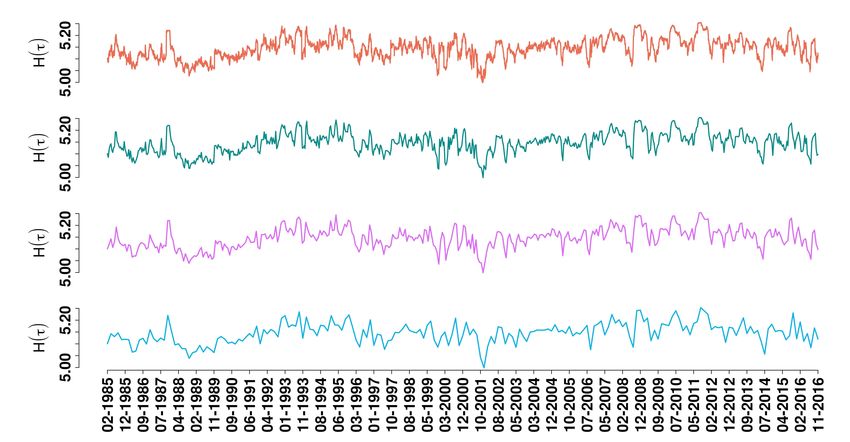
In this paper, we extract information about the disorder in the market using the eigen-entropy measure27 , computed from the
eigen-centralities (ranks)24 of different stocks in the market, and show for the first time that different market events (correlation
structures) undergo phase separation28, 29 in a constructed ‘phase space’. For the construction of the phase space we use
transformed variables |H − HM | and |H − HGR |, computed from the eigen-entropies [H, HM , HGR ] following the eigenvalue
decomposition of the correlation matrices (C) into the market modes (CM ) and the composite group plus random modes (CGR ).
We further show that all market events, characterized by the [H, HM , HGR ], are either ‘business-as-usual’ periods (located
towards the interior of the phase space) or ‘near-critical’ events (located at the periphery). Thus, one can see order-disorder
transitions as market events evolve in the phase space, as observed in critical phenomena of physical systems. For robustness,
we chose two different financial markets– the US S&P-500 and Japanese Nikkei-225 over a 32-year period, and studied the
evolution of the cross-correlation structures and their corresponding eigen-entropies. One of the relative entropy measures
H − HM displays scaling30 behavior with respect to the mean market correlation µ. Further, a functional of the relative entropy
measure, − ln(H − HM ), acts as a good gauge of the market fear (volatility index V IX)31 . Analogous to the black-hole entropy
that reveals about the internal structure of a black-hole, our methodology with eigen-entropy (measure of market disorder)
would also reveal the nature of internal market structure. Further, the phase separation would help us to label the events as
anomalies, bubbles, crashes, or other interesting type of events. It would also provide a few generic indicators that would
facilitate the continuous monitoring of the internal structure of the correlation epochs17, 18, 25, 26, 32 . We anticipate that this new
methodology would help us to better understand the internal market dynamics and characterize the events in different phases as
anomalies, bubbles, crashes, etc., which could help in better risk management and portfolio optimization33 . This could also be
easily adapted and broadly applied to the studies of other complex systems such as in brain science27 or environment34 .
Data.— We have used the adjusted closure price time series for United States of America (USA) S&P-500 index and Japan
(JPN) Nikkei-225 index, for the period 02-01-1985 to 30-12-2016, from the Yahoo finance database (https://finance.yahoo.co.jp/;
accessed on 7th July, 2017). USA has data for the N = 194 stocks and the period 02-01-1985 to 30-12-2016 (T = 8068 days).
JPN has data for the N = 165 stocks and the period 04-01-1985 to 30-12-2016 (T = 7998 days). Note that we have included
those stocks in our analyses, which are present in the data for the entire duration, and added zero return entries corresponding
to the missing days. The list of stocks (along with the sectors) for the two markets and the sectoral abbreviations are given in
the SI Tables S1, and S2.
    We have also used the daily closure Volatility index (V IX) of the Chicago Board Options Exchange (CBOE) from Yahoo
finance (https://finance.yahoo.co.jp/; accessed on 13th October, 2019) for the period 02-01-1990 to 30-12-2016, for T = 6805
days. It acts as a popular measure of the expectation of volatility in the stock market implied by the S&P-500 index options. It
is computed and displayed on a real-time basis by the CBOE, and acts as the ‘fear index’ or the ‘fear gauge’31 .
Methodology.—        The returns series are constructed as ri (τ) = ln Pi (τ) − ln Pi (τ − ∆), where Pi (τ) is the adjusted closure price
of stock i on day τ, and ∆ is the shift in days. Instead of working with a long time series to determine the correlation matrix for
N USA stocks, we work with a short time epoch of M days with a shift of ∆ days. Then, the equal time Pearson correlation
coefficients between stocks i and j is defined as Ci j (τ) = (hri r j i − hri ihr j i)/σi σ j , where h...i represents the expectation value
computed over the time-epochs of size M and the day ending on τ, and σk represents standard deviation of the k-th stock
evaluated for the same time-epochs. We use C(τ) to denote the return correlation matrix for the time-epochs ending on day
τ (see e.g., Fig. 1). Here, we show the results for M = 40 days with a shift of ∆ = 20 days (other choices of M and ∆ in SI
Fig. S1).
    For any given graph G := (N, E) with |N| nodes and |E| edges, let A = (ai, j ) be the adjacency matrix, such that ai, j = 1, if
node i is linked to node j, and ai, j = 0 otherwise. The relative centrality pi score of node i can be defined as:
                                                           1                   1
                                                    pi =        ∑       pj =       ∑ ai, j p j ,
                                                           λ   v∈M(i)
                                                                               λ   j∈G

where M(i) is a set of the neighbors of node i and λ is a constant. With a small mathematical rearrangement, this can be written
in vector notation as the eigenvector equation A |pi = λ |pi. In general, there may exist many different eigenvalues λ for
which a non-zero eigenvector solution |pi exists. We use the characteristic equation |A − λ 1| = 0 to compute the eigenvalues
{λ1 , ..., λN }. However, the additional requirement that all the entries in the eigenvector be non-negative (pi ≥ 0) implies (by
the Perron-Frobenius theorem) that only the maximum eigenvalue (λmax ) results in the desired centrality measure. The ith
component of the related eigenvector then gives the relative eigen-centrality score of the node i in the network. However, the
eigenvector is only defined up to a common factor, so only the ratios of the centralities of the nodes are well defined. To define
an absolute score one must normalise the eigenvector, such that the sum over all nodes N is unity, i.e., ∑Ni=1 pi = 1. Furthermore,
this can be generalized so that the entries in A can be any matrix with real numbers representing the connection strengths. For
correlation matrices C(τ), in order to enforce the Perron-Frobenius theorem, we work with ai, j = |Ci, j |n , where i, j = 1, . . . , N
and n is any positive integer (we have used n = 2 in the paper; other values are discussed in SI ; see also SI Fig. S2).

                                                                                                                                       2/27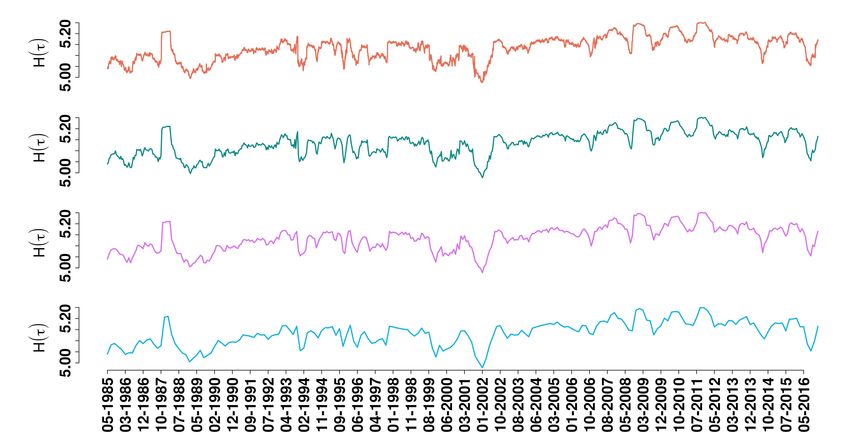
Dynamical evolution                                    Phase space

                                                                  (Top view)                       (Side view)

Figure 1. Schematic diagram of the construction of phase space. Diagram explains the computation of eigen-entropies
[H, HM , HGR ], starting from each of the correlation matrices C (four arbitrarily chosen dates). The correlation matrix C is first
decomposed to CM and CGR (see Methodology), and then the eigen-centralities {pi } are computed (from the corresponding
maximum eigenvalues for each of these matrices). The eigen-entropies are computed as − ∑Ni=1 pi ln pi . The coordinates
[H, HM , HGR ] can be used to study the market evolution, or characterization of the market events in the phase space diagrams
(top and side views).

                                                                                                                              3/27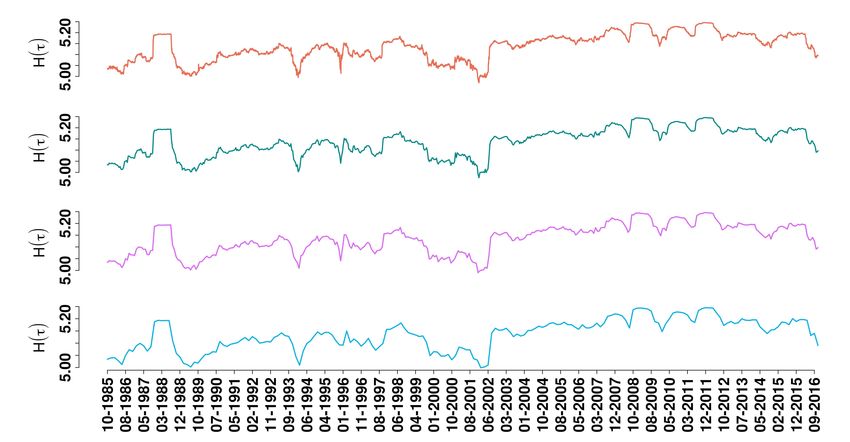
CG                     CR                              CGR

     Figure 2. Eigenvalue decomposition of the correlation matrices, and ranked eigen-centralities. Plots showing the
     correlation matrices: (Left to Right) full C, market mode CM , group mode CG , random mode CR , group-random mode CGR and
     the ranked eigen-centralities {pi } of the different correlation modes: full (C in black curve), market mode (CM in turquoise
     curve) and group-random mode (CGR in grey curve); stocks are arranged sector-wise (names abbreviated). (Top to Bottom)
     Matrices corresponding to normal, anomalous, type-1, crash periods of the financial market, and a random matrix taken from
     WOE.

                                                                                                                             4/27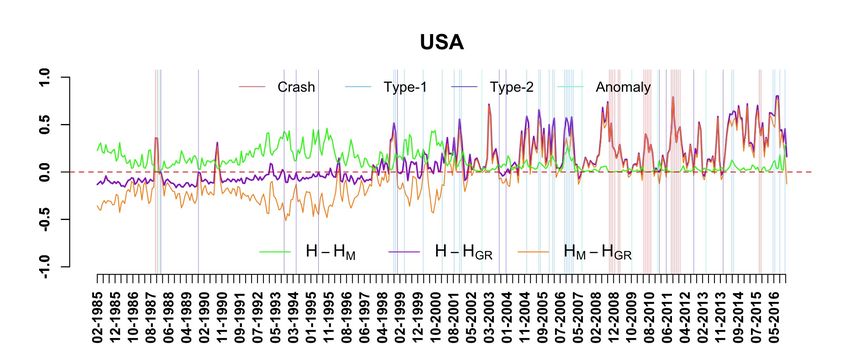
The correlation matrix of size N × N will have N eigenvalues, say {λ1 , ..., λN }, which may be arranged in descending
order of magnitude. Then the maximum eigenvalue λ1 = λmax of the correlation matrix C, corresponds to a market mode
CM that reflects the aggregate dynamics of the market common across all stocks, and strongly correlated to the mean market
correlation µ. The group modes CG capture the sectoral behavior of the market, which are next few eigenvalues subsequent to
the largest eigenvalue of the correlation matrix. Remaining eigenvalues capture the random modes CR of the market. By using
the eigenvalue decomposition, we can thus filter the true correlations (coming from the signal) and the spurious correlations
(coming from the random noise). Therefore, we may decompose the aggregate correlation matrix as C = ∑Ni=1 λi |ei i hei |, where
λi and |ei i are the eigenvalues and eigenvectors, respectively. Traditionally, one decomposes the matrix into three separate
components, viz., market mode CM , the group modes CG and the random modes CR , as shown in Fig. 2:

      C    = CM +CG +CR ,                                                                                                        (1)
                                NG                   N
           = λ1 |e1 i he1 | + ∑ λi |ei i hei | +     ∑       λi |ei i hei | ,
                               i=2                 i=NG +1

                                                                                                    2
where NG is the number of eigenvalues that satisfy the constraint λ+ ≤ λG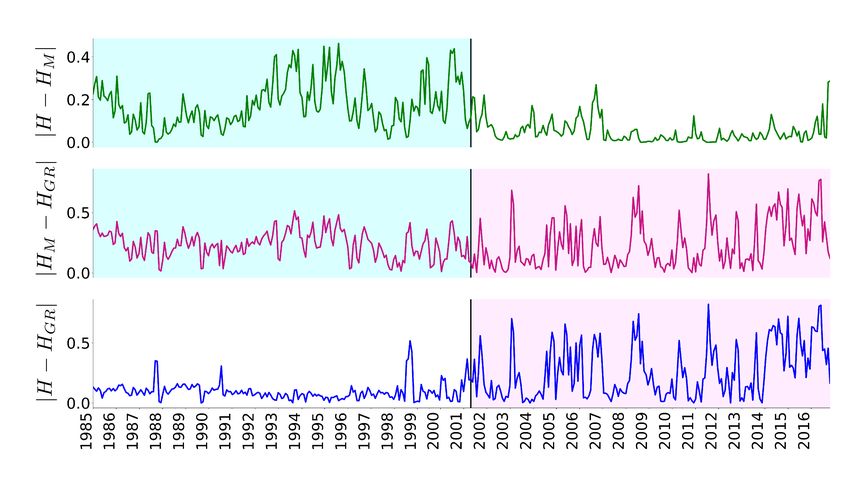
b c
Figure 3. Phase separation, order-disorder transitions and scaling behavior. Panels a-b show plots of |H − HM | and
|H − HGR | for S&P-500 and Nikkei-225 markets, respectively, where the events show clear phase separation with
order-disorder transitions (red dash-dot line connecting sequence of events around a crash, and blue dash-dot line connecting
sequence of events around a bubble). Panel c plots H − HM versus mean market correlation µ for both markets (Inset: The
same in linear-logarithmic scale). The data-collapse indicates a scaling behavior. For all panels, the black stars represent WOE.
Fig. S4a, c; Supplementary Videos 1, 2). We found that many anomalies occurred just around the major crashes and intriguing
patterns (termed as interesting events of type-1 and type-2, belonging to two distinct regions in the phase space) appeared. The
crashes occupy the region in the phase space, where H − HM ' 0. During the crashes, the H and HM almost touch the maximum
disorder, ln N (corresponding to the random WOE). The events like ‘Dot-com bubble’ that appear in the H − HGR ' 0 axis
are termed as interesting events of type-1. The events which lie far away from the origin and both the axes, are termed as
interesting events of type-2, which include frames with exogenous shocks (like Hurricane Katrina, etc.). The events lying close
to the origin are like anomalies happening right before or right after major crashes.
The above interesting features led us to try the transformed variables |H − HM | and |H − HGR | as independent coordinates
of phase space. Very interestingly, as evident from Figure 3a, b, the event frames show clear phase separation– anomalies
(green region), crashes (red region), normal (grey), type-1 (light blue region) and type-2 (deep blue region), for both S&P-500
and Nikkei-225 markets. The order-disorder transitions– normal (at the central region) to near-critical phases (at the peripheral
regions) are intriguing. We have also studied in detail the sequence of seven frames (three frames before, the event (in black),
and three frames after) to follow the order-disorder transitions (SI Figs. S5, S6) in cases of major crashes and bubbles (SI
Table S1). The similar nature of the order-disorder transitions in all the major crashes and Dot-com bubbles, ten events in USA
and thirteen events in JPN, certainly indicate robustness of the method. Moreover, we found that (H − HM ) ∼ α exp(−β µ),
where α and β are constants (see Fig. 3c for USA and JPN). We found that the best-fit line yields α ' 0.85 ± 0.03 and
β ' −10.22 ± 0.25; adjusted R2 = 0.95. Interestingly, the market event frames segregate into different portions, interspersed
by the normal events. This data-collapse on a single curve indicates a scaling behavior30 , which implies that the co-movements
in price returns for different financial assets and varying across countries are governed by the same statistical law– certainly
non-trivial and striking behavior! This suggests that markets have an inherent structure that remains pretty invariant– it has
an average structure with fluctuations (dispersion). The dispersion around the average behavior is slightly more in JPN than
USA. The phase properties are found to be pretty robust, though the phase boundaries are not very sharp (and may depend
on the parameters like window choice, shift, etc.; SI Fig. S1, S2). All frames in a certain phase have very similar properties
(hierarchies in ranks of stocks) and can be averaged over to represent a certain phase (SI Fig. S7). The properties remain
similar across different markets (USA and JPN) and across various periods of time. In all the panels, the black stars signify
results for WOE, which has no inherent structure (see SI Figs. S3, S7). One could also simulate (to be reported elsewhere)
various correlation structures from a correlated WOE with the mean correlation as tuning parameter. The non-trivial inherent
market structure (sectors or communities) plays a crucial role in the observed scaling behavior. We also observed from the
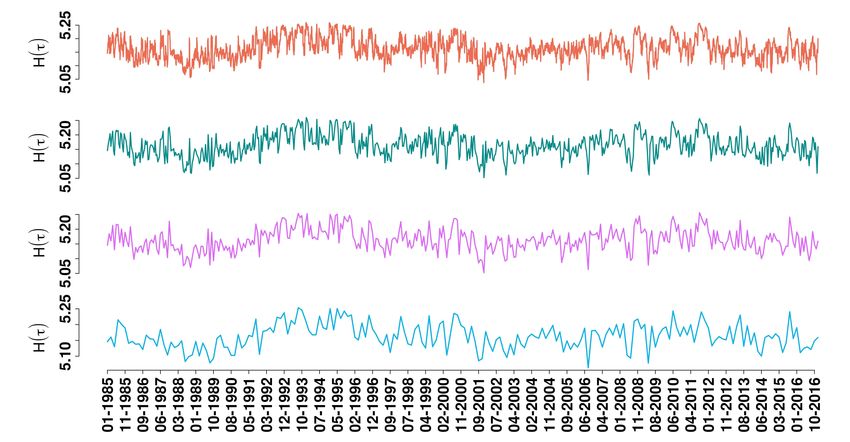
evolution of the variables |H − HM |,|HM − HGR| and |H − HGR | (Fig. 4), and other market indicators (SI Figs. S8 and S9) that
the market behavior has changed radically after 2002 (USA) and 1990 (JPN) corroborating the findings of our earlier work17 .
Finally, the functional − ln(H − HM ) is found to act as a good gauge of the market characteristic (µ) and market fear (V IX)
(Fig. 5). There exist significant and non-trivial correlations between these variables, and the other market indicators (SI
Fig. S10). Hence, this functional − ln(H − HM ) can serve as a very good generic indicator.
Discussions.— We emphasize that our eigen-entropy measure has a few advantages–uniquely determined, non-arbitrary,
computational cheap (low complexity), when compared to existing methods, e.g., structural entropy25 . Note that the structural
entropy (or any other network-based entropy measures) is very sensitive to the community structure and construction of the
network. An algorithm23 involves identifying the group mode from the correlation matrix, which may be hard and non-arbitrary
(the boundary determined by the eigenvalues of the correlation matrix is not sharp). Finally, we reiterate that this type of
6/27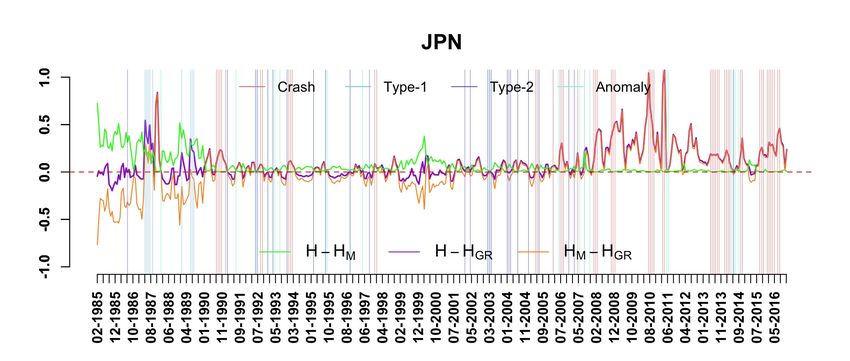
Figure 4. Evolution of S&P-500 market. Plots of: (Top to Bottom) |H − HM |,|HM − HGR| and |H − HGR |. The blue and pink
bands show time-periods over which the variables display high correlations (∼ 0.71 and ∼ 0.96, respectively).

Figure 5. Evolution of S&P-500 market indicators. Plots of: (Top to Bottom) index returns r, volatility index (V IX), mean
market correlation µ and the functional − ln(H − HM ), for 1990-2016. Light blue bands are representative critical periods (see
SI Table S3).

                                                                                                                          7/27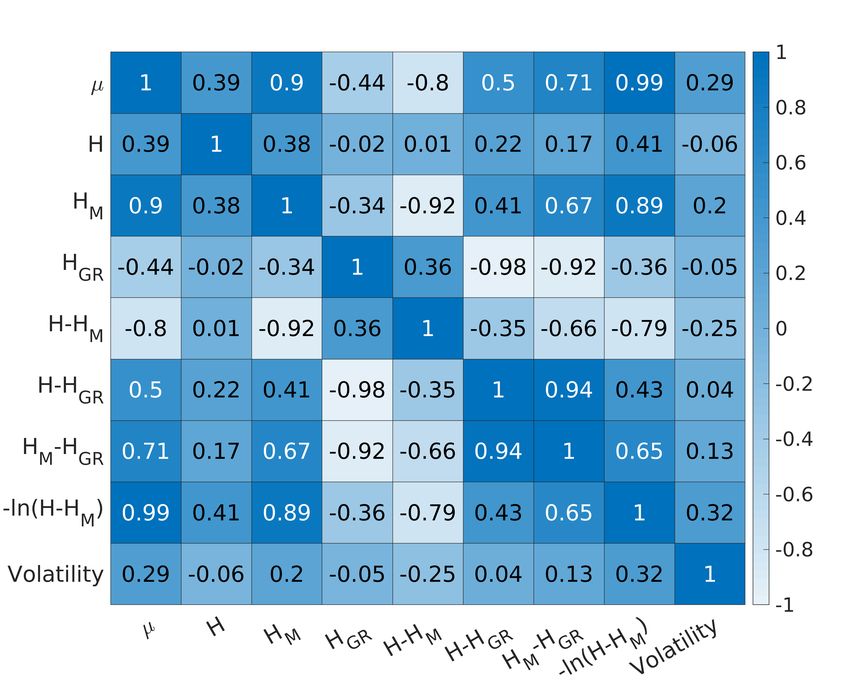
phase separation behavior has never been recorded for financial markets; it is very distinct from the two-phase behavior in
financial markets reported earlier by Plerou et al.35 . The data collapse certainly suggests that the fluctuations in price returns
for different financial assets, varying across countries, economic sectors and market parameters, are governed by the same
statistical law. This scaling behavior may motivate us to do further research as to determine which market forces are responsible
for driving the market or are important for determining the price co-movements and correlations. In addition, this may lead to
a foundation for understanding scaling in a broader context, and providing us with altogether new concepts not anticipated
previously. Our proposed methodology may further help us to understand the market events and their dynamics, as well as
find the time-ordering and appearances of the bubbles (formations or bursts) and crashes, separated by normal periods. This
methodology may be generalized and used in other complex systems (to be reported elsewhere) to understand and foresee
tipping points and fluctuation patterns.

Acknowledgements
The authors are grateful to A.S. Chakrabarti, F. Leyvraz and T.H. Seligman for their critical inputs and suggestions. H.K.P. is
grateful for financial support provided by UNAM-DGAPA and CONACYT Proyecto Fronteras 952. A.C. and K.S. acknowledge
support from the project UNAM-DGAPA-PAPIIT AG 100819 and CONACyT Project FRONTERAS 201.

References
 1. Altman, R. C. The great crash, 2008. Foreign Aff. 88, 1 (2009).
 2. Sharma, K., Gopalakrishnan, B., Chakrabarti, A. S. & Chakraborti, A. Financial fluctuations anchored to economic
    fundamentals: A mesoscopic network approach. Scientific Reports 7, 8055 (2017).
 3. Sharma, K., Chakrabarti, A. S. & Chakraborti, A. Multi-layered network structure: Relationship between financial and
    macroeconomic dynamics. In New Perspectives and Challenges in Econophysics and Sociophysics, 117–131 (Springer,
    2019).
 4. Chakrabarti, A. S., Chakraborti, A. & Upmanyu, S. Macroeconomic and financial networks: review of some recent
    developments in parametric and non-parametric approaches (Proceedings of the International Conference of Game Theory
    and Networks-ICGTN 2019, Eds: Borkotokey et al., 2020). URL https://ssrn.com/abstract=3557742.
 5. Boccara, N. Modeling complex systems (Springer Science & Business Media, 2010).
 6. Foote, R. Mathematics and complex systems. Science 318, 410–412 (2007).
 7. Sornette, D. Why stock markets crash: Critical events in complex financial systems (Princeton University Press, 2004).
 8. Stanley, H. E. Phase transitions and critical phenomena (Clarendon Press, Oxford, 1971).
 9. Sethna, J. Statistical mechanics: Entropy, order parameters, and complexity, vol. 14 (Oxford University Press, 2006).
10. Goldenfeld, N. Lectures on phase transitions and the renormalization group (CRC Press, 2018).
11. Goldenfeld, N. & Kadanoff, L. P. Simple lessons from complexity. Science 284, 87–89 (1999).
12. Arthur, W. B. Complexity and the economy. Science 284, 107–109 (1999).
13. Mantegna, R. N. & Stanley, H. E. An introduction to econophysics: Correlations and complexity in finance (Cambridge
    University Press, Cambridge, 2007).
14. Bouchaud, J.-P. & Potters, M. Theory of financial risk and derivative pricing: From statistical physics to risk management
    (Cambridge University Press, 2003).
15. Sinha, S., Chatterjee, A., Chakraborti, A. & Chakrabarti, B. K. Econophysics: An introduction (John Wiley & Sons, 2010).
16. Chakraborti, A., Muni Toke, I., Patriarca, M. & Abergel, F. Econophysics review: I. empirical facts. Quantitative Finance
    11, 991–1012 (2011).
17. Pharasi, H. K. et al. Identifying long-term precursors of financial market crashes using correlation patterns. New Journal
    of Physics 20, 103041 (2018).
18. Pharasi, H. K., Sharma, K., Chakraborti, A. & Seligman, T. H. Complex market dynamics in the light of random matrix
    theory. In New Perspectives and Challenges in Econophysics and Sociophysics, 13–34 (Springer International Publishing,
    Cham, 2019).
19. Bonanno, G., Caldarelli, G., Lillo, F. & Mantegna, R. N. Topology of correlation-based minimal spanning trees in real and
    model markets. Physical Review E 68, 046130 (2003).

                                                                                                                              8/27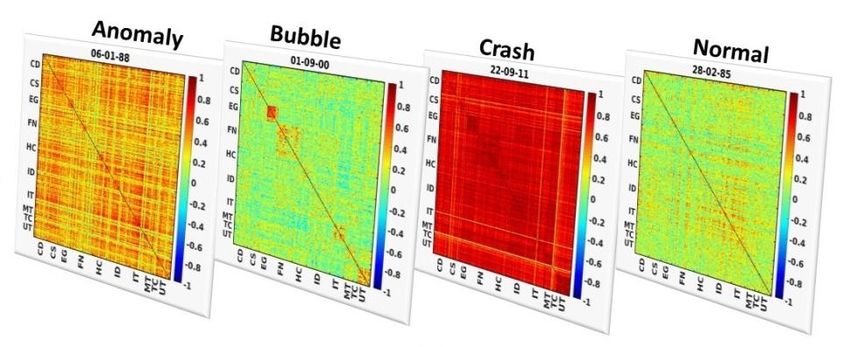
20. Onnela, J.-P., Chakraborti, A., Kaski, K., Kertesz, J. & Kanto, A. Dynamics of market correlations: Taxonomy and
    portfolio analysis. Physical Review E 68, 056110 (2003).
21. Tumminello, M., Lillo, F. & Mantegna, R. N. Correlation, hierarchies, and networks in financial markets. Journal of
    Economic Behavior & Organization 75, 40–58 (2010).
22. Fortunato, S. Community detection in graphs. Physics Reports 486, 75–174 (2010).
23. MacMahon, M. & Garlaschelli, D. Community detection for correlation matrices. Physical Review X 5, 021006 (2015).
24. Barabási, A.-L. Network Science (Cambridge University Press, Cambridge, 2016).
25. Almog, A. & Shmueli, E. Structural entropy: Monitoring correlation-based networks over time with application to financial
    markets. Scientific Reports 9, 10832 (2019).
26. Kuyyamudi, C., Chakrabarti, A. S. & Sinha, S. Emergence of frustration signals systemic risk. Physical Review E 99,
    052306 (2019).
27. Fan, Y. et al. Lifespan development of the human brain revealed by large-scale network eigen-entropy. Entropy 19, 471
    (2017).
28. Mazurin, O. V. & Porai-Koshits, E. Phase separation in glass (Elsevier, 1984).
29. Poole, P. H., Sciortino, F., Essmann, U. & Stanley, H. E. Phase behaviour of metastable water. Nature 360, 324 (1992).
30. Stanley, H. E. Scaling, universality, and renormalization: Three pillars of modern critical phenomena. Reviews of Modern
    Physics 71, S358 (1999).
31. Volatility index (vix). https://en.wikipedia.org/wiki/VIX (2020). Accessed on 7th July, 2019.
32. Sandhu, R. S., Georgiou, T. T. & Tannenbaum, A. R. Ricci curvature: An economic indicator for market fragility and
    systemic risk. Science Advances 2, e1501495 (2016).
33. Markowitz, H. Portfolio selection. The Journal of Finance 7, 77–91 (1952).
34. Chakraborti, A. et al. Emerging spectra characterization of catastrophic instabilities in complex systems. New Journal of
    Physics 22, 063043 (2020).
35. Plerou, V., Gopikrishnan, P. & Stanley, H. E. Two-phase behaviour of financial markets. Nature 421, 130 (2003).
36. Japan ends zero-rate policy. https://www.ft.com/content/902a0d58-12f0-11db-aecf-0000779e2340/
    (2020). Accessed on 20th July, 2020.
37. Wall st. soars on fed move. https://money.cnn.com/2001/04/18/markets/markets_newyork/ (2020).
    Accessed on 20th July, 2020.
38. Reszat, B. Japan’s financial markets: The lost decade (2003).
39. Hayashi, F. & Prescott, E. C. The 1990s in japan: A lost decade. Review of Economic Dynamics 5, 206–235 (2002).
40. List of stock market crashes and bear markets. https://en.wikipedia.org/wiki/List_of_stock_
    market_crashes_and_bear_markets (2019). Accessed on 7th July, 2019.
41. Bull markets. https://bullmarkets.co/u-s-stock-market-in-1996/ (2019). Accessed on 7th July,
    2019.
42. United states housing bubble. https://en.wikipedia.org/wiki/United_States_housing_bubble
    (2019). Accessed on 7th July, 2019.
43. A   short history of stock market  crashes.       https://www.cnbc.com/2016/08/24/
    a-short-history-of-stock-market-crashes.html (2019). Accessed on 7th July, 2019.
44. Stock market selloff. https://en.wikipedia.org/wiki/2015-16_stock_market_selloff (2019). Ac-
    cessed on 7th July, 2019.

Supplementary Information
Two videos showing the continuous monitoring of the correlation patterns (C, CM and CGR ) along with their corresponding
eigen-centralities (ranked), entropy measures and positions of the correlation frame in the phase separation diagrams for USA
(SI Video 1) and JPN (SI Video 2), respectively, are uploaded.
    Video 1 Legend: Continuous monitoring of the correlation patterns (C, CM and CGR ) along with their corresponding eigen-
centralities (ranked), entropy measures and positions of the correlation frame in the phase separation diagrams for USA. Link

                                                                                                                        9/27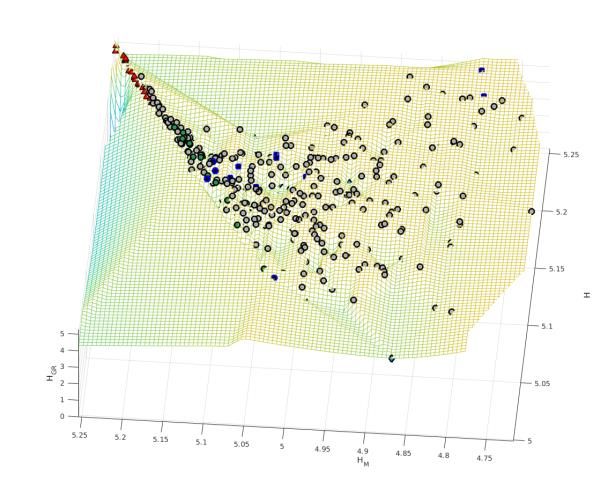
to high resolution video: https://drive.google.com/file/d/1VIdfo9LnB-grHxloq8BmUJ5jYyVYH50c/
view?usp=sharing
    Video 2 Legend: Continuous monitoring of the correlation patterns (C, CM and CGR ) along with their corresponding eigen-
centralities (ranked), entropy measures and positions of the correlation frame in the phase separation diagrams for JPN. Link
to high resolution video: https://drive.google.com/file/d/1gcOYT1QR51nrqRCTp4XLDhJEM1QDCFPu/
view?usp=sharing

Data
We have used the adjusted closure price time series for United States of America (USA) S&P-500 index and Japan (JPN)
Nikkei-225 index, for the period 02-01-1985 to 30-12-2016, from the Yahoo finance database (https://finance.yahoo.co.jp/;
accessed on 7th July, 2017). USA has data for the N = 194 stocks and the period 02-01-1985 to 30-12-2016 (T = 8068 days).
JPN has data for the N = 165 stocks and the period 04-01-1985 to 30-12-2016 (T = 7998 days). Note that we have included
those stocks in our analyses, which are present in the data for the entire duration, and added zero return entries corresponding
to the missing days.
    The list of stocks (along with the sectors) for the two markets are given in Tables S1 and S2. The sectoral abbreviations are
given below:
CD – Consumer Discretionary;
CS – Consumer Staples;
EG – Energy;
FN – Financial;
HC – Health Care;
ID – Industrials;
IT – Information Technology;
MT – Materials;
TC – Telecommunication Services; and
UT – Utilities.

Methodology
Effects of the variation of the epoch size M and shift ∆
The continuous monitoring of the market can be done by dividing the total time series data into smaller epochs of size M.
The corresponding correlation matrices generated from these smaller epochs are used for calculating the eigen-entropy H. In
Fig. S1, we investigate the effects of the variation of parameters, epoch size M and shift ∆. We have observed that either the
increase in the epoch M or shift ∆ makes the time series plot of H more smooth (fewer fluctuations), and vice versa. The choice
of these parameters are thus arbitrary to some extent, depending on the research questions and time scale we are interested.
Effects of the variation in the element-wise powers of correlation matrices |C|n
Instead of taking the square of individual elements of the correlation matrix C, to make all the elements non-negative, we can
also use the even powers or the odd powers of absolute values to accomplish the same. The effect of the same is shown in
Fig. S2. As observed the values of eigen-entropy H differ with the variation of the power n of correlation matrices. This is due
to the fact that with the increase in power, the dissimilarities in the elements of the correlation matrix are amplified, which
will then in turn change the centrality of the matrix. For very high powers of n the transformed correlation matrices will act
like an adjacency matrix with very high values (close to 1) and very low values (close to 0). It is also interesting to note that,
depending on the problem, we can decide the range of correlations to focus on by adjusting the power of the elements of the
correlation matrix.

Results
Correlation matrix decomposition and Wishart orthogonal ensemble Results
Fig. S3a shows the plot of sorted eigen-centralities pi against rank, computed from the normalized eigenvectors corresponding
to the maximum eigenvalues for 1000 independent realizations of a Wishart orthogonal ensemble (WOE). Filled black squares
represent the mean eigen-centralities computed from 1000 independent realizations of the WOE, that serves as a reference
(the maximum disorder or randomness) in the market correlation with N = 194. Fig. S3b shows the plot of the variation of
eigen-entropy H as a function of system size (correlation matrix size) N, where each point represents a mean computed from
1000 independent realizations of a WOE. The theoretical curve (red dash) shows the variation ∼ ln N.
Phase space construction and phase separation
Figure S4 shows evolution of relative-entropies [H − HM , H − HGR , and HM − HGR ] and phase separation. The characterized
events Fig. S4b, d are indicated as vertical lines in the time-evolution plots Fig. S4a, c (also see Supplementary Videos 1, 2).

                                                                                                                           10/27
We found that many anomalies occurred just around the major crashes and intriguing patterns (termed as interesting events of
type-1 and type-2, belonging to two distinct regions in the phase space) appeared.
Study of critical events
For the events listed in Table S3, we look at the frames around that particular event and see how it moves around in the phase
space in Fig. S5 and Fig. S6. We used a rolling mean and rolling standard deviation to study the standardized eigen-entropies
[H Std , HM
Std and H Std ]. The sequence of seven frames (three frames before, the event (in black), and three frames after) displayed
GR
order-disorder transitions in cases of major crashes and bubbles. The similar nature of the order-disorder transitions in all the
major crashes and Dot-com bubbles, ten events in USA and thirteen events in JPN, certainly indicate robustness of the method.
Once we are able to characterize the epochs (event frames) into different “phases”, we can create the different ensembles
of anomalies, type-1 events, type-2 events, crashes and normal events. For each type of event, we find that eigen-centralities
have distinct ranges of values and the sorted eigen-centrality curves have interesting features (hierarchies) in the eigenmodes.
The eigen-entropies actually quantify these features appropriately. For the S&P-500 and Nikkei-225 markets, we compute
the histograms of the eigen-centralities pi . Fig. S7 shows the histograms (for S&P-500 (Top) and Nikkei-225 (Bottom)) for
all the characterized anomalies (green circles), type-1 events (light blue diamonds), type-2 events (blue squares), crashes
(red triangles), normal events (grey stars), averaged over the respective ensembles, for the full/decomposed matrices. For
comparison, we also plot the results for the WOE (black squares). This helps us understand what actually happens in the market,
during these different types of events (phases) and what type of hierarchies exist within the stocks’s eigen-centralities. This
would shed new light into the understanding of formation of type-1 events, their development and crashes, etc.
Cross-correlogram of the market indicators
We have studied the time evolution of several market indicators of USA and JPN markets, shown in Figs. S8 and S9, respectively,
that can be used for the continuous monitoring of the financial markets. The corresponding cross-correlograms of the market
indicators are plotted for USA and JPN in Fig. S10. Note that in JPN market, only once H − HM takes a negative value (ignored
while plotting); interestingly, this coincides with the period when Japan ended zero-rate policy on 14 − 07 − 200636 .
a b
i i
ii ii
iii iii
iv iv
c d
i i
ii ii
iii iii
iv iv
Figure S1. Effects of epoch size M and shift ∆ on the time series of eigen-entropy H. The evolution of eigen-entropy H
is calculated from correlation matrices corresponding to four different time epochs (a) M = 200, (b) M = 100, (c) M = 40, and
(d) M = 20 days and each with four different shifts (i) ∆ = 1 day, (ii) ∆ = 10 days, (iii) ∆ = 20 days, and (iv) ∆ = 40 days over a
period of 1985-2016. The fluctuations (local) of the eigen-entropy H are smoothened (smaller) for bigger shifts ∆.
11/27a b
Figure S2. Comparison of the variation of n for |C|n . The eigen-entropy H is calculated for different powers n of
correlation matrix C by raising the elements of C to even powers or the absolute value of C to odd powers. (a) shows the time
series of the eigen-entropies H of the correlation matrices of epoch M = 40 days and ∆ = 20 days for five different powers upto
n = 5. The correlations among these five time series of eigen-entropy H is shown in (b).
a b
Figure S3. Eigen-centralities (ranks) and eigen-entropy. (a) Plots of sorted eigen-centralities pi against rank, computed
from the normalized eigenvectors corresponding to the maximum eigenvalues for 1000 independent realizations of the WOE.
Filled black squares represent the mean eigen-centralities computed from 1000 independent realizations of the WOE, that
serves as a reference (the maximum disorder or randomness) in the market correlation with N = 194. (b) Plot shows the
variation of eigen-entropy H as a function of system size (correlation matrix size) N, where each point represents a mean
computed from 1000 independent realizations of a WOE. The theoretical curve (red dash) shows the variation ∼ ln N.
12/27a b
c d
Figure S4. Evolution and phase separation of relative-entropies. For (a) S&P-500 and (c) Nikkei-225 markets, the
relative-entropies H − HM , H − HGR , & HM − HGR are evaluated from full, market and group-random mode to characterize and
identify the different market events as anomalies, type-1 events, type-2 events, crashes and normal periods. Phase separation.
The 3D-plots of the phase space using relative-entropies H − HM , H − HGR , & HM − HGR , for (b) S&P-500, and (d)
Nikkei-225 markets. The event frames show “phase separation” – segregation of different market events: anomalies, type-1
events, type-2 events, crashes and normal. Note that all the points (market events) actually lie on a plane (see surface-grid).
13/27Figure S5. Evolution around the important events in USA market. Eigen-entropy H calculated from the correlation
matrices: full C, market mode CM and group-random mode CGR for all the frames (epoch M = 40 days and shift ∆ = 20 days)
over a period of 1985-2016 of USA (S&P-500). After standardizing the variables with moving average and moving standard
deviation, each frame (grey dot) is embedded in a 3-D space with axes H std , HMstd and H std . Ten important events each with
GR
seven frames around these important events (three before and three after the event) were taken from the history and shown in
the plots. Critical events are marked with red lines except for the Dot-com bubble burst which is marked with blue line. The
frame containing the important event is marked with black circle for better visibility.
14/27Figure S6. Evolution around the important events in JPN market. Eigen-entropy H calculated from the correlation
matrices: full C, market mode CM and group-random mode CGR for all the frames (epoch M = 40 days and shift ∆ = 20 days)
over a period of 1985-2016 of JPN (Nikkei-225). Three co-ordinates axes H std , HM std and H std are the standardized variables,
GR
same as Fig. S5. Plots show thirteen important events from history. Critical events are marked with red lines except for the
Dot-com bubble burst which is marked with blue line. The frame containing the important event is marked with black circle for
better visibility. 15/27a b c
d e f
Figure S7. Averaged distributions of the eigen-centralities, showing self-averaging properties. Histograms of the
eigen-centralities pi for anomalies (green circles), type-1 events (light blue diamonds), type-2 events (blue sqaures), crashes
(red triangles) and normal (grey stars) and WOE (black squares), averaged over the respective ensembles for USA (top row)
and for JPN (bottom row). Histograms are evaluated using (a and d) full correlation matrices C and decomposed correlation
matrices of (b and e) market mode CM , and (c and f) group and random mode CGR .
16/27Figure S8. Temporal evolution of the USA market indicators. Market behaves differently before and after the vertical
dash line at April 200137 .
17/27Figure S9. Temporal evolution of the JPN market indicators. Market behaves differently before and after the vertical
dash line at Feb 199038, 39 .
18/27a b
Figure S10. Cross-correlograms of the market indicators. For (a) USA and (b) JPN.
19/27Table S1. List of all stocks of USA market (S&P-500) considered for the analysis. The first column has the serial number, the
second column has the abbreviation, the third column has the full name of the stock, and the fourth column specifies the sector
as given in the S&P-500.
S.No. Code Company Name Sector Abbrv
1 CMCSA Comcast Corp. Consumer Discretionary CD
2 DIS The Walt Disney Company Consumer Discretionary CD
3 F Ford Motor Consumer Discretionary CD
4 GPC Genuine Parts Consumer Discretionary CD
5 GPS Gap Inc. Consumer Discretionary CD
6 GT Goodyear Tire & Rubber Consumer Discretionary CD
7 HAS Hasbro Inc. Consumer Discretionary CD
8 HD Home Depot Consumer Discretionary CD
9 HRB Block H&R Consumer Discretionary CD
10 IPG Interpublic Group Consumer Discretionary CD
11 JCP J. C. Penney Company, Inc. Consumer Discretionary CD
12 JWN Nordstrom Consumer Discretionary CD
13 LEG Leggett & Platt Consumer Discretionary CD
14 LEN Lennar Corp. Consumer Discretionary CD
15 LOW Lowe’s Cos. Consumer Discretionary CD
16 MAT Mattel Inc. Consumer Discretionary CD
17 MCD McDonald’s Corp. Consumer Discretionary CD
18 NKE Nike Consumer Discretionary CD
19 SHW Sherwin-Williams Consumer Discretionary CD
20 TGT Target Corp. Consumer Discretionary CD
21 VFC V.F. Corp. Consumer Discretionary CD
22 WHR Whirlpool Corp. Consumer Discretionary CD
23 ADM Archer-Daniels-Midland Co Consumer Staples CS
24 AVP Avon Products, Inc. Consumer Staples CS
25 CAG Conagra Brands Consumer Staples CS
26 CL Colgate-Palmolive Consumer Staples CS
27 CPB Campbell Soup Consumer Staples CS
28 CVS CVS Health Consumer Staples CS
29 GIS General Mills Consumer Staples CS
30 HRL Hormel Foods Corp. Consumer Staples CS
31 HSY The Hershey Company Consumer Staples CS
32 K Kellogg Co. Consumer Staples CS
33 KMB Kimberly-Clark Consumer Staples CS
34 KO Coca-Cola Company (The) Consumer Staples CS
35 KR Kroger Co. Consumer Staples CS
36 MKC McCormick & Co. Consumer Staples CS
37 MO Altria Group Inc Consumer Staples CS
38 SYY Sysco Corp. Consumer Staples CS
39 TAP Molson Coors Brewing Company Consumer Staples CS
40 TSN Tyson Foods Consumer Staples CS
41 WMT Wal-Mart Stores Consumer Staples CS
42 APA Apache Corporation Energy EG
43 COP ConocoPhillips Energy EG
44 CVX Chevron Corp. Energy EG
45 ESV Ensco plc Energy EG
46 HAL Halliburton Co. Energy EG
47 HES Hess Corporation Energy EG
48 HP Helmerich & Payne Energy EG
49 MRO Marathon Oil Corp. Energy EG
50 MUR Murphy Oil Corporation Energy EG
20/2751 NBL Noble Energy Inc Energy EG
52 NBR Nabors Industries Ltd. Energy EG
53 SLB Schlumberger Ltd. Energy EG
54 TSO Tesoro Corp Energy EG
55 VLO Valero Energy Energy EG
56 WMB Williams Cos. Energy EG
57 XOM Exxon Mobil Corp. Energy EG
58 AFL AFLAC Inc Financials FN
59 AIG American International Group, Inc. Financials FN
60 AON Aon plc Financials FN
61 AXP American Express Co Financials FN
62 BAC Bank of America Corp Financials FN
63 BBT BB&T Corporation Financials FN
64 BEN Franklin Resources Financials FN
65 BK The Bank of New York Mellon Corp. Financials FN
66 C Citigroup Inc. Financials FN
67 CB Chubb Limited Financials FN
68 CINF Cincinnati Financial Financials FN
69 CMA Comerica Inc. Financials FN
70 EFX Equifax Inc. Financials FN
71 FHN First Horizon National Corporation Financials FN
72 HBAN Huntington Bancshares Financials FN
73 HCN Welltower Inc. Financials FN
74 HST Host Hotels & Resorts, Inc. Financials FN
75 JPM JPMorgan Chase & Co. Financials FN
76 L Loews Corp. Financials FN
77 LM Legg Mason, Inc. Financials FN
78 LNC Lincoln National Financials FN
79 LUK Leucadia National Corp. Financials FN
80 MMC Marsh & McLennan Financials FN
81 MTB M&T Bank Corp. Financials FN
82 PSA Public Storage Financials FN
83 SLM SLM Corporation Financials FN
84 TMK Torchmark Corp. Financials FN
85 TRV The Travelers Companies Inc. Financials FN
86 USB U.S. Bancorp Financials FN
87 VNO Vornado Realty Trust Financials FN
88 WFC Wells Fargo Financials FN
89 WY Weyerhaeuser Corp. Financials FN
90 ZION Zions Bancorp Financials FN
91 ABT Abbott Laboratories Health Care HC
92 AET Aetna Inc Health Care HC
93 AMGN Amgen Inc Health Care HC
94 BAX Baxter International Inc. Health Care HC
95 BCR Bard (C.R.) Inc. Health Care HC
96 BDX Becton Dickinson Health Care HC
97 BMY Bristol-Myers Squibb Health Care HC
98 CAH Cardinal Health Inc. Health Care HC
99 CI CIGNA Corp. Health Care HC
100 HUM Humana Inc. Health Care HC
21/27101 JNJ Johnson & Johnson Health Care HC
102 LLY Lilly (Eli) & Co. Health Care HC
103 MDT Medtronic plc Health Care HC
104 MRK Merck & Co. Health Care HC
105 MYL Mylan N.V. Health Care HC
106 SYK Stryker Corp. Health Care HC
107 THC Tenet Healthcare Corp Health Care HC
108 TMO Thermo Fisher Scientific Health Care HC
109 UNH United Health Group Inc. Health Care HC
110 VAR Varian Medical Systems Health Care HC
111 AVY Avery Dennison Corp Industrials ID
112 BA Boeing Company Industrials ID
113 CAT Caterpillar Inc. Industrials ID
114 CMI Cummins Inc. Industrials ID
115 CSX CSX Corp. Industrials ID
116 CTAS Cintas Corporation Industrials ID
117 DE Deere & Co. Industrials ID
118 DHR Danaher Corp. Industrials ID
119 DNB The Dun & Bradstreet Corporation Industrials ID
120 DOV Dover Corp. Industrials ID
121 EMR Emerson Electric Company Industrials ID
122 ETN Eaton Corporation Industrials ID
123 EXPD Expeditors International Industrials ID
124 FDX FedEx Corporation Industrials ID
125 FLS Flowserve Corporation Industrials ID
126 GD General Dynamics Industrials ID
127 GE General Electric Industrials ID
128 GLW Corning Inc. Industrials ID
129 GWW Grainger (W.W.) Inc. Industrials ID
130 HON Honeywell Int’l Inc. Industrials ID
131 IR Ingersoll-Rand PLC Industrials ID
132 ITW Illinois Tool Works Industrials ID
133 JEC Jacobs Engineering Group Industrials ID
134 LMT Lockheed Martin Corp. Industrials ID
135 LUV Southwest Airlines Industrials ID
136 MAS Masco Corp. Industrials ID
137 MMM 3M Company Industrials ID
138 ROK Rockwell Automation Inc. Industrials ID
139 RTN Raytheon Co. Industrials ID
140 TXT Textron Inc. Industrials ID
141 UNP Union Pacific Industrials ID
142 UTX United Technologies Industrials ID
143 AAPL Apple Inc. Information Technology IT
144 ADI Analog Devices, Inc. Information Technology IT
145 ADP Automatic Data Processing Information Technology IT
146 AMAT Applied Materials Inc Information Technology IT
147 AMD Advanced Micro Devices Inc Information Technology IT
148 CA CA, Inc. Information Technology IT
149 HPQ HP Inc. Information Technology IT
150 HRS Harris Corporation Information Technology IT
22/27151 IBM International Business Machines Information Technology IT
152 INTC Intel Corp. Information Technology IT
153 KLAC KLA-Tencor Corp. Information Technology IT
154 LRCX Lam Research Information Technology IT
155 MSI Motorola Solutions Inc. Information Technology IT
156 MU Micron Technology Information Technology IT
157 TSS Total System Services, Inc. Information Technology IT
158 TXN Texas Instruments Information Technology IT
159 WDC Western Digital Information Technology IT
160 XRX Xerox Corp. Information Technology IT
161 AA Alcoa Corporation Materials MT
162 APD Air Products & Chemicals Inc Materials MT
163 BLL Ball Corp Materials MT
164 BMS Bemis Company, Inc. Materials MT
165 CLF Cleveland-Cliffs Inc. Materials MT
166 DD DuPont Materials MT
167 ECL Ecolab Inc. Materials MT
168 FMC FMC Corporation Materials MT
169 IFF Intl Flavors & Fragrances Materials MT
170 IP International Paper Materials MT
171 NEM Newmont Mining Corporation Materials MT
172 PPG PPG Industries Materials MT
173 VMC Vulcan Materials Materials MT
174 CTL CenturyLink Inc Telecommunication Services TC
175 FTR Frontier Communications Corporation Telecommunication Services TC
176 S Sprint Nextel Corp. Telecommunication Services TC
177 T AT&T Inc Telecommunication Services TC
178 VZ Verizon Communications Telecommunication Services TC
179 AEP American Electric Power Utilities UT
180 CMS CMS Energy Utilities UT
181 CNP CenterPoint Energy Utilities UT
182 D Dominion Energy Utilities UT
183 DTE DTE Energy Co. Utilities UT
184 ED Consolidated Edison Utilities UT
185 EIX Edison Int’l Utilities UT
186 EQT EQT Corporation Utilities UT
187 ETR Entergy Corp. Utilities UT
188 EXC Exelon Corp. Utilities UT
189 NEE NextEra Energy Utilities UT
190 NI NiSource Inc. Utilities UT
191 PNW Pinnacle West Capital Utilities UT
192 SO Southern Co. Utilities UT
193 WEC Wec Energy Group Inc Utilities UT
194 XEL Xcel Energy Inc Utilities UT
23/27Table S2. List of all stocks of Japan market (Nikkei-225) considered for the analysis. The first column has the serial number,
the second column has the abbreviation, the third column has the full name of the stock, and the fourth column specifies the
sector as given in the Nikkei-225.
S.No. Code Company Name Sector Abbrv
1 S-8801 MITSUI FUDOSAN CO., LTD. Capital Goods CG
2 S-8802 MITSUBISHI ESTATE CO., LTD. Capital Goods CG
3 S-8804 TOKYO TATEMONO CO., LTD. Capital Goods CG
4 S-8830 SUMITOMO REALTY & DEVELOPMENT CO., LTD. Capital Goods CG
5 S-7003 MITSUI ENG. & SHIPBUILD. CO., LTD. Capital Goods CG
6 S-7012 KAWASAKI HEAVY IND., LTD. Capital Goods CG
7 S-9202 ANA HOLDINGS INC. Capital Goods CG
8 S-1801 TAISEI CORP. Capital Goods CG
9 S-1802 OBAYASHI CORP. Capital Goods CG
10 S-1803 SHIMIZU CORP. Capital Goods CG
11 S-1808 HASEKO CORP. Capital Goods CG
12 S-1812 KAJIMA CORP. Capital Goods CG
13 S-1925 DAIWA HOUSE IND. CO., LTD. Capital Goods CG
14 S-1928 SEKISUI HOUSE, LTD. Capital Goods CG
15 S-1963 JGC CORP. Capital Goods CG
16 S-5631 THE JAPAN STEEL WORKS, LTD. Capital Goods CG
17 S-6103 OKUMA CORP. Capital Goods CG
18 S-6113 AMADA HOLDINGS CO., LTD. Capital Goods CG
19 S-6301 KOMATSU LTD. Capital Goods CG
20 S-6302 SUMITOMO HEAVY IND., LTD. Capital Goods CG
21 S-6305 HITACHI CONST. MACH. CO., LTD. Capital Goods CG
22 S-6326 KUBOTA CORP. Capital Goods CG
23 S-6361 EBARA CORP. Capital Goods CG
24 S-6366 CHIYODA CORP. Capital Goods CG
25 S-6367 DAIKIN INDUSTRIES, LTD. Capital Goods CG
26 S-6471 NSK LTD. Capital Goods CG
27 S-6472 NTN CORP. Capital Goods CG
28 S-6473 JTEKT CORP. Capital Goods CG
29 S-7004 HITACHI ZOSEN CORP. Capital Goods CG
30 S-7011 MITSUBISHI HEAVY IND., LTD. Capital Goods CG
31 S-7013 IHI CORP. Capital Goods CG
32 S-7911 TOPPAN PRINTING CO., LTD. Capital Goods CG
33 S-7912 DAI NIPPON PRINTING CO., LTD. Capital Goods CG
34 S-7951 YAMAHA CORP. Capital Goods CG
35 S-1332 NIPPON SUISAN KAISHA, LTD. Consumer Goods CN
36 S-2002 NISSHIN SEIFUN GROUP INC. Consumer Goods CN
37 S-2282 NH FOODS LTD. Consumer Goods CN
38 S-2501 SAPPORO HOLDINGS LTD. Consumer Goods CN
39 S-2502 ASAHI GROUP HOLDINGS, LTD. Consumer Goods CN
40 S-2503 KIRIN HOLDINGS CO., LTD. Consumer Goods CN
41 S-2531 TAKARA HOLDINGS INC. Consumer Goods CN
42 S-2801 KIKKOMAN CORP. Consumer Goods CN
43 S-2802 AJINOMOTO CO., INC. Consumer Goods CN
44 S-2871 NICHIREI CORP. Consumer Goods CN
45 S-8233 TAKASHIMAYA CO., LTD. Consumer Goods CN
46 S-8252 MARUI GROUP CO., LTD. Consumer Goods CN
47 S-8267 AEON CO., LTD. Consumer Goods CN
48 S-9602 TOHO CO., LTD Consumer Goods CN
49 S-9681 TOKYO DOME CORP. Consumer Goods CN
50 S-9735 SECOM CO., LTD. Consumer Goods CN
24/2751 S-8331 THE CHIBA BANK, LTD. Financials FN
52 S-8355 THE SHIZUOKA BANK, LTD. Financials FN
53 S-8253 CREDIT SAISON CO., LTD. Financials FN
54 S-8601 DAIWA SECURITIES GROUP INC. Financials FN
55 S-8604 NOMURA HOLDINGS, INC. Financials FN
56 S-3405 KURARAY CO., LTD. Materials MT
57 S-3407 ASAHI KASEI CORP. Materials MT
58 S-4004 SHOWA DENKO K.K. Materials MT
59 S-4005 SUMITOMO CHEMICAL CO., LTD. Materials MT
60 S-4021 NISSAN CHEMICAL IND., LTD. Materials MT
61 S-4042 TOSOH CORP. Materials MT
62 S-4043 TOKUYAMA CORP. Materials MT
63 S-4061 DENKA CO., LTD. Materials MT
64 S-4063 SHIN-ETSU CHEMICAL CO., LTD. Materials MT
65 S-4183 MITSUI CHEMICALS, INC. Materials MT
66 S-4208 UBE INDUSTRIES, LTD. Materials MT
67 S-4272 NIPPON KAYAKU CO., LTD. Materials MT
68 S-4452 KAO CORP. Materials MT
69 S-4901 FUJIFILM HOLDINGS CORP. Materials MT
70 S-4911 SHISEIDO CO., LTD. Materials MT
71 S-6988 NITTO DENKO CORP. Materials MT
72 S-5002 SHOWA SHELL SEKIYU K.K. Materials MT
73 S-5201 ASAHI GLASS CO., LTD. Materials MT
74 S-5202 NIPPON SHEET GLASS CO., LTD. Materials MT
75 S-5214 NIPPON ELECTRIC GLASS CO., LTD. Materials MT
76 S-5232 SUMITOMO OSAKA CEMENT CO., LTD. Materials MT
77 S-5233 TAIHEIYO CEMENT CORP. Materials MT
78 S-5301 TOKAI CARBON CO., LTD. Materials MT
79 S-5332 TOTO LTD. Materials MT
80 S-5333 NGK INSULATORS, LTD. Materials MT
81 S-5706 MITSUI MINING & SMELTING CO. Materials MT
82 S-5707 TOHO ZINC CO., LTD. Materials MT
83 S-5711 MITSUBISHI MATERIALS CORP. Materials MT
84 S-5713 SUMITOMO METAL MINING CO., LTD. Materials MT
85 S-5714 DOWA HOLDINGS CO., LTD. Materials MT
86 S-5715 FURUKAWA CO., LTD. Materials MT
87 S-5801 FURUKAWA ELECTRIC CO., LTD. Materials MT
88 S-5802 SUMITOMO ELECTRIC IND., LTD. Materials MT
89 S-5803 FUJIKURA LTD. Materials MT
90 S-5901 TOYO SEIKAN GROUP HOLDINGS, LTD. Materials MT
91 S-3865 HOKUETSU KISHU PAPER CO., LTD. Materials MT
92 S-3861 OJI HOLDINGS CORP. Materials MT
93 S-5101 THE YOKOHAMA RUBBER CO., LTD. Materials MT
94 S-5108 BRIDGESTONE CORP. Materials MT
95 S-5401 NIPPON STEEL & SUMITOMO METAL CORP. Materials MT
96 S-5406 KOBE STEEL, LTD. Materials MT
97 S-5541 PACIFIC METALS CO., LTD. Materials MT
98 S-3101 TOYOBO CO., LTD. Materials MT
99 S-3103 UNITIKA, LTD. Materials MT
100 S-3401 TEIJIN LTD. Materials MT
25/27101 S-3402 TORAY INDUSTRIES, INC. Materials MT
102 S-8001 ITOCHU CORP. Materials MT
103 S-8002 MARUBENI CORP. Materials MT
104 S-8015 TOYOTA TSUSHO CORP. Materials MT
105 S-8031 MITSUI & CO., LTD. Materials MT
106 S-8053 SUMITOMO CORP. Materials MT
107 S-8058 MITSUBISHI CORP. Materials MT
108 S-4151 KYOWA HAKKO KIRIN CO., LTD. Pharmaceuticals PH
109 S-4503 ASTELLAS PHARMA INC. Pharmaceuticals PH
110 S-4506 SUMITOMO DAINIPPON PHARMA CO., LTD. Pharmaceuticals PH
111 S-4507 SHIONOGI & CO., LTD. Pharmaceuticals PH
112 S-4519 CHUGAI PHARMACEUTICAL CO., LTD. Pharmaceuticals PH
113 S-4523 EISAI CO., LTD. Pharmaceuticals PH
114 S-7201 NISSAN MOTOR CO., LTD. Information Technology IT
115 S-7202 ISUZU MOTORS LTD. Information Technology IT
116 S-7205 HINO MOTORS, LTD. Information Technology IT
117 S-7261 MAZDA MOTOR CORP. Information Technology IT
118 S-7267 HONDA MOTOR CO., LTD. Information Technology IT
119 S-7270 SUBARU CORP. Information Technology IT
120 S-7272 YAMAHA MOTOR CO., LTD. Information Technology IT
121 S-3105 NISSHINBO HOLDINGS INC. Information Technology IT
122 S-6479 MINEBEA MITSUMI INC. Information Technology IT
123 S-6501 HITACHI, LTD. Information Technology IT
124 S-6502 TOSHIBA CORP. Information Technology IT
125 S-6503 MITSUBISHI ELECTRIC CORP. Information Technology IT
126 S-6504 FUJI ELECTRIC CO., LTD. Information Technology IT
127 S-6506 YASKAWA ELECTRIC CORP. Information Technology IT
128 S-6508 MEIDENSHA CORP. Information Technology IT
129 S-6701 NEC CORP. Information Technology IT
130 S-6702 FUJITSU LTD. Information Technology IT
131 S-6703 OKI ELECTRIC IND. CO., LTD. Information Technology IT
132 S-6752 PANASONIC CORP. Information Technology IT
133 S-6758 SONY CORP. Information Technology IT
134 S-6762 TDK CORP. Information Technology IT
135 S-6770 ALPS ELECTRIC CO., LTD. Information Technology IT
136 S-6773 PIONEER CORP. Information Technology IT
137 S-6841 YOKOGAWA ELECTRIC CORP. Information Technology IT
138 S-6902 DENSO CORP. Information Technology IT
139 S-6952 CASIO COMPUTER CO., LTD. Information Technology IT
140 S-6954 FANUC CORP. Information Technology IT
141 S-6971 KYOCERA CORP. Information Technology IT
142 S-6976 TAIYO YUDEN CO., LTD. Information Technology IT
143 S-7752 RICOH CO., LTD. Information Technology IT
144 S-8035 TOKYO ELECTRON LTD. Information Technology IT
145 S-4543 TERUMO CORP. Information Technology IT
146 S-4902 KONICA MINOLTA, INC. Information Technology IT
147 S-7731 NIKON CORP. Information Technology IT
148 S-7733 OLYMPUS CORP. Information Technology IT
149 S-7762 CITIZEN WATCH CO., LTD. Information Technology IT
150 S-9501 TOKYO ELECTRIC POWER COMPANY HOLDINGS, I Transportation & Utilities TU
26/27151 S-9502 CHUBU ELECTRIC POWER CO., INC. Transportation & Utilities TU
152 S-9503 THE KANSAI ELECTRIC POWER CO., INC. Transportation & Utilities TU
153 S-9531 TOKYO GAS CO., LTD. Transportation & Utilities TU
154 S-9532 OSAKA GAS CO., LTD. Transportation & Utilities TU
155 S-9062 NIPPON EXPRESS CO., LTD. Transportation & Utilities TU
156 S-9064 YAMATO HOLDINGS CO., LTD. Transportation & Utilities TU
157 S-9101 NIPPON YUSEN K.K. Transportation & Utilities TU
158 S-9104 MITSUI O.S.K.LINES, LTD. Transportation & Utilities TU
159 S-9107 KAWASAKI KISEN KAISHA, LTD. Transportation & Utilities TU
160 S-9001 TOBU RAILWAY CO., LTD. Transportation & Utilities TU
161 S-9005 TOKYU CORP. Transportation & Utilities TU
162 S-9007 ODAKYU ELECTRIC RAILWAY CO., LTD. Transportation & Utilities TU
163 S-9008 KEIO CORP. Transportation & Utilities TU
164 S-9009 KEISEI ELECTRIC RAILWAY CO., LTD. Transportation & Utilities TU
165 S-9301 MITSUBISHI LOGISTICS CORP. Transportation & Utilities TU
Table S3. List of major crashes and bubbles for USA and JPN markets and their characterization40–44 .
Sl. Major crashes and type-1 Period Date Region Affected
No
1 Black Monday 19-10-1987 USA,JPN
2 Friday the 13th Mini Crash 13-10-1989 USA
3 Early 90s Recession 1990 USA
5 Mini Crash Due To Asian Financial Crisis 27-10-1997 USA
6 Lost Decade 2001-2010 JPN
7 9/11 Financial Crisis 11-09-2001 USA,JPN
8 Stock Market Downturn Of 2002 09-10-2002 JPN,USA
9 US Housing Bubble 2005-2007 USA
10 Lehman Brothers Crash 16-09-2008 USA,JPN
11 DJ Flash Crash 06-05-2010 USA,JPN
12 Tsunami/Fukushima 11-03-2011 JPN
13 August 2011 Stock Markets Fall 08-08-2011 USA,JPN
14 Chinese Black Monday and 2015-2016 Sell Off 24-08-2015 USA
27/27You can also read