INDUSTRIAL First Half 2019 - Research and Forecast Report
←
→
Page content transcription
If your browser does not render page correctly, please read the page content below
Research and
Forecast Report

                     Accelerating success.

   INDUSTRIAL
   First Half 2019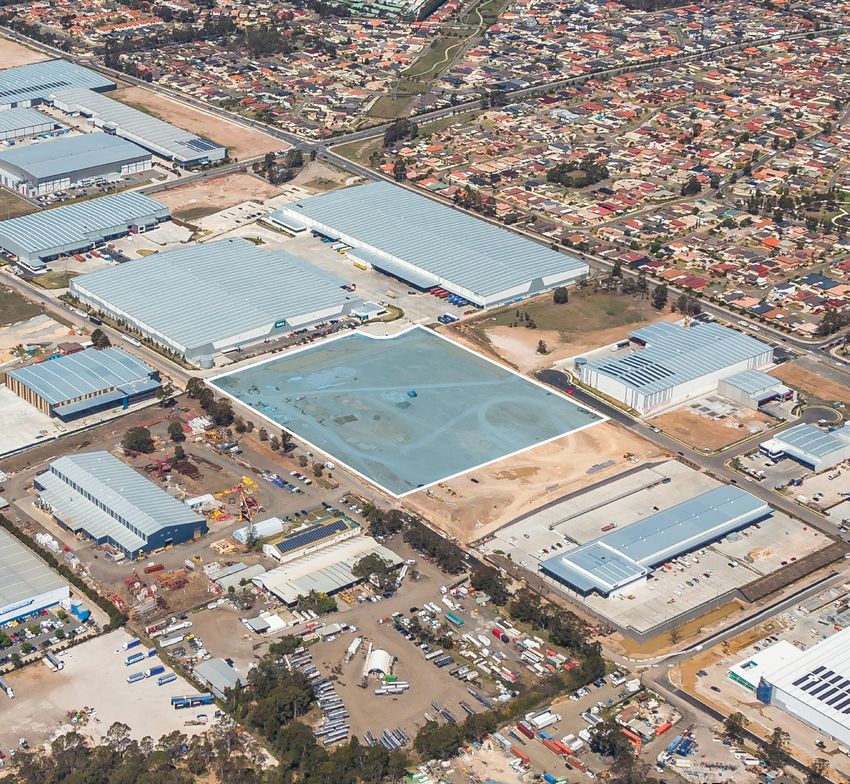
EXPERTS
IN PROPERTY DATA & INSIGHTS
Colliers Edge is a subscription service developed by our in-house
property research specialists, drawing on the expertise of our
national network of operators.

  DEEPER INSIGHTS                LIMITLESS SUPPORT         FAIRER PRICING
   Largest data set              Analyst not operators   Tailored to your needs
   on market today

Want better insights, faster? Talk to a Colliers Edge expert today
         Joanne Henderson
         Director | Research
         +61 410 391 093
         joanne.henderson@colliers.com
         colliers.com.au/colliersedge

                                                               Accelerating success.
CONTENTS
Domestic snapshot                                                                 4

National overview		                                                               5

Sydney                                                                            7

Melbourne                                                                        12

Brisbane                                                                         15

Adelaide                                                                         18

Perth                                                                            20

Newcastle                                                                        22

New Zealand                                                                      24

Our experience – Industrial                                                      36

                     Industrial | Research & Forecast Report | First Half 2019    3
DOMESTIC SNAPSHOT
*H2 2018 figures as at Q3 2018

                                                                                                               BRISBANE
                                                                                                                  NET FACE          YIELD         CAPITAL      INCENTIVE
                                                                                                                    RENT                           VALUE         LEVEL
                                                                                              $/m² H1 2019           $110           6.07%           $1,799      16.20%
                                                                                              $/m² H2 2018           $109           6.35%           $1,722      15.70%
                                                                                              % Change               0.5%          -28.0bps         4.5%        50.0bps

                                                                                                               SYDNEY
                                                                                                                  NET FACE          YIELD         CAPITAL      INCENTIVE
                                                                                                                    RENT                           VALUE         LEVEL
                                                                                              $/m² H1 2019           $151           5.24%          $3,003        8.0%
                                                                                              $/m² H2 2018           $144           5.27%          $2,744        10.0%
                                                                                              % Change               4.9%          -3.0bps          9.4%       -200.0bps

                  ADELAIDE                                                                                     MELBOURNE
                    NET FACE            YIELD         CAPITAL              INCENTIVE                              NET FACE          YIELD         CAPITAL      INCENTIVE
                      RENT                             VALUE                 LEVEL                                  RENT                           VALUE         LEVEL
 $/m² H1 2019             $95           7.75%           $1,249                11.0%           $/m² H1 2019           $111           6.03%           $1,876       15.0%
 $/m² H2 2018             $93           8.03%           $1,191                11.0%           $/m² H2 2018           $108           6.06%           $1,791       14.0%
 % Change                 2.2%         -28.0bps          4.9%                0.0bps           % Change               2.8%          -3.0bps          4.7%       100.0bps

                                                                                             To Note: All figures represent average prime grade assets.

                  PERTH
                    NET FACE            YIELD         CAPITAL              INCENTIVE
                      RENT                             VALUE                 LEVEL
 $/m² H1 2019             $78           7.20%           $1,083               17.50%
 $/m² H1 2018             $77           7.38%           $1,041               17.50%
 % Change                 1.6%         -28.0bps         4.0%                 0.0bps

                                                                                             Share of Supply to be Delivered 2019 to 2023

Average Land Value Ranges                                                                                                           3%
                                                                                                                             12%

  ADELAIDE            AVERAGE = $251
                                                                                                                                                   47%
     PERTH                       AVERAGE = $491                                                                        30%

 BRISBANE             AVERAGE = $303

                                                                                                                                    8%
MELBOURNE                    AVERAGE* = $424

    SYDNEY                                                                AVERAGE = $1,368

          $100     $300      $500    $700      $900   $1,100     $1,300    $1,500                    NSW               VIC              QLD               SA      WA

Source: Colliers Edge                                                                        Source: Cordell Connect/Colliers International
Note: *This figure for Melbourne excludes the City Fringe

4
NATIONAL
OVERVIEW
By Monica Velez
National Director | Logistics & Supply Chain Consultancy                   As-Is vs. To-Be
monica.velez@colliers.com                                                  During a consolidation project, it is always important to assess
                                                                           the ‘current vs future’ or AS-IS vs TO-BE metrics to visualise key
                                                                           efficiency metrics drawn from any transformation project. As an
                                                                           example, the warehouse density ratio is indicative of efficient use
                                                                           of footprint. The measure can range from >1.00 sqm per pallet to
As the Australian economy continues to navigate though a triple-           a very-efficient ratio of
No one-size-fits-all                                                 •   Simulate theoretically the costs and ‘TO-BE’ cost/benefits for
                                                                         each option, perform a quantitative and qualitative assessment
approach                                                                 for each scenario;
                                                                     •   Whenever possible, run small pilots on preferred options to
There is certainly no one-size-fits-all methodology to warehouse         validate assumptions;
consolidation projects, however there are basic tasks that should    •   Perform a right-size assessment to ensure the dimension of
always be considered, including:                                         the network is fit-for-purpose and flexible enough to cater for
•    Explore different scenarios to ensure consolidation is indeed       the company’s future requirements;
     the right choice;                                               •   Identify project constraints and write a plan to overcome them;
•    Find out what the current or ‘AS-IS’ cost-to-serve per          •   Lastly, as one of the key components to project success and
     customer or market segment is from both a warehousing and           according to Prince2® Organisation theme, is to engage with the
     transport perspective;                                              stakeholders by providing the right communication approach.

34 Yarrunga Road, Prestons NSW
Sold on behalf of Private Client

6
Research &
Forecast Report
SYDNEY
Industrial | First Half 2019
By Alex Pham NSW Economic Growth and Unemployment Rate
Director | Research
alex.pham@colliers.com 6.0%
5.0%
7.0%
6.5%
4.0%
6.0%
3.0%
MARKET HIGHLIGHTS
2.0% 5.5%
1.0%
5.0%
0.0%
4.5%
-1.0%
The NSW economy has been growing at an above-trend pace -2.0% 4.0%
Jun-09
Dec-08
Dec-09
Jun-10
Jun-12
Jun-14
Jun-15
Jun-16
Jun-18
Jun-13
Jun-17
Dec-10
Dec-12
Dec-14
Dec-16
Dec-18
Dec-15
Dec-13
Jun-11
Dec-17
Dec-11
and outperforming the national average over the past four years.
SFD Growth YoY Unemployment Rate
A significant pipeline of infrastructure projects is on track to be
Source: Colliers International, ABS
delivered across New South Wales over the coming years and
will be an impetus for rising industrial demand.
NSW Major Infrastructure Projects
WestConnex $16.80 Billion
Net face rents have risen across the board with the Outer West
Western Sydney Airport $5.30 Billion
and South West outstripping the rest of the sub-markets. Pacific Highway Upgrade $4.95 Billion
Western Harbour Tunnel & Beaches Link $4.50 Billion
The investment market continues to flourish off the back of
NorthConnex $3.00 Billion
strong rental growth expectations. F6 Extension (Stage 1) $2.20 Billion
The Northern Road Upgrade $1.60 Billion
Overview
M12 Motorway $1.25 Billion
2019 2020 2021 2022 2023 2024 2025 2026 2027
Source: Colliers International
NSW economic growth outperforms the
national average Online Retailing Share of Total Retail Sales
20.0%
18.0%
New South Wales continues to enjoy uninterrupted economic 18.0%
16.0%
growth off the back of significant infrastructure investment,
Share total retail sales
14.0%
12.0%
9.9%
solid employment growth and ongoing population increases. The 10.0%
8.0%
5.6%
6.0%
state economy has been growing at an above-trend pace and 4.0%
2.0%
outperforming the national average over the past four years. The 0.0%
2000
2002
2004
2006
2008
2005
2009
2003
2007
2001
2010
2012
2014
2016
2018
2015
2013
2017
1999
2011
real gross state product is forecast to expand by 3.0 per cent over AU UK US
2017-18 while real estate final demand is expected to grow by Source: Colliers International, ABS, USCB, ONS
3.75 per cent. Despite emerging challenges in the housing sector,
the outlook for the next two years is forecast to remain upbeat
with growth drivers shifting from the construction sector to public
spending and the strengthening service sector.
The strong economy has translated to strong employment growth boom has attracted a significant number of international skilled
over the past few years. In fact, the Emerald State recorded the migrants into the state. As a result, NSW’s population is expected
largest increase in its contribution to national employment with to rise by more than one million over the next 10 years. Colliers
125,600 additional jobs created over the 12 months to February International’s analysis reveals that this strong population growth
2018. Year-on-year employment growth was 3.2 per cent as at would translate to total industrial demand of between 4.0-4.5
February and well above the 20-year average. The ongoing job million sqm of industrial space in NSW over the next decade.
Industrial | Research & Forecast Report | First Half 2019 7
Public infrastructure spending to accelerate                               E-commerce continues to underpin demand
A significant pipeline of infrastructure projects is on track to be        The online retailing industry continues to grow at a spectacular
delivered across New South Wales over the coming years and will            speed. Importantly, this growth is not only supported by the pure-
be an impetus for both economic growth and industrial demand. A            play online retailers, but also by the traditional retailers that are
total of $153.5 billion worth of projects are currently in progress        increasingly embracing omnichannel retailing and click-and-collect
across the state, making it the infrastructure capital of Australia.       strategies. Over the past year to February 2019, the total online
More importantly, the total investment value in New South Wales            retail turnover, which includes both pure-play and multi-channel
has soared by more than 50 per cent over the past five years,              online retail trade, have increased by 31.3 per cent to reach $18.2
while activity across the rest of the country had declined by 33 per       billion. Nevertheless, the online retailing industry in Australia still
cent. Additionally, the Government has further committed $87.2             has a long way to go as it currently only accounts for 5.6 per
billion to state infrastructure projects over the next 4 years. Colliers   cent of total retail sales in the country. Consequently, third-party
International believes this stimulus will have a significant and           logistics providers (3PL) and omnichannel retailers remain one
positive effect on the industrial sector through both the expansion        of the most active industrial tenants over the past 12 months.
in industrial employment and improved productivity. Furthermore,           Food retailers are also having a growth spurt off the back of the
upgrades to transport networks across Metropolitan Sydney are              resilience of non-discretionary spending, which has outperformed
creating more connected industrial precincts, boosting tenant              discretionary spending in recent years.
expansion and enticing new international entrants to the market.
                                                                           Supply is rising in response to demand
Multibillion-dollar projects that are well underway include; the
                                                                           With demand continuing to rise on the back of strong market
WestConnex project ($16.8 billion -2023 completion), Western
                                                                           fundamentals, Colliers International expects the development
Sydney Airport in Badgerys Creek ($5.3 billion - 2026), Pacific
                                                                           pipeline to increase over the next 12 months. A total of 761,596
Highway Upgrade ($4.945 billion - 2020), NorthConnex ($3.0 billion
                                                                           sqm of new industrial space is projected to be delivered during
- 2020) and the Northern Road Upgrade ($1.6 billion - 2022). A
                                                                           2019. The bulk of this new supply will concentrate in the South
further $50 billion worth of construction projects is in the pipeline
                                                                           West (39 per cent of total) and Outer West (31 per cent) precincts,
with the largest of them being the Sydney Metro West rail project
                                                                           where demand has been the strongest. These markets are also
($10.4 billion). Other mega-projects include the Western Harbour
                                                                           benefiting from improved transport networks and infrastructure
Tunnel and Beaches link ($4.5 billion), F6 Extension Stage 1
                                                                           projects such as the Western Sydney Airport, Sydney Metro West
($2.2 billion) and the M12 Motorway ($1.25 billion). All these new
                                                                           and Moorebank Intermodal Terminal. Major completions in these
infrastructure developments will be a game changer for the Sydney
                                                                           precincts over the next 12 months will include a 27,500-sqm
industrial market, especially the Western Sydney industrial precincts.
                                                                           warehouse at the Crossroad Logistics Centre being developed by
                                                                           AMP Capital and a 37,860-sqm warehouse for Target Australia
                                                                           within the Moorebank Logistics Park. The North West is also
                                                                           expecting to see over 100,000 sqm of new industrial space (14 per
                                                                           cent) coming online over the next 12 months, with around 38 per
                                                                           cent already pre-committed to. Limited supply is expected to be
                                                                           generated across the Central West (8 per cent) and Inner West (6
                                                                           per cent) due to a lack of available development sites coupled with
                                                                           rising land prices. As expected, the North and South precincts will
                                                                           have the lowest levels of new stock being generated with strong
                                                                           competition from alternative uses and land prices being priced on
                                                                           an FSR (floor space ratio) basis.

                                                                           Over the past 12 months, the average price for industrial land
                                                                           across Sydney soared by 8.1 per cent to circa $1,050 per sqm as
                                                                           at March 2019. The North and South industrial markets remain the
                                                                           most expensive markets in Sydney with prices ranging at $1,500-
                                                                           4,000 and $1,500-3,250 per sqm respectively. Industrial-zoned
                                                                           land in these markets continue to be competitive, with investors
                                                                           pricing future development potential due to changes in zoning and
                                                                           density. Recent transactions around the Alexandria precinct have
                                                                           reached as high as $6,000 per sqm. However, with the North and
                                                                           South markets excluded, the average land price in the Western
7 Enterprise Drive, Beresfield, NSW                                        markets of Sydney average around $619 per sqm as at March
Sold on behalf of Fairfax Media Management                                 2019, up 7.6 per cent YoY.

8
Land tax increases to lift gross face rents Sydney Industrial Supply Pipeline
1,200,000
The NSW Valuer-General has recently conducted land valuations
1,000,000
across NSW for 2019, which resulted in significant uplifts in
800,000
Floorspace (sqm)
industrial land values. In fact, industrial land showed the strongest
600,000
overall increase amongst all uses with the average industrial value
400,000
jumping by 17.5 per cent due to infrastructure improvements and
200,000
rising demand from local industries. More significant increases
0
were recorded in the local government areas of Cumberland (53.9 2007 2008 2009 2010 2011 2012 2013 2014 2015 2016 2017 2018 2019 2020 2021
per cent), Blacktown (33.1 per cent), Bathurst Regional (28.4 Complete Construction DA Stage Possible Historic Ten-Year Average
per cent) and Central Coast (22.2 per cent). Although these Source: Colliers Edge
escalations are yet to be reflected in our data for Q1 2019, we Sydney Average Industrial Land Values
expect gross face rents will rise significantly from the second half 15.1%
$2,500 16.0%
of this year. Our modelling shows that gross face rents across $2,200
$2,060 14.0%
$2,000 14.3%
Sydney could be lifted further by between 5.0 and 8.0 per cent on 12.0%
$1,500 10.0%
top of the natural increases expected over the next 12 months. 7.3%
6.8%
7.7%
8.0%
$1,000 6.0%
$644 $641
Net face rents, however, will not be impacted as land taxes will $500
3.0%
$612
2.0%
$604 $592
4.0%
generally be passed on to outgoings payable by the tenant. The
2.0%
$0 0.0%
average prime net face rent for Sydney has increased by 2.3 per South North
Avg Land Price
Inner West North West Outer West
YoY Growth
South West Central West
cent to $144/sqm as at September 2018. Prime incentives declined
Source: Colliers Edge
by one percentage point to 10 per cent resulting in net effective
rental growth of 3.3 per cent. Stronger face rental growth was Sydney Average Net Face Rents by Asset Class
recorded in the secondary market, where face rents advanced by $180 15.0%
$160
5.5 per cent over the past 12 months to $124/sqm in September $140
10.0%
N e t F a c e R e n t ($ /s q m )
$120 5.0%
2018. Secondary incentives are currently between 10 to 11 per cent. $100
0.0%
$80
Investment Market
$60 -5.0%
$40
-10.0%
$20
$0 -15.0%
Mar-09
Sep-09
Mar-10
Mar-12
Mar-14
Mar-16
Mar-18
Mar-15
Mar-19
Mar-13
Sep-10
Mar-17
Sep-12
Sep-14
Sep-16
Sep-18
Sep-15
Sep-13
Sep-17
Mar-11
Sep-11
The investment market continues to flourish off the back of strong
Prime Grade Secondary Grade
economic and market fundamentals aided by the strength of online Prime Grade Annual Growth Rate Secondary Grade Annual Growth Rate
retailing and infrastructure investment. A total of $1.5 billion (for Source: Colliers Edge
transactions of $10 million and over) worth of industrial assets
have transacted over the year to 1Q 2019. Despite the continued
The weight of capital amid limited opportunities has seen
deep pool of capital and undeterred investor appetite, transaction
secondary yields continued to tighten across Sydney by
volumes were lower than a year ago by 4.2 per cent due to a
approximately 30-50bps over the past 12 months. Prime yields
distinct lack of institutional-grade stock and large portfolios on the
currently average around 4.82-5.25 per cent, while secondary
market. This reaffirms Sydney’s position as being the most tightly
yields range around 5.46-5.96 per cent as at March 2019. A major
held and in-demand industrial market in the country.
transaction over the past year was Calibre by Mirvac, located in
Institutional investors are particularly bullish on the industrial the North Western suburb of Eastern Creek, sold for $125.232
sector, acquiring almost $1 billion worth of assets in NSW over million on a 5.14 per cent initial yield and a rate of $2,272 per sqm.
the past 12 months. This represents about 66 per cent of the total This deal has reset the benchmark for an institutional grade asset
transaction amount. The market remains dominated by local players in the Outer West market of Sydney. Other highlight transactions
who have purchased a total of $1.2 billion over the past 12 months in recent months include 13 Ferndell Street, South Granville
or 80 per cent of the total market. Offshore groups, spearheaded transacted for $24.225 million on a 6.87 per cent core market yield
by global mandates from the UK and US, acquired $230 million and 3-5 John Morphett Place, Erskine Park sold for $19.04 million
over the past 12 months mostly through portfolio transactions. on a 5.53 per cent core market yield.
Industrial | Research & Forecast Report | First Half 2019 9
Sub-Markets Sydney Average Prime Yield Spread (%)
9.0%
8.0%
West 7.0%
6.0%
5.0%
Industrial take-up in the Western precincts, which is made up of the 4.0%
Yield
3.0%
North West, Inner West, Central West, South West and Outer West, 2.0%
1.0%
has remained solid over the past 12 months. From our analysis 0.0%
Mar-09
Sep-09
Mar-10
Mar-12
Mar-14
Mar-16
Mar-18
Mar-15
Mar-19
Mar-13
Sep-10
Sep-12
Mar-17
Sep-14
Sep-15
Sep-16
Sep-18
Sep-13
Sep-17
Mar-11
Sep-11
of enquires, demand has come largely from tenant expansion,
relocation to improve supply chain efficiency or new entrants into Yield Spread Prime Industrial Yield 10 Yr Govt Bond Rate
the market. Demand has derived from a wide range of industries Source: Colliers Edge
including retail trade, construction, data centres, transport and
Prime and Secondary Net Face Rents by Sub-Market 1Q19
third-party logistics (3PL). On the back of this positive demand, the
$250
average net face rent across the Western markets has increased $200
$218
by 4.1 per cent YoY to $128 per sqm as at March 2019. The average
$200 $180
$162
incentive has declined slightly from 11 per cent from a year ago to $150 $128
$113
$138
$118
$128
$118
$125
$118 $123
$100
10 per cent as at 1Q 2019. Current market yields for prime assets $100
in the West currently range between 4.9 and 5.3 per cent, while $50
secondary yields sit around 5.5 and 6.0 per cent. $0
North West Inner West Central West Outer West South West North South
Following several trend-setting deals in recent months, the Outer Prime Net Face Rent Secondary Net Face Rent
West has recorded the highest increase in net face rents over Source: Colliers Edge
the past 12 months. Prime net face rents in the Outer West have
Average Prime and Secondary Yields by Sub-Market 1Q19
increased by 8.7 per cent YoY to average around $125 per sqm
7.0%
in the first quarter of 2019. Net face rents for secondary assets 5.75% 5.75% 5.75% 5.75% 5.75% 5.75%
6.0% 5.50%
also registered a strong growth of 8.8 per cent YoY to $118 per 5.0%
5.05% 5.05% 5.05% 5.05% 5.05% 5.25%
4.75%
sqm. Positive leasing results were also recorded in the South West 4.0%
precinct, where prime net face rents soared by 6.1 per cent over the 3.0%
2.0%
past 12 months to $123 per sqm and secondary net face rents have
1.0%
been brought up to a more comparable level with other markets at 0.0%
North West Inner West Central West Outer West South West North South
$100 per sqm, up 16.3 per cent YoY. The strong rental growth in the
Outer West and South West is reflective of both tenant preference
Prime Yield Secondary Yield
for well-positioned locations that are benefiting from improving Source: Colliers Edge
infrastructure and connectivity. Additionally, these markets are also
seeing the largest share of new supply of new developments, which
command higher net face rents. Incentives for prime space in the
Outer and South West are being offered at around 10-15 per cent
and 10-11 per cent respectively.
The rest of the Western markets recorded more sustainable rental
growth of between 2.0-3.0 per cent over the past 12 months. Prime
net face rents in the Inner West grew by 2.6 per cent YoY to $138
per sqm, while secondary net face rents rose by 4.4 per cent to
$118 per sqm. The North West and Central West recorded similar
levels of prime rental growth of 2.0 per cent YoY taking the prime
face rents of both precincts to $128 per sqm in March 2018. In the
secondary market, face rents in the North West increased by 2.3
per cent to $113 per sqm, while those in the Central West remained
steady at $118 per sqm. Incentives for prime and secondary
industrial facilities in these markets ranged around 9.0-10.0 per cent
and 9.0-11.0 per cent respectively at the beginning of 2019.
Lane Cove Industrial, Warehouse Fitout, NSW
Project managed on behalf of Kavo Kerr
10North South
Net face rents for prime space in the North industrial market have Industrial users in the South continue to be starved for choices due
remained relatively stable over the past 12 months, with effective to a lack of new supply amid continued competition from alternative
rental growth being driven largely by lowered incentives. Prime highest and best uses. Prime net face rents have escalated by 22.5
industrial spaces are currently achieving $200 per sqm whilst per cent over the past 12 months to average around $218 per sqm
secondary options are getting $162 per sqm on average as at March as at March 2019. Additionally, incentives have slid further to 7.0
2019. Prime incentives have declined from 10 to 8 per cent, which per cent from 8.0 per cent a year prior. Secondary rents have risen
is similar to the incentive level being offered for secondary spaces. substantially by 29.3 per cent YoY to $180 per sqm. Nevertheless,
With very limited availability of stock, occupiers with requirements in due to the significant increases in rents, many of the traditional
excess of 2,000 sqm continue to seek accommodation in alternative industrial users have continued to relocate to more affordable
markets. The market is dominated by mostly SME businesses at the markets, while the tenant base has broadened to higher value uses
higher end of the supply chain such as pharmaceutical, medical and such as car and furniture showrooms, wholesale retailing, import-
IT companies or those with strong ties to the North Shore market. export goods and services, as well as non-traditional tenancies
Investment yields for prime assets in the area are around 5.0-5.5 such as childcare, education centres, gyms, clinics and independent
per cent and for secondary assets are around 5.5-6.0 per cent. coffee roasters.
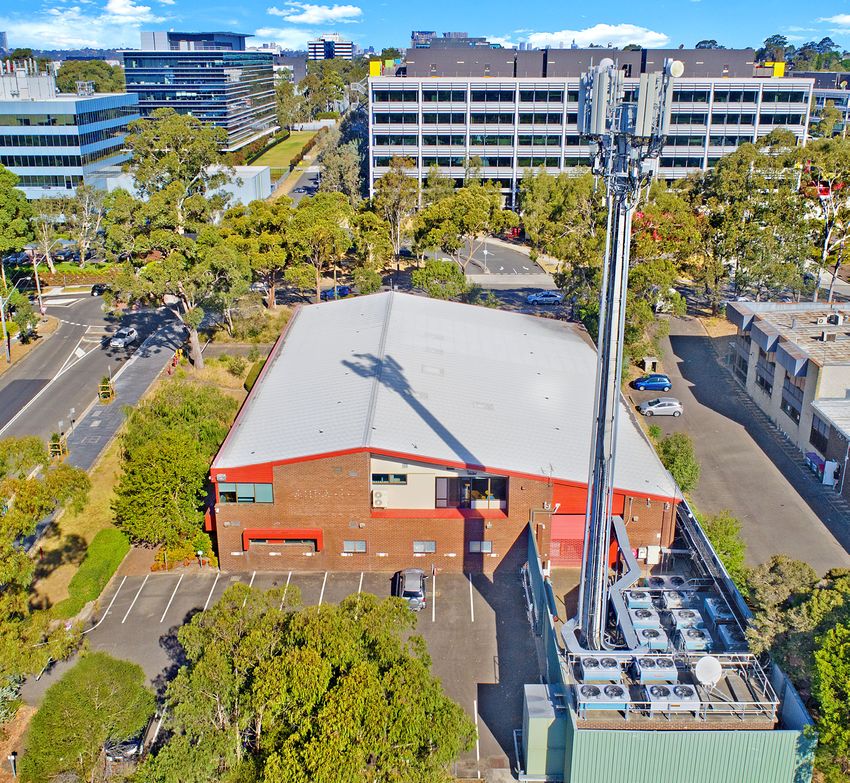
2 Byfield Street, Macquarie Park, NSW
Sold on behalf of Stirling Property Funds
Industrial | Research & Forecast Report | First Half 2019 11Research &
Forecast Report
MELBOURNE
Industrial | First Half 2019
By Sarah Walker Land Values by Sub Market
Manager | Research $1,600.00
sarah.walker@colliers.com $1,400.00
$1,200.00
$1,000.00
Title
$800.00
MARKET HIGHLIGHTS $600.00
$400.00
$200.00
$-
Overall decline in transaction volumes, both QoQ and YoY
Mar-06
Mar-08
Mar-05
Mar-09
Sep-06
Sep-08
Sep-05
Mar-07
Sep-09
Sep-07
Mar-10
Mar-12
Mar-14
Mar-16
Mar-18
Sep-10
Mar-15
Mar-19
Mar-13
Sep-12
Sep-14
Sep-16
Sep-18
Sep-15
Mar-17
Sep-13
Sep-17
Mar-11
Sep-11
Leasing demand strong across the board North South East West Outer East City Fringe
Source: Colliers International
Increased statutory expenses driving more tenants further
West from Port Melbourne Prime Outgoings by Sub-Market
$40
$35
$30
$25
Overview
Title
$20
$15
During the first quarter of 2019 only 6 investment transactions were $10
Mar-06
Mar-08
Mar-05
Mar-09
Sep-06
Sep-08
Sep-05
Mar-07
Sep-09
Sep-07
Mar-10
Mar-12
Mar-14
Mar-16
Mar-18
Sep-10
Mar-15
Mar-19
Mar-13
Sep-12
Sep-14
recorded above $5 million. When compared with the first quarter
Sep-16
Sep-18
Sep-15
Mar-17
Sep-13
Sep-17
Mar-11
Sep-11
of 2018, transaction volumes are approximately 70 per cent down
City Fringe North South East Outer East West
year on year to date. The reduction in sales volumes, however, is
Source: Colliers International
not an indicator of a reduction in demand for industrial investments,
as there is still a weight of capital seeking to be deployed into the
sector. Instead it signals the continued tightening of the industrial Submarkets
market in Victoria and we forecast a strong second half of 2019.
Melbourne industrial property offers an attractive alternative to
City Fringe
other Eastern Seaboard markets given the availability of land and The landscape for the City Fringe industrial market continues to
relative pricing. change as underlying land values increase and higher order uses
encroach. One of the key demand drivers for industrial assets being
Last year was the year for infrastructure announcements including
overall occupancy costs is being impacted significantly by increased
the Airport Rail Link, North East Link and suburban rail link.
underlying land values as a result of the rezoning of industrial
Following these announcements, the airport rail link geotechnical
precincts surrounding the CBD. We do not consider the full effect
drilling has begun with construction to commence in 2022, this
of rising outgoings to be realised until the next financial year as
project expected to be completed in 2031. Major transport projects
FY20 budgeted outgoings flow through to tenants. We expect this to
not only create more jobs, but major opportunities within the
continue to push leasing demand into Melbourne’s west.
industrial sector across the state. Prime Minister Scott Morrison
announced a 200km/h fast rail service between Melbourne and In the first quarter of 2019 there have not been any further updates
Geelong which could have a major impact on the commercial and on the Fishermans Bend or Arden precincts. We expect the second
residential sector of Geelong with the proposed train to only take 30 half of 2019 to bring more clarity to the market regarding the timing
minutes. We see these projects continuing to attract investment in and future designation of land uses in these key city fringe urban
industrial land and assets along these growth corridors. renewal areas.
12The construction tendering process is underway for Arden where West
the new North Melbourne metro train station will be located.
Overall leasing demand is skewed to the West sub-market
The Metro Tunnel is due to open in 2025 and it will have a huge
primarily due to the availability of land and capacity for large scale
impact on the Arden precinct from both a social and economic
developments. This sub market attracts large freight forwarding
perspective. A notable sale in the Fringe sub market for Q1 2019
companies and third party logistics providers (3PLs) requiring
was 30-36 Grosvenor Street, Abbotsford which sold for $17.3
substantial building footprints and hardstand. Historically rents
million to Poly Group. The acquisition is strategic for Poly following
have remained relatively stagnant in the West having only increased
their acquisition of the adjacent property at 45 Grosvenor Street,
8 per cent in the last 5 years. We expect that as the next wave of
Abbotsford 3 month prior. On average yields in the City Fringe
supply comes to market, rents will increase due to the price that
reduced 42 basis points to 5.63 per cent for prime and 52 basis
developers have paid for their most recent land banks. Institutions
points to 6.13 per cent for secondary stock in the last 6 months to
that have traditionally not been large purchasers of industrial land
March 2019.
have recently entered this market. The superfund ISPT purchased
North approximately 30 hectares at Horsburgh Drive, Altona North for $60
The North sub-market is becoming increasingly popular amongst million. GPT Group is also growing their Logistics Portfolio with the
industrial developers and investors as leasing demand strengthens purchase of 399 Boundary Road, Truganina for $16.7 million which
along this growth corridor. Land values have recorded strong will deliver 48,000 sqm of GLA.
growth since 2015, with values currently above $300/ sqm for The amount of enquiry for the West currently outweighs supply
land in excess of 5,000sqm. This uplift is due to the tightly held with more than 350,000 sqm of requirements compared to the
nature of this sub-market and the availability of serviced industrial long term average take up of approximately 90,000 sqm per
land to satisfy pre-lease demand. For prime assets, incentives annum, Traditional developers who include Dexus, Charter Hall,
fell 4 percentage points to 15 per cent over the last 6 months. In Goodman and Frasers are beginning to unlock the next wave of new
this same period rents for prime stock increased 6.25 per cent speculatively built development in response to this.
to average $85/ sqm and secondary increased 7.69 per cent to
More efficient building designs are resulting in outgoings declining
average $70/ sqm.
to $12/ sqm for prime assets, previously $15/sqm three years prior.
Master planning has begun on Frasers’ land at 410 Cooper Street, Secondary assets are averaging $14/ sqm which have showed little
Epping with the first stage of the estate expected to come to market movement in this same time period. Overall occupancy cost relative
by mid 2019. The Frasers estate has an estimated on completion to other industrial precincts is one of the key attractors of tenants to
value of $250 million and will accommodate more than 250,000 the West sub market.
sqm of space. MAB’s Merrifield Business Park has reached
completion of stage one with high levels of enquiry already being
received for the next stage of the development. At present, there is
in excess of 150,000 sqm of enquiry for industrial property in the
North sub market. With overall vacancy of less than 2 per cent we
expect there to be upward pressure on rents and land values in the
near term.
Dexus Industrial Estate, Pound Road West, Dandenong South, VIC
Valued on behalf of Dexus Property Group
Industrial | Research & Forecast Report | First Half 2019 13South East and Outer East Leasing demand continues to strengthen as tenants are attracted
to this key geographic location that affords them easy access to the
The South East and Outer East are the most land constrained sub
existing and planned arterial roads and the South East and Outer
markets outside of the City Fringe only one major existing facility
East population catchments. Average net face rents in the South
transaction was recorded for the first quarter being 63-79 South
East have remained relatively stable for both prime and secondary
Park Drive, Dandenong South for $17.25 million. The property was
assets in the last 6 months at $93/sqm and $70/sqm respectively.
sold by Frasers to a local owner-occupier. Development land is
Incentives remain at 19 per cent on average for prime and 13 per
relatively scarce however a vacant 41.3 hectare prime industrial
cent on average for secondary. Net face rents in the Outer East
land parcel came to market this quarter. This is one of the few
are slightly higher at $99/sqm for prime stock. Prime rents are
remaining vacant land opportunities in the South East that is
expected to increase further as tenants seek a flight to quality and
zoned for industrial use and will therefore be strongly contended
incentives are likely to remain low given the scarcity of new supply.
for amongst the large institutional property developers. We expect
this transaction to set a new benchmark for englobo land and
forecast that land values will continue to increase due to the lack
of upcoming new stock (most of which has been pre-leased) in an
already tight market.
Unit 7, 331 Ingles Street, Port Melbourne, VIC
Leased on behalf of Dexus
14Research &
Forecast Report
BRISBANE
Industrial | First Half 2019
By Karina Salas Qld Industrial Production Forecast
Manager | Research 7 6.6
karina.salas@colliers.com 6 5.6
5 4.4
4 3.6
Growth %
3.5 3.3 3.3
MARKET HIGHLIGHTS
3.2 3.1
2.8 2.7 2.8
3
1.7 1.9
2 1.7
Queensland’s industrial production growth to outperform 1
0
Australia’s industrial production over the next decade 201 4 201 5 201 6 201 7 201 8 201 9 202 0 202 1 202 2 202 3 202 4 202 5 202 6 202 7 202 8
QLD Australia
Australia TradeCoast (ATC) leading the annual growth in land Source: Colliers International and Deloitte Access Economics
values in 2018
Brisbane Industrial Sales ($5 million+)
Concentration of automation investment within the South West $1,400
$1,200
precinct
$1,000
$800
$AUD Millions
Overview
$600
$400
$200
Solid investment in road infrastructure and connectivity coupled $0
2007 2008 2009 2010 2011 2012 2013 2014 2015 2016 2017 2018
with population growth continue to support industrial activity YoY to December
Domestic Offshore Undisclosed 5-year average
in Brisbane. The proposed Inland Rail and the Port of Brisbane
Source: Colliers International
dedicated freight rail connection projects are anticipated to be
a game changer for the industrial market, supporting its future Land Values by Precinct ($AUS/ sqm)
expansion and potentially creating transport-cost efficiencies for $45 0
regional industrial operators in Victoria, New South Wales and $40 0
Queensland. $35 0
$AUD/sqm
$30 0
Demand in the Brisbane industrial market continues to transition $25 0
$20 0
from traditional manufacturing and industrial uses to transport and
$15 0
logistics, retail warehousing and mixed industry business precincts.
Mar-12
Mar-14
Mar-16
Sep -12
Mar-18
Sep -14
Mar-15
Sep -16
Mar-19
Sep -18
Mar-13
Sep -15
Sep -13
Mar-17
Sep -17
Mar-11
Sep -11
Ecommerce and online retail activity is changing the way the
ATC North Sou thWest Sou th Yatala
industrial market operates in Australia and Brisbane is not isolated
to this new trend. Source: Colliers International
According to Deloitte Access Economics, Queensland’s economic
growth and industrial production is forecast to outperform Australia
over the next decade, with the GSP growing an average of $13.1
billion a year, from $345 billion in 2018 to $475 billion in 2028.
The value of Queensland’s industrial production increased 6.6 per
cent in 2018, to $65.7 billion in December 2018. The upward trend
is anticipated to continue over the next decade as Queensland’s
industrial production will rise at an annual average of $2.2 billion, to
$87.6 billion in 2028.
Industrial | Research & Forecast Report | First Half 2019 15Institutional investors dominated the market capital values of 9 per cent to $1,799 per sqm as at March 2019. In
the secondary market, average yields have compressed 47bp for the
Colliers International have estimated the volume of industrial
YoY to March 2019, to 7.65 per cent. Consequently, annual average
asset transactions (above $5 million) reached $839 million in
capital values for secondary assets have increased by 2.7 per cent,
2018, representing a fall of 28 per cent compared to 2017 and
to $1,073 per sqm. The extent of the capital value increase for
remaining below the 3-year and 5-year sale volumes. Acquisitions
secondary assets was limited by a modest fall in rents recorded in
from institutional investors ($403 million) dominated the market,
the North and South West precincts.
representing about 48 per cent of the volume of sales in 2018.
Singaporean institutions were very active in 2018 acquiring a total Land Values heading north
of $142 million of Brisbane industrial assets in 2018. The renewal of industrial areas is becoming an issue worldwide as
The ATC and the South precincts were the preferred locations population growth continues putting pressure on land availability
for investors, comprising 72 per cent of the volumes transacted to meet housing demand and encroaching into industrial-use land.
in 2018. The largest 2018 investment transaction was the sale of According to the Brisbane City Council Industrial Strategy 2019, the
Coles Distribution Centre at Heathwood acquired by Mapletree total industrial land area within the inner five kilometres has been
Logistics Trust, for $105 million at an initial yield of 5.83 per cent reduced by over a third in the past five years. Similarly, industrial
and offering a 4.25 years WALE. land in outer Brisbane remains under pressure for encroaching
non-industrial uses land and has been reduced by 10 per cent in the
Colliers International forecasts an increase in the volume of
past five years (2 million sqm of industrial gross floor area).
industrial sales in 2019, with circa $157 million of exchanged
and pending sales already recorded. This amount represents an There is no doubt that the reclassification of industrial area to
increase of more than 70 per cent compared to the volume of sales different uses will continue putting upward pressure on land values.
in Q1 2018 (of $90 million). Over the past three years, land values across all precincts have
generally trended upwards. The average land value for the YoY to
Yield compression continues March 2019 has increased 5.3 per cent, to $310 per sqm.
The strong investor demand and limited available assets resulted
Colliers International anticipates the rising trend in Brisbane
in further increases in prices and tightening yields generally across
industrial land values will continue over the medium term due to the
the board, with average prime grade yields sharpening for eight
current and forecast value proposition of the investment achieving
consecutive years and average secondary grade yields tightening
solid yield spreads compared to Sydney and Melbourne (of up
for a sixth consecutive year.
to 170bp in some instances), and the significant infrastructure
Prime grade yields have tightened in the range of 25bp to 50bp investment program under construction in South East Queensland
for the past 12 months, to an average of 6.07 per cent as at March (SEQ).
Sub Markets
2019. Lower yields have driven an annual average increase in
Australia TradeCoast – Solid Sales Volumes
The ATC experienced the strongest growth in land values for the
YoY to March 2019, increasing by 9.9 per cent to an average price
of $390 per sqm in March 2019, from $355 per sqm in March
2018. Colliers International anticipates that the limited forecast new
development supply will continue putting upward pressure on rents
over the next few years. Average prime grade net face rents are
$118 per sqm as at March 2019, holding firmly over the past year.
Average incentives fell 1.5 percentage point, to 12.5 per cent for
the YoY to March 2019, which could be anticipating a future rental
growth for prime grade assets.
Investors continue holding stock tightly, with the ATC being one
of the preferred location for investors in 2018, transacting circa
$293 million of assets at an average yield of 5.75 per cent for
prime grade and 7.38 per cent for secondary grade assets as at
March 2019. Average prime grade capital values increased 5 per
cent for the YoY to March 2019, to $1,956 per sqm and gradually
approaching $2,000 per sqm. Average secondary grade capital
Steelforce, Port of Brisbane values held steady at $1,254 per sqm for the past year as rents and
Leased by Colliers International yields held relatively unchanged.
16North and Outer North As South West is renewing and becoming a preferred location for
large logistic and warehouse, average land values increased a solid
The Brisbane North and Outer North precinct is located in a rapidly
6.2 per cent for the YoY to March 2019, to $300 per sqm.
growing area extending from the Brisbane North suburbs to the
Moreton Bay region. This precinct benefits from overflow demand A total of $136.3 million of assets were transacted in 2018. Prime
on the TradeCoast due to its proximity to the Brisbane Airport grade average yield tightened 30bp for the past year, to 6.25 per
and the Port of Brisbane. According to the Brisbane City Council cent in March 2019. A similar trend was seen for the secondary
Industrial Strategy 2019, 60 per cent of the industrial employment grade average yield, sharpening from 8.23 per cent in March 2018
in this precinct focuses on manufacturing activity, reflecting the to 7.75 per cent in March 2019.
heavy concentration of manufacturing operators. The average prime grade net face rent increased 4.8 per cent for
Land values increased modestly by 1.7 per cent for the YoY to the YoY to March 2019, to $110 per sqm. Average secondary grade
March 2019, to an average of $298 per sqm. Prime grade net face net face rent fell 6.1 per cent for the YoY to March 2019, to $ 78 per
rents are currently around $105-$115 per sqm and incentives are sqm due to the low quality of the stock advertised for lease.
between 12 to 17 per cent. Secondary spaces are achieving net face South
rents around $65 to $85 per sqm with 14 to 20 per cent incentives.
Land values increased modestly over the past 12 months, from an
A total of $92.1 million of sales (above $5 million) were transacted average of $305 per sqm in March 2018 to $310 per sqm in March
in 2018, representing 11 per cent of the total Brisbane industrial 2019. Prime grade average yields tightened 40bp for the past year,
sales for the year. Average prime grade capital values increased from 6.4 per cent in March 2018 to 6 per cent in March 2019.
8.5 per cent for the YoY to March 2019, to $1,872 per sqm. Due to
the secondary grade rents fall, capital values fell by 2.9 per cent, to Well-located stock generally attracts higher rents, with the average
$1,000 per sqm for the YoY to March 2019. prime grade net face rents increasing of 3.5 per cent, to $111 per
sqm for the YoY to March 2019. Secondary grade net face rents
South West – Leading Automation increased 3 per cent, to $85 per sqm for the YoY to March 2019.
Investment Generally, tenants have a preference to rent from institutional
Large investment in warehouse automation supported by long-term investors due to the quality and efficiency included in the building,
leases is concentrated primarily in Redbank. The largest parcel which is generally a reflection of the investment commitment made
and delivery centre in the Southern Hemisphere is currently under by institutional investors. The average incentives of 18 per cent is
construction at Goodman’s Redbank Motorway Estate. The $200 the highest one across Brisbane.
million development has been leased by Australia Post for an initial Yatala Enterprise Area (YEA) –
term of 15 years. Largest Annual Increase In Net Face Rents
Coles has committed $950 million over the next six years fitting YEA’s value proposition provides for affordable rental options,
out two automated warehouses (one located at the Goodman’s competitive land values and easy accessibility to the M1 Pacific
Redbank Motorway Estate), supported by a 20 years lease term. Highway providing centralised access to both Brisbane and the Gold
The 66,000sqm facility will be developed by German specialist Coast markets.
Wilton Logistik.
Circa $70 million sales (above $5 million) have been recorded in
Brisbane Prime Industrial Indicators - Q1 2019 2017, 2018 and the first quarter of 2019. This includes the recent
sale of a 624,000sqm development site at 60 Stapylton-Jacobs
Average YoY
Average Well Road for $20.5 million. According to Cordell Connect, there
Prime Annual Prime Prime
Land is circa 90,000sqm of new supply to be added to the precinct
Precinct Net Face Rent Incentive Average
Value
Rents Growth (%) Yield (%) from 2020 to 2022. Colliers International anticipates significant
($/sqm)
($/sqm) (%)
development activity will occur over the medium term as development
Australia sites are now on the radar of institutional investors and industrial
$118 0.0% 13% 5.75% $390
TradeCoast
operators are also looking for more affordable options.
North $110 0.0% 15% 5.88% $297.5 Land values increased by 6.3 per cent over the past year, sitting at
an average of $253 per sqm for March 2019 and remaining about
South $111 3.5% 18% 6.00% $310 15 per cent to 35 per cent more affordable than other precincts.
Average prime grade net face rents reported the highest increase in
South West $110 4.8% 18% 6.25% $300 Brisbane (8.1 per cent for the YoY to March 2019), to $100 per sqm.
However, they remained up to 15 per cent more affordable than
Yatala $110 8.1% 19% 6.45% $252 other precincts.
Source: Colliers Edge
Industrial | Research & Forecast Report | First Half 2019 17Research &
Forecast Report
ADELAIDE
Industrial | First Half 2019
By Kate Gray Adelaide Industrial Sales Volumes
Director | Research $350,000,000
kate.gray@colliers.com $300,000,000
$250,000,000
$200,000,000
MARKET HIGHLIGHTS $150,000,000
$100,000,000
Defence spending starting with offshore patrol vessel $50,000,000
commencing $0
2007 2008 2009 2010 2011 2012 2013 2014 2015 2016 2017 2018
New supply expected to strengthen in 2019 1st Half 2nd Half
Source: Colliers International
Strong sales volumes in second half 2018 after stamp duty
Adelaide Industrial Supply
abolished
300,000
250,000
200,000
Overview 150,000
100,000
The improved interest in the Adelaide industrial market is also
50,000
underpinned by significant investment in infrastructure, increased
0
defence spending, and improved conditions for mining and energy 2007 2008 2009 2010 2011 2012 2013 2014 2015 2016 2017 2018 2019 2020 2021 2022
investment. Over $1.2 billion of defence infrastructure construction Complete DA Applied DA Approved Early Planning Under Construction
is underway to support the frigates and submarine projects due Source: Colliers International
to commence in 2020 and 2023 respectively. Investment in road
infrastructure has been a key driver along the North-South Corridor The east coast industrial markets have experienced significant
with a further $1.5 billion allocated to finish the final sections - compression in industrial yields and investors are looking to
expected to be completed within a decade. The abolishment of Adelaide to balance their portfolio with higher yielding assets. There
stamp duty for commercial transactions, which became effective is a significant amount of capital which is looking to be placed,
on 1 July 2018, has had a positive impact on sales volumes. This with the Adelaide market offering higher yields and an improved
change in legislation has positioned Adelaide as one of the most economic outlook due to investments in defence, mining, energy and
competitive places to do business and has renewed interest in the infrastructure.
Adelaide market.
Vacancy in the Adelaide industrial market has fallen to 3.6 percent,
The Adelaide industrial market has seen a significant boost in down from 4.8 percent. The Outer and Inner North both saw
sales volumes with $177 million of assets changing hands over vacancy fall to 3.1 percent and 4.2 percent respectively. The supply
the second half of 2018. This has brought total sales volumes for pipeline is expected to strengthen over the next 12 months with
2018 to $208 million which is the second highest volume of sales circa 167,000 sqm of new space expected to be completed this
on record with 2014, where over $329 million of assets were sold. year. Major projects under construction include Metcash new
Although there were no major transactions recorded in the first DC, Sigma Healthcare DC and Huhtamaki new DC. There is also
quarter this year, there is significant off market activity underway. a proposal for Woolworths to expand their distribution centre in
This will support stronger sales activity for the remainder of 2019. Adelaide.
18Sub Markets West
Net face rents in the West have remained stable with prime
Outer North
rents ranging from $100-$150/sqm and secondary net face rents
The Outer North has seen vacancy to fall to 3.7 percent for buildings between $60-$100/sqm. Incentives have also remained stable with
over 5,000 sqm. The largest development within the precinct is prime incentives at 5-15 percent and secondary at 10-15 percent.
the repurposing of the Holden site which has been rebranded to
Prime yields in the West have remained stable over the past 6
Lionsgate. As part of this redevelopment Sonnen, a battery storage
months with prime yields between 6.25-8.0 percent. Secondary
manufacturer, is setting up a manufacturing site.
yields however have tightened by 13 basis points over the last six
Drakes supermarkets are currently building a new $80 million months to range between 8.0-9.25 percent.
distribution centre at Edinburgh North. Construction has
Land values in the West have remained stable and range between
commenced on the 45,000 sqm facility which is expected to
$350-550/sqm. The high land values and rents comparable to the
complete in July 2019. As part of the new facility, over $12 million
Inner North make developing new industrial stock in this precinct
will be spent on an automated picking system to help distribute over
more challenging. It is therefore likely to result in industrial sites
23,000 products.
being converted to a higher and better use.
Net face rents for prime space have increased with ranges of
$70-$90/sqm. Secondary rents have remained stable with a range
South
of $35-$50/sqm. Incentives have remained unchanged at 10-15 Tonsley has continued to grow with further development under
percent across both prime and secondary space. the Main Assembly Body (MAB) including Ziess consolidating their
operations with a state of the art $6 million, 3,950sqm facility.
Prime yields in the Outer North have tightened by 88 basis
points over the last 12 months with a significant tightening at the Prime rents in the Inner South have grown by 4.5 percent ranging
lower end. The current range is 7.5 percent to 8.5 percent. Yield $90-$135/sqm. Secondary rents have remained stable and ranged
compression in the Outer North was greater than other Adelaide between $55-$85/sqm. Incentives have also remained stable
sub-markets as the risks around the exit of Holden have reduced. with prime incentives 5-15 percent and secondary yields at 10-15
percent.
Land values in the Outer North have remained stable over the last
12 months and is now in the range of $35-$85/sqm. Yields in the Inner South have remained stable over the past
6 months with prime yields between 6.75-8.25 percent and
Inner North
secondary 8.5-9.75 percent.
The Inner North is expected to see the bulk of the new supply with
circa 195,000 sqm of space under construction and due to complete
during 2019 and 2020. Major projects are the Sigma Healthcare DC,
Market Outlook
Woolworths DC and Huhtamaki DC. Osbourne has seen an increase The outlook for the industrial market is more positive through
in government investment in infrastructure with $1.2 billion being 2019. The supply pipeline is forecast to improve over the next two
spent on facilities to support the submarine project. As the ramp up years as a result of reasonably low vacancy and an improvement in
to construction continues, we expect this will lead to further supply demand, which should lead to more design and construct facilities.
to meet demand from supporting industries. Furthermore, relatively low vacancy rates are expected to result in
some higher than average rental growth over the next two years.
Vacancy in the Inner North has fallen to 4.2 percent, down from
Demand for investment grade stock is expected to remain high
4.8 percent over the last half. Prime net fact rents have remained
with the buyer pool strengthening, and therefore there is scope for
stable over the last 12 months and are in the range of $85-$120/
further yield compression for prime grade investment stock with
sqm. Secondary net face rents have grown by 2.7 percent and are
long WALEs.
in the range of $50-80/sqm. Incentives have remained stable with
prime incentives ranging between 5-15 percent and secondary 10-
15 percent.
Yields in the Inner North market remained stable over the last six
months with prime yields between 6.75-8.0 percent and secondary
8.0-10.0 percent.
Land values have also remained stable over the last 12 months and
fall in the range of $170-$260/sqm.
Industrial | Research & Forecast Report | First Half 2019 19Research &
Forecast Report
PERTH
Industrial | First Half 2019
By Quyen Quach Perth Industrial Space Supply
Senior Research Analyst | Research 400,000
quyen.quach@colliers.com 350,000
Industrial Space Supply (sqm)
300,000
MARKET HIGHLIGHTS 250,000
200,000
Vacancy stable 150,000
100,000
Land demand improving
50,000
Prime yields may tighten in 2019 0
2011 2012 2013 2014 2015 2016 2017 2018 2019 2020
Source: Colliers International
Overview Perth Industrial Face Rents
$140
Perth’s industrial leasing market appears to have bottomed out $120
Average rents ($ per sqm)
and is now showing modest signs of improvement. WA’s economic $100
recovery is gathering momentum, with exports leading the way on $80
stronger production volumes and rebounding commodity prices. $60
Sentiment within the resources sector further strengthened $40
following recent announcements of resource project commitments, $20
rising exploration and stabilising private investment spend. $0
Mar-06
Mar-08
Mar-09
Mar-07
Sep-06
Sep-08
Sep-05
Sep-09
Sep-07
Mar-10
Mar-12
Mar-14
Mar-16
Mar-18
Mar-15
Mar-19
Sep-10
Mar-13
Sep-12
Mar-17
Sep-14
Sep-16
Sep-18
Sep-15
Sep-13
Sep-17
Mar-11
Sep-11
Numerous resource project announcements over the past two
years, strong government infrastructure spending and robust Prime Warehouse Rents (Net Face) Secondary Warehouse Rents (Net Face)
commercial building activity is converting into improved industrial Source: Colliers International
space enquiries.
Colliers International has seen consistent growth in both tenant Vacancy continues to be a larger issue in the smaller end of the
and investor demand in space aligned with freight and logistics market, with 44% (or 336,260sqm) of available space being in the
operations. Resource projects underpin a significant proportion 2,000sqm to 5,000sqm size range. Despite this, it was the only
of this demand, as does the evolving nature of the consumer and size category that exhibited a vacancy improvement, with available
business acceptance of digital platforms, which has led businesses space falling 54,385sqm to 336,260sqm from 390,645sqm in
to shift towards more cost effective operational footprints. October 2018. This provided an offset to available space increases
of 32,110sqm and 20,760sqm in the 5,000 to 10,000sqm and
The latest Colliers industrial vacancy survey undertaken in April
>10,000sqm size categories respectively.
2019 indicates a marginal improvement from our October 2018
survey. The industrial vacancy rate across Perth’s metropolitan On a region-by-region basis, vacancy is still concentrated in the
area was estimated to be 7.7 per cent for buildings in excess of east and south, with estimated vacancy equalling 340,900sqm and
2,000sqm. This represented approximately 765,300sqm of total 303,870sqm respectively. This continues to be consistent with the
space available for lease, down from 766,825sqm in October 2018. inventory dominance of these two regions of industrial space over
The industrial vacancy rate has been trending down since the 2,000sqm; these two regions account for 88 per cent of Perth’s total
beginning of 2017, and is currently the lowest in 3 years. stock, with the north region makes up the remaining 12 per cent.
20Stable Vacancy, Stable Rents Sub Market Update
In the six months since we last reported, overall vacancy rates
North
remained stable leading prime grade rents to remain flat. While the
secondary grade have seen some instances of landlords reducing North region vacancy was at 10.3 per cent in April 2019, with
their asking rents to attract an occupier, generally speaking, approximately 120,535sqm of space over 2,000sqm on the market.
secondary grade rents have also been stable. This was up slightly from 110,500sqm recorded in October 2018.
In the March 2019 quarter, average prime face rents ranged New supply of +2,000sqm industrial buildings in the north was
between $70 and $90 per square metre. At the same time, limited to 6,520sqm. As at April 2019, only 2,150sqm of space is
secondary rents exhibited a $50 to $75 per square metre range. expected to be completed in 2019.
Prime grade incentives continued to remain stable between 15 and Prime warehouse space rents remained between $70/sqm and
20 per cent, while secondary incentives range between 10 and 25 $85/sqm during the March 2019 quarter.
per cent. South
Yields Could Tighten in 2019 South region vacancy was 8.3 per cent or 303,870sqm in April
Over the past two years, domestic institutional investors dominated 2019, which is encouragingly lower than the 9.1 per cent or
buying activity in assets over $20 million, and most were associated 330,835sqm recorded in October 2018.
with transport and logistic facilities in close proximity to major In 2018, the south region saw new space additions totalling
transport nodes. This is confirmation of the strengthening global 53,340sqm. Colliers currently expects 55,000sqm will be built in
interest in transport and logistics assets. 2019.
During 2018, 45 industrial properties in excess of $5 million Prime rents edged up slightly to range between $70/sqm and $85/
transacted for a total of $505.9 million in the Perth metropolitan sqm in the March quarter 2019.
market. This was down from 48 transactions totalling $730 million
in 2017. Investors are increasingly aware of Perth’s favourable East
market yield spread compared with other geographic locations. Vacancy was up marginally in the east region, rising to 340,900sqm
This, in combination with the WA economic turnaround story, is or 6.8 per cent of stock; up from 6.5 per cent or 325,485sqm in
underpinning sentiment and encouraging investors to take a hold or October 2018.
accumulate position.
During 2018, 33,735sqm of new supply was added to the east
Perth’s industrial market yields were ranging between 6.45 per region. Colliers is expecting a further 88,215sqm to be completed in
cent to 7.95 per cent for prime grade assets and 7.50 per cent and 2019.
8.75 per cent for secondary assets. These relatively high yields in
Prime warehouse rents in the east were generally stable at an
comparison to declining bond yields and yields in other Australian
average of $81/sqm during the March 2019 quarter.
cities is leading to projections of further yield compression in 2019.
Some of the major investment transactions that transpired over the
past six months to March 2019 included:
• 19 Miles Road, Kewdale sold for $42.25 million.
• 39 McDowell Street, Welshpool sold for $11.2 million.
• 7 Modal Crescent, Canning Vale sold for $29.3 million.
• 103 Stirling Crescent, Hazelmere sold for $15.2 million.
• 155 Lakes Street, Hazelmere sold at $8.6 million.
Land values and new supply
After a number of years of subdued conditions, land values look to
be turning the corner. The limited availability of developable core
precinct land has started to generate upward pressure on prices as
investor interest build.
Colliers analysis shows average core land values has increased
by 0.95% between 2017 and 2018. This followed four years of
declines. Core industrial land values averaged $404 per square
metre in the 2018 calendar year. Colliers expects tightly held assets
in the core precincts will underpin upward pressure on land values 15 Ashby Close, Forrestfield, Western Australia
during 2019. Sold on behalf of Perdamon Group for $20.5m
Industrial | Research & Forecast Report | First Half 2019 21You can also read