2021 Market Outlook - Amherst Capital Management
←
→
Page content transcription
If your browser does not render page correctly, please read the page content below
2021 Market Outlook

 1
SECTION PAGE

Executive Summary 03

Multi-Track Recovery 06

How Has the World Changed Post-Pandemic? 10

Housing Strength Despite the Pandemic Drag 21

Asset Class Spotlight: Building a Diversified SFR Portfolio 42

CRE Sectors at a Glance 54

Relative Value in Securitized Products 63

 2
Executive Summary

 3
Executive Summary

 MACRO OVERVIEW U.S. SINGLE-FAMILY HOUSING

 A MULTI-TRACK RECOVERY HOUSING STRENGTH WILL PERSIST INTO 2021

• Financial markets have outpaced recovery in the • Despite an economy with 8-9 million fewer jobs and continued
 real economy, driven both by Fed balance sheet pressures from the pandemic, the single-family housing market
 expansion and stimulative fiscal policy response maintained strong performance in 2020

• Stocks are at all-time highs even as 40% of jobs • Low interest rates, demand for space driven by the shift to work-
 lost in the pandemic have not yet been recovered from-home and a supply-constrained market have all contributed to
 strong sales and rental performance
• Job losses have been concentrated in the lower-
 income ranges; many office workers transitioned • We expect persistent supply constraints, supportive demographics
 to work-from-home and positive momentum to lead to another strong year in 2021

• While renters are generally more financially BUILDING A DIVERSIFIED SFR PORTFOLIO
 burdened and vulnerable, much of the initial policy
 • As single-family rental (SFR) grows as an institutional asset class, it
 response to the pandemic has focused on is important to follow a systematic approach to portfolio
 homeowners construction that optimizes risk-adjusted returns with a focus on
 durable cashflows

 • Robust, liquid debt markets currently provide attractive long-term
 financing options, which may enhance equity returns for SFR

 Source: Amherst estimates as of January 2021 based on publicly available information
 2021 REAL ESTATE MARKET OUTLOOK / 01.EXECUTIVE SUMMARY 4

Executive Summary

 U.S. COMMERCIAL REAL ESTATE SECURITIZED PRODUCTS

 LONG-TERM DEMAND SHIFTS WILL SEPARATE LOW RATES AND EVEN LOWER SPREADS
 WINNERS AND LOSERS
 • The post-pandemic recovery has been steep,
 • CRE sectors have seen a multi-track recovery with
 driven mostly by supportive monetary and fiscal
 industrial leading the way, while hotels, office and
 policy
 retail have taken the brunt of the pandemic-led
 falloff in demand • Agency MBS valuations are rich and much of the
 Agency universe remains re-financeable; A taper-
 • As the economy recovers post-vaccines, these
 tantrum 2.0 scenario has the potential to add
 demand shifts will lead to strong repositioning
 spread volatility to this market
 activity
 • AAA CMBS/SFR residential credit spreads offer a
 • We expect this repositioning and adaptive re-use to
 decent pickup vs. Agency MBS, but going lower in
 drive demand for both value-add equity capital and
 securitized credit does not offer commensurate
 transitional loans in 2021 and beyond
 rewards

 • Our research finds that the best opportunities for
 higher yields are in private transactions outside
 the securitized space, such as transitional loans

Source: Amherst estimates as of January 2021 based on publicly available information
2021 REAL ESTATE MARKET OUTLOOK / 01.EXECUTIVE SUMMARY 5
Multi-Track Recovery

 6
Markets recovered sharply over 2H 2020 even as the real
 economy lagged

 • Supported substantially by Fed asset purchases, the markets have looked past the pandemic
 towards the anticipated recovery in 2021 and beyond

 • SPX 500 index up 16% for 2020 after hitting lows in late March (down ~31% vs. YE 2019)

 • Economic fundamentals continue to lag

 METRIC 2014 2015 2016 2017 2018 2019 2020

 GDP Y-o-Y Growth(%) 2.9% 2.2% 2.1% 2.7% 2.5% 2.3% -2.9%
 ECONOMIC
 Non-Farm Payrolls Monthly Average (000s) 250 227 195 176 193 178 -852
FUNDAMENTALS
 Commercial Property Price Growth (%) 11.1% 8.6% 7.6% 8.1% 7.2% 6.4% 3.6%

 S&P 500 Price Return 11% -1% 10% 19% -6% 29% 16%

 CDX IG Spread Change (bp) 4 22 -21 -19 39 -42 5
CAPITAL MARKETS
 CDX HY Spread Change (bp) 52 113 -115 -48 143 -169 13

 CMBS BBB Spread Change (bp) -12 212 -75 -135 60 -135 150

 University of Michigan Consumer Sentiment (avg) 2 9 -1 5 2 -2 -14
 CONSUMER
 CONFIDENCE Conference Board Consumer Confidence Index (avg) 9 11 2 21 10 -2 -26

 Source: Bloomberg, US Bureau of Economic Analysis, Us Bureau of Labor Statistics, RCA, University of Michigan, Conference Board as of Dec 2020

 2021 REAL ESTATE MARKET OUTLOOK / 02.MULTI-TRACK RECOVERY 7
Employment is still lagging with ~40% of lost jobs still missing

 • After an initial COVID-related economic shock (10pp drop from 61.2% to 51.3%), the employment-
 population ratio has recovered about 6pp to 57.3%

 • ~4% of the working age population (8-9mn people) are still out of a job vs. pre-COVID levels

 60% OF THE JOB LOSSES RECOVERED NET HIRES, JOB LISTINGS AS % OF TOTAL LABOR FORCE

 160 62% 6%

 155 60%

 Employment Population Ratio, %
 4%
 150
# Persons Employed, mn

 58%
 2%
 145

 % of Labor Force
 56%
 140 0%
 54%
 135
 -2%
 52%
 130
 50% -4%
 125

 120 48% -6%

 115 46% -8%
 Dec-10

 Dec-11

 Dec-12

 Dec-13

 Dec-14

 Dec-15

 Dec-16

 Dec-17

 Dec-18

 Dec-19

 Dec-20

 Oct-20
 Jan-20

 Jun-20

 Sep-20
 Feb-20

 Aug-20
 Mar-20

 Apr-20

 May-20

 Jul-20

 Nov-20
 # Employed, mn Employment Population Ratio (right axis)
 Net Hire (% of Labor Force) New Job Opening(% of Labor Force)

 Source: US Bureau of Labor Statistics, as of January 2021

 2021 REAL ESTATE MARKET OUTLOOK / 02.MULTI-TRACK RECOVERY 8
Job losses are concentrated in lower-income ranges

• Initial job losses were concentrated in the lower-income and hourly ranges; most office workers
 were able to transition to a ‘work-from-home’ environment

• This bifurcation of job losses by income range is leading to a varied recovery

 ESTIMATED JOB LOSSES BY PRE-COVID INCOME RANGES

 30%

 25%
 % lost jobs by early April

 20%

 15%

 10%

 5%

 0%
How Has the World
Changed Post-Pandemic?

 10
Transit usage has dropped
 • In April, transit usage dropped 30-70% from pre-COVID levels

 • As of Jan 2021, transit activity still has not recovered to pre-COVID levels in many markets
 10

 0

 -10
Transit Stations % Change

 -20
 from Baseline

 -30

 -40

 -50

 -60

 -70

 -80
 Feb-20

 May-20

 Jan-21
 Mar-20

 Jul-20

 Oct-20
 Sep-20
 Apr-20

 Aug-20

 Dec-20
 Jun-20

 Nov-20
 San Francisco-Oakland-Berkeley, CA New York-Newark-Jersey City, NY-NJ-PA
 Atlanta-Sandy Springs-Alpharetta, GA Dallas-Fort Worth-Arlington, TX
 Nashville-Davidson--Murfreesboro--Franklin, TN
 Source: Google Mobility Data as of Jan 2021

 2021 REAL ESTATE MARKET OUTLOOK / 03.HOW HAS THE WORLD CHANGED POST -PANDEMIC? 11
Workplaces have emptied out
 • In April, workplace usage dropped 40-60% from pre-COVID levels

 • As of Jan 2021, employees are still spending 30-50% less time in the workplace than usual

 10
Workplace Percentage Change from Baseline, %

 0

 -10

 -20

 -30

 -40

 -50

 -60

 -70

 Dec-20
 Jun-20

 Aug-20

 Oct-20
 Sep-20

 Jan-21
 Feb-20

 Mar-20

 Jul-20
 Apr-20

 May-20

 Nov-20
 San Francisco-Oakland-Berkeley, CA New York-Newark-Jersey City, NY-NJ-PA Atlanta-Sandy Springs-Alpharetta, GA

 Dallas-Fort Worth-Arlington, TX Nashville-Davidson--Murfreesboro--Franklin, TN
 Source: Google Mobility Data as of Jan 2021

 2021 REAL ESTATE MARKET OUTLOOK / 03.HOW HAS THE WORLD CHANGED POST -PANDEMIC? 12
Brick-and-mortar retail and recreation has decreased
 • In April, retail and recreation usage had dropped 30-60% from pre-COVID levels

 • As of Jan 2021, consumers are still spending 15-50% less time in retail and recreation spaces

 10

 0
Retail and Recreation % Change

 -10

 -20
 from Baseline

 -30

 -40

 -50

 -60

 -70
 Jun-20

 Sep-20

 Dec-20
 Aug-20

 Oct-20

 Jan-21
 Feb-20

 Mar-20

 Jul-20
 Apr-20

 May-20

 Nov-20
 San Francisco-Oakland-Berkeley, CA New York-Newark-Jersey City, NY-NJ-PA Atlanta-Sandy Springs-Alpharetta, GA

 Dallas-Fort Worth-Arlington, TX Nashville-Davidson--Murfreesboro--Franklin, TN
 Source: Google Mobility Data as of Jan 2021. Retail and recreation are places like restaurants, cafes, shopping centers, theme parks, museums, libraries, and movie theaters.

 2021 REAL ESTATE MARKET OUTLOOK / 03.HOW HAS THE WORLD CHANGED POST -PANDEMIC? 13
More time is being spent at home
 • In April, residential usage increased 15-25% from pre-COVID levels

 • As of Jan 2021, people are still spending 10-20% more time at home

 30

 25

 20
Residential % Change
 from Baseline

 15

 10

 5

 0

 -5
 Feb-20

 Jun-20

 Dec-20
 Oct-20
 Aug-20

 Sep-20

 Jan-21
 Mar-20

 Jul-20
 Apr-20

 May-20

 Nov-20
 San Francisco-Oakland-Berkeley, CA New York-Newark-Jersey City, NY-NJ-PA Atlanta-Sandy Springs-Alpharetta, GA

 Dallas-Fort Worth-Arlington, TX Nashville-Davidson--Murfreesboro--Franklin, TN

 Source: Google Mobility Data as of Jan 2021

 2021 REAL ESTATE MARKET OUTLOOK / 03.HOW HAS THE WORLD CHANGED POST -PANDEMIC? 14
Spending drag on the economy persists

 • Retail sales ended 2020 down 11% overall with leisure, travel and restaurants hit the hardest

 • Alternatively, certain sectors, such as building materials, furniture stores and grocery stores have
 performed well

 SAME-STORE $ VOLUME GROWTH (% CHANGE FROM SAME MONTH 2019)

 FOOD BUILDING
 CLOTHING & FURNITURE &
 SERVICES & HEALTH & MOTOR MATERIAL &
 TRAVEL LEISURE ACCESSORIES HOME FOOD & BEV TOTAL
 DRINKING PERSONAL VEHICLES GARDEN
 STORES FURNISHINGS
 PLACES EQUIPMENT

DECEMBER -66.2 -55.0 -17.5 -13.8 -10.3 3.9 8.5 10.6 10.9 -11.4

AUGUST -75.8 -59.9 -22.1 -19.2 -6.0 10.3 11.8 11.3 13.7 -12.3

 MAY -90.4 -81.0 -51.1 -73.6 -28.3 -23.9 -53.5 14.6 -1.0 -34.4

 APRIL -59.8 -48.7 -28.6 -40.5 -9.4 -13.0 -24.1 23.5 -0.8 -18.1

 Source: US Bureau of Labor Statistics as of December 2020

 2021 REAL ESTATE MARKET OUTLOOK / 03.HOW HAS THE WORLD CHANGED POST -PANDEMIC? 15
Travel, leisure and restaurants are struggling

 • Travel, leisure, hotels and restaurants continue to be most affected by pandemic and are expected to take
 the longest to recovery

 • Closures, gathering restrictions and consumers’ prioritization of safety continue to affect these businesses

 AIR TRAVEL IS STILL SEVERELY RESTRICTED … … AS ARE RESTAURANTS

 3.0 100% 100

 Trailing 7d Travelers Pct of Same Weekday last
Total Traveler Trhoughput, Millions

 2.5 80
 80%

 2.0

 % of Last year
 60% 60

 1.5

 year
 40% 40
 1.0

 20% 20
 0.5

 0.0 0% 0

 Jun-20

 Dec-20
 Aug-20

 Oct-20
 Sep-20

 Jan-21
 Apr-20
 Mar-20

 Jul-20
 May-20

 Nov-20
 Jun-20

 Dec-20
 Aug-20

 Oct-20
 Sep-20

 Jan-21
 Mar-20

 Jul-20
 Apr-20

 May-20

 Nov-20

 # Travelers Trailing 7d avg
 Seated Diners in Opentable Network Restaurants, % of Last year
 # Travelers Trailing 7d avg (1yr ago)

 Source: Transportation Security Administration, US Government (TSA) as of January 2021 Source: Opentable.com https://www.opentable.com/state-of-industry

 2021 REAL ESTATE MARKET OUTLOOK / 03.HOW HAS THE WORLD CHANGED POST -PANDEMIC? 16
Back-to-work trackers show a slow return to the office

• Many office workers are still working from home, boosting demand for space within the residential
 sector and decreasing demand for office space

• This is especially acute in large central business districts like New York and San Francisco

 OFFICE EMPLOYEES ARE STILL WORKING FROM HOME
 100
 % Occupancy in Commercial Properties

 80

 60

 40

 20

 0
 May-20

 Sep-20

 Dec-20
 Mar-20

 Aug-20

 Jan-21
 Jun-20

 Jul-20

 Oct-20

 Nov-20
 Feb-20

 Apr-20

 NYC DC Dallas San Francisco Austin Phoenix
Source: Kastle Systems as of January 2021 Kastle’s reach of buildings, businesses and cardholders secured generates millions of access events daily as users enter office complexes, and individual company
workspaces. Charted percentages are based on daily unique authorized user entries for Wednesdays in each market relative to a pre-COVID baseline.

2021 REAL ESTATE MARKET OUTLOOK / 03.HOW HAS THE WORLD CHANGED POST -PANDEMIC? 17
Households with lower-income and lower-education levels have
 been disproportionately affected by the pandemic
 • Census Pulse Survey shows that 10-15% of renters had no confidence in their ability to pay next
 month’s rent

 • Significant variations in renters’ confidence to pay next month’s rent exist, with households with lower-
 education and lower-income levels less confident in their ability to pay

 % OF RENTERS WITH NO CONFIDENCE IN ABILITY % OF RENTERS WITH NO CONFIDENCE IN ABILITY TO PAY NEXT
 TO PAY NEXT MONTH’S RENT MONTH’S RENT BY EDUCATION LEVEL

 35%
 17%

 % of Renters with no confidence in ability to pay next
% of Renters with no confidence in ability to pay

 30%
 16%

 25%
 15%
 next months rent

 14% 20%

 months rent
 13% 15%

 12% 10%

 11% 5%

 10% 0%
 Dec-20
 Oct-20
 Aug-20

 Sep-20
 Jul-20
 Apr-20

 May-20

 Nov-20

 Sep-20

 Oct-20

 Dec-20
 Aug-20
 May-20

 Jul-20
 Apr-20

 Nov-20
 No Confidence Less than high school High school or GED
 Some college/associate's degree Bachelor's degree or higher
 Source: US Bureau of Labor Statistics as of January 2021

 2021 REAL ESTATE MARKET OUTLOOK / 03.HOW HAS THE WORLD CHANGED POST -PANDEMIC? 18
Federal aid efforts targeted towards housing were limited to
 ~48mn households with government-backed financing

 • CARES Act provided forbearance and helped buffer the pandemic impact on the higher income
 48mn borrowers and renters

 • 28mn more vulnerable renters were among the remaining 76mn were who were not covered by
 forbearance measures

 ALL U.S. HOUSEHOLDS 124.4MN (100%)

 Government Supported Financing 48.1mn (38.6%) No Government Support of Financing 76.3mn (61.4%)

 Owned Occupied
 Owner Occupied with a Owner Occupied with a Free and without
 Renter Occupied - 12.3mn (9.9%) mortgage 35.7mn Renter Occupied - 28.0mn (22.5%) mortgage - 15.6mn Clear paying rent
 (28.7%) (12.6%) 29.9mn 2.8mn
 (24.0%) (2.2%)

 MF + MF +
1-4 Family 1-4 Family 1-4 Family
 MF Rental 9.6mn Other 1-4 Family Rental 17mn Other
 Rental Owned MF + Other Owned Owned
 Owned (13.7%) Owned
 2.8mn (7.7%) 33.5mn 11mn (8.9%) 14.6mn
 2.3mn 1.0mn
 (2.2%) (26.9%) (11.8%)
 (1.8%) (0.8%)

Individual Individual Investor Individual Investor Individual Investor
 Owned Owned Owned Owned Owned Owned Owned
 2.8mn 3.2mn 6.3mn 16.7mn 340k 3.2mn 6.2mn
 (2.2%) (2.6%) (5.1%)* (13.4%) (0.3%) (2.6%) (5.0%)

 Source: US Census ACS Survey and US Census CPS/HVS Q1 2020, Amherst estimates as of December 2020
 2021 REAL ESTATE MARKET OUTLOOK / 03.HOW HAS THE WORLD CHANGED POST -PANDEMIC? 19
Renters are more burdened and more vulnerable

 • Renters are more likely than homeowners to have incomes below the area median income (AMI)

 • Renters are also more likely to have to spend a larger percentage of their income on housing payments

 AVERAGE HOUSING COST BURDEN AS A FRACTION OF
 DISTRIBUTION OF RENTER VS. OWNER INCOMES
 HOUSEHOLD INCOME

 % spending >50% of income on 25.4%
Owned with mortgage 4%5% 11% 79%
 housing 11.4%

 % spending >30% of income on 50.5%
Owned Free and Clear 13% 13% 18% 56%
 housing 28.8%

 33.0%
 Renter 24% 17% 20% 40% % income spent on housing
 24.9%

 0% 20% 40% 60% 80% 100% 0% 20% 40% 60%
 Renters Owners with Mortgage
 % of Households in each group

 80% of AMI Note: Average for all sample households where the reported Owner cost or gross rent is
Housing Strength
Despite the Pandemic Drag

 21
Factors that would typically roil markets did not faze the
 housing market in 2020

• High unemployment, job and income losses, and an overall slowdown in economic
 activity, would traditionally put downward pressure on the housing market

• However, the single-family housing market has been surprisingly resilient due to a
 variety of factors impacting supply and demand

Low interest rates Migration out of denser Demand for space as Constrained single-
 urban areas into lower- work-from-home and family housing supply
 cost, low-tax, less-dense remote learning
 cities and suburbs normalizes

 2021 REAL ESTATE MARKET OUTLOOK / 04.HOUSING STRENGTH DESPITE THE PANDEMIC DRAG 22
U.S. home price growth accelerated through 2020

 • The Amherst Home Price Index (HPI) grew 9.4% YoY as of October 2020

 • This appreciation was the fastest gain in home prices in more than a decade

 • The compound annual growth rate (CAGR) over the last 20 years is ~3.6%

 • As of YE 2020, national home prices were ~3.6% below fundamentals, well below the boom prior to
 the Great Financial Crisis (GFC) when homes were overvalued by 38% on average

 AMHERST HOME PRICE INDEX YOY CHANGES AMHERST HOME PRICE INDEX AND FUNDAMENTAL VALUE
 (JAN ‘00 – OCT‘20) (DEC ’94 – OCT ‘20)
 15%
 180 40%

 %Overvalued(+ve)/Undervalued(-ve)
 160
 10% 30%
Amherst HPI YoY Change

 Actual/Fundamental HPI
 140

 120 20%
 5%
 100
 10%
 0% 80

 60 0%

 -5% 40
 -10%
 20
 -10% 0 -20%
 Oct-00 Oct-04 Oct-08 Oct-12 Oct-16 Oct-20 Oct-00 Oct-04 Oct-08 Oct-12 Oct-16 Oct-20
 Overvalued(+ve)/Undervalued(-ve) Percentage
 Actual HPI
 Source: Amherst estimates as of January 2021 based on publicly available information
 Fundamental HPI
 2021 REAL ESTATE MARKET OUTLOOK / 04.HOUSING STRENGTH DESPITE THE PANDEMIC DRAG 23
Lower interest rates and a desire for more space driving
single-family housing demand higher

• After an initial decline in the immediate post-COVID shock, sales of new and existing homes are
 sharply up again and are above pre-COVID levels

 • NEW AND EXISTING HOMES SALES SPIKED SHARPLY AFTER THE INITIAL POST-COVID SLOWDOWN

 1100 7

 1000 6.5

 Existing Home Sales, mn
 New Home Sales, 000s

 900 6

 800 5.5

 700 5

 600 4.5

 500 4

 400 3.5
 Jan-19

 Sep-19

 Jan-20

 Sep-20
 Mar-19

 May-19

 Jul-19

 Nov-19

 Mar-20

 May-20

 Jul-20

 Nov-20
 New Home Sales, 000s Existing Home Sales (right axis), mn

 Source: U.S. Census Bureau as of January 2021, NAR as of January 2021

2021 REAL ESTATE MARKET OUTLOOK / 04.HOUSING STRENGTH DESPITE THE PANDEMIC DRAG 24
Sales velocity jumped higher in 2020

• Homes sales velocity has been steadily increasing since 2017, but made a significant leap in 2020

• Home sales velocity is measured as the portion of January-September listings that sold within the first
 30-60-90 days

 HOME SALES VELOCITY JUMPED SIGNIFICANTLY IN 2020 (JANUARY-SEPTEMBER 2017-2020)

 70%
 64.9%
 % of listings sold in corresponding number of days

 11 pp

 60%
 52.7% 54.1%
 50.6%
 50% 46.7%

 40%
 35.7% 36.7%
 32.8%

 30%

 20%

 10% 6.2% 6.4% 6.9%
 5.0%

 0%
 30 days 60 days 90 days

 2017 2018 2019 2020
 Source: Amherst estimates as of January 2021 based on publicly available information
 2021 REAL ESTATE MARKET OUTLOOK / 04.HOUSING STRENGTH DESPITE THE PANDEMIC DRAG 25
% of listings sold in 90 days

 •

 20%
 40%
 60%
 80%
 100%

 0%
 Ogden-Clearfield, UT

 Salt Lake City, UT

 Columbus, OH

 Seattle-Tacoma-Bellevue, WA

 Indianapolis-Carmel-Anderson, IN

 Denver-Aurora-Lakewood, CO

 Phoenix-Mesa-Chandler, AZ

 Raleigh-Cary, NC

 Kansas City, MO-KS

 Louisville/Jefferson County, KY-IN

 Tucson, AZ

 Charlotte-Concord-Gastonia, NC-SC

2021 REAL ESTATE MARKET OUTLOOK
 Durham-Chapel Hill, NC

 Oklahoma City, OK

 Source: Amherst estimates as of January 2021 based on publicly available information
 Memphis, TN-MS-AR

 Fayetteville, NC

 *’Post-COVID’ defined as April-September 2020; **‘Pre-COVID’ defined as April-September 2019
 Nashville-Davidson--Murfreesboro--Franklin,…

 Winston-Salem, NC

 St. Louis, MO-IL

 Greensboro-High Point, NC

 Dallas-Fort Worth-Arlington, TX

 Tampa-St. Petersburg-Clearwater, FL

 Birmingham-Hoover, AL
 90-DAY POST-COVID HOMES SALES VELOCITY

 Atlanta-Sandy Springs-Alpharetta, GA

 Jacksonville, FL

 Lakeland-Winter Haven, FL

 Orlando-Kissimmee-Sanford, FL

 Deltona-Daytona Beach-Ormond Beach, FL
 U.S. 2019 54%

 North Port-Sarasota-Bradenton, FL

 Las Vegas-Henderson-Paradise, NV
 Post-COVID, homes sales velocity picked up further

 Houston-The Woodlands-Sugar Land, TX

 Port St. Lucie, FL
 Average U.S. homes sales velocity were at a 68% pace post-COVID* vs. 54% pre-COVID**

 Cape Coral-Fort Myers, FL

 San Antonio-New Braunfels, TX
/ 04.HOUSING STRENGTH DESPITE THE PANDEMIC DRAG

 Miami-Fort Lauderdale-Pompano Beach, FL
 U.S. 2020 68%

 26
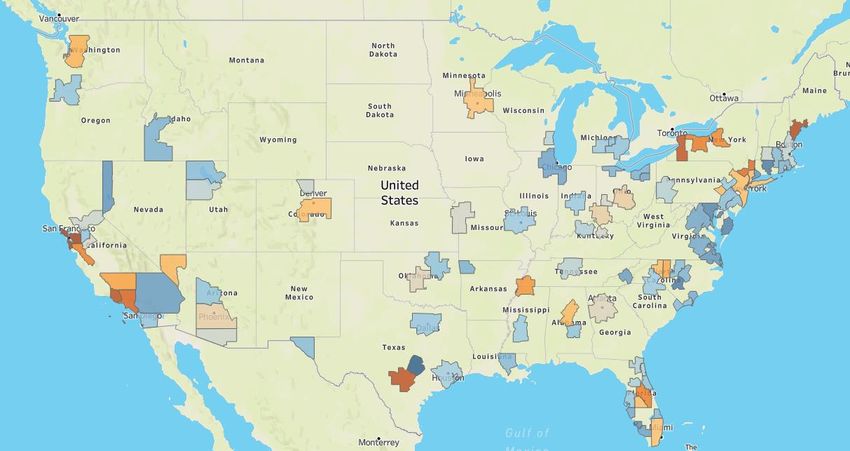
Migration from denser cities drove largest velocity spikes
• Homes sales velocities are especially high in the mid-Atlantic, Texas and parts of Florida, as well as
 areas outside major cities as seen in California (e.g., Riverside outside L.A.)

 2020 HOMES SALES VELOCITY INCREASES

Source: Amherst estimates as of January 2021 based on publicly available information

2021 REAL ESTATE MARKET OUTLOOK / 04.HOUSING STRENGTH DESPITE THE PANDEMIC DRAG 27
Out-migration is accelerating in large, dense cities
 • Data from moving companies shows accelerated migrations out of major cities like San Francisco,
 Seattle and New York and into cities like Salt Lake City, Louisville and Richmond
 TOP 10 CBSAs BY CHANGE IN OUTMIGRATION

 POPULATION % OUTBOUND % OUTBOUND CHANGE IN %
 CBSA
 2019 MAY TO SEP 2019 MAY TO SEP 2020 OUTBOUND
 San Francisco-Oakland-Berkeley, CA 4,731,803 53% 61% 8%
 Seattle-Tacoma-Bellevue, WA 3,979,845 43% 50% 7%
 New York-Newark-Jersey City, NY-NJ-PA 19,216,182 72% 79% 7%
 San Antonio-New Braunfels, TX 2,550,960 48% 54% 6%
 San Jose-Sunnyvale-Santa Clara, CA 1,990,660 61% 67% 6%
 Houston-The Woodlands-Sugar Land, TX 7,066,141 49% 54% 6%
Washington-Arlington-Alexandria, DC-VA-MD-WV 6,280,487 51% 57% 6%
 Memphis, TN-MS-AR 1,346,045 41% 47% 5%
 Atlanta-Sandy Springs-Alpharetta, GA 6,020,364 44% 50% 5%
 Las Vegas-Henderson-Paradise, NV 2,266,715 44% 49% 5%

 BOTTOM 10 CBSAs BY CHANGE IN OUTMIGRATION (MOST IN-MIGRATION)

 POPULATION % OUTBOUND % OUTBOUND CHANGE IN %
 CBSA
 2019 MAY TO SEP 2019 MAY TO SEP 2020 OUTBOUND
 Sacramento-Roseville-Folsom, CA 2,363,730 50% 47% -4%
 Charlotte-Concord-Gastonia, NC-SC 2,636,883 39% 35% -4%
 Columbus, OH 2,122,271 55% 50% -4%
 Indianapolis-Carmel-Anderson, IN 2,074,537 55% 49% -6%
 Cleveland-Elyria, OH 2,048,449 58% 51% -7%
 Birmingham-Hoover, AL 1,090,435 52% 45% -7%
 Detroit-Warren-Dearborn, MI 4,319,629 66% 58% -8%
 Richmond, VA 1,291,900 55% 44% -11%
 Louisville/Jefferson County, KY-IN 1,265,108 52% 41% -12%
 Salt Lake City, UT 1,232,696 56% 43% -13%
 Source: United Van lines as of Oct 2020
 2021 REAL ESTATE MARKET OUTLOOK / 04.HOUSING STRENGTH DESPITE THE PANDEMIC DRAG 28
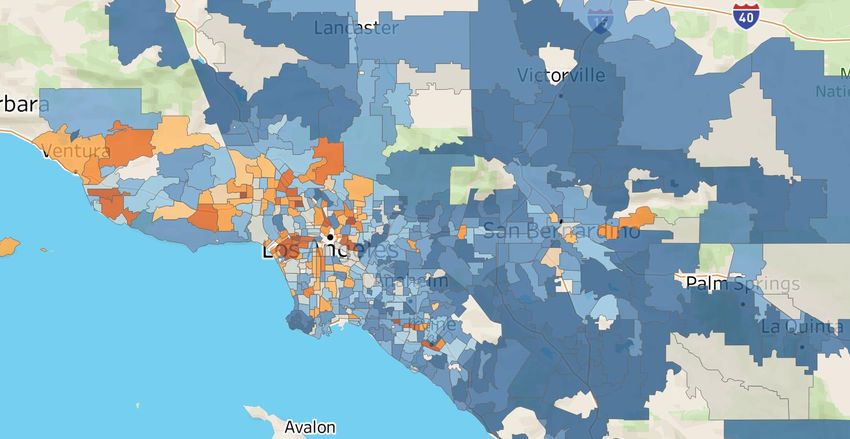
Within the same metro, dense urban areas are seeing slowing
homes sales while suburbs are seeing acceleration
• Areas near Downtown Los Angeles have weaker pick up in sales velocities – and in some areas
 declining velocities – while the city’s outlying areas have seen steep increases in sales velocities

 LOS ANGELES

Source: Amherst estimates as of January 2021 based on publicly available information

2021 REAL ESTATE MARKET OUTLOOK / 04.HOUSING STRENGTH DESPITE THE PANDEMIC DRAG 29
Multi-track recovery has led to a shift in home buyer profile

 Homes sales Homebuyers with Average FICO First-time borrowers
 velocities are the higher-income and scores have have a FICO score
steepest for larger, higher-education shifted higher for that is 10 points
 more expensive levels are leading the all borrowers higher on average,
 homes increased demand despite an increase in
 for housing volumes vs. same
 period in 2019

2021 REAL ESTATE MARKET OUTLOOK / 04.HOUSING STRENGTH DESPITE THE PANDEMIC DRAG 30
Larger, more expensive homes saw the biggest pickup in
 sales velocities

 • Sales velocities are up across all asset sizes and pricing tiers but have accelerated the most for homes in
 the highest tiers

 SALES VELOCITY BY PRICE TIER SALES VELOCITY BY SQFT

 73%
 77%

 71%
 71%

 18 pp

 62%
 62%
% OF LISTINGS SOLD IN 90 DAYS

 65%

 % OF LISTINGS SOLD IN 90 DAYS

 59%
 63%

 63%
 63%
 60%

 60%
 57%

 44%
 46%
 43%
 40%

 BOTTOM 33% MID 33% TOP 33% 2500 SQFT

 2017 2018 2019 2020 2019 2020

 Source: Amherst estimates as of January 2021 based on publicly available information

 2021 REAL ESTATE MARKET OUTLOOK / 04.HOUSING STRENGTH DESPITE THE PANDEMIC DRAG 31
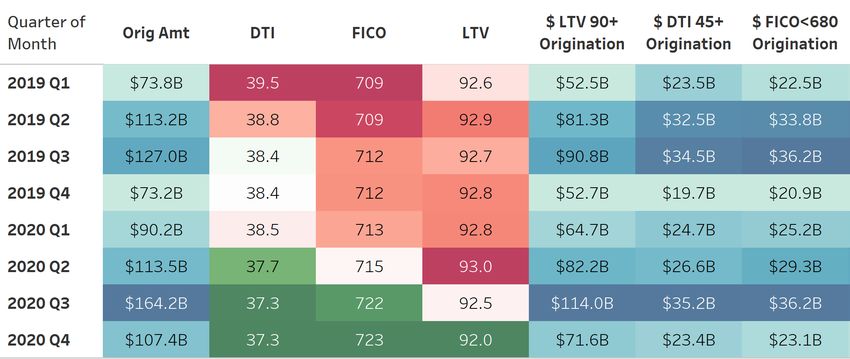
Purchase demand shifted to better FICO, lower DTI, lower LTVs

• Homebuyer profiles are shifting to higher FICO, lower DTI and lower LTV

 Quarter

 *

 *

 * October – November

 Source: EMBS as of December 2020

 2021 REAL ESTATE MARKET OUTLOOK / 04.HOUSING STRENGTH DESPITE THE PANDEMIC DRAG 32
First-time homebuyer demand is driven primarily by
individuals with higher income and education levels

• First-time buyers have +10 points on their FICO score vs. repeat buyers

• New demand driven primarily by homebuyers with higher-income, higher-education levels

 Quarter

 *

 *

 * October – November

 Source: EMBS as of December 2020

2021 REAL ESTATE MARKET OUTLOOK / 04.HOUSING STRENGTH DESPITE THE PANDEMIC DRAG 33
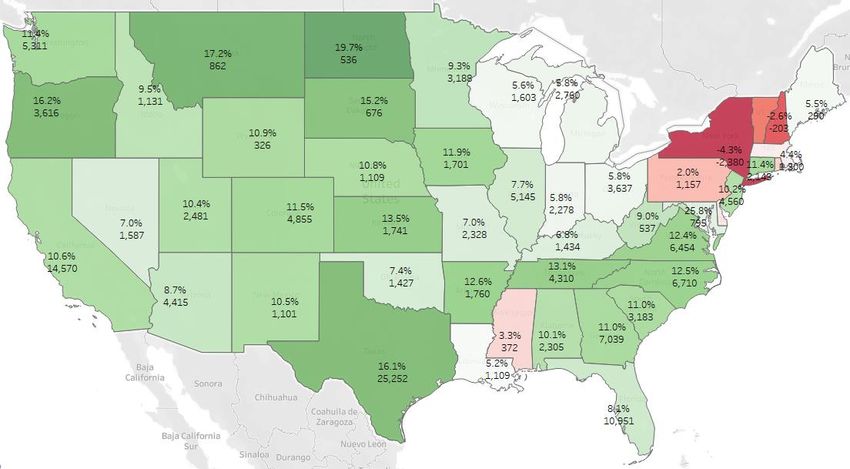
Rate of first-time homebuyers grew by double digits across U.S.

 INCREASE OF FIRST-TIME HOMEBUYERS BY STATE (% AND COUNT)

Source: EMBS as of December 2020

2021 REAL ESTATE MARKET OUTLOOK / 04.HOUSING STRENGTH DESPITE THE PANDEMIC DRAG 34
Strong absorption has led to record-low inventories

 New listings dropped Supply for 2020 almost Ultimately, strong demand
sharply in March after the caught up with last drove for-sale inventory to
 COVID pandemic hit; year’s levels, ending 5% record lows
delayed listings were back lower vs. 2019
on the market in summer
 and fall

2021 REAL ESTATE MARKET OUTLOOK / 04.HOUSING STRENGTH DESPITE THE PANDEMIC DRAG 35
Sales listings picked up during the summer, leading to total
 supply in 2020 only marginally below 2019 levels

 • New listings dropped sharply in March at the onset of COVID, but the pace of new listings recovered
 quickly by June

 • Cumulative new listings ended 2020 marginally lower than 2019 levels

 WEEKLY NEW LISTINGS CUMULATIVE NEW LISTINGS

 60,000
 2,020,000
 55,000 1,820,000

 50,000 1,620,000

 1,420,000
Number of listings

 Number of listings
 45,000
 1,220,000
 40,000 1,020,000

 35,000 820,000

 620,000
 30,000
 420,000
 25,000
 220,000

 20,000 20,000

 2019 2020 2019 2020

 Source: Amherst Tabulation of Corelogic MLS database as of December 2020
 2021 REAL ESTATE MARKET OUTLOOK / 04.HOUSING STRENGTH DESPITE THE PANDEMIC DRAG 36
Accelerating single-family home demand caused inventories
to drop ~20% YoY

 • For-sale inventory began 2020 12% below 2019 levels and further widened to -23% by May

 • A recovering market and an improved listing pace closed the gap to -18% by the end of November

 FOR-SALE INVENTORY (2019 VS. 2020)

 850,000

 800,000

 750,000
 Number of For Sale Listings

 700,000 -23%

 650,000

 600,000
 -12% -18%
 550,000

 500,000

 450,000

 400,000
 Jan-20 Feb-20 Mar-20 Apr-20 May-20 Jun-20 Jul-20 Aug-20 Sep-20 Oct-20 Nov-20 Dec-20

 2019 2020

Source: Amherst Tabulation of Corelogic MLS database as of December 2020
2021 REAL ESTATE MARKET OUTLOOK / 04.HOUSING STRENGTH DESPITE THE PANDEMIC DRAG 37
SFR inventory fell even faster and is down 35% YoY

• Available SFR rental inventory started to fall rapidly in early June, ending 2020 35% below 2019 levels

• This led to rapid re-lease rent growth in SFR even as renewal growth remained more range-bound

 RENTAL INVENTORY ( 2018 VS. 2019 VS. 2020)

 55,000

 50,000
Number of For Rent Listings

 45,000
 -35%
 40,000

 35,000

 30,000

 25,000

 20,000
 Jan-20 Feb-20 Mar-20 Apr-20 May-20 Jun-20 Jul-20 Aug-20 Sep-20 Oct-20 Nov-20 Dec-20

 2020 2019 2018

Source: Amherst Tabulation of Corelogic MLS database as of December 2020
2021 REAL ESTATE MARKET OUTLOOK / 04.HOUSING STRENGTH DESPITE THE PANDEMIC DRAG 38
While housing deficits persist, long-term fundamentals
 are positive

 • Population growth driven by millennial household formation will continue to fuel housing demand with
 household growth projected to increase at a faster rate through 2025 vs. 2010-2018 pace, which
 averaged 94bps over that period

 • The lack of homes built post-GFC has led to an estimated deficit of nearly 3 million homes2

 CONSTRUCT I ON DEFICIT POST -CRISIS SHOULD
 HOUSEHO L D GROWTH TO PICK UP 1
 SUPPORT DEMAND 2

 2.5% 1,000 4,000

 Cumulative construction surplus/deficit, 000s
 Annual House construction surplus/deficit, 000s
 Based on HVS Surveys JCHS
 Forecast 800
CAGR or Y/y growth rates

 3,000
 2.0% 600
 2,000
 400
 1.5%
 2010-2018 200 1,000
 average (94bps)
 0 0
 1.0%
 -200
 -1,000
 0.5% -400
 -2,000
 -600
 0.0% -800 -3,000
 1959-1969
 1955-1959

 1969-1979
 1979-1989
 1989-1999
 1999-2009
 2009-2010
 2010-11
 2011-12
 2012-13
 2013-14
 2014-15
 2015-16
 2016-17
 2017-18
 2018-2023
 2023-2028

 2003

 2016
 2001
 2002

 2004
 2005
 2006
 2007
 2008
 2009
 2010
 2011
 2012
 2013
 2014
 2015

 2017
 2018
 2019
 Annual house construction deficit Cumulative deficit (Right Axis)

 Source: (1) Household growth was derived by using population estimates and assuming the household rate by age group remains at 2017 levels provided by the Harvard Joint Center for Housing Studies as of
 YE 2018 (2) Amherst tabulation of U.S. Census bureau data on U.S. Housing Units Starts as of December 2020. Note: Annual deficit is shown as the difference between homes constructed in the year vs the
 longer run average from 1960-2000.

 2021 REAL ESTATE MARKET OUTLOOK / 04.HOUSING STRENGTH DESPITE THE PANDEMIC DRAG 39
High-growth regions see corresponding high housing deficits

• Most supply-constrained areas are regions with strong population growth e.g., Florida, Texas, Colorado

• Areas like the Midwest and Northeast, which have declining populations, have excess housing supply

Source: Amherst estimates based on Census ACS data from 2005-2019 as of December 2020
Note: We estimate the underserved population based on the difference in population growth and growth in housing stock over the 2005 and 201 period. We convert this to under-construction, using each MSAs average
Population per housing unit ratio across the time period. Finally this number of homes is expressed as a percentage of the 2018 housing stock. Positive numbers show undersupply and negatives show oversupply

2021 REAL ESTATE MARKET OUTLOOK / 04.HOUSING STRENGTH DESPITE THE PANDEMIC DRAG 40
2021: SFR trends to watch

 Housing fundamentals are As the economy starts to truly
 expected to stay strong with recover from the pandemic,
 fiscal and monetary policy we expect the multi-track
 surprises posing the main risk recovery we have seen so far
 to begin to normalize

 Affordability concerns should be Overall, housing is expected to be a bright
 somewhat mitigated by supportive spot vs. other real estate asset classes,
 fiscal policy response, low rates even with a modest sell-off in rates, as
 and continued Fed engagement long as the overall post-pandemic fiscal
 keeping mortgage rates low and monetary policy responses remain
 in-line with market expectations

The views expressed herein are for information purposes only and are derived by Amherst from current market conditions and assumptions, which may materially change over time. Please see important disclosures at the 41
end of this presentation.
Asset Class Spotlight:
Building a Diversified
SFR Portfolio

 42
SFR is a huge asset class with only ~2% of the market
 institutionally owned 1

• The institutional SFR industry has
 grown significantly in the U.S. over
 the last few years but remains only All Housing units $124MM - $35Tn
 about 2% of all SFR units

• The top 10 SFR owners hold
 Renter occupied Owner occupied
 ~255K units vs. multi-family where 45mn 80mn
 the top 10 owners own about 3-4x $10tn $26tn
 more units

• We expect rapid growth in Single-Family Rental Multifamily Rental Single-family Other 9mn
 15mn 30mn 71mn
 institutional SFR portfolios over the $4tn $24tn
 $2tn
 $6tn
 coming years

• With this in mind, we examine a Institutional
 Investors 268k
 systematic approach to portfolio
 $83bn
 construction in the SFR space with
 the objective of maximizing the
 risk–reward
 Source: Amherst Tabulation of CoreLogic Data as of September 2020, Census AHS
 1Compared to multifamily at ~55% institutional ownership.

 Note: All percentages are expressed as a proportion of all households; box sizes are intended to show the breakdown of SFR
 ownership and are not fully to scale; all boxes in the same row add up to the corresponding numbers in the row above

 2021 REAL ESTATE MARKET OUTLOOK / 05.BUILDING A DIVERSIFIED SFR PORTFOLIO 43
How to approach SFR portfolio construction

• The total return for owning real estate assets, including SFR, primarily comes from three sources:

 Ongoing free cash flow Price appreciation Free cash flow margin
 (current cap-rate) (driven by increase in rents expansion
 + cap-rate compression) (better operational efficiencies)

• The volatility of total return is the measure of the overall risk. The goal is to have strong, durable
 cashflows and maximize the total return while controlling for risk
• Some approaches to portfolio construction focus on maximizing ongoing free cash flow or price
 appreciation, e.g., buying higher cap-rates or focusing on areas with the highest rent growth
• However, these approaches face two problems:
 • It is difficult to predict with conviction which markets will see persistent and continued
 growth in demand
 • It ignores the relative risks across different markets (e.g., the highest total return markets may
 also have high volatility of cashflows and high risk)

2021 REAL ESTATE MARKET OUTLOOK / 05.BUILDING A DIVERSIFIED SFR PORTFOLIO 44
A systematic approach to SFR portfolio construction
• We recommend an approach to portfolio construction that uses a risk-adjusted framework, similar
 to a mean-variance optimization

• An optimal portfolio seeks to maximize the Sharpe ratio or maximize the total return with a minimum
 Sharpe ratio constraint; to construct this for SFR:

 First, we need a cross-market variance-covariance matrix based on our proprietary long-
 term return and HPA data

 Next, we calculate the forward expected total return on homes based on current home
 prices and current/forward rents in each market

For #2 above, we make some adjustments:
• It is important to account for ‘market impact’ costs; for example, if $100mn is allocated to a market
 at 8% returns, to allocate $500mn to the same market, we would expect returns to drop

• We estimate this ‘impact cost’ based on our proprietary models by analyzing where homes have
 traded in the past; we use this to develop volume-return tradeoff curves whereby allocating more to
 a market reduces its expected return

 Using the results of the above analysis, we calculate optimal portfolio allocations

2021 REAL ESTATE MARKET OUTLOOK / 05.BUILDING A DIVERSIFIED SFR PORTFOLIO 45
Using historical data to estimate variance-covariance matrix

 • Consider just two sample markets: since 1991 they have average HPA of 3.3% and 3.5%, and
 volatility of 2.35% and 1.75%, respectively

 • The correlation between the two markets is 52%; the covariance matrix is shown below in green,
 which can be used to estimate overall portfolio volatility for different weights

 • This can be expanded to more than just 2 markets, our full optimization uses data across all
 candidate markets under consideration

 HPI IN TWO SAMPLE MARKETS SUMMARY STATISTICS
 180
 MARKET 1 MARKET 2
 160
 140 Simple Average Annualized HPA 3.33% 3.48%
Home Price Index

 120 Standard Deviation of Annual HPA 2.35% 1.75%
 100 Variance of Annual HPA 0.055% 0.030%

 80
 MARKET 1 MARKET 2
 60
 40 Market 1 100% 52%
 20 CORRELATION MATRIX
 Market 2 52% 100%
 0
 Jan-09
 Jan-91
 Jan-93
 Jan-95
 Jan-97
 Jan-99
 Jan-01
 Jan-03
 Jan-05
 Jan-07

 Jan-11
 Jan-13
 Jan-15
 Jan-17
 Jan-19

 Market 1 0.055% 0.021%
 COVARIANCE MATRIX
 Market 2 0.021% 0.030%
 Source: Amherst estimates as of January 2021 based on publicly available information

 2021 REAL ESTATE MARKET OUTLOOK / 05.BUILDING A DIVERSIFIED SFR PORTFOLIO 46
Example of volume cap-rate tradeoff curve
 • We start with all home transactions within the selected time period and underwrite net cash flow
 for each

 • Next, we make MTM adjustments on price paid, model repair costs and forecast rents; this allows
 us to compute a prospective ‘cap-rate’ on each ‘opportunity’ that the market provided

 • We rank-order these opportunities to get the volume-return tradeoff curves

 • We make other assumptions on how efficiently homes can be purchased along this curve

 VOLUME CAP-RATE TRADEOFF CURVE VOLUME CAP-RATE TRADEOFF CURVE
 CUMULATIVE CAP-RATE
 BASIS TO AVERAGE CAP-
PERCENTILE CUT
 # OF
 ACQUIRE &
 TO ACQUIRE ALL HOMES
 RATE TO ACQUIRE 7.0%
 PROPERTIES (UP TO & INCLUDING
 REPAIR ($MN) (JUST THIS BUCKET)
 THIS BUCKET)
 0% to 5% 2264 $463 5.9% 5.9% 6.0%
 5% to 10% 2027 $463 5.4% 4.9%
 10% to 15% 1949 $463 5.2% 4.7%
 15% to 20% 1904 $463 5.0% 4.5% 5.0%
 20% to 25% 1862 $463 4.9% 4.4%
 25% to 30% 1814 $463 4.8% 4.3%
 4.0%

 Cap-rate
 30% to 35% 1786 $463 4.7% 4.2%
 35% to 40% 1746 $463 4.6% 4.1%
 40% to 45% 1715 $463 4.6% 4.0% 3.0%
 45% to 50% 1687 $463 4.5% 3.9%
 50% to 55% 1653 $463 4.4% 3.9%
 55% to 60% 1624 $463 4.4% 3.8% 2.0%
 60% to 65% 1600 $463 4.3% 3.7%
 65% to 70% 1571 $463 4.3% 3.6%
 70% to 75% 1534 $463 4.2% 3.5%
 1.0%
 75% to 80% 1518 $463 4.2% 3.4%
 80% to 85% 1485 $463 4.1% 3.3% 0.0%
 85% to 90% 1452 $463 4.1% 3.2%
 0 2,500 5,000 7,500 10,000
 90% to 95% 1429 $463 4.0% 3.0% Millions
 95% to 100% 1380 $463 4.0% 2.6%
 Cumulative Cap-rate to Acquire all home upto and including this bucket
 Source: Amherst estimates as of January 2021 based on publicly available information Average Cap-rate to acquire just this bucket
 2021 REAL ESTATE MARKET OUTLOOK / 05.BUILDING A DIVERSIFIED SFR PORTFOLIO 47
Calculate optimal portfolio allocations

• Using this framework, optimal portfolio allocations can be calculated for each candidate
 market/region

• The optimization strategy is to either:
 • Maximize the Sharpe ratio (Portfolio Return – Risk-Free Rate)/(Portfolio Volatility)
 OR
 • Maximize return subject to a constraint of a minimum Sharpe Ratio, e.g., min 2x Sharpe Ratio

• For any given allocation, portfolio vol can be calculated as ∗ ∗ where is the vector of
 assets’ weights and is the variance-covariance matrix

• To calculate expected return, for a specific allocation to a market, the volume-return tradeoff curves
 from the previous slide are used along with expected rent/NOI growth

• The optimization solver then uses these tradeoff curves and other reasonability constraints to solve
 for the optimal allocation in each market

• In the example on the next slide, we maximize returns while holding the Sharpe ratio at 2x for two
 sets of capital allocations $500mn and $2bn

2021 REAL ESTATE MARKET OUTLOOK / 05.BUILDING A DIVERSIFIED SFR PORTFOLIO 48
12-month buy order optimization example: $500mn vs $2bn
 • Calculating the results of two optimization runs: $500mn over and $2bn both over a 12-month period

 • $500mn order yields a 7.8% return, but decreases to 7% if the order is 4x larger ($2bn order)

 • Allocations shift from small, low-beta markets to the bigger markets for the larger size order

 $500MN ORDER FINAL ALLOCATIONS AND RETURN $2BN ORDER FINAL ALLOCATIONS AND RETURN
 Average Average
 City Weight Forward return City Weight Forward return
 Cap rate cap rate
 Market 1 10.0% 8.0% 5.4% Market 1 10.0% 7.2% 4.6%
 Market 2 4.0% 7.8% 5.1% Market 2 5.6% 6.8% 4.2%
 Market 3 2.8% 7.7% 5.3% Market 3 8.0% 6.6% 4.3%
 Market 4 3.7% 7.8% 5.6% Market 4 1.3% 7.6% 5.3%
 Market 5 10.0% 7.7% 5.1% Market 5 9.0% 7.2% 4.6%
 Market 6 3.9% 7.7% 4.7% Market 6 2.2% 7.3% 4.3%
 Market 7 2.6% 7.7% 5.0% Market 7 7.5% 6.7% 4.1%
 Market 8 1.0% 7.6% 5.6% Market 8 3.7% 6.5% 4.5%
 Market 9 1.4% 7.8% 5.4% Market 9 0.9% 7.3% 4.7%
 Market 10 8.2% 7.7% 5.2% Market 10 2.6% 7.5% 5.1%
 Market 11 3.5% 7.9% 5.4% Market 11 3.3% 7.0% 4.5%
 Market 12 8.0% 7.7% 5.2% Market 12 10.0% 6.9% 4.3%
 Market 13 2.1% 7.8% 5.5% Market 13 1.0% 7.4% 5.0%
 Market 14 1.7% 7.8% 5.2% Market 14 1.2% 7.2% 4.6%
 Market 15 8.9% 7.8% 5.3% Market 15 10.0% 6.9% 4.5%
 Market 16 10.0% 7.9% 5.2% Market 16 6.5% 7.5% 4.8%
 Market 17 1.0% 7.4% 5.3% Market 17 2.6% 6.7% 4.7%
 Market 18 5.6% 7.6% 5.2% Market 18 2.8% 7.3% 5.0%
 Market 19 4.4% 7.6% 5.1% Market 19 5.6% 7.0% 4.6%
 Market 20 1.1% 7.9% 5.6% Market 20 0.4% 7.6% 5.2%
 Market 21 5.0% 8.1% 4.7% Market 21 5.0% 7.3% 3.9%
 Market 22 1.1% 7.7% 5.3% Market 22 1.1% 7.0% 4.5%
 Portfolio level 7.8% 5.2% Portfolio level 7.0% 4.5%
 Portfolio Sharpe Portfolio Sharpe
 2 2
 Ratio Ratio

 Source: Amherst estimates as of January 2021 based on publicly available information
 49
 2021 REAL ESTATE MARKET OUTLOOK / 05.BUILDING A DIVERSIFIED SFR PORTFOLIO
SFR offers attractive risk-adjusted returns

 • S&P 500 Sharpe Ratio was ~90% over the last 5 years

 • The technology sector outperformed the market with the Sharpe of 135%

 • SFR portfolios shown on previous slide have the potential to outperform both with a 200% Sharpe Ratio

 Sector/ ETF Ticker 5 yr Sharpe Ratio 3 yr Sharpe Ratio 1 yr Sharpe Ratio
 S&P 500 ETF SPY Equity 88% 65% 67%
 REIT ETF VNQ Equity 32% 13% -46%
 Materials SPDR XLB Equity 64% 31% 51%
 Communications SPDR XLC Equity 84%
 Energy SPDR XLE Equity -21% -49% -84%
 Financials SPDR XLF Equity 42% 2% -32%
 Industrial SPDR XLI Equity 61% 25% 15%
 Technology SPDR XLK Equity 135% 122% 167%
 Consumer Staples SPDR XLP Equity 69% 56% 47%
 Utilities SPDR XLU Equity 69% 45% -20%
 Healthcare SPDR XLV Equity 76% 62% 103%
 Consumer Discretionary SPDR XLY Equity 86% 85% 82%
 1-3yr UST SHY Equity 38% 66% 177%
 3-7yr UST IEI Equity 60% 90% 178%
 7-10yr UST IEF Equity 60% 91% 152%
 10-20yr UST TLH Equity 62% 85% 116%
 20+yr UST TLT Equity 62% 81% 106%
 IG Corporates ETF LQD Equity 83% 75% 83%
 HY Corporates ETF HYG Equity 60% 23% 9%
 Source: Bloomberg as of October 2020

 2021 REAL ESTATE MARKET OUTLOOK / 05.BUILDING A DIVERSIFIED SFR PORTFOLIO 50
SFR securitization market provides deep and liquid
 financing options

 • New issuance of SFR securitizations topped $9bn in total in 2020

 • Secondary trading volumes were significant, averaging 1.75-2x the previous highest annual volume,
 demonstrating a deep and liquid market developing for these securitizations

 SFR SECURITIZA TI O NS – PRIMARY ISSUANCE SFR SECURITIZA TI O NS – SECONDARY TRADING

 10 10

 9 9
 8 8

 SFR Trading Volumes, $bn
 7 7
Issuance $bn

 6
 6
 5
 5
 4
 4
 3
 3
 2
 2
 1
 0 1
 2013 2014 2015 2016 2017 2018 2019 2020 0
 SFR Single-Borrower Issuance SFR Multi Borrower Issuance 2015 2016 2017 2018 2019 2020

 Source: SIFMA as of Dec 2020

 2021 REAL ESTATE MARKET OUTLOOK / 05.BUILDING A DIVERSIFIED SFR PORTFOLIO 51
SFR securitization market provides attractive term-financing

• All-in financing costs fell sharply post-pandemic

• Even adding in deal costs, which can be substantial, this implies attractive financing rates

 SFR SE CURITIZA TI O NS IMPLIED FINANCIN G SPREADS AT 70% BPO LTV
 SFR SECURITIZA
 600
 TI O NS – PRIMARY ISSUANCE
 Cumulative Spread to 70% BPO LTV

 500

 400

 300

 200

 100

 0
 Dec-19

 Jun-20

 Oct-20

 Dec-20
 Jan-20

 Aug-20

 Sep-20
 Feb-20

 Mar-20

 Jul-20
 Apr-20

 May-20

 Nov-20
 Cost To 70% BPO

Source: Amherst estimates based on Dealer Marks on securitized tranches.

2021 REAL ESTATE MARKET OUTLOOK / 05.BUILDING A DIVERSIFIED SFR PORTFOLIO 52
Equity IRR is likely high, even for modest cap-rate assets

 • The current financing translates into a potential 20% IRR, even for a 4.5% cap rate asset with a
 modest 3% annualized home price growth

 • We believe SFR cashflows are more durable than many other CRE assets and supportive of
 even higher potential leverage at attractive terms

 EQUITY IRR FOR THE TWO ASSETS

 4.5% CAP RATE 4% CAP RATE
 +3% HPA +2.5% HPA

 BPO LTV 70%

 Debt financing spread 5y Swaps +158 bp (inclusive of deal costs in ongoing spread terms)

 Return (Cap rate + HPA) 7.5% 6.5%

 5Y IRR TO EQUITY 20.0% 16.8%

 Source: Amherst estimates based on Dealer Marks on securitized tranches. 5y Swap rate assumed to be 0.523% as of Jan 15 2021

 2021 REAL ESTATE MARKET OUTLOOK / 05.BUILDING A DIVERSIFIED SFR PORTFOLIO 53
CRE Sectors at a Glance

 54
Multi-track recovery in CRE
 • Single-family rental operators and industrial sectors have performed well post-COVID

 • Office and apartments have fared slightly better, but long-term concerns are emerging for office

 • Retail and hotel have been impacted the most swiftly and severely

 PUBLIC SECTOR REIT ENTERPRISE VALUE CHANGE BY REAL ESTATE SECTOR 1

 ENTERPRISE VALUE 2020 CHANGE 2020 CHANGE 2020 CHANGE 2020 YEAR END
 ($BN) AS OF JAN 2021 THROUGH 3/31/2020 THROUGH 6/30/2020 THROUGH 9/30/2020 CHANGE

 SFR $43 -16.4% -2.1% 2.3% 6.3%

APT REITS $101 -20.3% -18.9% -23.2% -16.7%

HOT REITS $7 -32.7% -31.9% -32.9% -15.8%

IND REITS $112 2.4% 14.3% 20.8% 23.6%

OFF REITS $69 -24.1% -21.1% -24.6% -19.4%

RET REITS $89 -35.3% -28.0% -28.6% -19.9%
Self Storage
 $41 -6.4% -9.4% 4.4% 8.1%
 REITS

 (1) As of 01/08/21. Amherst calculated based upon Bloomberg data and company filings. The following proxies are used for the respective sectors and may not be inclusive of all public sector entities and is being shown for informational
 purposes only: SFR Operators: INVH, AMH, TCN; APT: EQR, AVB, ESS, MAA; Hotel: SHO, DRH, SOHO; Industrial: PLD, DRE, COLD; Office: BXP, WPC, VNO, SLG; Retail: SPG, MAC, O; Self-Storage: PSA;
 The views expressed herein are for informational purposes only, and are derived by Amherst Capital, from current market conditions and assumptions, which may materially change over time. Information contained herein does not purport 55
 to be complete and is subject to change. Please see important disclosures at the end of this presentation.
CRE price growth down significantly YoY
 • All-properties price growth in September 2020 slowed to 3.1% vs. 6.8% in September 2019

 • Retail prices declined by 5.4% YoY in September 2020 after growing 2.7% in September 2019

 • Industrial and apartment price growth remained the strongest across all CRE sectors, while retail and
 suburban offices experienced negative price growth

 PRICE GROWTH HAS SLOWED SINCE 2014 INDUSTRIAL AND APARTMENTS SUPPLY INCREASED
 (JAN ‘14 – NOV ‘20) (JAN ‘14 – SEP ‘20)
 15%
 3%

 10%

 Annual supply growth
Y/Y price growth

 2%
 5%

 0%
 1%

 -5%

 -10% 0%

 Feb-16
 Jun-14

 Dec-16

 Jun-19
 Oct-17
 Jan-14

 Sep-15

 Aug-18
 Jan-19

 Sep-20
 Apr-15

 Jul-16

 Mar-18
 Nov-14

 May-17

 Nov-19
 Apr-20
 National All-Property Apartment
 Office Retail Apartments Industrial
 Core Commercial Retail
 Industrial Office - CBD
 Office - Suburban

 Source: RCA as of January 2021 Source: Costar data from SEP ‘14 – SEP ‘20 as of December 2020.
 2021 REAL ESTATE MARKET OUTLOOK / 06.CRE SECTORS AT A GLANCE 56
Rent and NOI growth decreased sharply in 2020
 • Rent growth across all CRE types except industrial fell to 0% YoY by Q3 2020

 • NOI growth trended higher than rent growth, particularly for industrial and office pre-COVID

 • However, NOI growth also fell to 0% YoY by Q3 2020

 RENT GROWTH HAS SLOWED NOI GROWTH HAS SLOWED EVEN MORE
 (JAN ‘14 – SEP ‘20) (JAN‘14 – SEP ‘20)

 7% 9%
 8%
 6%
YoY Rent/RevPar Growth

 7%

 YoY NOI Index Growth
 5% 6%

 4% 5%
 4%
 3%
 3%
 2% 2%
 1%
 1%
 0%
 0% -1%
 Jan-14

 Jan-15

 Jan-16

 Jan-17

 Jan-18

 Jan-19

 Jan-20
 Jul-14

 Jul-15

 Jul-16

 Jul-17

 Jul-18

 Jul-19

 Jul-20

 Jan-16
 Jan-14

 Jan-15

 Jan-17

 Jan-18

 Jan-19

 Jan-20

 Jul-20
 Jul-14

 Jul-15

 Jul-16

 Jul-17

 Jul-18

 Jul-19
 Office Retail Apartments Industrial Office Retail Apartments Industrial

 Source: Costar as of December 2020.
 2021 REAL ESTATE MARKET OUTLOOK / 06.CRE SECTORS AT A GLANCE 57
Office fundamentals remain at risk of weakening further
 • U.S. office net absorption was -0.4% from Q4 2019 to Q3 2020

 • Absorption was negative for many of the U.S.’s densest cities

 • Many of these cities also have big supply pipelines, which along with the negative net absorption will
 put additional pressure on office fundamentals in areas like San Francisco and Los Angeles

 NET ABSORPTION LAST 4 QUARTERS HAS BEEN NEGATIVE IN MANY MARKETS

 Under construction SF in % of Inventory
 Phoenix - AZ
 Net 12m absorption SF in % of inventory
 Saint Louis - MO

 Tampa - FL

 Minneapolis - MN

 Chicago - IL

 Charlotte - NC

 New York - NY

 Dallas-Fort Worth - TX

 Pittsburgh - PA

 Detroit - MI

 Miami - FL

 San Diego - CA

 Los Angeles - CA

 Fort Lauderdale - FL

 San Francisco - CA

 -3% -2% -1% 0% 1% 2% 3% 4% 5% 6% 7%
 SF in % of Inventory
Source: Costar as of December 2020. Shows net absorption and construction as a percentage of the entire market’s total occupied/vacant inventory by Square feet(SF)
2021 REAL ESTATE MARKET OUTLOOK / 06.CRE SECTORS AT A GLANCE 58
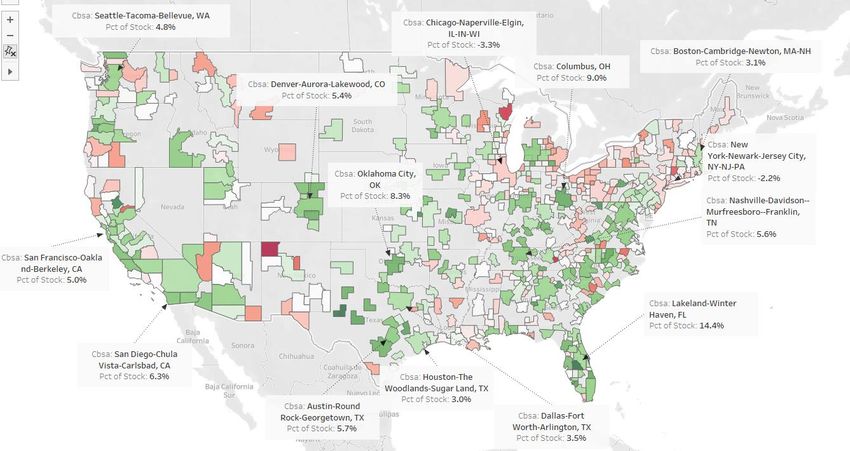
Apartments: A tale of two (types of) cities

 • Apartments have seen a bifurcation in absorption trends with some denser, urban, coastal and
 generally more expensive markets seeing drops in absorption

 • However, more affordable areas with meaningful in-migration, strong job growth and
 population/income growth have seen the fastest absorption of rental units

 • The top 5 areas by % absorption are Salt Lake City, Jacksonville, Charlotte, Raleigh and Richmond

 TRAILING 12-MONTH APARTMENT ABSORPTION AS % OF STOCK

 Salt Lake City - UT 5.1% Baltimore - MD 2.1%
 Jacksonville - FL 4.1% Milwaukee - WI 2.1%
 Charlotte - NC 4.0% Fort Lauderdale - FL 2.0%
 Raleigh - NC 3.6% Northern New Jersey - NJ 2.0%
 Richmond - VA 3.6% Minneapolis - MN 1.9%
 Norfolk - VA 3.2% Detroit - MI 1.9%
 San Antonio - TX 3.1% Houston - TX 1.9%
 Louisville - KY 3.1% Sacramento - CA 1.8%
 Phoenix - AZ 3.0% Saint Louis - MO 1.7%
 Portland - OR 2.9% Philadelphia - PA 1.6%
 Denver - CO 2.8% San Diego - CA 1.5%
Dallas-Fort Worth - TX 2.7% Orange County - CA 1.5%
 Tampa - FL 2.7% Cleveland - OH 1.3%
 Inland Empire - CA 2.7% Boston - MA 1.3%
 Atlanta - GA 2.7% Cincinnati - OH 0.9%
 Nashville - TN 2.6% Seattle - WA 0.7%
 Las Vegas - NV 2.6% Oklahoma City - OK 0.4%
 Indianapolis - IN 2.5% Chicago - IL 0.3%
 Miami - FL 2.4% Washington - DC 0.2%
 Columbus - OH 2.4% Pittsburgh - PA 0.2%
 Kansas City - MO 2.4% East Bay - CA -0.2%
 Memphis - TN 2.3% New York - NY -0.4%
 Austin - TX 2.3% Los Angeles - CA -0.8%
 Tucson - AZ 2.2% San Jose - CA -1.5%
 Orlando - FL 2.2% San Francisco - CA -4.5%

 -6% -4% -2% 0% 2% 4% 6% -6% -4% -2% 0% 2% 4% 6%
 12m Absorption, % of Inventory 12m Absorption, % of Inventory
 Source: Costar as of December 2020
 2021 REAL ESTATE MARKET OUTLOOK / 06.CRE SECTORS AT A GLANCE 59
Lower-end apartments likely to outperform luxury buildings

 12%

 10%

• Higher-end apartments are seeing
 much larger vacancy spikes
 8%

• These spikes are likely to due

 Vacancy Rates, %
 location since high-end apartments
 tend to be in denser, urban, more 6%
 expensive areas

• Lower-end apartments saw an 4%
 initial uptick in vacancy, but
 absorption has returned in full force
 and is expected to stay steady 2%

 0%
 2001 Q1

 2020 Q1
 2000 Q1

 2002 Q1
 2003 Q1
 2004 Q1
 2005 Q1
 2006 Q1
 2007 Q1
 2008 Q1
 2009 Q1
 2010 Q1
 2011 Q1
 2012 Q1
 2013 Q1
 2014 Q1
 2015 Q1
 2016 Q1
 2017 Q1
 2018 Q1
 2019 Q1
 1 & 2 Star 3 Star 4 & 5 Star
 Source: Costar as of December 2020

 2021 REAL ESTATE MARKET OUTLOOK / 06.CRE SECTORS AT A GLANCE 60
Industrial sector benefits at retail’s expense
 • The industrial sector posted the strongest rent growth among CRE asset classes at 3.5% as of Q3
 2020, which is due largely to the massive upswing in e-commerce

 • Industrial construction measured by square feet remains at an all time high of 333mn square feet as
 of Q3 2020

 • Vacancies have ticked up as rapidly increasing supply may finally be catching up with demand leading
 to slowing rent growth

 • Strong demand is expected to support the industrial sector as e-commerce continues to grow in 2021
 INDUSTRIAL RENT GROWTH SLOWING SLIGHTLY NEW CONSTRUCTION CATCHING UP TO DEMAND
 (SEP ‘06 – SEP ‘20) (JUL ‘11 – SEP ‘20)

8% 350 12.0%

6% 300
 10.0%
 250
4%
 8.0%
 200
2% Mn sf
 150 6.0%
0%
 100
 4.0%
-2%
 50
-4% 2.0%
 0
-6% -50 0.0%
 Apr-11
 Jan-06

 Apr-08
 Oct-06

 Jan-09
 Oct-09

 Jan-12

 Apr-14

 Apr-17
 Oct-12

 Jan-15
 Oct-15

 Jan-18

 Apr-20
 Oct-18
 Jul-19
 Jul-07

 Jul-10

 Jul-13

 Jul-16

 Net Delivered SF 12 Mo
 Asking Rent Growth Y/Y Net Absorption SF 12 Mo
 Source: Costar as of December 2020 Vacancy Rate (right axis)
 2021 REAL ESTATE MARKET OUTLOOK / 06.CRE SECTORS AT A GLANCE 61
Retail utilization has suffered during the pandemic
 MANY AREAS SAW RETAIL USAGE DROP BY 50+% IN APRIL
 WITH A LARGE GAP BETWEEN DENSER VS. LESS DENSE CITIES

 10

 0
 Retail and Recreation % Change

 -10

 -20
 from Baseline

 -30

 -40

 -50

 -60

 -70

 Dec-20
 Apr-20

 Jun-20

 Sep-20
 Feb-20

 Aug-20

 Oct-20

 Jan-21
 Mar-20

 May-20

 Jul-20

 Nov-20
 San Francisco-Oakland-Berkeley, CA New York-Newark-Jersey City, NY-NJ-PA
 Atlanta-Sandy Springs-Alpharetta, GA Dallas-Fort Worth-Arlington, TX
 Nashville-Davidson--Murfreesboro--Franklin, TN

Source: Google Mobility Data as of Jan 2021. Retail and recreation are places like restaurants, cafes, shopping centers, theme parks, museums, libraries, and movie theaters.

2021 REAL ESTATE MARKET OUTLOOK / 06.CRE SECTORS AT A GLANCE 62
Relative Value in
Securitized Products

 63
Low rates, even lower spreads; early rollback of monetary
support or weaker fiscal support are the main risks

 • The post-pandemic recovery in securitized asset pricing has been fast and steep, driven mostly by
 supportive monetary policy and fiscal support

 • Even with a modest rate sell-off, most of the Agency MBS borrowers will remain highly
 refinanceable; pricing will remain driven by the Fed and a ‘taper tantrum 2.0’ scenario could create
 some spread volatility

 • A strong housing market will likely continue to support residential/SFR/multi-family securitized
 credit spreads

 • Some CRE sectors will continue to face issues. Even with a full reopening of the economy, some
 CMBS loans will face losses. On average, losses are unlikely to exceed below-IG level in conduits,
 but on some deals could creep into BBBs or higher.

 • Overall, the risk to spreads is likely more from shifting expectations on a rollback of monetary
 policy measures (taper-tantrum 2.0) or a falling short of fiscal policy measures (this is less likely
 with Democrats gaining control of the Senate following the Georgia runoff election)

 64
2021 REAL ESTATE MARKET OUTLOOK / 08.RELATIVE VALUE IN SECURITIZED PRODUCTS
Fed response to the pandemic was swift
 • After several years of reducing MBS holdings from ~$1.8tn in 2017 to just under $1.4tn in early
 2020, the Fed had to reverse course in response to the pandemic

 • As a result, the Fed’s MBS portfolio has shot up to $2tn and OAS have collapsed to at or below zero

 • Even as rates sell-off modestly, much of the agency universe remains refinanceable. Additionally, a
 taper-tantrum 2.0 scenario could also add spread volatility to this market.

 FED MBS HOLDING SPIKED POST-COVID …AND AGENCY MBS SPREADS COLLAPSED
 (NOV ’17 – JAN ’20) 1 (DEC ’15 – DEC ‘20) 2

 2000 100
 90
Fed Agency MBS Holdings , $bn

 1800 80

 Agency MBS CC OAS, bp
 70
 1600 60
 50
 1400 40
 30
 1200 20
 10
 1000 0
 Nov-20
 Nov-17

 May-18

 Nov-18

 May-19

 Nov-19

 May-20

 Dec-17

 Jun-18

 Dec-18

 Jun-19

 Dec-19

 Jun-20

 Dec-20
 Source: (1) Federal Reserve, Amherst as of Jan 12, 2021. (2) Source: Dealer Marks, Amherst as of Dec 2020

 65
 2021 REAL ESTATE MARKET OUTLOOK / 08.RELATIVE VALUE IN SECURITIZED PRODUCTS
Prepayment risk is noticeably higher
• The historic rally in rates caused a surge in prepayment speeds

• Prepayments were much higher than prior years even after adjusting for rate declines

• Risks from further credit easing and technological advancements that increase refinancing efficiency
 are not priced in

 S-CURVES WERE MUCH STEEPER IN 2020, 6-18 WALA

 50
 45
 40
 35
 30
 1y CPR

 25
 20
 15
 10
 5
 0
 -100 -50 0 50 100 150 200
 Rate Incentive (bps)
 2018 2019 2020
 Source: FNMA, FHLMC, Amherst as of Jan 12, 2021

 66
2021 REAL ESTATE MARKET OUTLOOK / 08.RELATIVE VALUE IN SECURITIZED PRODUCTS
You can also read