Overview of 2019 Going for Growth Priorities - OECD
←
→
Page content transcription
If your browser does not render page correctly, please read the page content below
21
1 Overview of 2019 Going for Growth
Priorities
Slowing growth and increasing global uncertainty should not divert policy
makers’ attention from longer-term objectives of improving incomes and
well-being. Addressing such long-term objectives requires implementing
key structural reforms. This chapter presents an overview of the Top 5
reform priorities and recommendations for OECD member and key non-
member states. Two cross-cutting themes can be identified: improving the
equality of opportunities for workers and firms and securing the
environmental sustainability of gains in growth and well-being. Country-
specific information supporting this chapter is available in the country notes
(Chapter 4).
The statistical data for Israel are supplied by and under the responsibility of the relevant Israeli authorities. The use of
such data by the OECD is without prejudice to the status of the Golan Heights, East Jerusalem and Israeli settlements
in the West Bank under the terms of international law.
ECONOMIC POLICY REFORMS 2019: GOING FOR GROWTH © OECD 2019
22
In Brief
The time for reform is now
The global growth slowdown is largely a cyclical development. However, the slowdown and increasing
uncertainty come at a time when globalisation, digitalisation, demographics and environmental
degradation are key forces shaping economic developments. To make the most out of these challenges
policy makers need to address domestic reform priorities, with a tailor-made structural reform agenda.
Such an agenda requires packaging and sequencing policies to offset potential short-term costs,
particularly on the most vulnerable and to build support for reforms.
Going for Growth identifies Top 5 structural reform priorities to boost growth in an inclusive way in OECD
member and key non-member economies. The priorities are selected using quantitative analysis and
qualitative OECD expertise. For each reform priority, policy recommendations are put forward and
recent reforms are reported. Going for Growth 2019 integrates green growth to account for the
environmental sustainability of growth.
In both advanced and emerging-market economies, the most prevalent priorities to be addressed by
reforms are in the areas of skills and education and product market regulation, competition and trade
and FDI openness. In emerging-market economies, the majority of labour market priorities tackle the
policy-related causes of informality and labour market duality. In advanced economies, a significant
share of labour market priorities target reducing barriers to full-time labour market participation of
women, older workers, migrants and minorities. A more growth-friendly tax mix is a priority in many
advanced economies, with emphasis on increasing the share of revenues coming from the taxation of
property, consumption and environmental externalities.
The provision of accessible, quality infrastructure and its efficient use are key priorities, in particular in
emerging-market economies. Delivering on these priorities cost-efficiently will not only boost economic
growth, but improve its inclusiveness and in some cases environmental performance. Securing the rule
of law, fighting corruption and improving the efficiency of the judicial system are priorities in both
emerging-market and selected advanced economies. Addressing them is necessary not only for growth
itself, but also for the ability to successfully implement other structural reforms.
A large share of 2019 Going for Growth priorities can be seen as improving the equality of opportunities
among current and future firms and workers. This concerns priorities to lower entry barriers, improve
market access and ensure a more level playing field in product and service markets, education and skills
policies and policies to increase the inclusiveness of the labour market.
Overall, 11 countries and the European Union have priorities addressing environmental pressures
among their Top 5 priorities. A large number of countries have reforms recommended to boost growth
that can also reduce pollution and environmental degradation. Nevertheless, environmental
sustainability remains a global concern and needs to be addressed through a combination of domestic
and multilateral action.
ECONOMIC POLICY REFORMS 2019: GOING FOR GROWTH © OECD 2019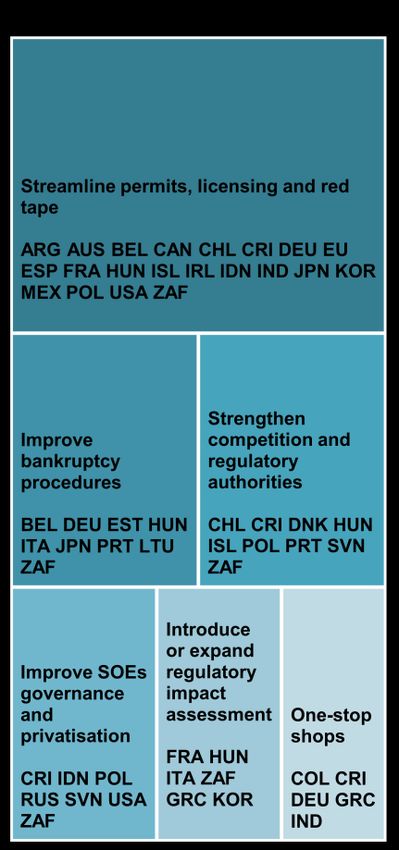
23 Introduction More than ten years after the onset of the global financial crisis, global growth is fragile. The prospects for strong and sustained improvements in living standards in the medium term remain weaker than prior to the crisis in both advanced and emerging-market economies, reflecting unfavourable demographic trends and the consequences of a decade of subdued investment and productivity growth. Uncertainty is high and poverty and inequality pressures loom, with many countries experiencing a prolonged stagnation of incomes of the poorest and a decline in the wage share (Pak and Schwellnus, 2019). In some countries, there is a growing perception that equality of opportunities and social mobility have declined. At the same time, environmental pressures are rising. Economic growth and higher living standards imply evolving lifestyles, production and consumption patterns, all of which will have consequences for the environment and the resources it provides and hence the sustainability of growth and well-being. The cyclical developments should not divert attention from long-term objectives and structural reforms needed to achieve them. Yet, they may affect the emphasis in the design and implementation of reform packages. For example, where demand is particularly weak, and fiscal space permits, governments may need to do more to complement structural efforts with fiscal stimulus. Examples include investing in infrastructure, especially digital, transport and energy, enhancing people’s skills, and more generally implementing policies that favour equal opportunities (OECD, 2019). To meet these challenges, Going for Growth identifies the Top 5 structural reform priorities essential for achieving a high growth path, in a way that is both inclusive and sustainable. This Chapter first briefly summarises cross-country differences in productivity, employment and inequality in order to understand each country’s specific performance weaknesses. It then presents an overview of the country-specific policy reform priorities and recommendations to address them. Chapter 2 reports on actions taken on the 2017-18 priorities. Chapter 3 provides details on and the results of the integration of selected dimensions of environmental sustainability into the priority selection framework – a novelty in the 2019 Going for Growth edition. Finally, Chapter 4 provides the country-specific Going for Growth Country Notes with details on reform priorities, recommendations and actions taken. A snapshot of cross-country challenges in 2019 Countries covered in Going for Growth exercise exhibit large variation in GDP per capita, which is largely explained by differences in productivity for most countries (Figure 1.1). In Estonia, Israel, Korea, Japan, New Zealand and China, low productivity is coupled with relatively high labour utilisation. In contrast, in many advanced European countries, such as Belgium, Denmark, France and Germany, relatively low labour utilisation is offset by high productivity. Countries lagging behind on both productivity and labour utilisation with respect to the most advanced OECD economies include Italy, Spain and emerging-market economies such as South Africa and Turkey. ECONOMIC POLICY REFORMS 2019: GOING FOR GROWTH © OECD 2019
24
Figure 1.1. Countries covered in Going for Growth exhibit large variation in GDP per capita
Compared to the upper half of OECD countries,1 2018
A. Most advanced economies
Labour productivity² Labour resource utilisation² GDP per capita
60 60
40 40
20 20
0 0
-20 -20
-40 -40
JPN FRA GBR CAN FIN BEL NOR SWE AUS DEU DNK AUT NLD ISL USA CHE IRL LUX
B. Other advanced economies
30 30
20 20
10 10
0 0
-10 -10
-20 -20
-30 -30
-40 -40
-50 -50
GRC LVA HUN POL PRT SVK EST LTU SVN CZE KOR ISR ESP NZL ITA
C. Emerging-market economies
10 10
-10 -10
-30 -30
-50 -50
-70 -70
-90 -90
IND IDN ZAF COL BRA CRI CHN MEX ARG CHL RUS TUR
1. Compared to the weighted average using population weights of the 18 OECD countries with the highest GDP per capita in 2018 based
on 2018 purchasing power parities (PPPs). The sum of the percentage difference in labour resource utilisation and labour productivity does not
add up exactly to the GDP per capita difference since the decomposition is multiplicative. In the case of Luxembourg, the population is
augmented by the number of cross-border workers in order to take into account their contribution to GDP. For Norway, data refer to GDP for
mainland which excludes petroleum production and shipping. While total GDP overestimates the sustainable income potential, mainland GDP
slightly underestimates it since returns on financial assets held by the petroleum fund abroad are not included.
2. Labour productivity is measured as GDP per hour worked. Labour resource utilisation is measured as the total number of hours worked over
the population aged 15-74. Hours worked per person employed have been estimated for Australia, Canada, Finland, Israel, Mexico, Switzerland,
Turkey and the United States.
Source: OECD, National Accounts, Productivity and Economic Outlook Databases.
StatLink 2 https://doi.org/10.1787/888933954287
ECONOMIC POLICY REFORMS 2019: GOING FOR GROWTH © OECD 2019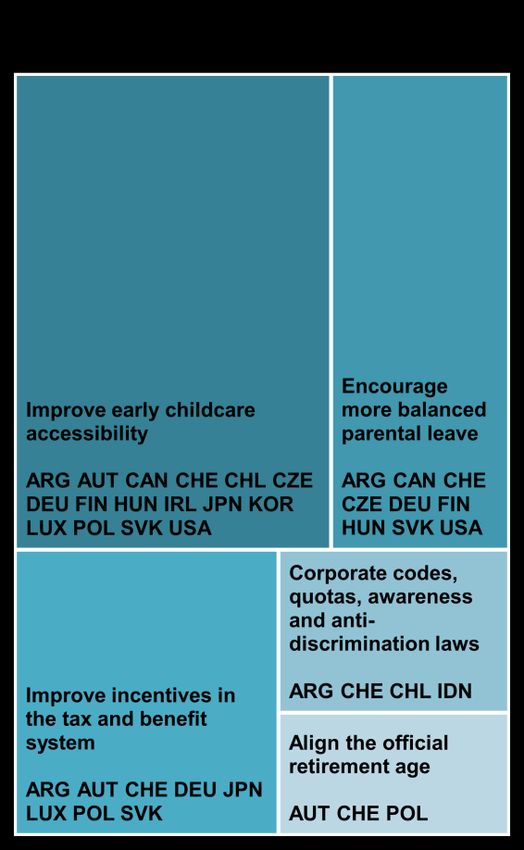
25
Cross-country differences in labour productivity
Overall, cross-country differences in labour productivity levels are explained by a combination of gaps with
respect to the most advanced OECD countries in capital stock per worker and in total factor productivity
(TFP). In most countries, the two gaps go together. The United Kingdom, Norway, Denmark, the
Netherlands, Israel, Sweden and Germany have gaps in capital per worker, but high TFP levels. In
contrast, in Korea and Japan TFP is relatively low while capital per worker is comparatively high.
In many countries TFP growth slowed already before the global crisis, since the crisis it has continued to
be weak and become more widespread. Recent evidence has shown that the pre-crisis productivity
slowdown masks a widening performance gap between more productive and less productive firms,
especially in the services sector (Andrews et al., 2016). Several factors with well-identified policy drivers,
contribute to these developments in productivity growth:
Skill mismatch and quality. Skill mismatch is significant in many advanced economies. There are
indications that working populations are poorly equipped with skills related to digital technologies
(OECD, 2016). Low managerial quality, the lack of ICT skills and poor matching of workers with
jobs can be associated with lower digital technology adoption (Andrews et al. 2018a). Skill
mismatch is higher in the presence of more stringent product and labour market regulation,
insolvency regimes that excessively punish failure and restrictive housing policies (e.g. high
transaction costs, strict rent control and low responsiveness of housing supply to demand) which
hinder the reallocation of workers to better match their jobs and skills (Adalet McGowan and
Andrews, 2015) .
Weak business dynamism. Declining business dynamism is a cause of concern for policy makers
in many countries (Calvino and al., 2015). Business dynamism boosts productivity growth by
facilitating the reallocation of resources from lagging, low-productivity firms towards more
productive firms and strengthening the diffusion of new technologies. New firms are also often
associated with bringing new technologies into the market, radical innovation and increasing
pressure on incumbent firms to increase their productivity. Differences in employment protection
legislation, bankruptcy regimes and R&D fiscal incentives are policy drivers that have been found
to explain the heterogeneity in business dynamism across countries (Bravo-Briosca et al., 2013).
Technological adoption. The incentives for technological adoption may have weakened, in the
presence of weaker competitive pressures (Decker et al., 2017; Adalet McGowan et al., 2017; Gal
et al., 2019). New technologies developed at the global frontier are increasingly global, but diffuse
slowly to firms within countries. Many existing technologies may remain underexploited. This lack
of diffusion can be illustrated by the low adoption rates of key technologies relevant for productivity
growth (Figure 1.2). In most advanced economies virtually all firms are now connected to
broadband internet, but the diffusion of more advanced tools and applications varies greatly across
technologies and countries. A range of policies can support the diffusion and efficient use of digital
technologies. These include pro-competition reforms in telecommunication sectors and regulatory
frameworks that support investment and reallocation of resources to most productive uses,
including through improved bankruptcy procedures. Training, especially of low-skilled workers can
also improve the pool of skills available to firms, improving their ability to grow and adopt new
technologies while facilitating the job-to-job transition in dynamic labour markets.
ECONOMIC POLICY REFORMS 2019: GOING FOR GROWTH © OECD 2019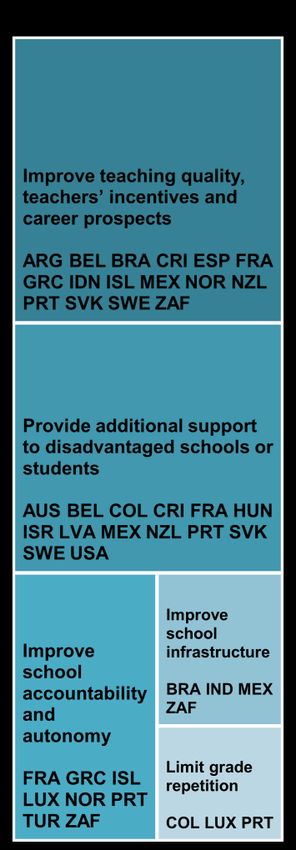
26
Figure 1.2. Diffusion of selected information and communications technology tools and activities
in firms
As a percentage of enterprises with at least ten persons employed, 20181 or last year available
DNK, FIN, NLD, LTU
100 100
Lowest country Highest country Median
90 NZL 90
ISL
80 GRC 80
70 FIN 70
60 60
NZL
50 KOR 50
40 40
30 NLD 30
20 20
JPN
10 10
GRC
TUR KOR KOR CAN
0 0
Broadband Social media E-purchases Cloud computing E-sales Big data Radio Frequency
Identification
1. Broadband includes fixed and mobile connections with an advertised download rate of at least 256 Kbit/s. E-purchases and e-sales refer to
the purchases and sales of goods or services conducted over computer networks by methods specifically designed for the purpose of receiving
or placing orders. Cloud computing refers to ICT services over the Internet to access server, storage, network components and software
applications. Radio frequency identification (RFID) is a technology that enables contactless transmission of information via radio waves. Data
refer to 2016 for Australia, Japan and New Zealand; 2015 for Colombia, Korea and Switzerland; 2014 for Iceland; 2013 for Canada.
Source: OECD, ICT Access and Usage by Businesses Database.
StatLink 2 https://doi.org/10.1787/888933954306
Digitalisation can boost efficiency of production, reduce the costs of entry into global markets, and provide
consumers with new and cheaper goods and services. However, it also poses a number of challenges for
policy makers. Many digital technologies are characterised by low marginal costs combined with potentially
high fixed investment costs and importance of intangible assets in particular data, intellectual property and
networks (OECD, 2018a). The large economies of scale and scope can allow rapid upscaling and can be
a challenge for maintaining competitive conditions and gains for the consumer. So-called ‘superstar’ firms
with rapidly increasing market power and profits may raise implicit entry barriers and block potential
competitors (Korinek and Ng, 2017; Calligaris, et al., 2018; De Loecker and Eeckhout, 2017; Andrews, et
al., 2018). Such developments may require particular attention to market entry barriers, a reflection on the
adequacy of existing competition policy tools and enforcement of the protection of intellectual property
rights.
Labour utilisation and inclusiveness
Employment is crucial to make growth more inclusive (Hermansen et al., 2016). Employment rates are on
average above pre-crisis level in advanced economies, which is partly due to cyclical conditions. In
Germany, Hungary and Poland, among others, the increase in employment has been accompanied by a
reduction in unemployment. By contrast in some other countries (e.g. Greece, Italy, Spain and France),
unemployment remains high, well above pre-crisis levels. In the United States despite the longest job
recovery in the post-war period, the employment rate is still below the pre-crisis level largely due to a
withdrawal of prime-age male workers from the labour force in the past decade.
ECONOMIC POLICY REFORMS 2019: GOING FOR GROWTH © OECD 2019 27
In many European countries, such as Austria, Denmark, Finland, Germany, Iceland, the Netherlands,
Norway, Switzerland, the United Kingdom, and to a lesser extent in Belgium and France, the gap in labour
utilisation compared to the best OECD performers is largely the result of low average hours worked per
worker. Low hours worked often reflect policy impediments or disincentives to full-time work, especially for
lone parents and second earners. For example, some features of tax and benefits systems, related to the
joint income taxation of spouses or high implicit marginal tax rates due to the withdrawal of benefits as
hours worked increase, can result in lower hours worked.
By contrast, in Greece, Italy, Poland, Spain, Slovak Republic, and also in Turkey, Costa Rica and South
Africa and other emerging-market economies, the labour utilisation gap can be explained by a relatively
low employment rate, while average hours worked per worker are relatively high. Weak aggregate
employment rates are often driven by low employment of specific groups, such as younger workers, low-
skilled, women, older workers and minorities. One reason is related to labour market dualism - the
segmentation between workers with regular contracts with strong employment protection and those with
contracts with little protection and little scope for on-the-job training. Other reasons for weak employment
are related to the incentives for early retirement or inadequate skills.
The degree of inequality also varies significantly between and within advanced and emerging-market
economies. Income inequality is one example (Figure 1.3). Another example is the equality of opportunities
which is crucial for inclusiveness, fairness and the full utilisation of labour resources across the society. In
a society where an individual’s wage, education and occupation are strongly related to those of his or her
parents, opportunities to succeed in life are unequal and this can lead to a waste of talent and productive
capacity (OECD, 2018b).
Figure 1.3. The degree of income inequality differs substantially across countries
20161
Share of income held by the poorest 20%
11 11
ISL
10 CZE DNK NLD 10
SVN FIN
9 SVK SWE FRA 9
NOR BEL CHE
IRL
8 POL DEU LUX 8
CAN AUS NZL
AUT PRT
7 HUN GBR RUS 7
EST JPN
ITA LVA LTU TUR
6 GRC ISR 6
KOR USA CHL
ESP
5 5
ARG MEX CRI COL
4 4
BRA
3 ZAF 3
2 2
22 24 26 28 30 32 34 36 38 40 42 44 46 48 50 52 54 56 58 60 62 64
Gini, disposable income (after taxes and transfers)
1. The Gini coefficient measures the extent to which the distribution of disposable income among households deviates from perfect equal
distribution. A value of zero represents perfect equality and a value of 100 extreme inequality. Data refer to 2017 for Argentina, Brazil, China,
Colombia, Costa Rica, Finland, Israel, Korea, Norway and Sweden; 2015 for Denmark, Iceland, Ireland, Japan, Switzerland, Turkey and Russia;
2014 for Hungary, New Zealand and South Africa.
Source: OECD Income Distribution Database and World Bank, World Development Indicators Database.
StatLink 2 https://doi.org/10.1787/888933954325
ECONOMIC POLICY REFORMS 2019: GOING FOR GROWTH © OECD 201928
One dimension through which the equality of opportunities reveals itself is through social mobility - a multi-
faceted concept that can be defined and measured by looking at incomes, health, education or occupation
or social status (OECD, 2018b; Roemer and Trannoy, 2016). In terms of earnings, social mobility is high
in most Nordic countries, Canada and New Zealand while it is relatively low in France, Germany and
emerging-market economies (Figure 1.4, Panel A). Korea, the United States and the United Kingdom have
high upward occupation mobility (Figure 1.4, Panel B), but relatively low mobility in education (Figure 1.4,
Panel C) or earnings. In general, in many advanced economies with relatively low income inequality,
particularly in Europe, individuals’ education outcomes are strongly linked to their family background.
Figure 1.4. Social mobility varies across countries
A. Intergenerational earnings mobility¹
1.0 1.0
0.8 0.8
0.6 0.6
0.4 0.4
0.2 0.2
0.0 0.0
IND
ITA
FIN
IRL
ZAF
FRA
NLD
PRT
JPN
BRA
HUN
CHN
COL
DEU
CHL
ARG
AUT
CHE
GBR
USA
KOR
Advanced
AUS
BEL
CAN
GRC
NZL
ESP
NOR
DNK
SWE
B. Percentage of 25-64 year olds whose social class is higher or lower than that of their parents
% 2002-14
80 80
Downward mobility² Upward mobility²
70 70
60 60
50 50
40 40
30 30
20 20
10 10
0 0
ITA
FIN
ISR
IRL
ISL
FRA
NLD
PRT
CZE
ESP
CHE
DEU
BEL
Advanced
DNK
NOR
HUN
GBR
POL
SWE
AUS
SVK
USA
SVN
KOR
EST
CAN
C. Impact of the socio-economic background on education outcomes
Change in the reading score per unit change in socio-economic index,³ 2015
60 60
50 50
40 40
30 30
20 20
10 10
0 0
IDN
ITA
FIN
JPN
ISR
TUR
ISL
IRL
MEX
ESP
BRA
LVA
USA
RUS
DNK
NOR
CAN
GBR
ARG
GRC
LTU
DEU
KOR
NLD
CHN
CRI
PRT
COL
CHL
SVN
CHE
Advanced
LUX
EST
POL
AUS
SVK
HUN
AUT
CZE
FRA
NZL
BEL
SWE
1. Mobility is proxied by 1 minus the intergenerational earnings elasticity, which is defined as the sensitivity of an individual’s lifetime labour
income with respect to his father’s income. Higher value indicates higher mobility.
2. Social class is based on the nine European Socio-Economic Classification (ESEC) categories constructed based on occupation. See Box 4.2
in OECD (2018), A Broken Social Elevator? How to Promote Social Mobility.
3. Defined as the estimated coefficient from the country-specific regression of PISA reading performance on corresponding index of economic,
social and cultural status (ESCS). The ESCS is a composite score built by the indicators parental education, highest parental occupation and
home possessions including books in the home via principal component analysis. The score has been transformed with zero being the score of
an average OECD student and one being the standard deviation across equally weighted OECD countries.
Source: OECD (2018), A Broken Social Elevator? How to Promote Social Mobility and PISA Database.
StatLink 2 https://doi.org/10.1787/888933954344
ECONOMIC POLICY REFORMS 2019: GOING FOR GROWTH © OECD 2019 29 The extent to which individuals have the opportunity to improve their economic status depends on a host of factors, some related to the inheritability of traits (such as innate abilities), others to the family and social environment (Frank, 2016; Kearney and Levine, 2016). Some aspects of the social environment can be heavily impacted by policies. For example, policies can determine access to education and training through public support (e.g. via the tax and benefit schemes, provision and pricing). A snapshot of cross-country reform priorities in 2019 Going for Growth identifies structural reform priorities to boost income growth, through higher productivity and employment. Key considerations in the Going for Growth framework is that economic growth needs to be inclusive and that the gains in growth and well-being need to be sustainable in the longer term. The identification of Going for Growth priorities is based on a combination of quantitative analysis of performance and policy weaknesses, and country-specific expertise (Box 1.1). Overall, the key priority areas in Going for Growth 2019 are similar to those of 2017, with a slight increase of priorities to boost productivity, in particular in emerging-market economies (Figure 1.5). About six out of seven of the 2017 country-specific priorities are retained from the 2017 edition, implying that most countries have not fully addressed these priorities. However, the detailed recommendations have evolved, reflecting actions taken throughout 2017-18, in order to focus on the remaining aspects of each priority. Of the 14% of priorities that are new in 2019, two thirds replaced 2017 priorities which have been dropped as they were addressed through significant reforms (Chapter 2). The rest have been dropped in response to new developments, new evidence or re-assessment of the situation in a country. Box 1.1. The selection of policy priorities in the extended Going for Growth framework The Going for Growth framework identifies Top 5 reform priorities to boost longer-term living standards and to ensure that the gains are broadly shared across the population. In order to identify the Top 5 priority challenges, the approach combines quantitative and qualitative insights (see Diagram below). Economic outcomes are matched with policies empirically proven to address them. For instance, multifactor productivity growth (performance indicator) is matched with specific areas of product market regulation such as administrative burdens on start-ups or barriers to entry in professional services (policy indicators). Aggregate employment (performance indicator) is paired with, for example, the labour tax wedge (policy indicator), while the employment rate of women (performance indicator) is matched with childcare related costs resulting from the tax and benefits system (policy indicator). Performance is compared to the OECD average. An outcome-policy pair becomes a priority candidate in a given country if both the outcome and associated policy rank poorer than the OECD average. In the next step, OECD country expert judgement is used to select the Top 5 priorities among these identified candidates and other areas relevant for growth, which it may not be possible to properly measure or compare, and hence include in the matching process. For each of these priorities, detailed reform recommendations are formulated and actions on them are reported. ECONOMIC POLICY REFORMS 2019: GOING FOR GROWTH © OECD 2019
30
Since 2017, the inclusiveness dimension is an integral part of the Going for Growth exercise. The
integration is based on a dashboard of inclusiveness indicators encompassing a number of income and
non-income dimensions such as inequality and poverty, job quantity and quality drawing on the new
OECD Jobs Strategy (OECD, 2018c), the labour market inclusion of vulnerable groups, gender gaps
and equity in education. The set of inclusiveness indicators are matched with corresponding policy
indicators where empirical research has shown a robust link, to determine joint policy-performance
weaknesses. Along similar principles, in the current 2019 Going for Growth edition, green growth
considerations have been integrated to address the issue of sustainability of the gains in growth and
well-being (see Chapter 3).
The Going for Growth framework for identifying reform priorities
GDP per capita
Environmental
Productivity Employment Inclusiveness sustainability
Outcome + Outcome + Outcome + Outcome+
Policy Policy Policy Policy
performance performance performance performance
gaps gaps gaps gaps
Quantitative selection of priority candidates by a matching algorithm
Qualitative selection of priorities by desk experts
Top 5 national reform priorities
Note: Due to data constraints the identification of environment performance gaps based on policy-outcome pairs is supplemented with one
based on pure outcomes (trends and levels).
Overcoming the data constraints is key to identifying robust empirical relationships between the various
income and non-income dimensions of inclusive growth as defined in the recent OECD Inclusive Growth
framework (OECD, 2018d) and their relationship with structural reforms. Work is underway to
gradually integrate a comprehensive coverage of inclusive and environmentally sustainable growth in
Going for Growth.
ECONOMIC POLICY REFORMS 2019: GOING FOR GROWTH © OECD 2019 31
Figure 1.5. The share of priorities focusing on boosting productivity has risen slightly
As a percentage of total priorities
A. Advanced economies B. Emerging-market economies
% Total productivity Total labour utilisation Total productivity Total labour utilisation %
80 80
70 70
60 60
50 50
40 40
30 30
20 20
10 10
0 0
2013 2015 2017 2019 2013 2015 2017 2019
StatLink 2 https://doi.org/10.1787/888933954363
In both advanced and emerging-market economies the 2019 priorities have a strong focus on competition
in goods and service markets and openness to international trade and FDI (Figure 1.6). Improving quality
and access to education are also key priorities in both advanced and emerging-market economies with
potentially high impacts on future productivity and employment patterns. In advanced economies, the
efficiency of the tax system, in particular a shift to property, consumption and environmental taxation, ranks
high, together with more effective social benefits and activation policies and reforms to increase incentives
for and lift obstacles to higher labour market participation of women, older-workers, migrants and
minorities.
Improving the quality and accessibility of infrastructure and strengthening institutions to fight corruption are
recurrent recommendations for durably boosting productivity in emerging-market economies. Many
priorities such as extending the coverage of social protection systems, containing labour costs and relaxing
overly strict job protection for workers in formal jobs are also intended to address labour informality and
low employment in some of the emerging-market economies.
Going for Growth priorities over the years
Going for Growth has been identifying structural reform priorities and documenting progress since 2005.
A comparison with the 2005 edition can give an idea on how the emphasis on different priority areas have
evolved. The priority selection has changed somewhat over the years, and so has the country coverage.
New policy areas have emerged as important, with new indicators to measure them and new evidence on
impacts. The emphasis has shifted, for example as visible in the integration of new Going for Growth
dimensions: inclusiveness and green growth. However, many priorities have been replaced as
governments have responded to the main challenges by undertaking reforms.
ECONOMIC POLICY REFORMS 2019: GOING FOR GROWTH © OECD 201932
Figure 1.6. Going for Growth 2019 priorities across main policy areas
Note: The blue boxes indicatepriorities primarily targeting labour productivity, and the green boxes indicates priorities primarily targeting labour
utilisation. This distinction is only approximate, as many priority areas, e.g. education, can impact both labour productivity and labour utilisation.
StatLink 2 https://doi.org/10.1787/888933954382
Product market regulation has remained among the most important priorities, but has lost relative
prominence in the 31 OECD countries covered in 2005 (Figure 1.7). Extensive progress on reforms in
regulation and competition have been documented in Going for Growth, and are visible in the convergence
of OECD’s Product Market Regulation (PMR) indicators over time (Koske et al., 2015; Vitale et al., 2019).
As a result, product market regulation is now more frequent as a priority in emerging-market, most of which
have only been included in Going for Growth recently.
Similarly, governments have made significant progress on reforming labour market regulation, reducing
labour tax wedges, in particular for low-skilled workers and addressing older-worker incentives to
participate in the labour market. In particular, some of these priorities were dropped in Central European
countries where labour market performance has improved significantly in the last decades. Similarly, such
priorities have been dropped or modified in Nordic countries, often due to reforms taken to address the
employment prospects of specific parts of the workforce, e.g. older workers.
Several categories of reform priorities have become more common. For example, skills and education,
public infrastructure and rule of law, as well as innovation, have gained prominence since 2005. Labour
market related priorities are now focused more on labour market participation of women, activation policies,
social benefits and improving the position of migrants and minorities on the labour market. Such changes
are part of a longer-term process, not the least due to improvements of measurement and understanding
of specific policy areas, and their increasing coverage in Going for Growth.
ECONOMIC POLICY REFORMS 2019: GOING FOR GROWTH © OECD 2019 33
Figure 1.7. Some Going for Growth priority areas proved to be persistent challenges
Number of Going for Growth priorities across policy areas¹
Education
Product market regulation
Legal and physical infrastructure
Tax structure and efficiency
Female labour participation
Social benefits & Active labour market policies
R&D and innovation policies
Tax wedges
Agricultural support
Housing and land-use policies
Labour market regulation
Pollution and emissions
Pension & older workers participation
Integration of immigrants&minorities
2005 priorities
Public and health sector efficiency
Financial sector regulation 2019 priorities
0 5 10 15 20 25 30 35 40 45 50
1. Based on the sample of 31 OECD countries covered in Going for Growth 2005.
StatLink 2 https://doi.org/10.1787/888933954401
Key policy recommendations for boosting inclusive and sustainable growth
The 2019 Going for Growth country-specific priorities and recommendations to address them are listed in
the detailed Country Notes (Chapter 4). Based on these, common reform recommendations can be
identified. They can be classified as reforms to boost business dynamism, unlock skills development and
innovation potential for all, and support workers to make the most of a dynamic labour market.
Implementing the recommended reforms can benefit the equality of opportunities and in a number of cases
improve environmental sustainability.
Reforms to boost business dynamism
Businesses have a crucial role to play by providing employment opportunities, contributing to skills
development and knowledge and technology diffusion, particularly in a context of rising global integration.
Lifting barriers for businesses to enter and experiment with new ideas, compete and raise resources to
grow, but also fail and exit if not successful are all requirements for boosting productivity growth,
incentivising innovation and job creation.
Red tape and barriers to trade and FDI openness
Recommendations to streamline permits, licensing and insolvency procedures are among the most
common in both advanced and emerging-market economies (Figure 1.8). Introducing or improving one-
stop shops for business registration is recommended in several emerging-market economies, but also in
Germany and Greece. Greater use of the assessment of regulatory impact of legislative proposals is
recommended in several European economies, Korea and South Africa. A level playing field among firms
needs to be safeguarded by stronger competition authorities and regulators, while improved governance
of state-owned enterprises is crucial for both competition and efficiency. Indeed, several countries have
recommendations to reduce government ownership in the economy via privatisation.
ECONOMIC POLICY REFORMS 2019: GOING FOR GROWTH © OECD 201934
Figure 1.8. Key recommendations in product market regulation, competition and trade and FDI
openness
Deregulation and improving competition in potentially competitive segments of network sectors remain
among the key recommendations for both advanced and emerging-market economies. Deregulation in
professional services and retail trade is recommended particularly in advanced economies, while removing
tariff and non-tariff barriers to trade and obstacles to FDI are recommended especially for emerging-market
economies in order to increase access to global demand for, and supply of, goods, services, technologies
and knowledge.
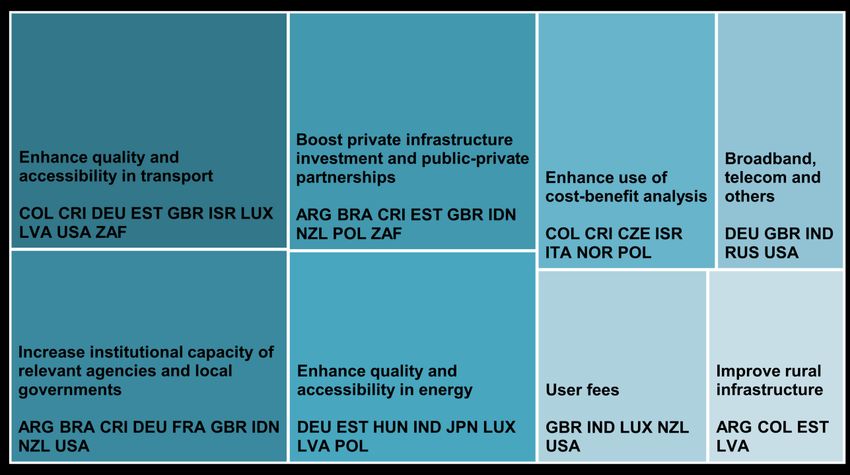
Improving the quality and accessibility of infrastructure
Improving the quantity and quality of infrastructure in a cost-effective way can boost growth and provide
access to markets, education and quality services for greater share of the population (e.g. health care and
utilities). In Going for Growth 2019, 10 advanced and 8 out of 12 emerging-market economies have
priorities to improve infrastructure (Figure 1.9). In Argentina, Brazil, Colombia, Costa Rica, Indonesia and
South Africa significant gaps in infrastructure, in particular in transport, hold back job creation, access to
markets and employment opportunities and contribute to regional income inequalities. In India, where
many households still do not have access to electricity and water sanitation, upgrading infrastructure will
boost growth and improve people's health and well-being. Making greater use of public-private
partnerships (PPPs), involving the private sector and using innovative financing models for infrastructure
investment is recommended in all of the above countries.
ECONOMIC POLICY REFORMS 2019: GOING FOR GROWTH © OECD 2019 35
Figure 1.9. Key recommendations in the area of provision of infrastructure
In Germany and the United States expanding public investment to support broadband internet access is
recommended. Transport infrastructure investment, in particular public, low-emission transport is a
recommendation for Germany, Israel, Italy, Luxembourg, the United Kingdom and the United States.
Ensuring the high quality of infrastructure projects is a key consideration in efficient use of public resources,
effective delivery of social services and minimising negative environmental outcomes. In this respect,
expanding and improving the use of cost benefit analysis in infrastructure project selection is
recommended in Colombia, Costa Rica, Israel, Italy, Norway and Poland.
A level playing field for businesses cannot be effective without a well-functioning judicial system and
enforcement of laws and policies. Recommendations in this area include improving the protection of
whistle-blowers (China, Mexico and Russia), the functioning of the judicial system (Slovak Republic) and
anticorruption and law enforcement (a number of large emerging-market economies, Italy and the Slovak
Republic). Improving the efficiency of public administration will also facilitate the implementation of policies,
law enforcement and more generally save resources. It can also help secure trust in the government.
Recommendations in this respect span more transparent and effective public procurement (Czech
Republic, Denmark, Iceland, Italy, the Slovak Republic and Mexico) and investing in human and technical
resources in administration (Greece, Italy and Russia).
A tax system that is more friendly to growth, equity and the environment
Shifting the tax burden away from incomes to revenue sources such as property, consumption and
environmental taxation, can raise economic growth and improve its environmental sustainability. A shift to
taxation of property and consumption can also have the advantage of exploiting less mobile tax bases in
the context of further global integration. In areas where tax base erosion and cross-border environmental
externalities are large, such as carbon taxation, international co-operation and co-ordination can improve
the efficiency and effectiveness of policy action.
ECONOMIC POLICY REFORMS 2019: GOING FOR GROWTH © OECD 201936
Some 25 countries, of which three emerging-market economies (Argentina, Brazil and Russia) have
priorities directly related to the tax system. In European countries, shifting the tax burden to property is
among the main recommended reforms. Increasing consumption taxes is recommended in Japan, Korea
and many European countries. Scaling back specific, inefficient taxes is recommended in Argentina, while
consolidating various state and federal indirect taxes towards a national value added tax is a
recommendation in Brazil. Recommendations to improve the efficiency of the tax system also include
phasing-out inefficient tax expenditures (Argentina, Canada, Germany, France and Finland) and improving
revenue collection, including through the use of digital technologies (Greece and Italy).
Unlock skills development and innovation potential for all
An efficient and inclusive education system is crucial for higher productivity growth and employment in the
future. Education is a major area of priorities, and the country-specific recommendations target various
areas and levels of education (Figure 1.10). Ensuring that the human capital and firm potential translate
into productivity growth requires also adequate innovation support policies.
Figure 1.10. Key recommendations in education and skills
Access to quality education
Better access to and higher quality of education are recommendations both for tertiary education, and for
primary and secondary education, particularly through targeted support for disadvantaged schools and
ECONOMIC POLICY REFORMS 2019: GOING FOR GROWTH © OECD 2019 37
students (Figure 1.10). In Brazil, India, Mexico and South Africa, recommendations include upgrading
school infrastructure, in particular in remote and poorer regions. Increasing school autonomy and
accountability, recommended primarily in European countries, Turkey and South Africa, can also help in
this manner, in particular if coupled with efforts to raise teachers’ qualifications through better incentives
and prospects for career development. Finally, recommendations to reform university funding, such as
allowing the introduction of general tuition fees in Austria, can bring efficiency gains and improve incentives
to better align curricula to job-market needs. However, the introduction of general tuition fees requires the
development of a grant and income-contingent student loan systems to avoid socio-economic segregation.
Vocational education and activation policies
Recommendations to expand vocational education and training (VET) and lifelong learning are among the
most popular in the category of education (Figure 1.10). The objective is to improve the responsiveness to
new skill requirements. The recommendations target more involvement of businesses in VET design,
notably at the local level. Particular emphasis is placed on the expansion of apprenticeships and on-the-
job training.
Longer working lives will mean a longer period where depreciation of skills and technological change risk
making human capital obsolete. In this light, recommendations on lifelong learning are common in
advanced economies where populations tend to be older on average.
Innovation policies
Public R&D support is needed to complement the framework conditions for innovation and put human
capital to productive use. The most common recommendations in this area include better balancing the
support between direct funding and indirect tax incentives (Figure 1.11). Stronger collaboration between
universities and research centres and the private sector as well as better co-ordination of public policies,
are recommended in particular in Central and Eastern European countries. Finally, recommendations on
evaluating existing policies and programmes and focusing on those that deliver results aim at improving
the efficiency of the money spent.
Figure 1.11. Key recommendations on R&D and innovation policies
ECONOMIC POLICY REFORMS 2019: GOING FOR GROWTH © OECD 201938
Supporting workers to make the most of a dynamic labour market
Workers need to have the incentive and opportunity to find quality employment. This means policy makers
need to balance incentives in the tax and benefit system and provide well-targeted activation policies to
improve employability.
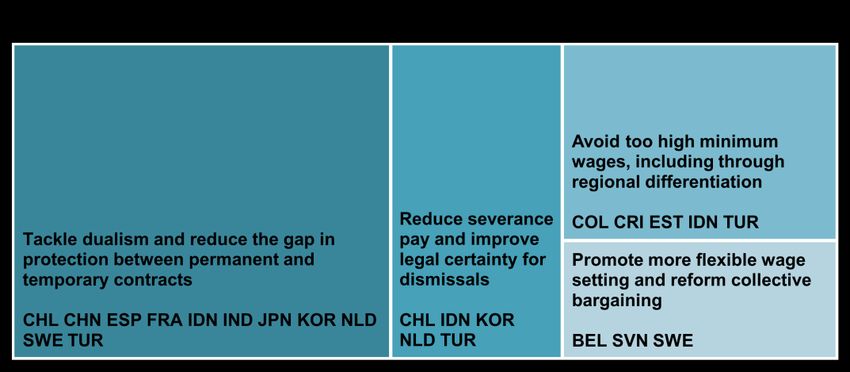
Labour market dualism and informality
In the two decades prior to the financial crisis, many countries promoted flexibility in the labour market by
easing regulations on non-regular contracts. At the same time, the existing stricter regulations on regular
contract remained unchanged. This has led to an expansion of non-regular contracts and to an increase
in labour market segmentation. The youth and the low-skilled tend to be overrepresented among non-
regular workers.
Excessive protection of regular contracts can leave a significant part of workers unemployed, in poor quality
non-standard work or in the informal sector. Informal and low quality jobs are often worse paid and have
poorer – if any – security, social protection coverage and on-the-job training. Moreover, the transition from
informality to regular jobs is difficult and working informally may have negative consequences for future
labour market prospects (Petreski, 2018; OECD, 2014).
Key recommendations in the area of labour market duality include aligning the protection of regular and
non-regular workers in advanced economies and reducing strict protection of regular contracts in
emerging-market economies with large informal sectors (Figure 1.12). More flexible wage bargaining is
recommended in a handful of advanced economies, while avoiding too high or too rigid minimum wages
is recommended in some emerging-market economies. Finally, reducing severance pay and the
uncertainty related to dismissals are recommended in several countries (e.g. the Netherlands, Chile,
Turkey and Indonesia).
Labour taxation and social benefits that incentivise work
High average and in particular high marginal taxes on labour income tend to depress individuals’ labour
supply by discouraging full-time labour force participation. In addition, high labour taxes can reduce firms’
labour demand by driving up the cost of labour (due to high employers’ social security contributions or
payroll taxes). This can lead to lower employment, shorter hours worked and higher unemployment. Such
detrimental effects are more pronounced for workers facing labour demand-side obstacles, generally youth
and the low-skilled, and those facing supply-side obstacles, generally second earners, mothers of young
children and single parents.
Excessive and poorly designed labour taxes and social security contributions create both labour supply
and demand obstacles and are drivers of labour market informality and low employment. These effects
tend to weaken opportunities and mobility in the labour market. Many of the Going for Growth priorities to
lower labour taxation focus on low-skilled workers that are at greater risk of being excluded from the labour
market (Figure 1.12). In some countries, such recommendations are formulated in the broader context of
the efficiency of the tax and transfers system through lowering the taxation of (labour) income and shifting
the tax burden toward immovable property and consumption.
The goal of the mix of unemployment benefits, social protection and active labour market policies is to
provide adequate income support in times of need, while encouraging the return to work. It serves to help
workers’ adapt to the changing reality of the job market through skills acquisition and experience. In this
respect, many countries would benefit from boosting activation policies and targeting them towards
workers with weak labour market attachment, such as youth and the low-skilled (Figure 1.13). Similarly,
better targeting of social benefits and gearing them to increase the incentives to take up work is a common
recommendation. An expansion in benefits is recommended in Chile and bridging the rural/urban divide in
coverage is recommended in China.
ECONOMIC POLICY REFORMS 2019: GOING FOR GROWTH © OECD 2019 39
Figure 1.12. Key recommendations in labour market policies
A more inclusive labour market
A high proportion of women are currently not employed, overrepresented among (involuntary) part-time
workers (OECD, 2016) or more likely to be in the informal economy (ILO, 2018). This can often be traced
back to barriers or disincentives to work induced by policies (Figure 1.14):
the generosity and the design of tax and benefit systems: for example, fiscal disincentives to work
for second earners such as tax allowances for non-working spouses and joint income taxation of
spouses;
high costs and poor accessibility of childcare;
the design of parental leave policies and low take-up of parental leave.
Removing such obstacles will not only ensure better opportunities for women in the labour market but will
also promote the economic prospects for children from disadvantaged background.
Better inclusion of minorities and migrants in the labour market are key priorities for inclusive growth. In
Australia, Israel, New Zealand, Slovakia and Hungary recommendations target minority groups that show
weaker performance in the labour market and in education. The recommendations focus particularly on
the quality and targeting of education and improving the school-to-work transition and better engagement
with representatives of the minorities. Recommendations targeting migrants include better training and
language support and recognition of foreign qualifications (Figure 1.14).
ECONOMIC POLICY REFORMS 2019: GOING FOR GROWTH © OECD 201940
Figure 1.13. Key recommendations on activation policies and social benefits
Figure 1.14. Key recommendations to make the labour market more inclusive
ECONOMIC POLICY REFORMS 2019: GOING FOR GROWTH © OECD 2019 41
Structural reforms to promote growth and equality of opportunities
Going for Growth advocates a large number of priorities that are likely to increase the equality of
opportunities for workers, both current and among future generations. Such priorities aim at providing
adequate skills, quality employment and improving the prospect for upwards income mobility (Figure 1.15).
More generally, reforms to level the playing field and encourage competition can also be seen as improving
the equality of opportunities for firms.
Figure 1.15. Going for Growth priorities most likely to promote equality of opportunities
Share of Going for Growth 2019 priorities
Per cent of total 2019 priorities
20 20
Advanced economies Emerging-market economies
18 18
16 16
14 14
12 12
10 10
8 8
6 6
4 4
2 2
0 0
Education Social benefits and Policy barriers to Labour market Tax structure Infrastructure &
activation policies full-time female regulation and efficiency housing policies
participation and dualism
1. Going for Growth priorities are considered as inclusive when associated recommendations are likely to reduce income inequality. They are
considered as neutral in terms of inclusiveness when their impact on income inequality is either unknown or null. Finally, priorities are considered
as adverse for inclusiveness when associated recommendations may trigger an increase in income inequality. See text and also Chapter.
StatLink 2 https://doi.org/10.1787/888933954420
Providing educational opportunities for all
Education shapes individuals’ life chances, ensures the acquisition of job-market relevant skills and helps
the development and productive allocation of talents. In Going for Growth around 15% of the reform
priorities advocated, both in advanced and emerging-market economies, can be seen as targeting fairer
access to education. Examples of recommendations on enhancing equity of opportunities in education
and skills span a wide range of areas: additional, targeted support to disadvantaged schools or students
in all levels of education and reforms to improve the school-to-work transition, lifelong learning and
vocational education.
Promoting equal opportunities in the labour market
Quality employment opportunities are crucial for equal opportunities of succeeding in life. A multitude of
Going for Growth labour market-related reform priorities will help in this respect. Reducing labour market
dualism, reducing the labour tax wedge on low-income workers and a more flexible minimum wage can
help bring workers into the formal labour market in many emerging-market economies. Reducing the gap
in protection of workers on regular and non-regular contracts can improve the access to training and career
prospects as well as their social benefit coverage.
Targeted and effective activation policies can help dismissed workers and those with weak attachment to
the labour market to update their skills and find employment. Removing policy disincentives to the
ECONOMIC POLICY REFORMS 2019: GOING FOR GROWTH © OECD 201942
participation of women in the labour market has significant benefits in terms of equality of opportunities for
both current and future generations. In families where no-one is working, and in families with single mothers
at risk of poverty, children are more likely to face lifetime disadvantage. This is a key issue in both
emerging-market and advanced economies1, where children from disadvantaged backgrounds are at
greater risk of material deprivation and for which recommendations are formulated to address this
challenge.
Similarly, recommendations for better inclusion of migrants and minorities address directly the fact that
workers from these groups as well as their children often suffer from poor performance in the labour market
and in education.
Improving infrastructure and housing to enhance access to equal opportunities
Better infrastructure, especially in large emerging-market economies and remote regions, is crucial to
provide access to markets, education and quality services for greater share of the population (e.g. health
care and utilities). It can help decrease income inequality and regional disparities (Calderon and Serven,
2014) and improve the equality of opportunities both for workers as well as for firms.
Housing access and affordability can affect both labour productivity and labour utilisation. Housing also
has a significant impact on well-being, being central in households’ life and social mobility throughout the
lifetime. Restrictive housing policies can hamper housing investment and limit labour mobility, thus
potentially raising structural unemployment and increasing skill mismatch (Adalet McGowan and Andrews,
2015). Rigidities in the housing market can also discourage capital mobility and contribute to resource
misallocation by distorting the price responsiveness of construction to supply and demand signals.
Improving the accessibility of housing is recommended in Latvia, New Zealand and the United Kingdom.
Improving the flexibility and reducing distortions in the housing market is recommended in Denmark, the
Netherlands, Sweden and Luxembourg.
Structural reform priorities that address environmental sustainability
The global economy faces major environmental challenges. Climate change poses major systemic risk to
future growth and well-being, even if the exact effects are uncertain. Greenhouse gas emissions are far
from where they need to be with respect to the globally agreed targets of net-zero emissions in the second
half of the century (OECD, 2017). Outdoor air pollution, which is more closely linked to domestic impacts,
has a significant impact on both growth and well-being, with an estimated global death toll over 4 million
annually (WHO, 2018). Issues related to waste and biodiversity loss are among other significant risks and
potential bottlenecks even if they are more difficult to link to growth directly.
Even if the direct links between growth and the environment are complex and difficult to quantify, the Going
for Growth objectives of higher economic growth need to be fulfilled in a way that can be sustained by the
environment. This requires that the design of pro-growth reforms take into account the costs of
environmental degradation by increasing the stringency of environmental policies or providing incentives
for more environmentally-friendly innovation.
In the 2019 edition of Going for Growth, 11 countries and the European Union have been identified as
having a priority to address the environmental sustainability of growth and well-being (a “green growth
priority”) among the Top 5 pro-growth priorities (Figure 1.16). China, and Turkey have primarily pollution
related priorities, though greenhouse gas emissions and water scarcity are also targeted. In China, air
pollution is estimated to cause over 1 million deaths per year while Turkey has one of the worst air quality
in the OECD. India, where millions of households still lack access to electricity, clean water and sanitation
and the death toll of air pollution is similar to that in China, has a priority to combine more efficient use and
quality access to electricity, water and sanitation and to reduce transport-related pollution.
ECONOMIC POLICY REFORMS 2019: GOING FOR GROWTH © OECD 2019You can also read