Impact of macroeconomic reform on labour markets and income in Zambia: Assessing ZAMMOD - ILO
←
→
Page content transcription
If your browser does not render page correctly, please read the page content below
EMPLOYMENT   Employment Policy Department

             EMPLOYMENT
             Working Paper No. 245            2018

             Impact of macroeconomic
             reform on labour markets
             and income in Zambia:
             Assessing ZAMMOD

                             Alemayehu Geda
                             John Weeks
                             Herryman Moono

                                               Employment
                                               and Labour
                                               Market Policies
                                               Branch
Employment Policy Department
EMPLOYMENT Working Paper No. 245 2018
Impact of macroeconomic reform on labour markets and income in
Zambia: Assessing ZAMMOD
Alemayehu Geda
John Weeks
Herryman Moono
INTERNATIONAL LABOUR OFFICE – GENEVACopyright © International Labour Organization 2018 Publications of the International Labour Office enjoy copyright under Protocol 2 of the Universal Copyright Convention. Nevertheless, short excerpts from them may be reproduced without authorization, on condition that the source is indicated. For rights of reproduction or translation, application should be made to the Publications Bureau (Rights and Permissions), International Labour Office, CH-1211 Geneva 22, Switzerland. The International Labour Office welcomes such applications. Libraries, institutions and other users registered in the United Kingdom with the Copyright Licensing Agency, 90 Tottenham Court Road, London W1T 4LP [Fax: (+44) (0)20 7631 5500; email: cla@cla.co.uk], in the United States with the Copyright Clearance Center, 222 Rosewood Drive, Danvers, MA 01923 [Fax: (+1) (978) 750 4470; email: info@copyright.com] or in other countries with associated Reproduction Rights Organizations, may make photocopies in accordance with the licences issued to them for this purpose. ISSN 1999-2939; 1999-2947 (.pdf web) First published 2018 The designations employed in ILO publications, which are in conformity with United Nations practice, and the presentation of material therein do not imply the expression of any opinion whatsoever on the part of the International Labour Office concerning the legal status of any country, area or territory or of its authorities, or concerning the delimitation of its frontiers. The responsibility for opinions expressed in signed articles, studies and other contributions rests solely with their authors, and publication does not constitute an endorsement by the International Labour Office of the opinions expressed in them. Reference to names of firms and commercial products and processes does not imply their endorsement by the International Labour Office, and any failure to mention a particular firm, commercial product or process is not a sign of disapproval. ILO publications can be obtained through major booksellers or ILO local offices in many countries, or direct from ILO Publications, International Labour Office, CH-1211 Geneva 22, Switzerland. Catalogues or lists of new publications are available free of charge from the above address, or by email: pubvente@ilo.org Visit our website: www.ilo.org/publns Printed by the International Labour Office, Geneva, Switzerland
Foreword
                Promoting productive employment is a major challenge for emerging and developing
          economies, and the challenge can be further compounded as a result of financial and
          economic crises. A better understanding of the labour market impacts of crises can provide
          critical lessons for policymakers, workers’ and employers’ organizations in their continued
          efforts to promote sustained, inclusive and sustainable economic growth, full and productive
          employment and decent work for all, Sustainable Development Goal No. 8 of the 2030
          Agenda for Sustainable Development.

               In recent years, particularly as copper prices have fallen, Zambia has faced acute
          economic and social challenges, including weak growth, a high level of public debt,
          deteriorating balance of payments, weak fiscal positions, youth unemployment, and lack of
          diversification. To address the challenges, the government of Zambia adopted the Economic
          Stabilization and Growth Programme (ESGP, commonly referred to as “Zambia Plus”). This
          paper, authored by Alemayehu Geda, John Weeks and Herryman Moono, reviews an
          econometric model (ZAMMOD) currently being used by the Zambia Ministry of Finance
          for forecasting, policy analysis and budget preparation; identifies some limitations to the
          labour market block of ZAMMOD, and makes specific recommendations on how the block
          could be enhanced. The authors then introduce these recommendation into the model and
          run two simulations: (i) examining the labour market impacts of the policy measures found
          in “Zambia-plus” and (ii) examining the labour market impacts of austerity measures that go
          beyond “Zambia-plus” by reducing public expenditure three percentage points below the
          level identified in “Zambia-plus.” Under the first scenario, the unemployment rate is not
          expected to change significantly, but subsistence farmers are expected to experience the
          largest decline in monthly earnings. Simulations under the second scenario also point to
          limited changes to the unemployment rate, albeit more detrimental than under the first
          scenario. Monthly earnings for all households in the private sector, informal economy, and
          for subsistence farmers are expected to decline under the second scenario. These outcomes
          point to important distributional implications of the proposed policy reforms, and the need
          to design and implement policies to support and protect the most vulnerable.

               The paper was undertaken as part of a research project on “New forms of work and
          income security: global and country-specific perspectives,” funded by the Government of
          the Republic of Korea. With unemployment and underemployment levels remaining
          stubbornly high and insufficient job growth to reduce the incidence of working poverty in
          many parts of the world, against a backdrop of a rapidly changing world of work driven by
          new technologies, rapid shifts in the geography of production and trade, demographic change
          and other drivers, the project was undertaken with a view to building knowledge on the
          linkages between these areas. The support of the Government of Republic of Korea, and the
          ILO’s Research Department, in particular Uma Rani Amara, who coordinated the project,
          are gratefully acknowledged.

                                                    Sukti Dasgupta
                                                    Chief
                                                    Employment and Labour Market Policies Branch
                                                    Employment Policy Department

EMPLOYMENT Working Paper No. 245                                                                    iii
Contents
Page
Foreword ........................................................................................................................................... iii
I. Introduction .................................................................................................................................... 1
II. Labour Market challenges: An overview...................................................................................... 3
2.1 An overview of the labour market: General ...................................................................... 3
2.2 An overview of the Labour Market: The recent pattern.................................................... 4
III. The challenge of labour market analysis using ZAMMOD ........................................................ 11
3.1 An overview of ZAMMOD .............................................................................................. 11
3.2 Challenge of effective labour market modelling in ZAMMOD and its enhancement
for improvement ........................................................................................................... 11
3.3 Improving the labour market block and suggestions for improvement............................. 12
IV. Macroeconomic reforms and labour market outcomes: Application of the enhanced
ZAMMOD .............................................................................................................................. 19
4.1 Economic reforms, actual and proposed ........................................................................... 19
4.2 Reforms specified for simulation ...................................................................................... 21
4.3 Simulation outcomes assessed .......................................................................................... 23
4.3.1 The First Simulation: Government proposed stabilization policy –
‘Zambia-Plus’ ..................................................................................................... 24
4.3.2 The Second Simulation: Harder stabilization policy - beyond Zambia-Plus ....... 26
V. Conclusion .................................................................................................................................... 29
References ......................................................................................................................................... 31
APPENDIX 1 .................................................................................................................................... 33
EMPLOYMENT Working Paper No. 245 vI. Introduction
The study attempts to addresses the analytics of macroeconomic and labour market
developments in Zambia and the policy challenges associated with those developments.
More specifically, we review and propose enhancements for the ZAMMOD -econometric
model used by the Ministry of Finance to project the evolution of economic variables.
We propose specific enhancements for ZAMMOD. These are derived from practices
common in the modelling process in other African countries. Having made our suggestions
for improvement, we introduce them into the model in a manner consistent with the current
interactive “block” structure of ZAMMOD. With the enhanced ZAMMOD we assess the
impact of recent and proposed government policies on the labour market. The policy
simulations include fiscal and monetary changes. Of particular importance are the
simulations for the disaggregated employment categories.
While we deal with the major policy issues proposed by the Zambian government,
including diversification of the economy, this is not a comprehensive study on the Zambian
economy or the labour market. Rather, the output of this study aims both to examine the
impact of significant macro policy reform using ZAMMOD as well as to enhance the
ZAMMOD, which is a major tool used to evaluate the consequences of fiscal, monetary and
other policy measures.
Previous studies by authors of this study have addressed macroeconomic issues in
Zambia and the evolution of the labour market:1) general development strategy and poverty
reduction (Weeks et. al. 2006); exchange rate management and balance of payments
adjustment (Weeks, Patel & Mukumbe 2007, Weeks 2015, Geda& Weeks 2016): and
exchange rate volatility and fiscal management (Geda and Moono 2016).
Our study comes at a time of substantial policy initiatives in Zambia. The government,
re-elected in 2016, seeks to create a policy framework in which employment generation
occurs in the context of sustainable public finances including the public debt, an increase in
the rate of economic growth, moderate inflationary pressures, and diversification of the
production structure. Taken together, these policies should support and enhance measures to
reduce urban and rural poverty.
For thirty years democratically elected Zambia governments have sought to resolve
difficult and persistent macroeconomic problems characteristic of small open economies
with high export concentration. Copper, Zambia’s major export has dominated the evolution
of the economy except during the brief years of the sector’s collapse in the 1990s. For the
53 years since independence perhaps the major policy challenge for Zambian governments
has been to manage the copper-dominated economy to achieve national prosperity.
To a substantial extent the problems of unmanageable public debt, unsustainable fiscal
balances and inflationary pressures derive from the volatility of the international copper
market. It is the goal of the authors and of the ILO that this study will contribute to inform
the possible implications of significant policy reforms under implementation and in the
pipeline for labour market outcome as well as enhancing the policy tools that guide the
current government as it manages the macro economy and produces poverty reducing labour
market outcomes.
EMPLOYMENT Working Paper No. 245 1II. Labour Market challenges: An overview
2.1 An overview of the labour market: General
The labour market outcomes of reducing poverty, preventing excessive inequality, and
generating adequate employment are among three most important goals of a macroeconomic
strategy. Poverty, inequality and unemployment are complex phenomena and difficult to
capture with a single measure, particularly in a low-income economy undergoing structural
change. Deeper understanding of labour market developments requires complementary
qualitative studies on the nature of employment conditions and relations.
Measured by the distribution of income, Zambia is among the most unequal countries
in the Sub-Saharan region. The Gini coefficient falls into the .50 to .60 range, which places
Zambia with South Africa, Namibia, and Botswana as the most unequal countries in the
world. High inequality implies that – in order to improve the situation – poverty reducing
growth rates must be very high. This poses a major policy challenge. It also means that there
is significant scope for income redistribution through fiscal policies, social insurance, free
health and education for the poor and direct employment creation provided that the
government has enough revenue. The recent government initiatives include such measures.
Zambia is one of the most urbanised countries in the sub-Saharan region, which has
important implications for labour market behaviour and employment elasticities.
Urbanisation reached its peak in the decade after independence, when mining and
manufacturing sectors prompted rural-urban migration. From the early 1990s this tendency
reversed itself as mining declined and the rest of the urban economy contracted. As a result,
urban population has decreased from forty percent in 1980 to thirty-five in 2000. This decline
in urbanisation was virtually unprecedented since the middle of the twentieth century in the
developed or developing world. Perhaps more than any other simple measure, it indicates
the extent to which Zambian society and economy underwent a seismic shift and reversed
economic transformation.
The recovery of mining and the national economy in the 2000s rejuvenated
urbanization, which rose from about 37 per cent in 2005 to slightly over 41 per cent in 2016.
The high and again rising level of urbanization means that employment and poverty
reduction policies must be designed accordingly, addressing the characteristics of both urban
and rural labour markets.
Data on unemployment should be taken with caution. Frequently those who declare
themselves unemployed may have employment relations that fall outside the survey and
census categories. The ambiguities associated with the unemployed category in Zambia
prompt us to recommend that it be treated as the residual labour market category in
ZAMMOD (see next section). This change in the ZAMMOD is especially important because
of the empirically verified downward trend in formal wage employment in the 1990s and
early 2000s. The decline in formal sector employment appears to have caused a shift of work
to the informal sector rather than unemployment in the strict definition. Sporadic official
data, indirect evidence from the LCMS, interviews with government experts and other
informants in Lusaka, plus some qualitative evidence offer indications for this tendency
towards informalisation in the 2000s (Weeks et. al. 2006, Chapter 3).
As part of this process women workers have been pushed from the formal to the
informal sector, and concentrated in the service trades. It also appears that their activities are
ones in which the income elasticity of demand is low, serving poor populations trades
characterised by ease of entry and requiring little initial capital outlay. As a result, incomes
tend to decline due to competition from new entrants. When formal sector employment
EMPLOYMENT Working Paper No. 245 3declines or grows slowly, surplus income seekers crowd into the urban and rural informal
activities with low access barriers.
Labour market informalisation in Zambia since the 1990s has some similarity to trends
in South Africa. In both countries we have seen in recent decades a shift of work from
standard employment categories typical of the mining and manufacturing sectors. This shift
poses a major policy challenge in both countries, especially for all those entering labour
markets for their first employment. In addition to young workers, in Zambia women suffer
disproportionately from slow formal sector employment growth. Prejudice against women
tends to make them “first fired and last hired” in the formal sector. This labour market
challenge should be met, among other policies, with effective legislation to prevent
employment and pay discrimination in the formal sector.
But in the end, the central labour market challenge is creation of employment
opportunities at a rate to match labour force growth and to do so at above poverty incomes.
Meeting this challenge successfully will require substantial public and private investments,
and effective pro-employment macroeconomic and sectoral policies, as well as effective
active labour market policies. For the formal private sector, policy measures should include
targeted incentives to promote employment creation in key employment-intensive sectors
and that prevents worst forms of employment and contributes to increasingly better working
conditions in order to step-by-step achieve the ultimate goal of ‘decent work for all’. This
also means focusing on improving working conditions for those jobs that are most occupied
by the poorest workers, especially increasing wages, but also other benefits such as transport
and meal allowances, nurseries, social responsibility programmes, and health and safety
standards. Enforcement of decent work standards can be used as criteria for promoting
industries and employers through fiscal and credit measures. Similar supportive policies to
the informal sector, including their formalization, are also crucial as the informal sector is
the main employer in the country.
2.2 An overview of the Labour Market: The recent
pattern
The privatisation of state-owned enterprises in the mining and manufacturing sectors
during the early 1990s shifted significantly the source and quality of employment from
formal jobs with relatively stable and high incomes to informal employment with irregular
and low incomes. The decline in formal mining and manufacturing jobs gave rise to the
importance of the agricultural sector as a leading employer, employing about 48 per cent of
the total Zambian labour force in 2014 (CSO, 2015). Notwithstanding this however, there
has been some rapid and significant growth in the transport and communications and
construction sectors. However, growth in these sectors has tended to be capital intensive,
thereby creating fewer jobs, especially in the low-skill segment.
Disaggregation of the evolution of employment by subsectors (Table 1)shows that the
Zambian construction sector is the highest in terms of employment growth, growing by 128
per cent between 2008 and 2014. Growth in the informal construction sector being more
important. The rise in construction signals growing investment in infrastructure led by
government as well as urban expansion. However, in terms the absolute size of employment,
the "trade, wholesale and retail" sector followed by the "manufacturing sectors are found to
be important.
4 EMPLOYMENT Working Paper No. 245Table 1: Distribution of employment by selected sub-sectors, Zambia, 2008-2014
Formal employment Informal employment Total employment
Sector (‘000s) (‘000s) (‘000s)
2008 2012 2014 2008 2012 2014 2008 2012 2014
Agriculture, Forestry and Fishing 72 87 52 3 212 2785 2 812 3 284 2 872 2 864
Mining and Quarrying 62 68 57 31 21 25 93 88 83
Manufacturing 37 74 45 122 143 179 159 217 224
Electricity, Gas and Water 11 17 17 3 10 10 14 27 27
Construction 14 37 31 66 151 152 80 188 183
Trade, Wholesale and Retail 29 110 34 397 535 658 425 646 692
Transportation and Storage 29 62 29 65 76 123 95 137 152
Hotels and Restaurants 17 30 27 25 33 45 42 63 72
Financial and Insurance and Real Estate 13 15 13 6 8 10 19 22 22
Community, Social and Personal Services 226 348 325 161 892 1 215 387 1 240 1 540
Source: Labour Force Survey, 2014
In general, however, the relatively high economic and sector growth rates in Zambia
are accompanied by low yet positive growth in employment. This reflects in part, the history
of limited sustainable employment generation in the economy so far. For example, the bulk
of employment in the construction sector has been temporal while the growth in mining FDI,
as well as the increase in manufacturing activity has been associated with a move towards
capital-intensive production, thus yielding low growth in employment. This move towards
high capital intensity has generated higher demand for those with more education and
technical skills but little demand for those with low levels of education who comprise the
bulk of the workforce (Moono and Rankin, 2013).1
Arising from the structure of the Zambian economy, with growth driven largely by
large scale capital intensive investments in the mining sector, the labour absorptive capacity
of the private sector and the economy at large is limited. The sphere of Zambia’s private
sector is sharply divided into large enterprises and micro, small and medium enterprises
(MSMEs). The large enterprises generate most of the economic growth, exports and tax
revenues. However, they employ fewer workers than the small enterprises, in part due to the
capital intensive nature of large private sector investments especially in the mining sector.
While Micro, Small and Medium Enterprises account for the bulk of all business in
Zambia (estimated at over 90 per cent), employment generation of these MSMEs have been
limited. This is in part due to subdued growth of these activities on account of limited access
to finance; high costs of doing business (both labour and non-labour costs) and lack of
business skills for those in the informal sector (Ministry of Commerce, Trade and Industry,
2008; Zambia Development Agency, 2016).
The 2014 Zambian Labour Force Survey (LFS)2 shows that the Zambian population is
estimated at 15 million, of which 49.1 per cent are males and 50.9 per cent females. Though
Zambia is deemed to be a highly urbanised country, 58.4 per cent of the population lives in
___________
1
Consequently, there is a rise in informal sector activity as evidenced by the rise in informal
employment, particularly rural agricultural employment.
2
This is the latest Labour Force Survey available from the Zambian government.
EMPLOYMENT Working Paper No. 245 5rural areas. The bulk of the Zambian population is in the age group 15 – 64 years – the
working age population- accounting for 51.8 per cent of the population.
Of the 15 million Zambians, the total number of working-age population (15 – 64 years)
was estimated at 8,149,797 persons (54.4 per cent). Of these 6,329,076 were in the labour
force,3 representing a labour force participation rate (LFPR) of 77.7 per cent (CSO, 2015).
Females had a higher labour force participation rate of 78.2 per cent compared to males (77.1
per cent). Distinguishing this by residence, rural areas’ labour force participation rate stood
at 80.2 per cent compared to urban areas at 72.6 per cent
Briefly examining the age distribution in labour force participation, the 2014 Labour
Force survey shows that the age cohorts indicate a non-linear relationship between age and
labour force participation rates. The participation rate reaches a maximum at the age group
45 – 49 year at 97.6 per cent and lowest in the age group 15 – 19 years with 33.6 per cent.
However, after 49 years of age, participation rate declines to 48 per cent in the oldest age
group, 75 years or older (CSO, 2015).
In terms of educational attainment, the 2014 LFS shows that 43 per cent and 40 per
cent of the Zambian labour force had completed grades 8-12 and grade 1-7, respectively, as
their highest level of education completed while the lowest proportion of 0.6 per cent had
completed education at degree level as their highest level of education. Persons who had
never attended school accounted for 11 per cent of the labour force. Evidently, there is an
increase in labour force participation as educational levels increase, signalling the
importance of education in the labour market (CSO, 2015).
Of the 8,149,797 persons in the working-age population (15 – 64), 5,859,225 were
employed, representing an employment to population ratio of 71.9 per cent. 57.9 per cent of
these employed persons were found to reside in the rural areas with the remaining 42.1 per
cent being in urban areas, a reflection on high employment generation capacity of rural
agricultural activity.
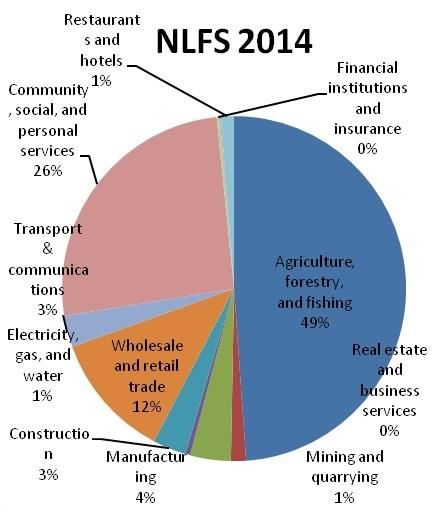
Disaggregation by sector shows that agriculture, forestry and fishing sector accounted
for the highest proportion of employed persons with 48.9 per cent. This is followed by those
employed in "activities of households" ,with 17.4 per cent. The LFS also shows that for both
rural and urban areas, the agriculture, forestry and fishing sector accounted for the highest
proportions of employment of 60.2 per cent and 33.3 per cent, respectively.
___________
3
The labour force participation rate is defined as the ratio of people active in the labour force (working
or seeking employment) to the total working age population.
6 EMPLOYMENT Working Paper No. 245Table 2: Percentage distribution of employed persons by industry, 2014
Industry Total persons Employed
Number Per cent
Agriculture, Forestry and Fishing 2 864 158 48.9
Mining and Quarrying 82 725 1.4
Manufacturing 223 681 3.8
Electricity, gas, steam and air conditioning 16 175 0.3
Water supply, sewerage and waste Management 11 283 0.2
Construction 182 806 3.1
Wholesale and retail trade; repair of motor vehicles and motorcycles 692 078 11.8
Transport & Storage 152 052 2.6
Accommodation & Food Services 72 078 1.2
Information & Communication 20 322 0.3
Financial & Insurance Activities 17 342 0.3
Real Estate Activities 5 154 0.1
Professional, Scientific & technical services 13 856 0.2
Administrative & Support Services 52 631 0.9
Public Administration & Defence 72 767 1.2
Education 158 617 2.7
Human health & social work services 63 255 1.1
Activities of households as employer 1 020 054 17.4
Others 138 191 2.4
Total 5 859 225 100
Source: Labour Force Survey, 2014
A further diagnostic of the labour market shows that at the national level, there were
more employed females (52.4 per cent) than there were males (47.6 per cent). However, as
table 3 below shows that the proportion of males were higher in all institutional sectors apart
from private household sector and private business/farm sector.
Table 3: Percentage distribution of employed persons by institutional sector, 2014
Institutional Sector Total employed persons Male (%) Female (%)
Central Government 243 277 62 38
Local Government 30 367 80 20
Parastatal/State Owned 58 581 77 23
Embassy/International Organization 3 790 83 17
Private Household 367 031 47 53
Producers’ Co-operative 9 040 82 18
NGO, Faith based Organization 31 419 53 47
Private Business/Farm 5 115 721 46 54
Total 5 859 225 48 52
Source: Labour Force Survey, 2014
EMPLOYMENT Working Paper No. 245 7The Zambian informal economy4 is an important source of employment accounting for
84 per cent of total employment and as expected 92 per cent of employment in the rural areas
is in the informal agricultural sector, compared to 72 percent in the urban areas (Table 4).
The high levels of rural employment reflect higher participation in agricultural activities by
rural populations when compared to urban dwellers. Table 4 (and Figure 1) below shows the
percentage distribution of employed persons by industry.
Table 4: Percentage distribution of employed persons by sex and sector of employment, 2014
Total Formal Sector Informal Sector
Urban
Number Number Per cent Number Per cent
Total 5 859 225 944 256 16 4 914 969 84
Male 2 789 012 674 167 24 2 114 845 76
Female 3 070 213 270 089 9 2 800 124 91
Rural/Urban
Rural 3 394 221 264 754 8 3 129 467 92
Urban 2 465 004 679 502 28 1 785 502 72
Source: Labour Force Survey, 2014
Figure 1: Percentage distribution of employment by type and by region, 2014
100 92
90 84
80 72
70
60
50
40
28
30
20 16
8
10
0
Zambia Overall Rural Urban
Formal Informal
Source: Labour Force Survey, 2014
Table 5 shows the distribution of wages in the Zambian labour market. As in other
developing countries, wages in the formal economy are significantly (ove1 100%) higher
than informal economy wages. There is little difference between urban and rural wages,
however. This is true for both formal and informal employment (a median based
comparisons shows significant difference, however). This is informative, however, since
most formal jobs are government jobs with standardized government salaries while the bulk
___________
4
The informal sector comprises of enterprises that are not formally registered. Consequently, they do
not pay tax nor any statutory fees.
8 EMPLOYMENT Working Paper No. 245of the informal employment is in agriculture, and thus the wage differential within sector,
irrespective of region, is expected to be minimal.
Table 5: Distribution of wages in the Zambian labour market, 2014
Type of Number of paid Amount, (mean), (K)*
employment employees Total Rural Urban
Formal 629 626 3 512 3 169 3 634
Informal 688 810 1 227 1 246 1 220
Total 1 318 436 2 344 2 173 2 405
Source: Labour Force Survey, 2014
* Note: A median based data shows more difference both rural and urban as well as between formal and informal
With regards to distribution of wages by gender, figure 2 below shows that for both
urban and rural areas as well as at the national level, men earn more than women. On average,
women earn about 12 less than men..
Figure 2: Distribution of wages by region and by sex. 2014
Source: Labour Force Survey, 2014
Across institutional sectors, however, as shown in figure 6 below, there is a significant
difference in the level of wages. Central government employment offers, on average, the
largest wage with private households being the least paying. Figure3 shows that private
sector employment, which is predominantly self-employment and predominantly located in
the informal economy in Zambia, offers the lowest level of wages, significantly lower than
the national average.
EMPLOYMENT Working Paper No. 245 9Figure 3: Distribution of wages by institutional sector, 2014
Average Monthly Earnings(K)
Private Household 874
Private Business 1800
Producers' Cooperatives 2217
Zambia(Overall) 2344
NGO, Faith Based Organisation 2406
Local Government 2593
Parastatal/State Owned Firm 3470
Embassy/International Organisation 3503
Central Government 4738
0 1000 2000 3000 4000 5000
Source: Labour Force Survey, 2014
In sum, what the preceding labour force diagnostic shows is that informal employment
forms the bulk of employment opportunities for Zambians in both rural and urban areas.
However, evidence shows that a high proportion of those in the informal economy are the
self-employed, with relatively low education levels – most workers in this sector have junior
secondary education or less (Moono and Rankin, 2013). Consequently, those employed in
informal economy face lower wages, on average, than those in the formal employment in
part due to low levels of education, low productivity, among others, which attracts low
returns5 (ZIPAR, 2015).
___________
5
Most self-employed workers are deemed ‘survivalists’ in nature and argued to reflect failure to
secure formal employment rather than entrepreneurial skills and ambition
10 EMPLOYMENT Working Paper No. 245III. The challenge of labour market analysis
using ZAMMOD
3.1 An overview of ZAMMOD
Having identified the major labour market challenges in section 2, this section attempts
to briefly describe the major technical tool for managing those challenges - the ZAMMOD.
We begin with a brief look at the overall structure of the ZAMMOD and specifically how
the labour market block is modelled, outlining some of the major challenges that we
identified. We then move on to provide suggestions on how the labour market block could
be enhanced. This paper finds that if the suggested enhancements are made, ZAMMOD
could be rendered much more potent to analyse and forecast the impact of changes in
macroeconomic policy, evolution of the macro economy and external shocks on labour
market outcomes.
The theory behind ZAMMOD is similar to applied macro-econometric models that are
currently in use in the region such as the “Central Bank of Kenya Macroeconomic Model”,
CBKMM (Were et al., 2013), and the Kenya Institute for Public Policy Research and
Analysis (KIPPRA)–Treasury Macro Model (KTMM) (Huizinga et al., 2001; Geda et al,
2001). These are demand-driven Keynesian models within the typical aggregate demand
(AD) / aggregate supply (AS) framework. These are combined with consistent national
accounts data for the country in question. ZAMMOD is one such model structured along a
number of blocks: production, external sector, prices, fiscal, monetary, as well as labour
market. Like KTMM, the ZAMMOD has consolidated the monetary and external sector
blocks and includes a detailed government (fiscal) block.
The model is primarily designed to meet Ministry of Finance [MoF] needs in the
national budgetary and planning process. The model is run on an MS Office EXCEL
software platform. Most of the model’s parameters are pragmatically computed as averages,
moving averages, ratios and growth rates. There are no econometrically estimated equations
reported. This method characterizes the other blocks of the model including the labour
market block that is of interest to this study. ZAMMOD is currently in use for forecasting,
policy analysis and budget preparation by the Ministry of Finance (MoF).
3.2 Challenge of effective labour market modelling in
ZAMMOD and its enhancement for improvement
Problems of modelling labour market outcomes in the ZAMMOD can be summarized
into two broad areas: (i) those related to the theoretical and econometric formulation of the
labour market block, and (ii) those related to the realism of the labour market outcomes from
ZAMMOD, data availability and accuracy.
(i) Problems of theoretical and econometric formulation
(ii) Problems of Realism of Labour Market Outcomes from ZAMMOD
Table 6 provides numbers to show the substantial gap between ZAMMOD labour
market outcomes and those from Zambia's 2014 national labour force survey (ZNLS). The
ratio of the labour market outcomes from the two sources ranges from about 15 per cent for
the informal sector to almost 350 per cent for the formal sector. The variation of the ratio of
predicted to actual indicates a substantial misalignment (Table 6, column 4). The divergence
ratio is significant for all categories of employment in Table 6. This points at the need for
improvement.
EMPLOYMENT Working Paper No. 245 11Table 6: Zambian employment structure: Differences between ZAMMOD and ZLFS (2014)
Employment by categories ZAMMOD ZLFS ZAMMOD/ZLFS
(in millions) 2014 2014 %*
Employees (Government) 0.221 0.315 70
Employees private sector 0.365 0.124 / 0.849** 294 / 53
Self-employed (including employers) 3.522 1.669.87 211
Unpaid family workers 1.008 2.069 49
Unemployed 0.777 0.470 165
Formal 2 177 0.629 / 0.944*** 346 / 231
Informal 0.765 5.229 / 4.914*** 15 / 16
Labour Force (in millions) 5.722 6.329 90
* 100% = Perfect agreement; < 100% = ZAMMOD underestimated compared to ZLFS; < 100% = ZAMMOD overestimates compared
to ZLFS.
** Employees in private sector are divided between the household sector (0.124) & the private business/farm sector (0.849).
*** Formal sector employment refers to everyone in the formal sector, whether it is formal or informal. The sum adds to the total
employed population in both cases.
^The informal sector employees in ZAMMOD are defined as difference between the total labour force and the sum of government
and private (total paid employees) sector employees. This is also equal to the sum of self-employees and unpaid family workers by
construction in ZAMMOD. This definition of informal sector employees, however, wrongly includes the 'unemployed' as given in rows
217 to 223 of the ZAMMOD, excel sheet named "model".
3.3 Improving the labour market block and suggestions
for improvement
Improving the labour market block of the ZAMMOD requires addressing problems
related to both employment and income. The primary focus of this study is the employment
aspect of the modelling. We focus less on incomes because once the employment aspect is
well modelled the step to the income aspect is quite easy. Second, the income aspect of the
modelling in ZAMMOD is primarily motivated to link average household earning to the
poverty module and related micro data. This is not the primary focus of our study at this
stage.
Conventional literature on African and Zambian labour markets attempts to estimate
employment outcomes of economic growth using a statistical measure named the
"employment elasticity of output". These elasticises are used to link employment with output
and related macroeconomic development (see Akikugbe, 2017; Adegboyeet al, 2017;
Haouas, 2002, among others). An improvement in the labour market block of ZAMMOD
requires computing these elasticises to improve the modelled linkage that the labour market
block has with the macro economy. The derivation of these elasticises can be done in two
ways. The first approach is to compute the point elasticity directly using equation 1 below.
An alternative approach is to use a regression based equation such as the one below (2a).
[1]
[2a]
[2b]
12 EMPLOYMENT Working Paper No. 245Where the subscript "i" stands for sector; E employment; Y output (sectoral value
added); and Di a gender dummy that takes the value of one for female and zero for males.
A third method is to derive sectoral demand for labour following the standard
assumption of a monopolistically competitive representative firm's optimization framework.
This method uses production and profit functions, or the dual of the latter, a cost function to
minimize. The most commonly used functional form presumes a constant elasticity of
substitution among factors of production(CES).The famous Cobb-Douglas version, now
almost 90 years old, involves the special case when the CES=1. The neoclassical condition
for optimality requires profit maximization/cost maximization with respect to the inputs. In
the general CES case, the demand for labour (employment, L), could be derived as follows.
Suppose the CES (for Y output, and K capital) is given by,
Y L L K K 1
[1]
The optimal level of employment can be derived from the condition that the marginal
product of labour (MPL) should be equal to real wage (w/P), where "w" and "P" are nominal
wage and price, respectively. This is given as,
MPL
Y 1
L
L L K K
1 1
L 1 L [2]
L L L K K
1
1 1
Note : 1 1 1
L(1 )
1 1
L L L K K
L(1 )
Thus,
1
Y Y w
L Using the neoclasica l condition noted. [3]
L L P
1
P
1
L L Y 1 [4]
w
w
1
L L Y Where [5]
P 1
This equation [5] becomes linear when it is converted to natural logarithms, yielding
the estimable version,
[6]
Both equations [2a] and [6] could also be set in partial adjustment framework. This has
the advantage of overcoming the limiting assumption of instantaneous adjustment towards
EMPLOYMENT Working Paper No. 245 13equilibrium (steady state) implied by the formulation above. If we define L* the desired or
equilibrium level of employment, and made "λ" an adjustment parameter between 0 and 1
(0< λthe specification of the regression equation is based on sound theoretical basis as expounded
above. Finally, the results across different regression based models reported in Table 7b are
not that radically different. They seem sensible that tally with the evolution of the
employment structure as described in section 2.1 above. Hence, we have used this result to
modify/enhance the labour market aspect of the ZAMMOD in this study.
Table 7a: Employment elasticises in Zambia
Elasticity
Elasticity
(Estimated using a
(Direct estimate based on
Regression based model,
Sector equation 1)
equation 2a)
ZLFS ZLFS ZLFS 2005-2008
2014 2014 (Akikugbe, 2017)
Agriculture, forestry and fishing -2.63 0.13 1.91
Mining and quarrying -0.14 -3.45 -3.2
Manufacturing 0.98 0.23 17.2
Electricity, gas and water 1.92 0.14 -9.4
Construction 13.20 -0.37 2.85
Wholesale and retail trade 0.70 0.29 25.1*
Transport and communications 1.16 0.68 -0.9
Community, social and personal services 4.43 2.41 58.5
Financial institutions and insurance -1.28 1.98 -5.1
Real estate and business services** -4.04 **
Restaurants and hotels 1.94 1.74 *
Zambia (all) 0.50 0.61 1.92
Notes:*Restaurants & hotels are included in Wholesale, retail trade sector in Akikugbe (2017).
**"Business services" are put under "Financial and Insurance" sector in Akikugbe (2017). The author does not mention where he put
"Real estate" services.
EMPLOYMENT Working Paper No. 245 15Table 7b: Employment Elasticises in Zambia: Regression based estimates (1994-2013)
Model 1 Akikugbe
Model 2
Regression based 2017
Demand for Labour
elasticity estimates
Sector
Partial Partial ZLFS
Equilibrium Equilibrium
adjustment adjustment
model model 2005-2008
model model
Agriculture, forestry and fishing -1.34 -0.72 -1.34 -0.85 1.91
Mining and quarrying 0.24 0.17 0.25 0.15(1.3) -3.2
Manufacturing 0.42 0.38 0.25(1.04) 0.23(0.94) 17.2
Electricity, gas and water 2.43 0.71 1.77 0.66 -9.4
Construction 0.39(1.03) 0.44* 0.11(0.22) 0.36(0.90) 2.85
Wholesale and retail trade* 0.66 0.43 0.58 0.41 25.1*
Transport and communications 0.11(57) 0.28 -0.10(0.35) 0.24(1.1) -0.9
Community, social and personal
0.56 0.20 0.52 0.24 58.5
services
Financial institutions and insurance -0.42(-0.28) -0.44(-0.28) -0.46(-0.25) -0.42(0.23) -5.1
Real estate and business services*** -0.04(-0.13) -0.02(-0.07) -0.48(-0.96) -0.47(-0.89) **
Restaurants and hotels** *
Zambia (all) 0.55 0.19 0.49 0.21 1.92
Note: * All estimates are statistically significant at 1% and better. The only exceptions are those written in italics and to which their
t-value is given in parenthesis. The construction sector elasticity for model 1, partial adjustment version, is significant at about 10
per cent
** We don't have employment data for this sector (Restaurants and hotels). However, we didn't miss much as the sector's contribution
to GDP is about two per cent.
*** We don't have employment data for this sector. Thus, we have combined this sector's output with the output of the "Financial
Institutions and Insurance" sector. We then used the employment in the latter sector to compute the aggregate elasticity - thus
assuming this sector's employment figures also include those in the "real estate and business services".
Source: Authors’ regression based estimation using ZAMMOD database.
Table 7c: Interpretation of estimated elasticises
Employment elasticity here
For positive GDP growth For negative GDP growth
(corresponds)
(-) employment growth (+) employment growth
eevolution of the macro economy in ZAMMOD on the other. In the current version of the
ZAMMOD such linkages are either missing or unsatisfactory. The exception is the
modelling of the number of employees in the private sector which is relatively better. These
crucial linkages are made and the ZAMMOD is enhanced to depict he following employment
categories better: "employees in the government sector"; the "unpaid family labour"
category; the "unemployed" category as well as the "Self-employed" category.
Once these improvements are made, the next logical step is to improve the income
outcome of the improved employment categories. This in particular relates on how to link
such employment categories with income, especially for the following employment
categories which are poorly modelled in the current version of the ZAMMOD: "employers",
"self-employed" and "subsistence farmers". Improving this requires further empirical
research. The purpose of such research should be to link income accruing to these
employment categories to the macro economy. This is an agenda for future research which
is not the prime focus of this study.
In sum, in the context of this study and in an attempt to make the best use of the model,
two major (the third one being the combined result of the two) improvements to the labour
market block of ZAMMOD were made (the labour market outcomes using the original and
modified ZAMMOD are given in Annex 1 for comparison):
i) The linkage that the existing "employment outcome" part of the labour market
block has with the evolution of the macro economy is improved.
ii) A new and richer sectoral based employment outcome module is introduced as
part of the labour market block.
The above two improvements have led to an improved labour market related outcome
in the ZAMMOD to which a policy analysis is carried and discussed in the next section.
EMPLOYMENT Working Paper No. 245 17IV. Macroeconomic reforms and labour market
outcomes: Application of the enhanced
ZAMMOD
This section briefly discusses how the enhanced ZAMMOD is used to analyse the
current policy environment and proposed economic reforms. The presentation is based on
three important documents and interviews conducted in Lusaka in November 2017 by the
research team. The documents are the 2018 budget speech, the government policy statement
known as "Zambia Plus", and the 7th National Development Plan (2017-2021).
Subsequently the proposed reforms in these documents are translated into quantifiable form
for a simulation exercise carried out using the modified/enhanced ZAMMOD. The final
section is devoted to the results of the policy simulation exercise.
4.1 Economic reforms, actual and proposed
Zambia has faced a number of economic and social challenges in recent years. These
include weak growth, a high level of public debt, deteriorating balance of payments largely
related to copper price, weak fiscal positions, youth unemployment, and lack of
diversification. All are long-standing problems that require policy action.
To address the challenges the government of Zambia is adopting new set of policies
from long, medium and short term perspective. The policies appear in the 7th National
Development Plan, the new Economic Stabilization and Growth Programme (ESGP,
commonly called Zambia Plus), and the 2018 Budget Speech. In addition, the government
is in discussion with the IMF and WB on a possible financing package to support the ESGP.
The emerging policy direction from these policy initiatives could be categorized under
the following three main headings:
i) Real Sector Policies: Growth, Diversification and Job creation
ii) Fiscal, Debt and Monetary Policies, and
iii) Structural Policies
i) Real sector policies: Growth, diversification and job creation
In its 7th NDP(MNDP 2017) the government planned GDP growth of 3.9 per cent in
2017, 4.6 per cent in 2018, 5.2 per cent in 2019, then 5.4 per cent and 5.5 per cent in 2020
and 2021, respectively. It has also plans to create productive and gainful job opportunities
during these years. The output and employment growth would be achieved through
diversification of the economy. The planned target for diversification is to increase the share
of the non-mining sector to about 50 per cent of the GDP (MNDP 2017). These ambitious
macroeconomic goals would be underpinned by fiscal, debt and monetary policies aimed at
creating fiscal sustainability and macroeconomic stability.
ii) Fiscal, debt and monetary policies
The fiscal and monetary focus of government policy is (MoF, 2017) "restoring fiscal
fitness" for sustained inclusive growth and development (MoF, 2017). To achieve this, the
government would:
a) restrain unproductive expenditure;
b) focus on completing existing infrastructural works and strictly avoid new
commitments;
EMPLOYMENT Working Paper No. 245 19c) because the financing of farmer input support program(FISP) is judged to be
inefficient, during 2017, the programme is altered so that farmers“ graduate out
of it”, and benefits limited to 1 million farmers;
d) will by the end of 2017 move to electricity tariffs that reflect costs, while
maintaining the special tariff to protect poorer households;
e) will adjust petroleum prices in line with changes in market conditions;
f) ensure that the public debt remains within sustainable levels, in part through
altering the composition of debt towards concessional loans;
g) eliminate arrears to private suppliers owed to suppliers of goods and services,
as well as contractors will also be carried and incur no additional arrears;
h) restrict new public sector recruitments to only frontline workers in the health
and education sectors. This will continue in ESGP period. Central government
wage ceiling will be nine percent of GDP;
i) mitigate the negative effects of the adjustment measures on vulnerable
households by increasing social cash transfers in2017 and sustain them
thereafter; the number of beneficiary households would increase from 242,000
to over 500,000 with monthly payments per household rising by 28 per cent;
j) continue to implement the Food Security Pack Programme, increasing this
programme from the 40,000 in 2017/18 farming season to 80,000 beneficiaries;
k) raise domestically generated revenues and during the current planning period,
domestic revenue would increase to above 18 per cent of GDP;
l) work towards a target inflation of 6-8 per cent as part of the mandate to
maintain and nurture the financial sector and through its monetary policy will
support fiscal consolidation measures.
These ESGP plan and related policies will be implemented through five critical pillars
which are noted by the 7th NDP (MNDP, 2017) as "structural policies" and listed below.
iii) Structural policies
In addition to above policies, the government has also planned to have a set of structural
policies that would (MNDP, 2017; MoF, 2017):
a) restore credibility of the budget by minimizing unplanned expenditures and
halting the accumulation of arrears;
b) enhance domestic resource mobilization and refocusing of public spending on
core public sector mandates;
c) improve economic and fiscal governance by raising the levels of accountability
and transparency in the allocation and use of public finances;
d) ensure greater economic stability, growth and job creation through policy
consistency to raise confidence for sustained private sector investment; and
e) Scaling-up social protection programmes to shield the most vulnerable in
society from negative effects of the Programme.
Finally, the ESGP committed the government to pursue structural reforms while
implementing an effective social safety net to lessen the impact of stabilization measures on
the most vulnerable (MoF, 2017).
We have attempted below to examine the labour market outcome implications of these
policies in the ESGP as well as other measures potentially planned or that might be modified
20 EMPLOYMENT Working Paper No. 245should IMF financing be achieved. In the next section we quantify these policies in a model
simulation exercise, followed by the simulation exercise itself.
4.2 Reforms specified for simulation
Before commencing the simulation of proposed policies using the enhance ZAMMOD,
we reiterate the conclusion and recommendation of a previous study by ILO on the use of
ZAMMOD for policy analysis. This study considered problems related to government
expenditure classification scheme. Noting the problem of aligning expenditure items to
policies and outcome, this ILO study recommended that:
….adapted to fully reflect to economic classification of government outlays so that
one can identify expenditure which are (1) direct transfers to households (category of
social benefits), (2) other social expenditure which are not direct transfers to
households but either support productive capacity of agricultural households, reduce
prices of consumer goods and services or support institutions serving households
(some subsidies and some grants).
This problem, identified in this ILO study, persisted in the current version of the
ZAMMOD and limited our full use of the model for the reform policy and its labour market
outcome analysis. Notwithstanding such limitations, we have used the public expenditure
framework employed in ZAMMOD to specify the proposed reform policies in their
commensurate quantitative form for simulation (see Table 8a). Table 8a is based on the 2018
budget which is an expression of the government's policy reform as discussed above in a
budgetary form.
EMPLOYMENT Working Paper No. 245 21Table 8a: Reform specified for simulation: Government policy expressed in terms of the 2018 budget
Quantitative value in the proposed 2018 budget Simulation 2
Stimulation 1 Extreme/IMF negotiation
Government Scenario – Zambia Plus scenario scenario
Proposed amount in
2018 % of GDP in 2018 % of GDP in 2018
(Billions of K)
Government Expenditure 71.6 25.9% 23%
General Public Service 25.9 36.1% of Budget 36.1% of Budget
Defence, Public order & safety 5.6 7.9% of Budget 7.9% of Budget
Economic Affairs 17.3 24.1 of Budget 24.1 of Budget
Health 6.78 9.5% of Budget 9.5% of Budget
Education 11.56 16.1% of Budget 16.1% of Budget
Social Protection 2.30 3.2% of Budget 3.2% of Budget
Environmental protection 0.951 1.3% of Budget 1.3% of Budget
Housing and Community Amenities 0.816 1.1% of Budget 1.1% of Budget
Recreation, Culture & Religion 0.451 0.65% of Budget 0.65% of Budget
Total Domestic Revenue, Grants &
71.66 25.9% 25.9%
Financing
Total Domestic Revenue 49.09 17.7% 17.7%
Domestic Financing 11.5 4.0% 4.0%
Foreign Grants and Financing 11.42 4.1% 4.1%
Major Planned Macro Aggregates
GDP Growth, 3.9% in 2017 4.6% (in 2018) and 5.2, 5.4, 5.5% until 2021.
Inflation, average annual 7% per annum, 2018-2021
Over all fiscal deficit, including grantssimulation period. In future, this fiscal block of the ZAMMOD needs to be modified to show
public expenditure both by expense and government functional classifications. This will
greatly improve its use for evaluation of detailed policy scenarios and related labour market
(and other economic and social) outcomes.
Leaving aside such improvement for future research, using our assumptions about the
breakdown of public expenditure across expense categories used in ZAMMOD, we have
converted the government's proposed policy that is expressed in the 2018 budget and given
in Table 8a, in a format that is usable in ZAMMOD given as Table 8b below. The implication
of this government policy package, our first simulation, for the labour market outcome is
given in Tables 9a and 9b and discussed in the next section. We have also carried a second
simulation, where we have assumed a more stringent austerity (stabilization) package that
may come if the negotiation with IMF for additional financing is successful. In this
scenarios, we have assumed expenditure as the share of GDP to decline by 3 percentage
points from the level stipulated in 2018 budget while government revenue targets remaining
as stipulate in the 2018 budget. The implication of this latter scenario for the labour market
outcome is given in Tables 10a and 10b and discussed in the next section.
Table 8b: Expenditure and Expenditure Categories used for simulation, 2018 (in millions of Kwacha)
Simulation 1 Simulation 1
Expenditure Categories Before Simulation
(Change from the amount
(used for simulation) (the base run)
base run) (Total)
Current expenditure (calculated) 9 120 47 153 56 273
Wages and salaries 6 035 24 626 30 661
Goods and Services 747 4 285 5 032
Interest payments 0 9 459 9 459
Domestic 0 3 674 3 674
External 0 2 937 2 937
Other current expenditure
2 337 8 783 11 120
( =transfers to hh expenditures)
Capital expenditures 1 697 13 342 15 039
Domestic arrears payments (net lending) 0 321 321
Total expenditures and net lending 11 138 60 495 71 633
4.3 Simulation outcomes assessed
To address the major objective of this study as well as to demonstrate the use of the
enhanced labour market block that is integrated with the ZAMMOD, we have first carried a
macroeconomic forecast for all endogenous variables of ZAMMOD for the period 2017-
2021 with no policy change (the 7th NDP period). This is aimed at tracking the evolution of
the labour market outcomes following our improvement to the ZAMMOD. We use this as
the ‘baseline scenario’ ("business as usual") in comparison to which the policy simulation
exercise outlined in the previous sections is carried out. The baseline scenario results that
are generated using both the modified in comparison to the original (unmodified )
ZAMMOD, including their value in absolute terms, are given in Appendix I. Tables A1 and
A2 in appendix I show the base run scenario using the original and modified ZAMMOD,
respectively. The result shows the improvement has gave rise to a change in both
employment and related income (labour market) outcomes.
EMPLOYMENT Working Paper No. 245 23You can also read