INDUSTRIAL First Half 2017 - Research and Forecast Report - Colliers International
←
→
Page content transcription
If your browser does not render page correctly, please read the page content below
Research and
Forecast Report

                     Accelerating success.

   INDUSTRIAL
   First Half 2017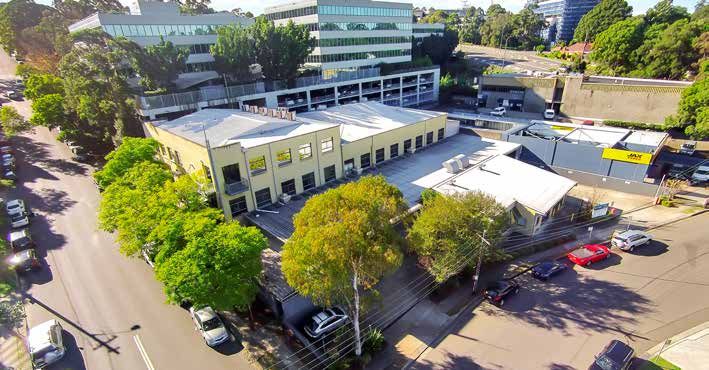
EXPERTS
IN PROPERTY DATA & INSIGHTS
Colliers Edge is a subscription service developed by our in-house
property research specialists, drawing on the expertise of our
national network of operators.

  DEEPER INSIGHTS               LIMITLESS SUPPORT         FAIRER PRICING
   Largest data set             Analyst not operators   Tailored to your needs
   on market today

Want better insights, faster? Talk to a Colliers Edge expert today
         Anneke Thompson
         National Director | Research
         +61 412 581 647
         anneke.thompson@colliers.com
         colliers.com.au/colliersedge

                                                              Accelerating success.
CONTENTS
Industrial snapshot                                                                4

National overview		                                                                5

Sydney                                                                             6

Melbourne                                                                         10

Brisbane                                                                          13

Adelaide                                                                          16

Perth                                                                             18

Newcastle                                                                         20

New Zealand                                                                       22

Our experience – Industrial                                                       26

                      Industrial | Research & Forecast Report | First Half 2017    3
INDUSTRIAL
SNAPSHOT
NET FACE RENTS ( $/SQM H1 2017)

  Prime Grade            Secondary Grade

 10%         5%                6%          23%               2%       8%              PERTH                        ADELAIDE

 $160       $113              $106         $75              $105      $86     $80         $70                 $101           $64

    SYDNEY                     MELBOURNE                       BRISBANE       -14%        -4%                                -2%

PRIME GRADE YIELDS

  H1 2016           H1 2017                                                                                  8.10%         8.06%
                              7.06%                         7.13%            7.13%
                                          6.97%                                         6.93%
  6.74%                                                             6.88%
            6.15%

    SYDNEY                     MELBOURNE                      BRISBANE          ADELAIDE                           PERTH

SECONDARY GRADE YIELDS
  H1 2016           H1 2017
                                                                                                             9.88%         9.50%
                              8.50%                         8.43%
                                                                    8.28%    8.13%
  7.95%                                   8.05%                                         8.00%
            7.05%

    SYDNEY                     MELBOURNE                      BRISBANE          ADELAIDE                           PERTH

2017-2020 FORECAST DEVELOPMENT
SUPPLY DELIVERED (SQM)
                                                                                UNDER CONSTRUCTION

                               BRISBANE
                                803,355           PERTH                                   MELBOURNE
                                                  161,354                                     167,483              ADELAIDE
                                                                                                                   9,941

             SYDNEY                   MELBOURNE                             SYDNEY                      BRISBANE
             2,619,315                     946,451
                                                                            433,458                      189,979

                                                                                              PERTH
                                      ADELAIDE                                                63,435
                                      130,975
NATIONAL
OVERVIEW
By Sass J-Baleh
Manager | Research
sass.jbaleh@colliers.com

Summary
In a market fuelled by historically low interest rates, investors have          Total Sales 2007 to 2016 (AUD million)
looked to the Australian industrial property sector for investment                                                            Quarterly Volume ($)                      Rolling 12-month Total                 Five-year Average
                                                                                                            $7,000
opportunities. In 2016 just over $4.5 billion in industrial sales

                                                                                Total Sales (AUD million)
                                                                                                            $6,000

occurred nationally, slightly above the five-year average of $4.3                                           $5,000

                                                                                                            $4,000
billion. The majority of market transactions were from domestic
                                                                                                            $3,000
purchasers (approximately 60 per cent), and the remainder from                                              $2,000

offshore investors.                                                                                         $1,000

                                                                                                                 $0

Domestically, institutions such as Blackstone, Charter Hall, and                                                   Q1 2007   Q1 2008     Q1 2009      Q1 2010      Q1 2011    Q1 2012   Q1 2013    Q1 2014     Q1 2015   Q1 2016

AMP have been actively pursuing industrial opportunities. Last half             Source: Colliers Edge/RCA

of 2016, Blackstone purchased industrial portfolios worth around
                                                                                National Industrial Supply Pipeline
$1.5 billion.
                                                                                                                                       Complete                                                  Under Construction
                                                                                                                                       DA Approved                                               Development Application Stage
This trend is set to continue with strong demand from offshore                                                                         Contract let                                              Deferred

investors, particularly, Asian-based investors and local funds based                                            4,000,000
                                                                                                                                       Early Stages                                              10-Year Annual Average

in Australia.
                                                                                             Floorspace (sqm)

                                                                                                                3,000,000

As institutional investors have, and are continuing to, seek to
                                                                                                                2,000,000
expand their ownership of industrial assets (particularly within the
logistics sector), the availability of assets (particularly high-quality                                        1,000,000

assets) for sale has diminished. Limited property portfolios are                                                        0
                                                                                                                             2007   2008 2009 2010              2011   2012   2013   2014   2015   2016     2017F 2018F 2019F 2020F
expected to reach the market in 2017, raising the competitiveness
                                                                                Source: Colliers Edge
for purchasing assets. One alternate avenue to raise property
ownership is the identification of corporate companies for potential
sale and leaseback programs, which is a growing trend expected to           •                               Labour market improvements and growth in industrial
continue into 2017.                                                                                         industry sectors
The record levels of transport infrastructure development will              •                               Tenant retention (with many instances of expansionary
help alleviate supply constraints in the medium to long-run by                                              requirements)
strengthening the connections to developable land. Appreciation             •                               Low interest rate environment
in land values and rental growth has already transpired in certain
                                                                            •                               Strong GDP growth
markets within Sydney and Melbourne – with similar trends
                                                                            •                               Retail turnover growth
expected in Brisbane.
                                                                            •                               A weaker local dollar boosting net exports.
There has been a consistent performance trend in industrial prime
assets observed across Sydney, Melbourne, and Brisbane industrial           Against a backdrop of decreasing asset volumes coming to
markets with the major drivers of demand being the following:               market and rises in offshore and domestic interest for industrial
•    The infrastructure boom (New South Wales, Victoria, and                (including secondary assets), and a relatively constrained supply
     Queensland will see a record $150 billion of combined                  pipeline to 2020, it is anticipated there will be further cap rate
     infrastructure investment over the next four years)                    compression over 2017, particularly for secondary grade stock
                                                                            within the Sydney and Melbourne markets.
•    Precincts well serviced by connecting road transport routes

                                                                         Industrial | Research & Forecast Report | First Half 2017                                                                                                    5
Research &
Forecast Report

SYDNEY
Industrial | First Half 2017

By Sass J-Baleh                                                           per cent lower than the Sydney average, and prime grade net
Manager | Research                                                        face rents are at $123/sqm 15 per cent lower than the Sydney
sass.jbaleh@colliers.com                                                  average (as at Q4 2016)
                                                                      •   Availability of large sites
                                                                      •   Availability of custom built facilities to meet modern industry
    MARKET HIGHLIGHTS
                                                                          requirements, as well as purpose built infrastructure to
    Western market well-aligned to benefit from a number of               accommodate large heavy vehicles.
    planned infrastructure, in turn, driving growth in land values    The driving force to relocate to these locations, and take
    and net face rents over the short to medium run                   advantage of the above benefits, has been the state government’s
                                                                      planning strategy. The NSW state’s strategy is outlined in ‘A
    Urban regeneration will continue to drive land value growth       Plan for Growing Sydney’, which provides a framework for land
    rates and net face rents for Inner Sydney markets                 use over the next 20 years and puts forward a strategy for
                                                                      accommodating Sydney’s growth - as supported by the NSW Long
    Portfolio transactions are expected to continue in 2017 and       Term Transport Master Plan. The Plan supports the take-up of
    increasing for private sellers                                    industrial land in outer Sydney locations by identifying:

                                                                      •   Future industrial infrastructure (e.g. intermodal terminals),
    The majority of industrial development to be delivered over the
                                                                          and transport infrastructure links (e.g. the investment of
    next four years will be concentrated in the western markets –
                                                                          $3.6 billion under Western Sydney’s Infrastructure Plan) –
    an indicator of ‘supply-led demand’
                                                                          connecting the Outer Sydney sub markets to middle and inner
                                                                          areas

Overview                                                              •   Urban renewal corridors (providing increased housing,
                                                                          social infrastructure, and residential amenities) – clustered
The broad trends being observed within Metropolitan Sydney                within inner Sydney and stretching along train lines and
– amplified over the past two years – has been the shift in               within ‘Priority Precincts’ and investigation areas (such as
preference for industrial users (particularly those large users           Wentworth Point, Castle Hill, Bella Vista, and Macquarie Park)
within the manufacturing and logistics industry sectors) to locate    •   Western Sydney Employment Area (WSEA) growing
further west of Sydney, and the urban renewal of industrial zoned         importance in the future, as supported by the South West
land in pockets of inner and middle ring areas. There has been,           and North West growth centres. The growth centres are
and will continue to be, increasing demand to regenerate sites            areas planned for greenfield housing supply, thus supporting
through mixed use developments. Recent urban renewal projects             population and access to a greater pool of workers.
include Mascot Central, Green Square Town Centre, Clemton Park
Village at Campsie, and East Village at Zetland.
                                                                      Sub markets
The movement of operations toward western industrial precincts
(i.e. Outer West, South West, and North West sub markets) allows      West
these users to reap the benefits of the following:                    The Western market, comprising the Inner, Central, North West,
•     Relatively cheaper land values and net face rents - average     South West, and Outer West sub markets, will benefit from the
      land values in the west are currently at $435/sqm around 40     large investments being made in transport infrastructure. The

6
positive spillover effects from infrastructure investment is already Land Value by Market (Historic and Forecast)
being observed, with growth rate spikes in land values and net Western Market Average Western Market Average Forecast
North North Forecast
face rents from the time projects’ have been announced to the South South Forecast
construction phase. $3,000
Sydney Average Sydney Average Forecast
Land Value ($/m²)
The annual growth rates recorded in 2016 showed a continued $2,500
$2,000
upward trend in land values averaging 6.7 per cent (YoY), driven
$1,500
by the Outer West sub market. Strong growth rates in land values
$1,000
for the Outer West region is expected to continue in the medium
$500
to long-run as a number of other planned transport infrastructure
$0
projects’ construction phases begins and near completion,
Mar-10
Mar-13
Mar-16
Sep-11
Sep-14
Sep-17
Sep-05
Mar-07
Sep-08
Sep-18
ultimately connecting this area to the rest of Sydney.
Source: Colliers Edge
The following major projects will unlock new precincts, and
directly affect the demand for industrial stock in the Western West Market Land Values
markets, in turn driving strong growth in land values and net face Land Value $/sqm Annual Growth Rate (YoY) Forecasted Annual Growth (2017 to 2022)
$500 20%
rents over the next three years: $450 18%
$400 16%
• Westconnex
Annual Growth Rate (%)
$350 14%
Land Value ($/m²)
$300 12%
• Northconnex - increasing accessibility to areas such as Seven $250
$200
10%
8%
Hills, Blacktown and precincts along the M1 Pacific Highway $150 6%
$100 4%
• Sydney Metro Northwest $50
$0
2%
0%
South West Outer West Central West Inner West North West
• Northern Road Upgrade
• Moorebank Intermodal Terminal Source: Colliers Edge
• M12 Motorway.
Sydney Average Net Face Rents by Asset Class
The increases in land values have also been due to the limited (Historic and Forecast)
supply of stock, accelerated by rezonings (i.e. ‘withdrawals’) Prime Grade Secondary Grade Prime Grade Forecast Secondary Grade Forecast
250
within the Inner West market. Enquiries have risen for areas
within close proximity to the Parramatta Road corridor, 200
encompassing suburbs such as Rosehill and Auburn, which 150
Rent ($/m²)
benefit from public rail transport connections and have greater 100
prospect of being rezoned to accommodate residential uses in the 50
short to medium term. The Parramatta Road Corridor is currently
0
under planning for urban renewal, with development assessments
Sep-20
Mar-10
Mar-19
Sep-21
Sep-22
Mar-11
Mar-12
Mar-13
Mar-14
Sep-13
Mar-17
Mar-18
Mar-05
Sep-14
Mar-15
Sep-15
Mar-16
Sep-16
Sep-17
Sep-18
Sep-19
Mar-06
Mar-07
Mar-08
Mar-09
Sep-09
Sep-10
Sep-11
Sep-12
Mar-20
Mar-21
Mar-22
Sep-05
Sep-06
Sep-07
Sep-08
and construction commencing in 2018.
Source: Colliers Edge
Against a backdrop of limited assets available on the market and
diminishing serviced land supply, investors are actively pursuing Share of Development Supply (Floorspace) Delivered,
opportunities in order to position themselves in the West market. by market, between 2017 and 2020
The most recent investment sale made by Logos in February West North South South West
2017 for $161 million of a 21 ha site in Minchinbury (tenanted
by Woolworths) at a yield of 8.6 per cent. Investors are also 23%
increasingly moving up the risk curve by pursuing acquisitions of
vacant properties. A recent example of this is Mirvac’s purchase
of a 20,389sqm building in Padstow for $30.2 million.
13% 61%
Competition between private land owners and established
developers to attract tenants have increased significantly;
4%
particularly against the backdrop of rising demand for space from
industrial users seeking to relocate from inner Sydney Markets, as Source: Colliers Edge
well as the North, South and Inner West sub markets. Incentives
have risen significantly from between eight and 10 per cent to
Industrial | Research & Forecast Report | First Half 2017 7
between 15 and 20 per cent. Industrial tenants are however South
favouring lower face rents rather than higher incentives and, as a
State planning frameworks have been directly impacting the
result, some have begun to turn to private land owners.
south market, with industrial rezonings to allow for residential
The majority (around 60 per cent, or 784,000sqm) of Sydney’s development, Westconnex, and Sydney Metro planning. The south
industrial development is expected to be delivered in the western market continues to be a very tight market as low vacancies and
markets over 2017 to 2020 due to: strong demand from a mix of owner occupiers and developers
1. The growth of institutional portfolios via development on land (privates and institutions) have driven land and capital values
acquisitions, in order to gain managements revenues. Recent up to record growth rates (19.4 per cent average growth in land
portfolio sales include Goodman’s assets to Blackstone (six values over 2016). As a result, investment yields have tightened
assets in NSW with a combined sale price of $239 million), significantly – to a point where they are now the lowest relative to
and the JP Morgan portfolio which sold to AMP (comprising all other sub markets for both prime and secondary grade stock
of six assets in NSW for $250 million). Portfolio transactions (at 5.5 per cent and 6.5 per cent, respectively).
are expected to continue in 2017 and increasing for private Positive growth rates in land values and net face rents (sub 5,000
sellers sqm) are expected to remain over the medium to long-run, as
2. Tenant demand rising for pre-lease space where tenants are stimulated by:
more likely to move their industrial operations rather than • The ‘New M5’ a $4.3 billion transport infrastructure project
renew leases in order to increase supply chain efficiencies. with an expected to reach completion in 2020
For example, sites that have the following features offer
• Development of Green Square Town Centre, encouraging
opportunities for increasing efficiency:
residential and mixed use development applications for
• Larger cubic capacity the wider area as well as boosting worker and residential
• Suitability in accommodating automotive technology amenities
• Close proximity to industrial infrastructure Recent sales confirm the demand for stock in the South sub
• Easy movement of large freight vehicles in and out of sites market is driven by scope for mixed use developments, such as
that have and are surrounded by B-double access routes the sale of 1037-1047 Bourke Street in Waterloo ($30 million) with
approval for a mixed use development, and the acquisition of ‘The
Supply chain costs are greater than rental costs, and therefore
Mill’ by Dexus ($110 million) a mixed use property located at 41-43
sites that are more space efficient will boost profit margins for
Bourke Road, Alexandria.
many industrial users.
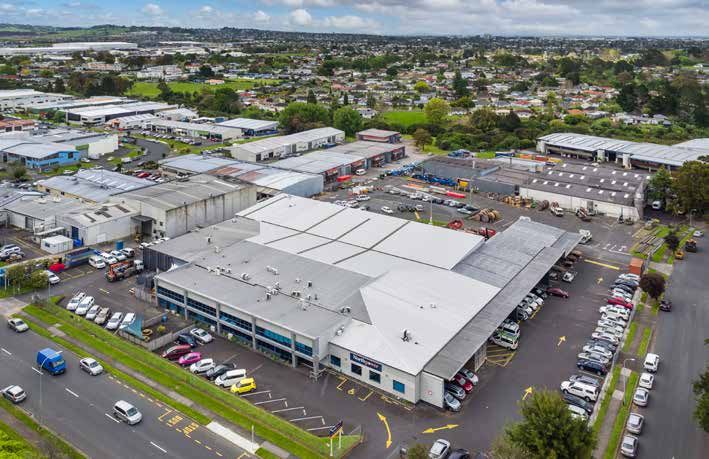
60 Wallgrove Road, Eastern Creek
Leased on behalf of Mirvac
8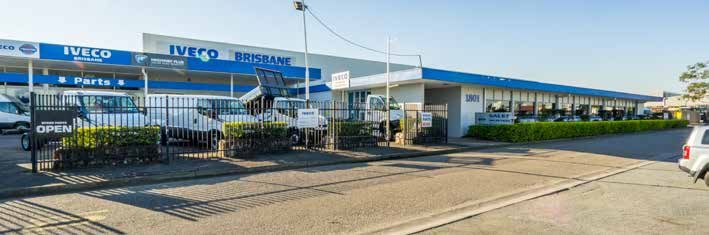
3-5 West Street, Pymble
Sold on behalf of Stineburg

Despite the fact that Sydney’s major transport gateways are               North
located in the South market, i.e. Sydney Airport and Port Botany,
                                                                          Similar factors that are present in the South market are also
a number of large industrial users who are not dependent on this
                                                                          effecting the North market. This includes limited stock availability
infrastructure (unlike users such as TOLL, DHL, and Mainfreight)
                                                                          (particularly large sites), the emergence of creative type industrial
are increasingly seeking properties further south in areas such as
                                                                          businesses (e.g. within the design and IT industry sectors), and
Taren Point / Caringbah) and west. Enquiries to relocate within
                                                                          developers and owner occupiers land banking for the purpose of
the South West market in particular have risen, as premium prices
                                                                          future rezoning to allow for residential dwellings. Stock scarcity
and short term leases for large sites in the South market are not
                                                                          coupled with continued demand from businesses has led to
optimal for business operations.
                                                                          further rises in land values (+4.2 per cent YoY, currently averaging
The majority of recent industrial developments in the South               $1,250/sqm) and prime grade net face rents (+17.6 per cent YoY,
market have been multi-story industrial units (so as to maximize          currently at $218/sqm). Growth in land values and rents are
floorspace ratios and market values) particularly within precincts        expected to continue over the next few years due to the lack of
of Alexandria and Botany. There has been strong take-up                   serviced land, low levels of new developments (a projected share
for these smaller industrial units, encompassing co-located               of only four per cent of Sydney’s total development supply pipeline
warehouse and ancillary office space, with demand from a mix              over 2017 to 2020), and the near completion of the Northconnex.
of users, and increasingly from creative users (e.g. IT, media,
                                                                          The shift of industrial users to the western markets is a trend
and retail sectors) that have relocated from city locations (such
                                                                          impacting the North market, with the movement of medium to
as Surry Hills, Piermont, and the CBD) due to rental premiums.
                                                                          large scale users (particularly manufacturing and logistic type
Alexandria is well-positioned to continue in attracting creative,
                                                                          businesses). It is expected that over the next couple of years there
white-collar type industrial users due to recently established
                                                                          will be more tenant movements from the North to locations within
worker amenities (e.g. food retail and public transport connection),
                                                                          the western markets as the scarcity of large stock with long term
as well as proximity to the CBD. It is expected that demand from
                                                                          leases rises will increase the viability of operations in precincts
white-collar industrial businesses for this area will continue.
                                                                          within the North West market.

                                                                       Industrial | Research & Forecast Report | First Half 2017             9
Research &
Forecast Report

MELBOURNE
Industrial | First Half 2017

By Sass J-Baleh                     Kate Gray                             >    Construction of an elevated road along Footscray Road
Manager | Research                  Associate Director | Research              with direct links the Port of Melbourne
sass.jbaleh@colliers.com            kate.gray@colliers.com                > Construction to improve access to Webb Dock from the
                                                                               freeway network
                                                                      •   CityLink Tulla Widening ($1.3 billion) – completion in 2018 –
    MARKET HIGHLIGHTS
                                                                          includes the upgrading of CityLink from Melbourne Airport
    Strong investments in transport infrastructure projects that          to Power Street (24km), which will increase capacity and
    are currently under construction, particularly benefiting the         reduce travel times.
    West, North, and South-East markets                               Transport infrastructure projects, coupled with a favourable
                                                                      economic climate (i.e. record low interest rates and strong annual
    Continuation of strong investment sale volumes, with the          projected population growth rate to 2031 of around 2.2 per
    majority of the activity concentrated in the West sub market,     cent), has led to a number of large investment sales. Over the
    followed by the South East sub market                             past 12 months Victoria recorded around $1.6 billion in industrial
                                                                      sales above $15 million (representing around 35 per cent of total
                                                                      national sales), well above the five-year average of $1.04 billion.
    Scope for further yield compression is expected over the next
    12 months, supported by continued capital inflow and limited      Recent investment sales include Challenger’s 3.6 hectare site
    stock with zoned industrial shrinking at a rapid rate             in December 2016, tenanted by Spotlight, located at 217-225
                                                                      Boundary Road, Laverton North (West sub market) for $22 million
    Large proportion of tenant demand has been from expansion         at 7.2 per cent yield and 4.5 year WALE.
    requirements and new market entrants                              A high proportion of investment sales formed part of larger
                                                                      portfolio sales during 2016, including the sale of Goodman’s
    Significant take up of existing vacancy with over 400,000 sqm     portfolio comprising 15 national assets (16 assets located in
    absorbed in 2016.                                                 Victoria) for a combined $285 million). The recent sale of
                                                                      Growthpoint’s portfolio to Mapletree for $142 million in December
                                                                      2016 consisting of three metropolitan assets and one regional
Overview                                                              asset (Wodonga) and reflected an initial yield of 8.4 per cent and
                                                                      6.4 year WALE.
Melbourne’s industrial market has continued to remain active, as
supported by the following major transport infrastructure projects    Over 2017 we anticipate there to be continued solid capital
– improving connections to existing major transport gateways -        inflow from offshore investors as well as strong local investment
that are currently under construction:                                volumes, which is expected to drive yield compression across
                                                                      both prime and secondary asset classes. Particularly against
•     The Western Distributor ($5.5 billion) – completion scheduled
                                                                      the backdrop of limited stock availability and rapidly decreasing
      for 2022 – includes the Monash Freeway Upgrade and Webb
                                                                      industrial zoned land.
      Dock Upgrades, which will improve the movement of freight
                                                                      Large industrial developments (particularly those that meet the
      through inner west streets to the Port. Key features:
                                                                      needs of large scale warehousing operations) have been driven
      >   Widening of the West Gate Freeway between M80 and
                                                                      by pre-lease commitments, with the majority of projects in the
          Williamstown Road
                                                                      development pipeline expected to be delivered in the North sub
      >   A tunnel under Yarraville, connecting the West Gate
                                                                      market (60 per cent) - the remainder equally shared in the West
          Freeway to Footscray Road
                                                                      and East/South East sub markets.

10
The Merrifield Business Park project is driving the supply pipeline VIC Sales 2007 to 2016 (AUD million)
in the North, currently in early planning stages, and is expected
Quarterly Volume ($) Rolling 12-month Total Five-year Average
to deliver around 400,000sqm of industrial space. Merrifield $1,800
is a new estate which will unlock industrial zoned land in the $1,600
Total Sales (AUD million)
$1,400
North, as there is currently limited industrial zoned land available
$1,200
in the North. Merrifield is underpinned by the $100M Dulux $1,000
development. Industrial users in this area will benefit from the $800
$600
further development of Austrak’s intermodal freight hub.
$400
$200
A total of 946,450sqm of industrial space is expected to be
$0
delivered over 2017 to 2020, which is below the 10 year annual Q1 2007 Q1 2008 Q1 2009 Q1 2010 Q1 2011 Q1 2012 Q1 2013 Q1 2014 Q1 2015 Q1 2016
average of 502,490sqm. Although there is forecast to be strong
Source: Colliers Edge
development activity in 2018, when most of the development in the
pipeline is expected to be delivered, a large proportion of this is in Melbourne Industrial Supply Pipeline
early stages of development. The East / South East sub market
Complete Under Construction
currently has the largest committed supply pipeline, i.e. ‘under DA Approved Development Application Stage
construction’ (96,077sqm). Contract let Deferred
Early Stages Historic Ten-Year Average
1,000,000
Sub markets 800,000
Floorspace (m²)
600,000
City Fringe 400,000
200,000
The City Fringe market which has around 60 per cent of the 0
2007 2008 2009 2010 2011 2012 2013 2014 2015 2016 2017F 2018F 2019F 2020F
current stock in the Fisherman’s bend precinct continues to be a
very tight market due to the large take-up of land over the past Source: Colliers Edge
few years. This area has been earmarked by the state government
as one of the largest urban renewal projects in Australia. Most of Share of Supply Delivered Between 2017 and 2020
the sites in Fisherman’s bend have been rezoned to higher density
19%
residential with a fifth of the precinct set aside as employment
lands. Over the medium term the industrial use sites in the
precinct will shrink and move towards lighter industrial uses with
education and defence key target tenant types over the medium
term. With significant withdrawals of industrial land for residential
21% 60%
which will result in tighter vacancy with forecasts suggest that
demand is likely to remain strong which will drive both growth in
land values and rents into the medium term. Further investments
in infrastructure in the precinct is expected as well the supporting North West East and South East
transport node of the Port of Melbourne. Current industrial users Source: Colliers Edge
in this precinct are likely to relocate to other industrial precincts
with the most likely precinct being the West. Land values have Melbourne Average Net Face Rents by Asset Class
risen by around 18 per cent in the past 6 months, and yields
further compressing to approximately 6.5 per cent for prime and
Prime Grade Secondary Grade
$120
secondary assets. $100
$80
North
Rent ($/m²)
$60
The North sub market is attractive to industrial users due to well- $40
connected existing transport infrastructure, this includes the Hume $20
Highway – a freight transport corridor connecting the Sydney and $0
Nov-05
Nov-06
Nov-07
Nov-08
Nov-09
Mar-10
Mar-11
Mar-12
Mar-13
Mar-14
Mar-15
Mar-16
Mar-05
Mar-06
Mar-07
Mar-08
Mar-09
Jul-10
Jul-11
Jul-12
Nov-11
Jul-13
Jul-14
Jul-15
Nov-15
Jul-16
Nov-16
Jul-05
Jul-06
Jul-07
Jul-08
Jul-09
Nov-10
Nov-12
Nov-13
Nov-14
Melbourne markets, immediate access to major arterial roads,
close proximity / access to existing transport gateways (i.e.
Source: Colliers Edge
Melbourne Airport and links to the Port of Melbourne). Transport
connections to industrial precincts within this sub market
Industrial | Research & Forecast Report | First Half 2017 11will continue to drive tenant growth, particularly with current • The availability of large land parcels
construction of the CityLink Tulla Widening project, road upgrades, • Large supply of land that is undeveloped and allows for
and new intermodal freight hub In Somerton, operated by DP custom built facilities to meet modern industry requirements
World Australia.
• Relatively cheaper land values and net face rents - land
Rental growth in this sub market has accelerated with prime net values in the west are currently around 30 per cent lower
face rents growing by 9.7 per cent and secondary rents by 42 per than the Melbourne average at $200/sqm, and prime grade
cent. This is combined with falling incentives which has seen net face rents are 25 per cent lower than the Melbourne
strong net effective rental growth over the last 12 months. There average at $80/sqm.
has been growing tenant demand, particularly from food logistics
Investment sales (greater than $5 million) over the last 12 months
and packaging tenants.
in the West submarket have totalled around $900 million, which
Land values have risen over the year by 3.9 per cent to $268/ accounts for just in excess of 50 per cent of all investment
sqm, above the 10-year annual average growth rate of 2.2 per transactions in Victoria. This includes the sale of 16 assets as
cent. Supply constraints of serviced land and less development part of Goodman’s portfolios. The most recent sale (February
opportunities is expected to drive growth in land value over the 2017) in the West sub market was an off-market transaction
next two years and, in turn, increasing the scope for further yield for a property located on 18 Foxley Court, Derrimut, which sold
compressions. to PrimeWest on a fund-through basis for $23.8 million. The
property was subject to a 3 year Rental Support Deed.
West
Increases in residential development projects within the City South East and Outer East
Fringe due to industrial rezonings has resulted in shifting Industrial zoned land supply within the South East and Outer East
preferences for industrial operations – mainly toward the West market is relatively constrained, particularly for greenfield sites in
sub market. There is the looming closure of the Toyota plant the Outer East. This has led to occupiers and developers seeking
which has announced a closure date of in October 2017. This sites within core South Eastern areas, such as Dandenong South.
will see manufacturing ceasing on 3 October in the Altona plant. Land values have grown by 8.9 per cent in the South East and 7.1
There are two known car component suppliers, Toyota Tsusho and per cent in the Outer East over the last 12 months. Land values in
Denso which are expected to close at the same time. As part of the South East and Outer East sub markets continue to record the
the Toyota announcement the head office for Australia will remain highest levels relative to other Melbourne sub markets - currently
in Port Melbourne, with the Altona site expected to be retained by at $305/sqm and $375/sqm, respectively.
Toyota for new functions.
Net face rental growth has remained across both precincts with
The increasing demand for space in the West market has prime grade growing by 7.6 per cent in the outer east and 4.5
translated to large increases in serviced land values (increasing percent in the South east. The outer east has seen incentives also
by 25 per cent over 2016). Net face rents have also increased fall below 10 per cent which is the lowest incentive market in all of
prime and secondary grade assets (rising by seven per cent and the Melbourne industrial markets. Recent sales within Dandenong
40 per cent, respectively) and, coupled with falling incentives, South includes, Goodman’s 9 hectare site at Hampton Park (part
has resulted in strong net effective rental growth. Growth in of Goodman’s $640 million portfolio sale), Goodman’s Power Park
land values and rents are expected to continue over the short to Estate – a logistics facility on a 3 hectare site which is under
medium-run as the following locational attributes will continue to development and due for completion in early 2017 - purchased by
drive demand for industrial space in the West: Ascendas, and a 2 hectare site located at 47-63 Remington Drive,
sold to PrimeWest.
1 West Park Drive, Derrimut
Leased on behalf of Frasers Property
12Research &
Forecast Report
BRISBANE
Industrial | First Half 2017
By Helen Swanson 7.95 per cent to 8.6 per cent. As a result of limited availability of
Manager | Research prime grade stock, stronger demand for riskier assets is starting
helen.swanson@colliers.com to become a common trend amongst investors. The result has
seen secondary grade yields tighten 25 basis points over the last
six months to March 2017. Despite this, the differential between
MARKET HIGHLIGHTS
prime and secondary grade yields remains at an historical
Fierce competition for prime grade investment stock sees high of 155 basis points. Looking forward, we anticipate some
further compression of yields across all Brisbane industrial further yield compression over the next six months particularly
precincts for high end quality stock. At the top end of the secondary grade
market, yields are expected to compress as the tightness of
supply of prime grade stock will lead investors to seek alternative
Anecdotal evidence suggests increased enquiry from
opportunities.
corporate tenants for large scale warehousing space
leading into 2017 Owner occupier activity in 2016 remained below the long term
historical average however there was a slight improvement in
the second half of 2016 when compared to 2015. The major
Limited availability of prime grade stock likely to see
factor which could hinder further positive movements in 2017
investors creeping up the risk curve ladder to seek
is if incentives increase further and secondary face rents fall,
secondary grade investment stock
which could have an impact when occupiers weigh up the cost of
occupancy. If however finance conditions and incentives remain
Overview unchanged groups may look to upgrade from secondary grade
facilities into modern premises and or relocate to refurbished and
Urgency has returned to the Brisbane industrial leasing market as or value added property.
options for occupiers become constrained as enquiry increases
In contrast to a strong investment market, the industrial leasing
and the supply pipeline slows. As investors continue to move up
market although improving still remains relatively flat. On a
the risk curve, the spread between prime and secondary assets is
positive note there has however been some uplift in activity
expected to narrow, opening opportunities for investors to recycle
led mostly by large scale tenants who took advantage of higher
capital. Industrial sales (>$5 million) totalled $322.3 million for the
incentives particularly in the northern and southern precincts
six months to December 2016. This was 28 per cent less than
as developers aimed to secure pre-commitments for their
that transacted for the six months to June 2016 at $445.8 million.
developments. Looking forward, evidence points to further
Investment sales increased sharply with institutions accounting
enquiry this year from corporate tenants looking for large scale
for almost 75 per cent of the dollar sales volume and driving the
warehousing space.
market direction.
Average prime grade net face rents across Brisbane range from
Demand has been particularly strong for prime grade stock which
$104/sqm in the South West to $115/sqm in the ATC. Prime
possess stabilised income flows. On average Brisbane prime
grade net face rents have remained relatively flat over the past
grade yields are currently achieving between 6.25 per cent and
12 months whilst incentives have increased to sit on average at
7.25 per cent. Fierce competition from investors and limited
15.7 per cent for prime grade product. Looking forward, future
availability of this stock has seen yields tighten 100 basis points
rental movement will depend upon economic conditions, business
over the 12 months to March 2017. Secondary grade yields across
confidence and the future supply of both vacant land and built
the greater Brisbane industrial market as at March 2017 sat at
product.
Industrial | Research & Forecast Report | First Half 2017 13Australian Trade Coast Brisbane yield spread
Incentive Prime Net Face Rent Prime Net Effective Rent
Industrial rents remained steady following a robust level of leasing $160 18.0%
$140 16.0%
activity which occurred during the second half of 2016. Prime 14.0%
$120
grade rents in the ATC currently command between $112/sqm $100
12.0%
and $120/sqm. Demand over the period stemmed from a broad $80
10.0%
8.0%
base of tenants including transport and logistics, retailing and $60
6.0%
manufacturing. Several large and medium scale users across a $40
4.0%
$20 2.0%
variety of industry sectors took space including:
$0 0.0%
• Agility Project Logistics 5,930sqm at Pinkenba
• Deluxe Freight 6,329sqm at the Port of Brisbane Source: Colliers Edge
• BevChain 30,000sqm at Eagle Farm
• ARC 13,371sqm at Eagle Farm 41 Borthwick Avenue, Murarrie located in the Metroplex complex
also sold to a private investor for $4.9 million with a new 10 year
• Smiths Snack foods sub lease of 12,108sqm at the Port of
lease in place to multinational tenant bioMerieux. 41-47 Alexandra
Brisbane
Pl, Murarrie featuring a 6,185sqm warehouse facility siting on a
• JR / Duty Free 2,130sqm at the Brisbane Airport
13,000sqm site, was just one of the properties in the precinct
Goodman have delivered a 30,200sqm speculative development at to sell above $10 million last year. The property was purchased
96-104 Export Street, Lytton and leased 10,000sqm to MRC and by a private syndicate and reflected a passing initial yield of
Deliver Group. Also anticipated for completion by the end of 2017 7.5 per cent with a WALE of 2.31 years. Given the proximity to
is BevChain’s pre-commitment to a new facility of 35,717sqm to the Port and Airport the ATC continues to demand the tightest
be located at 40 and 60 Charles Ulm Pl, Eagle Farm. BevChain yields across greater Brisbane. Prime grade yields in Brisbane’s
has consolidated its premises from a variety of smaller properties ATC as at December 2016 sat on average at 6.68 per cent and
throughout the area. Thereafter, Dexus hold 141 Anton Rd, have tightened 100 basis points in the past 12 months. Further
Hemmant, a 12 hectare development site located in the ATC. The compression of prime grade assets in the ATC is anticipated as
strategically located property has the capacity to provide high investors compete fiercely for limited stock of quality industrial
quality office and warehouse facilities ranging from 11,000sqm to assets.
60,000sqm.
Take up of industrial land is anticipated to pick up over 2017 as
Investors continue to have a strong appetite for warehouse business sentiment gradually improves. On average serviced
facilities offering stabilised income flows within close proximity to land in the ATC appreciated 10.3 per cent over the last year with
major arterial roads and highways. The majority of transactions allotments sized 2,000sqm to 5,000sqm ranging from $300/sqm
in the precinct were for industrial properties priced sub $10 to $500/sqm. Given limited supply of available industrial parcels
million. In the over $4 million category, 39 Harvey St, Eagle Farm in the area and the reluctance by corporates to offload their land
was purchased by a private investor for $5.1 million and was sold banks price growth of serviced industrial land is anticipated to
with the balance of seven year lease in place to Miele. Similarly, continue over the coming year.
1801 Ipswich Road, Rocklea
Sold on behalf of a private client
14Brisbane North and owner occupiers and tenants looking to upgrade their facilities
to more modern premises. Driving this trend was the generous
Outer North incentives on offer. Brisbane’s south was the most active precinct
for occupiers looking for modern design and construct and or
Industrial allotments across greater Brisbane can range from
speculatively built premises over the second half of 2016. This
$280/sqm to $500/sqm whereas choices in the outer north
included and is not limited to leasing deals such as the following:
currently are positioned at a very affordable rate of circa $200sqm
to $300/sqm for an allotment. This differential in pricing may • Ashai Beverages / Schweppes facility at Heathwood for
provide a fair incentive for companies to consider relocating to this 18,788sqm
emerging industrial precinct. • Avery Dennison pre-committing to 4,986sqm at Berrinba
Over the last decade, Brendale, 20km north of Brisbane has • National Tiles pre-committing to 13,159sqm at Berrinba
established a reputation as a prime industrial location with • Franklyn Blinds pre-committing to 8,042sqm at Rochedale
excellent infrastructure access and opportunities. The suburb • Super Amart pre-committing to 50,240sqm at Rochedale
enjoys good access to major export infrastructure such as the
Bruce Highway, the Gateway Motorway and Gympie Road. Additionally, Colliers International enquiry database currently
Net face rents for quality A grade warehouses 2,000sqm plus shows a good level of enquiry from tenants for industrial
at present range from $90-$120/sqm. Surrounding retail, properties positioned in the southern end of the precinct near the
commercial and residential development is helping to support an Logan Motorway and also at the northern end of the precinct near
emerging and vibrant industrial precinct. The success of the area the Acacia Ridge Rail Yards. Limited availability of stock in this
has been evident in the number of major local and international area along with limited land opportunities for large scale facilities
companies moving in, such as Aldi, Costco, Target and Bunnings. will place further pressure on yields for industrial property in
Recent activity in the suburb for industrial space and or land/ this location over the coming year. Colliers International is aware
englobo includes: of several major owner occupier group’s actively seeking prime
grade industrial property and or land opportunities within this
• Kennard Hire at 10/133 South Pine Rd
precinct.
• Private Developer at 87 Cutler Cres
A significant recent transaction which took place in Brisbane’s
• Private Developer at Lot 7 Bailey Crt
south in early 2017 was the national Rand portfolio which was
• Couriers Please at Bailey Crt sold by Propertylink to Deutsche Asset Management in early
2017. The recently listed Propertylink sold two logistic facilities
Brisbane South West one in Victoria and the other at 60-80 Southlink St, Parkinson.
The Southlink property sold for $37.1 million and comprises a
A Goodman speculative development located at 62 Monash Road,
refrigerated logistics facility, 8,413sqm on a site of 30,574sqm
Redbank is now fully leased with Zenexus taking the final balance
with 9.8 year WALE remaining in place to tenant Rand Transport.
of 8,990sqm of the total 15,000sqm circa facility. Zenexus joins
DB Schenker, Northline and TNT in Goodman’s Redbank Motorway
Estate. Given that the estate has direct toll free access to the
Ipswich Motorway, makes it a popular choice for a variety of Yatala Enterprise Area
tenants particularly those operating in the transport and logistics (YEA)
sector.
Beaulieu Carpets, one of Australia’s largest carpet manufacturers
There is currently limited stock of A grade quality warehouses in
has secured new headquarters at Fraser’s Property’s Yatala
the south west corridor for both tenants and owner occupiers.
Central development. Beaulieu Australia will be moving from
This includes both limited supply of existing and speculatively
their original 12,000sqm office / warehouse at Ormeau to a
built stock. This may provide opportunity for developers to enter
new 23,051sqm office warehouse at 146 Pearson Road, Yatala.
the market and fill this gap. Rental growth rates for A grade
Beaulieu signed a 15 year lease on the building. Other recent
warehouses have been flat for a few years in this corridor but
residents to the estate include O-I Glass. Driving the relocation
given the limited stock we anticipate that there may be some uplift
was an agenda to improve cost efficiencies. Frasers Property has
in the coming year.
developed over 17 hectare at Yatala Central and has started civil
construction on the remaining 22 hectare which will be released
Brisbane South to the market mid-2017.
After a relatively slow leasing year throughout 2015 and the
first quarter of 2016, the latter half of 2016 saw a number of
Industrial | Research & Forecast Report | First Half 2017 15Research &
Forecast Report
ADELAIDE
Industrial | First Half 2017
By Kate Gray interest as a result. Portfolio sales have been a key feature of the
Associate Director | Research Adelaide industrial landscape with two of the major sales seen
kate.gray@colliers.com in 2016 a result of a portfolio buy out. These two buy outs have
seen Blackstone and Property link purchase assets in Adelaide.
There was limited changes in rents over this half, but we have
MARKET HIGHLIGHTS
seen a trend that stock originally offered to the leasing market is
Vacancy falls in all industrial submarkets converting to sales stock. This is a result of owners capitalising on
the capital growth which has occurred in the Adelaide market.
Investment activity strong in the second half and expected to
continue into first half of 2017
Industrial vacancy falls
Lack of supply is likely to lead to further construction activity
Vacancy has fallen in the last six months to 3.1 per cent down
from 4.8 per cent in September 2016. This fall is mostly due to
the tightening in the Inner North and Outer North markets. In
Investment Activity remains particular the Outer North market has seen the vacancy tighten to
1.5 per cent, which is much tighter than the peak of 19.9 percent
strong in September 2015. This is the market where Holden is located
and given current performance the effects of this closure have
Investment activity in the Adelaide industrial market has remained
largely been felt with most of the suppliers to the Holden plant
strong with a pipeline of settlements during the first half expected
having made plans to either exit or diversify into other markets
to see this trend continue into 2017. During the last quarter of
and therefore retain thier current accomodation. The closure
2016 we saw several large transactions complete with the buyer
will see this supply likely to be withdrawn, but there has been no
pool in the Adelaide market increasing. In particular an increase in
announcement as to the intentions for this site post closure.
interest for institutional grade investment. This has seen the buyer
pool for this asset class strengthen with a range of investors There have been two recent announcements which will see
both institutional grade and private investors in the market. They Caroma (on Magill Road at Norwood) and Coca Cola bottling plant
have turned their attention to the Adelaide market over the last at Thebarton close. Both of these sites are in the inner rim of the
six months as Melbourne and Sydney industrial markets have CBD. The Caroma site is owned by Renewal SA which are seeking
seen yields tighten more rapidly. The Adelaide market has not expressions of interest from developers, although rezoning is
seen as rapid trend and therefore is still offering higher returns required, it is expected to yield around 300 dwellings. Coca Cola is
for industrial assets. The current quarterly yield data shows only a recent announcement and the plant is not expected to close
limited evidence of tightening yields with the lower inner industrial until 2019. There has been several rezonings to residential use in
markets still around seven per cent. However it is expected that close proximity and it is likely that this would be the highest and
there will be further evidence in the coming half which will see best use for this site. At the time of writing we are unsure of the
yields fall below this level. fate of the Holden site, so at this stage it will be withdrawn from
the stock in the outer North market. This may change as we get
There is a significant weight of capital in the market looking
closer to the closure date, but this property will have a significant
for a home and the Adelaide market is seeing a resurgence of
impact on vacancy if it is included in total stock.
16Leasing markets have remained stable with enquiry improving
in the second half of 2016. The tenant groups which are driving Adelaide Industrial Vacancy
demand are manufacturing and retail trade. More specifically
South
the manufacturing sector which is growing is high tech
manufacturing, rather than the more traditional medium to heavy West
manufacturing. Retail trade being mostly the logistics sector which
supports retail trade. Most of the take up over the last six months
Inner North
has been with shorter term leasing for logistics. Outer North
New supply is expected to increase during 2017, with above
Total Market
average supply additions expected in the year. This is expected
to continue into 2018 due to the lack of space available. We are 0.0% 1.0% 2.0% 3.0% 4.0% 5.0% 6.0% 7.0%
Feb-17 Sep-16 Mar-16
seeing larger requirements in the Adelaide market, which are
Source: Colliers Edge
unable to be met with the current stock on the market. This is
likely to lead to a much stronger pipeline over the next two years, Adelaide Industrial New Supply Additions by Submarket
and we expect design and construction activity to continue to Outer North Inner North West South
strengthen through 2017. 200,000
150,000
Floorspace (m²)
100,000
50,000
0
2007 2008 2009 2010 2011 2012 2013 2014 2015 2016 2017F 2018F
Source: Colliers Edge
219-225 Marion Road, Marleston
Leased on behalf of 264 Richmond Rd Pty Ltd
Industrial | Research & Forecast Report | First Half 2017 17Research &
Forecast Report
PERTH
Industrial | First Half 2017
By Quyen Quach Much of the vacant stock (59.1 per cent) currently on the market
Senior Research Analyst | Research is Secondary grade stock. However, we are also seeing cases of
quyen.quach@colliers.com Prime space coming on to the market, and remaining vacant for
an extended period, as demand remains subdued. This has driven
Prime rents 13.5 per cent lower over the past year to December
MARKET HIGHLIGHTS
2016.
Vacancy higher, but looks to be stabilising Vacancy in larger buildings, particularly those over 10,000sqm
- which traditionally experience lower levels of vacancy - have
Supply forecast to fall further declined to 6.7 per cent from 7.2 per cent in July 2016. Whilst
smaller warehouse stock, sub 5,000sqm, is experiencing a 15.4
per cent vacancy across the Perth Metro area.
Yields to remain tight for Prime assets
The Kewdale/Welshpool precinct had the greatest amount of
vacant space available with 273,450sqm. Canning Vale was
second with 158,585sqm of vacant space at the end of December
Have we reached the 2016.
turning point? Container movements (imports and exports) through Fremantle
Port, reported to be 142,772 TEU’s over the December 2016
The December 2016 quarter for Western Australia’s state final quarter, experienced a seasonal recovery over the last two
demand put an end to five consecutive quarters of contraction quarters of 2016. However, annually, movements have been in
with a modest 0.4 per cent seasonally adjusted quarter on quarter a downward trend since 2014. This was driven by a decline in
growth. This rebound in growth was largely driven by a recovery full import container movements - which was 6.7 per cent lower
in private business and public sector investment spending. year-on-year during the December quarter 2016. Conversely, this
was offset by a recovery in full export container movements, rising
The long anticipated crash in the Chinese economy has yet to
6.3 per cent year-on-year.
materialise, and has instead continued to expand. The recent
optimism surrounding the incoming US administration’s fiscal The residential construction sector has continued to slow. The
policies leading to improved economic growth, together with latest statistics from the ABS reported that residential building
robust demand from China is likely behind the recent surge in approvals for Greater Perth had contracted 28.1 per cent year-
commodity prices. This has in turn assisted a modest recovery in on-year in January 2017. Colliers International is expecting
private capital expenditure. Could this be the ‘green shoots’ WA approval numbers to continue to trend down over the short term.
has been yearning for? Population growth remains weak at around one per cent, with
growth largely driven by natural increase as opposed, to interstate
Has this improvement in quarterly economic performance
or overseas migration.
translated to a recovery in the industrial market? Not yet - and
we expect any improvement is likely to be gradual. Despite robust Hence soft building activity is expected to persist in the short
leasing activity over 2016, net tenant demand was negative. term, as a consequence of lower net migration. A high residential
Perth’s industrial vacancy rate continued to rise and, as of the end vacancy rate will also put further pressure on the construction
of December 2016, was estimated to be 9.7 per cent. This was up sector to reduce capacity. Over the medium term, this low activity
from 9.1 per cent in July 2016. and capacity will assist absorption of existing and new stock –
transitioning the market back to equilibrium and then, at some
stage, a recovery. Should population growth pick up pace going
18forward, this equilibrium point should arrive earlier and deliver a
recovery to the construction sector sooner - therefore boosting Perth Average Prime Industrial Yields
10%
industrial space absorption.
9%
Average Yield (%)
Following on from previous downward adjustments, the December 8%
2016 quarter saw average Prime warehouse rents stabilise at a 7%
range of $70/sqm to $90/sqm. Secondary rents were also stable 6%
at between $60/sqm and $80/sqm. 5%
4%
The subdued leasing market is continuing to influence industrial
Dec-06
Jun-07
Jun-08
Dec-07
Dec-08
Jun-09
Dec-09
Jun-10
Jun-12
Jun-13
Jun-14
Jun-15
Dec-10
Jun-11
Dec-11
Dec-12
Dec-13
Dec-14
Dec-15
Jun-16
Dec-16
land demand and value; with prices moderating over the past 12
months. Average land rates for Core industrial precincts are now Source: Colliers Edge
7.2 per cent lower than a year ago, and circa 40 per cent lower
Perth Industrial Space Supply
than the pre-GFC high. Despite the softer land market during
2016, there have been signs of more stability in the last quarter. 400,000
‘Fringe’ precinct land prices have been unchanged since the 350,000
Industrial Space Supply (m²)
300,000
September 2016 quarter, with a range of $125/sqm to $385/sqm.
250,000
Land or developable holdings in the more central precincts ranged
200,000
between $250/sqm and $525/sqm. 150,000
100,000
Lower returns have continued to dampen developer activity
50,000
with design and construct projects being significantly less than
0
in previous years. Research by Colliers International indicates 2011 2012 2013 2014 2015 2016 2017F 2018F
133,000sqm of space scheduled for completion in 2017 in the Source: Colliers Edge
Perth Metropolitan area. In addition to this, another 28,355sqm is
mooted for delivery in 2018. This year and next will see the lowest
supply level since 2010. The historically low interest rate environment, combined with
yield compression across other property sectors and investment
Over 2016 major industrial transaction activity remained robust,
classes, is likely to maintain tolerance of lower or firmer internal
totalling $757.5 million. This is evidence of the continued appetite
rates of return in the industrial market. However, there are signs
for Perth assets from institutional investors. In the last quarter
of a potential change in the interest rate environment with some
alone $230.6 million in assets were transacted.
banks already lifting rates, independent of the RBA. Should global
Yields achievable for Prime assets were between 6.25 and 7.6 per and/or domestic economic and financial sector conditions cause a
cent for the December 2016 quarter. This is a by-product of the shift towards tighter credit conditions, industrial market yields are
weight of local and international capital chasing quality assets and also expected to shift upwards.
moderating market rents. Secondary grade asset yields remained
within 7.5 per cent and 8.5 per cent.
87 Norma Road, Myaree
Sold on behalf of a private client
Industrial | Research & Forecast Report | First Half 2017 19Research &
Forecast Report
NEWCASTLE
Industrial | First Half 2017
By Trent Robertson $US180 / tonne, up from a low of $US90 / tonne. These factors
Director | Industrial were key drivers in late 2016 and will continue to drive growth
trent.robertson@colliers.com and demand for industrial assets in the first half of 2017.
MARKET HIGHLIGHTS Incentives
Incentives within the Newcastle market are typically associated
A record infrastructure investment spend in the Hunter
with the leasing of larger facilities for lease terms greater than
Region combined with an uplift in commodity prices and
three years and range between 8 per cent to 10 per cent of the
residential construction is driving confidence, and enquiry
lease term certain.
for industrial assets.
The majority of lease deals negotiated during the second half of
Investment demand and interest in the region by REITs 2016 in prime industrial areas have featured incentives less than
continues with underlying yields firming and enquiry levels this, with most incentives being experienced for older industrial
increasing. facilities in secondary and fringe industrial locations.
Project Description Investment Spend
Industrial land values are seeing steady improvement as a
result of strong enquiry and a tightening of supply Newcastle Airport $80 million
Newcastle RAAF Base $1.5 billion
Owner occupier activity and appetite for industrial assets
NSW Law Courts $90 million
continues. This is at a time where a noticeable increase in
leasing activity from mining and construction sector tenants Light Rail Project $260 million
is being experienced in the region.
Newcastle Interchange $200 million
Port of Newcastle Cruise Terminal $13 million
Infrastructure investment Hunter Innovation Project $18 million
and improved commodity
prices drive growth
University of Newcastle City Campus $95 million
Source: Colliers Edge
The Hunter region has an impressive infrastructure pipeline. Based
on Colliers International forecast, there is currently an estimated Investor demand strong
$6.5 billion in federal, state and private projects currently underway
Investor demand for industrial assets remains strong and a lack of
or completed in the Hunter Region. This spending has created
supply of assets with long WALEs and quality tenancy covenants
renewed confidence in the region from many sectors, with investors
has seen a compression in yields of A grade assets in the prime
and developers seeking to leverage from the opportunity presented
sub-markets around the Port and the M1 Motorway. Renewed
from a region undergoing sustained urban renewal.
interest from REITs in the region as evidenced by acquisitions by
This infrastructure investment has come at a time of strong Industria REIT of the Westrac facility and Sentinel Property Group
residential construction and renewed confidence in the mining of the Austube Site is an emerging pattern expected to continue.
services sector with coking coal spot prices now in the vicinity of Competition for secondary industrial assets also remains high
20You can also read