MIDDLE MARKETS OFFICEOFFICE - COLLIERS INTERNATIONAL
←
→
Page content transcription
If your browser does not render page correctly, please read the page content below

Colliers International

Office
Middle
Markets
  End of Year Review: Jan - Nov 2020
Colliers International
                               Office Middle Markets
   Throughout the twists and turns of 2020, Colliers International Office Middle Markets team have worked
alongside our clients to create and seize opportunities to maximise the potential of your commercial property
                                                 investments.
We’ve worked together to embrace changes in your business and help you achieve profitable outcomes for your immediate
                                            and future investment needs.

   Now, with over 24 months of data, we have greater clarity on the ramifications the COVID-19 pandemic has had on
   Australia’s Office Middle Markets in 2020. Positioning us as the number one team in the market to accelerate your
                                            success into 2021 and beyond.

 Through our diligent market tracking over the past two years, we have built a somewhat clear picture of how COVID-19
has impacted transaction numbers, capital values, interstate and overseas investment, as well as what actions need to be
                                  taken to add-value to your commercial asset in 2021.

In previous reports, we have categorised the Office Middle Markets between $20-$100 million, but due to a 53% decrease
  in transactions numbers YOY the data captured in this report will analyse freehold office assets from $5 -$100 million.

                                                Experts in Office
A national
overview on
the Australian
Office Middle
Markets.
Over the past 12 months the Novel Coronavirus (COVID-19)        It comes as no surprise as offshore groups cope with the        the Metro Markets as businesses focus on talent retention
has gathered significant momentum across the world,             COVID-19 impacts in their domestic markets, the ability to      and outer major office hubs with strong transport links.
bringing with it, major health implications and volatility in   physically access property opportunities in Australia and
financial markets and global economies. Whilst the effects      changes to the Foreign Investment Review Board (FIRB)           Investment appetite for metro office locations has already
of COVID-19 peak and taper, the long-term impact on             approvals.                                                      come to fruition as 75% of transactions took place in the
markets and economies are still unknown.                                                                                        Metro Markets in 2020. Sales data can be found on the
                                                                According to a survey on office occupancy conducted by          following pages of this report.
From January to November 2020 we witnessed a 53%                the Property Council of Australia (PCA), office occupancy
reduction in sales transactions and a 54% decrease in           levels were below or around 50% across the major office         Colliers research shows workers still need offices to
capital investment. Despite this, market confidence has         markets as at July-2020. However, office workers have           collaborate and connect, but with the increase of working
increased throughout the second half of 2020, with a            started to return to the office and as such occupancy levels    from home, the functionality and size is expected to
number of key sales (highlighted in this report) taking         have increased across Brisbane CBD (61%), Canberra              change.
place. This suggests positive sentiment for commercial          (63%), Adelaide CBD (73%) and Perth CBD (77%) as at
investors and should restore market confidence in Q1            October-2020. Sydney CBD (40%) is witnessing a slower           Throughout this report we have provided an analysis of
2021, providing Australia’s management of the virus             return to the office and at the time of the survey Melbourne    national sales data; a considered review on each market;
continues as is. Fortunately for commercial office markets,     CBD (7%) was still in lockdown due to their second wave         and shared our insight into the conversations we are
values have tightened as limited supply has been taken to       of the virus, however, restrictions have since eased and a      having with our clients. Whilst figures report an obvious
market. Assets which did go to market, held their value,        return to the office will happen somewhat slowly pre-Xmas       stall in the market over the past 11 months, we strongly
saw a flurry of offers and restored confidence amongst          and gain momentum early in the New Year.                        believe the resilience of Australia’s Office Middle Markets
vendors.                                                                                                                        will carry optimism and activity well in to 2021.
                                                                We predict ‘hub and spoke’ workplaces will be back on the
There has been a reduction in offshore capital transactions     agenda for many large organisations in 2021, albeit which
over 2020, in line with a reduction of overall transaction      model of spoke is yet to be determined (satellite offices,
volumes. Offshore purchasers as a percentage of overall         WFH etc). It is expected that a more distributed workplace                  Matthew Meynell
transactions has decreased from 27% in 2019 to 20% in           model could combine city office hubs and smaller more                       Head of Investment Services Australia
2020.                                                           flexible spoke offices located in metropolitan markets                      +61 413 988 878
                                                                closer to residential areas. This will likely provide greater
                                                                leasing opportunities and greater investment demand in
Transaction Data
2020 YTD                               *

There were 68 transactions, totalling $2.12 billion in          Unsurprisingly, 51 of the 68 transactions took place in          Most impacted was Victoria, which suffered a 76%
the Office Middle Markets from January 2020 to 30               the Metro Markets totalling $1.41 billion. Australia’s CBD       decrease in transactions and a 71% decline in sales
November 2020. This represents a 53% decrease in                and City Fringe markets continue to be tightly held, 17          volumes. This can be largely attributed to the state’s
transactions and a 54% drop in sales volumes over the           assets transacted for a combined total of $712.7 million,        second lockdown and a reduction in investment from
same period nationally in 2019.                                 compared to $1.8 billion worth of assets in 2019.                onshore and offshore Asian groups.

 Overview              Transactions                         Sales Volume                 Avg Initial Yields (%)                    Total NLA                     Capital Values
 Total                    68       (-53%)            $2,125,502,878       (-54%)                5.75% (-8bps)                   316,844 (-55%)                     $6,708 (4%)
 CBD                      17       (-67%)             $712,708,333        (-60%)                6.05% (90bps)                   118,338 (-53%)                     $6,023 (-16%)
 Metro                    51       (-47%)            $1,412,794,545       (-49%)                5.66% (-50bps)                  198,506 (-57%)                     $7,117 (17.3)
                                       CBD and Metro Analysis: 1 Jan - 30 Nov 2020 Vs 1 Jan - 30 Nov 2019 (% change)

$41.9m                               $27.7m
the average price of a CBD asset     the average price of a Metro asset

      The following data can be attributed to off-shore capital:
                                                                                               Purchasers                     Vendors
     Middle Market transactions to offshore groups were
     down from 29 to 8 (-72%) YOY. This equates to a
     reduction of $897 million (-69%) in capital.
                                                                Transactions                          8                           3                 12%
                                                                                                                                                    of total 2020 transactions
                                                                Sales Volume                   $432,033,333                  $157,500,000
     Despite this, the average sale price increased 18%
     from $45.8 million in 2019 to $54 million in 2020.
                                                                Country of origin:
                                                                                                                                                    20%
                                                                                                                                                    of total 2020 sales volumes
Colliers International Office Middle Markets team are currently
market leaders with 26% market share.

State                  Transactions                  Sales Volume              Avg Initial Yields (%)           Total NLA                   Capital Values
National                68   (-53%)           $2,125,502,878       (-54%)          5.75% (-8bps)             316,844 (-55%)                  $6,708 (4%)
NSW                     23   (-47%)            $759,990,000        (-54%)          4.84% (-2bps)              89,650 (-47%)                  $8,477 (-12%)
VIC                     11   (-76%)            $391,640,000        (-71%)          4.72% (6bps)               49,085 (-75%)                  $7,979 (13%)
QLD                     14   (-53%)            $549,679,545        (-19%)          6.79% (-33bps)             80,360 (-39%)                  $6,840 (33%)
SA                      14   (-26%)            $320,833,333        (-38%)          6.81% (-27bps)             80,466 (-38%)                  $3,987 (1%)
ACT                      6   (-25%)            $103,360,000        (-73%)          6.62% (-61bps)             17,283 (-79%)                  $5,980 (30%)
                                         State Analysis: 1 Jan - 30 Nov 2020 Vs 1 Jan - 30 Nov 2019 (% change)

 Vendor Disposal Analysis 2020:                                                     Purchaser Acquisition Analysis 2020:

      31+29+1710831                                                                       42+19+15942
 Transactions:                              Sale Volume:                            Transactions:                        Sale Volume:

10%                           31%        Syndicate $651,000,000                     10%                         37%      Syndicate $849,000,000

                                         HNW / Family Office $481,000,00                                                 HNW / Family Office $444,000,000

15%                           30%        Institution $458,00,000                    15%                                  Developer $301,000,000
                                         Developer $ 292 ,000,000                                               19%      Institution $267,000,000

      HNW Investor /                                                                 Corporate
                             Syndicate         Institution         Developer                            Owner Occupier        Listed Fund          Unlisted Fund
      Family Office
How                       As the first continent in the world to
                          experience the effects of the COVID-19
                                                                                        New South Wales
                                                                                        Transactions across New South Wales (and the rest of

COVID-19                  pandemic, the financial implications
                          of Asia’s lockdowns have been felt
                          worldwide. No more so than in Australia’s
                                                                                        the country) have stalled as a result of the FIRB approval
                                                                                        process. In the Sydney CBD alone, two assets are currently
                                                                                        subject to FIRB approval and are yet to exchange - and

has impacted              Office Middle Markets.
                                                                                        another has recently fallen over, which will be bought back
                                                                                        to the market in 2021.

Australia’s               Despite fundamentals remaining stable compared to other
                          asset classes, there has been a reduction in offshore
                          capital transactions as a percentage of total transactions
                                                                                        Whilst transaction volumes in the Office Middle Markets
                                                                                        have been subdued, in the Capital Markets space there

local and
                                                                                        have been a number of transactions either complete or
                          from 27% in 2019 to 20% in 2020.                              currently awaiting approval from FIRB. These transactions
                                                                                        include:
                          According to Colliers Research, whilst only accounting for

inbound                   12% of all Middle Market sector transactions, Asian capital
                          accounted for 20% of total YTD sales volume in 2020 for
                          office assets.
                                                                                        •   45 Clarence Street, a 32,000sqm commercial building
                                                                                            located on the western corridor of the Sydney CBD.

investment
                                                                                            The asset sold to fund manager Peakstone, who
                                                                                            currently run their headquarters from Singapore;
                          On 29 March 2020, the Treasurer announced a temporary
                          measure that monetary thresholds would be reduced to

from Asia?
                                                                                        •   60 Miller Street, North Sydney, transacted to Hong
                          $0, meaning that all commercial property transactions by          Kong group Huge for $273 million, at a 3 per cent
                          foreign investors would be subject to FIRB approval. This         premium book value; and
                          has significantly reduced the competitiveness of foreign
                          buyers, delaying the sale process by up to six months.        •   China Investment Corporation (CIC) has exchanged
                                                                                            a conditional acquisition of an additional 50% stake
                          Despite transaction volumes being down, market                    in Sydney’s Grosvenor Place for $925 million from
                          sentiment remains strong, in fact, Australia’s recovery and       Dexus and Canada’s CPPIB. This transaction will be
                          management of the pandemic has further cemented the               seen by many as the bellwether for the FIRB’s views
                          country’s reputation as offering a healthy environment            on acquisitions by Chinese State Owned Enterprises.
                          with economic and geopolitical stability. This can be
                          demonstrated through the average purchase price for           The common element in all three transactions has been
                          assets transacted by Asia-based purchasers rising 18%         the vendor, Dexus, who has recycled a total of $1.7 billion
                          from $22.9 million in 2019 to $55.6 million in 2020.          worth of prime office assets to offshore Asian investors.

                          We are witnessing offshore investors seeking to deploy
                          capital into Australia, seeking longer WALE assets, with
                          the average acquisition offering a 5.63-year WALE. This
                          contrasts with the average WALE at the time of acquisition
                          by onshore investors of 4.87-years, a 0.76 yrs spread,
                          which implies that domestic purchasers are more willing to
                          acquire assets which will require active management.
                          Interestingly, the assets divested by offshore vendors in
                          2020 had an average WALE of 3.08 year, a 2.55-year
Experts in Asia Markets   spread against acquisition.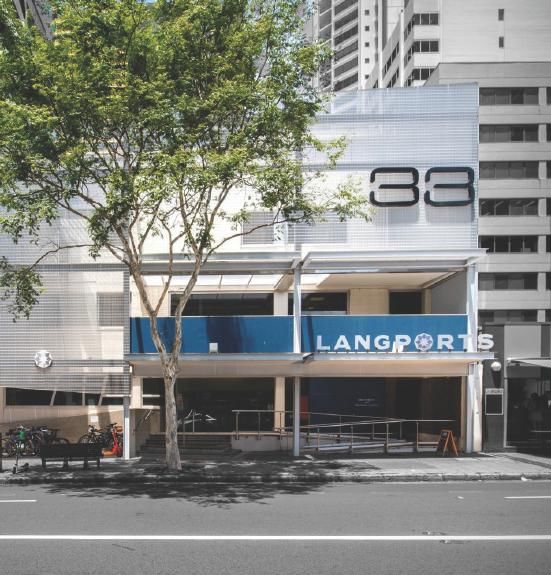
Victoria                                                       Queensland
As the volume of assets bought to market dramatically          On an annual basis Queensland has typically seen between       Confidence in the Queensland market is also boosted by
decreased with the onset of COVID-19, so did the interest      35-40% of our office transactions over $10 million trade to    the significant infrastructure spend across the state, in
from some of Victoria’s wealthiest and most active Asian       Asia-backed investors.                                         particular the recent opening of the second runway at
purchasers. The strict Stage 4 lockdown across Victoria,                                                                      Brisbane Airport. The project will see Brisbane Airport
combined with international border closures, caused a          Queensland were quick to react to the pandemic, with           operating on a 24hour basis, matching the current capacity
near seven month standstill and 71% reduction in capital       the majority of the state seeing minimal impact therefore      of Hong Kong Airport. The airport is forecast to see
YTD. As a state popular with both onshore and offshore         enabling a quicker return to “business as normal”. Despite     international travel from Asia increase once international
Asian buyers, it is unsurprising Victoria has experienced      border restrictions impacting inspection capacity for          borders reopen.
the sharpest decline in figures.                               interstate and offshore investors, we were nimble with our
                                                               strategies, as displayed in the recent sale of 33 Herschel
As Victoria sat back and watched the rest of the country       Street, Brisbane City ($9.25 million).
emerge from lockdown, transactions begun to occur
across the Eastern Seaboard (albeit marginally) and as a       This asset was previously marketed by a competitor in Q4
result sentiment started to show positive signs. Through       2019 which failed to yield a sale. Through collaboration
communication and education with our clients we primed         between our Office Middle Markets and Asia Markets
the market for a “re-launch” of Victoria. This included        teams we were able to attract the attention of the local
notable campaigns such as:                                     operations of a mainland-China developer and execute an
                                                               off market sale.
•   The on-market sale of 139 Collins Street, a high-profile
    CBD building which caused a stir in the market. The        With the announcement of the domestic borders reopening
    Louis Vuitton boutique store with an office component,     on December 1, we predict a surge of activity by our Asia
    is situated on the corner of Collins and Russell           Markets clients in Q1 2021. This particularly applies to the
    Streets. It generated local, national and international    onshore groups from New South Wales and Victoria who
    interest, installing confidence in vendors across the      have new interest in investing in Queensland following the
    market and displayed to the world that Victoria was        state’s positive performance.
    back open for business.

    The influential campaign successfully transacted to
    an offshore Singaporean investor for an offer over
    $65 million, outbidding all local offers. This same
    group has an additional $1.5 billion of active capital,
    which they are looking at place in Victoria at the start         Contact Colliers Asia Markets experts:
    of 2021, demonstrating that Asian buyers have re-
    engaged with the market and are seeking prime CBD
    and Metro assets.

•   The recent transaction of 190 City Road, Southbank,
    is further testament to this interest, having received          Steam Leung               Joseph Lin               Zhenni Lu             Leon Ma                   Tony Wang
    strong onshore Asian interest. It sold to a local Asian         National Director         National Director        Manager               Associate Director        Manager
    investor for an unconditional price of over $18 million         New South Wales           New South Wales          New South Wales       Victoria                  Queensland
    despite the current development environment.                    +61 412 236 138           +61 452 070 980          +61 433 230 625       +61 417 070 725           +61 439 577 777
New South Wales
Sydney CBD
End of Year Review 2020                                        How has 2020 shaped the market?
In 2020 only one asset has exchanged and settled thus far.     The Sydney CBD office market in January 2020 (prior         2020 has seen four properties in the Sydney CBD
Three other properties have been exchanged, all subject to     to the pandemic) had very low vacancy at 3.9%. Since        exchanged with only one having settled to date being
FIRB approval, and one of these has recently fallen over. It   then most tenants have re-evaluated how they intend on      139 Elizabeth Street at $46 million. The other three have
must be noted that prior to COVID-19 there was a relative      occupying their office space and as a result some tenants   been awaiting FIRB approval and include a 50% interest
shortage of assets for sale as most Sydney CBD owners          have chosen to sublease space, which totalled 175,106sqm    in Grosvenor Place at $925 million; 45 Clarence St at
tend to be long term holders, and Sydney properties have       (as at Sept 2020).                                          $530 million; and 191 Thomas St at $80.08 million. The
performed well over a long period. Property has been                                                                       latter sale has fallen over as the buyer did not receive a
producing more attractive returns than alternative asset       PCA OMR vacancy as at Jul-20 is 5.6% and as a result,       response from the FIRB within the designated contractual
classes. Since COVID-19 hit, owners have been reluctant        owners have increased incentives from an average of 20%     time period.
to place their assets up for sale as uncertainty prevailed.    to between 25-30%, thus lowering net effective rents. We
Likewise, buyers retreated for many months until the           forecast the rental trough occurring by June 2021, which    Generally, and depending upon tenant covenants, valuation
effects of COVID-19 on the leasing market became more          should be when all businesses will have determined their    headline prices have fallen by 5% for prime grade assets
apparent. We now have far greater visibility on where          space requirements.                                         (Premium & A grade) and 10% for secondary assets.
rental levels are landing and buyers are now starting to                                                                   Whilst yields have generally remained unchanged, the
re-engage to acquire assets.                                   We expect total sublease space to increase to approx.       major changes to valuations have been seen in the
                                                               200,000 sqm and a further reduction in net effective        increases in incentives thus lowering net effective rents
                                                               rentals, which will occur via incentives increasing         and assumptions of longer let up periods for vacant space.
                                                               marginally or face rents falling.                           Rental growth forecasts have also been tempered.

Transaction Overview:
2020 vs 2019 (30 Nov YTD)
                                                             2020                  (%)                  2019
 Transactions                                                  1                 -92.3%                  13
 Sales Volume                                             46,000,000             -85.6%              318,487,500
 Average Initial Yield                                      3.80%                -44bps                4.24%
 Total NLA                                                   2,818               -86.6%                21,055
 Capital Values                                             16,324                7.9%                 15,126
A Vendor’s perspective                                                                                                           Sold:

Throughout 2020, owners focused on rent abatement and
                                                                                                                                 114 Castlereagh Street &
rent relief for tenants. This has continued throughout the                                                                       139 Elizabeth Street
second half of the year albeit to a much lesser extent. The
pandemic raised uncertainty about the working culture of
the future, however following restrictions easing we saw                                                                                 Date:         September 2020
confidence return and each month we are witnessing
                                                                                                                                         Price         $46,000,000
more white-collar workers returning to the office. Although
there has been a reluctance by owners to test the market                                                                                 Vendor:       Private Investor
in 2020, as confidence has returned and interest rates
have fallen, more owners are planning to divest. We have                                                                                 Purchaser:    Fife Capital (onshore)
not seen forced sales this year as was initially expected by                                                                             Yield:        3.8%
some buyers at the beginning of the global pandemic, and
it is highly unlikely that we will see any in 2021.                                                                                      NLA:          2,818sqm
                                                                                                                                         $/sqm:        16,323/sqm
A Purchaser’s perspective
                                                                                                                                         Comprising two adjoining Sydney CBD freehold
Immediately following the introduction of COVID-19,                                                                                      buildings in the dynamic Midtown precinct, 114
buyers withdrew from the sales market but kept a very                                                                                    Castlereagh Street and 139 Elizabeth Street. The
close watch on the leasing market. As the leasing market                                                                                 assets extend to 2,818sqm* of NLA and benefit
saw rental levels fall, buyers are now gearing up for                                                                                    from dual street frontages and dual Titles providing
acquisitions in the new year. Investors are motivated by                                                                                 ultimate optionality.
recent falling interest rates and the fact that Sydney CBD      The initial focus of most investors will be for assets that by
properties still offer relatively high returns in comparison    virtue of the tenant covenants and quality of the buildings
to cash and a highly priced stock market.                       offer minimal risk and capital expenditure. As time                      Contact the Sydney CBD experts:
                                                                progresses and the leasing market stabilises and improves,
                                                                investors will be seeking properties that exhibit value add
What does 2021 look like?                                       characteristics.

We expect sales volumes to gradually increase in the first      The Central Sydney Planning Strategy will be gazetted in
half of 2021 until the full extent of vacancy and softening     the coming months and this will provide a definite roadmap
rents become visible. Once visibility is clear we expect a      for all participants in the Sydney CBD office market.
far greater number of buyers to be seeking assets of all                                                                                 Vince Kernahan              Steam Leung
grades. Providing there are sufficient owners willing to                                                                                 National Director           National Director
                                                                The infrastructure works in Sydney that have been
sell, sales volumes will increase significantly in the second                                                                            +61 438 262 497             +61 412 236 138
                                                                completed, have added considerable amenities to the city
half of 2021.                                                   and the Sydney Metro stations and network, will further
                                                                enhance our liveable city.
We will continue to provide advice to both owners and
investors on the leasing market and our forecast on
valuation changes.
                                                                                                                                         Joseph Lin                  Tom O’Neill
                                                                                                                                         National Director           Manager
                                                                                                                                         +61 452 070 980             +61 410 377 412
New South Wales
Metropolitan Markets
End of Year Review 2020                                        How has 2020 shaped the market?
The New South Wales Metro Market has been the highest          Metro Office Markets in Sydney are in a unique position      office space. There continues to be a reasonable disparity
performing in the country throughout 2020, transacting 22      to capitalise on changing work trends in a post COVID-19     in tenant activity across the various Sydney markets.
of 51 Metro sales nationally. Despite this, stock has been     world, as tenants seek to cut the commute, resulting in a    Macquarie Park, with an average A grade face rent of
limited, with transactions down 26.7% YOY.                     growing demand for office locations across Metropolitan      $425/sqm (the lowest average rent in the Metro Market)
                                                               Sydney.                                                      is the only market to continue to record reasonable tenant
New South Wales has successfully controlled the spread                                                                      demand and moderate annual growth in net effective rents
of the virus. Assets which have been taken to the market       Backed by significant infrastructure projects to boost the   (2.4%). Parramatta’s A Grade market is currently achieving
have experienced solid buyer enquiry with the North Shore      economy, major rail upgrades and projected government        $570 to $600 net and the B Grade market is achieving
market seeing significant movement. 122 Walker Street          spending is seeing markets such as Parramatta and North      $495 net. Tenant enquiry is low with the vacancy rate
North Sydney sold for $35 million with a yield of 3% and       Sydney raise purchaser confidence in these markets.          expected to rise in 2021.
sqm rate of $18,909.                                           Particularly North Ryde has had strong sales activity
                                                               throughout early 2020, as yields have remained stable and    All other markets recorded a deterioration in net effective
Other North Shore markets like North Ryde continue to see      arguably firming.                                            rents and increased incentives, with those markets closest
vacancy levels fall which has further fuelled the attraction                                                                to the CBD (South Sydney, CBD Fringe and North Sydney)
to the market for buyers. Sales in Parramatta have been        As New South Wales “gets back to work” we expect             seeing the biggest impact.
slow in 2020 with only one sale at 16 Wentworth Street.        working behaviours to normalise in 2021 and beyond,
A second sale at 27 Argile is due to exchange. Both sales      however it is likely that many occupiers will use the        Newcastle has seen another strong year. Non-Newcastle
were to onshore Asian investors.                               experience of 2020 to re-define the way they occupy          businesses are now considering moving into the location,
                                                                                                                            with increased enquiry. The market has seen an increase
                                                                                                                            in incentives and downtime allowances for vacancies are a
Transaction Overview:                                                                                                       consideration for any short-term expiry risk.
2020 vs 2019 (30 Nov YTD)
                                                            2020                 (%)                  2019
 Transactions                                                22                -26.7%                  30
 Sales Volume                                           $713,990,000           -45.8%           $1,318,190,244
 Average Initial Yield                                     4.90%               -19bps                5.09%
 Total NLA                                                 86,832              -41.5%               148,427
 Capital Values                                            $8,223               -7.4%               $8,881
A Vendor’s perspective Sold:
The majority of vendors have been reluctant to sell in
118-122 Walker Street
2020 as they seek clarity on the prevailing economic North Sydney
conditions. With the opening of both Victorian and
Queensland boarders, it is expected that vendors who have
been holding off will take their property to the market in Date: June 2020
early 2021 with purchasers from Melbourne booking trips
Price $35,000,000
to Sydney. We anticipate Brisbane based buyers will do
likewise and 2021 is expected to have a busy start to the Vendor: Talish Pty Ltd & M & P Read
year.
Purchaser: Stockland
A Purchaser’s perspective Yield: 3.0%
NLA: 1,851sqm
Unsurprisingly purchasers are very cautious of long-term
tenants still on rent relief. The fear is will these tenants $/sqm: 18,909/sqm
still trade in the same capacity in 2021. We have also
seen an increase in buyers wanting to understand the The assets were acquired ‘In One Line’ by the
tenant’s business and the longevity with a preference for adjoining owner, Stockland who will explore an A
assets underpinned by government tenants. Government Grade office development across 110 Walker Street,
backed tenancies have become very popular and yields 118 Walker & 122 Walker Street. We have been
on these types of properties may have even compressed advised that the amalgamated 2,301m² site (110-
with purchasers willing to pay a little more for the security 122 Walker Street) can accommodate a ~65,000
of tenure. Not withstanding this, buyers from Melbourne (GFA) commercial office development.
and Brisbane are now booking trips to Sydney, now that
boarders have opened. Contact the Sydney Metro experts:
What does 2021 look like?
With very limited stock available in 2020 it is expected In fact, PCA stats show that Newcastle is the strongest
that vendors who have delayed the sale of their property performing metropolitan office market in Australia, with
due to border restrictions and limited O/S activity will put tenant demand increasing as businesses across the state John McCann Tom Appleby
their asset up for sale in 2021. seek well connected metro locations and regional cities National Director Associate Director
such as Newcastle for back of house operations and on- Sydney West Sydney North
This is due to tenant activity being most impacted in inner shoring call centres. +61 418 230 792 +61 405 693 696
city locations. A divergence is occurring in impacts to
face rents and incentives, depending on the ownership
make up of each market. In markets where there is a
high proportion of private ownership, we are expecting
some deterioration in net face rents, while in more
institutional markets (eg. Parramatta, Macquarie Park and Peter Macadam
even Newcastle) we expect incentives to rise in order to Director in Charge
generate tenant activity due to back-fill vacancy increasing Newcastle
in 2021. +61 402 074 159Victoria
Melbourne CBD & City Fringe
End of Year Review 2020 How has 2020 shaped the market?
The Melbourne CBD commercial property market As Melbourne emerged from lockdown in Q4 2020 the Challenging market conditions throughout 2020
commenced 2020 in a robust position with strong office first round of public sales campaign came to market. One demonstrated office investments whilst strong
leasing demand and a record low vacancy rate of 3.50%. of the first marque listings offered for sale was 139 Collins fundamentals maintained rental income and capital values.
These strong fundamentals made the Melbourne market Street, Melbourne. The fully leased investment generated Properties in prime Melbourne CBD locations such as
very attractive to domestic and international investors more than 350 domestic and international purchaser Collins Street, that are managed and maintained to a high
seeking to purchase Premium, A and B grade assets. It enquires and sold for a significant premium above standard performed the best. The year also demonstrated
also drove a wave of new major office developments. valuation. This campaign demonstrated the level of pent up the importance of strong working relationships between
purchaser demand seeking prime Melbourne CBD safe- landlords and tenants. Conversely, properties with poor
Therefore, the Melbourne CBD market was in a robust haven investments and provided other vendors confidence fundamentals did not fare as well.
position to weather an extended lockdown from March to offer assets for sale.
through to November 2020 due to COVID-19. During Other significant factors shaping the Melbourne CBD
this period transaction activity paused whilst landlords Current campaigns are performing well and an increase in market throughout 2020 are record low interest rates, a
focused on defensive investment strategies aimed at completed transactions throughout Q4 2020 and the first favourable exchange rate for offshore investors and influx
tenant retention, preservation of rental income and debt half of 2021 is anticipated. Whilst Melbourne CBD and City of capital transferring from volatile equities markets to
reduction. Fringe end of year 2020 transaction volume is historically commercial property.
low this was due to a “black swan” event and the market is
well positioned for a steady recovery. Combined with scarcity of supply and unsatisfied
purchaser demand these factors provide favourable
conditions for the Melbourne CBD and City Fringe market
looking forward 2021.
Transaction Overview:
2020 vs 2019 (30 Nov YTD)
2020 (%) 2019
Transactions 3 -80.0% 15
Sales Volume $202,150,000 -63.9% $560,599,999
Average Initial Yield 5.16% 224bps 2.92%
Total NLA 17,050 -64.5% 48,002
Capital Values $11,856 1.5% $11,679A Vendor’s perspective
Sold by Colliers International:
Over the second and third quarter of 2020 many vendors
were naturally hesitant to list their property for sale, as the
139 Collins Street
uncertainty of the virus brought businesses across Victoria
to a halt. Date: November 2020
Throughout September and into October, as we emerged Price ~ $65,000,000
from our Stage 4 lockdown, we have noticed an increase Vendor: Private Family
in confidence towards the commercial market, as interest
from vendors seeking to divest before the year end has Purchaser: Singaporean Group
surged. With minimal stock entering the Melbourne
Yield: Confidential
CBD and City Fringe Market for several months, it is
unsurprising that vendors are eager to take advantage of NLA: 1,661.80sqm*
purchasers’ desire to place capital and acquire property
before 2021. $/sqm: Confidential
This has caused increased momentum throughout the In September 2020, the Colliers team proudly brought
Melbourne CBD and City Fringe markets, as vendors have to market 139 Collins Street, the Louis Vuitton Collins
witnessed successful on-market campaigns such as 139 Street boutique, via a 5-week EOI campaign. The
Collins Street, Melbourne, 190 City Road, Southbank and campaign generated exceptional interest with over 350
701 Swanston Street, Carlton. enquiries, more than 420 video views and multiple
press released regarding the asset. This resulted in
A Purchaser’s perspective 15 initial offers being received and a final sale price in
excess of $65 million - a truly outstanding result.
Throughout 2020 purchasers have remained eager to
acquire prime assets in the Melbourne CBD and City
Fringe at what was expected to be a ‘discounted price’. We Contact the Melbourne Metro experts:
saw high enquiry numbers and received multiple offers on
prime campaigns, in some cases driving the price higher What does 2021 look like?
than vendor expectation.
We anticipate that landlords will remain defensive with
In September, the low cost of debt and stabilisation of their portfolio strategy. The objective of this will be to
COVID-19 cases in Melbourne has seen a flourish in retain tenants and a secure income stream.
confidence which has resulted in an increase in pricing. Daniel Wolman Oliver Hay
This has ensured that the end of 2020 will restore the As we adapt to the new ‘norm’ and Victoria gets back to National Director National Director
strong 2019 momentum that was left behind in the first business, we expect to see an increase in transactions +61 412 957 839 +61 419 528 540
quarter of the year. as investors look to rebalance their portfolios. Buyer
competition will drive prices in sought after Melbourne
Assets positioned in desirable locations across Melbourne CBD and City Fringe hotspots as local, interstate and
CBD and City Fringe hotspots, have remained sought-after internal investors compete.
investments for both local and offshore purchasers and we
expect this trend to continue into 2021. Matt Stagg
Director
+61 409 411 300Victoria
Metropolitan Markets
End of Year Review 2020 How has 2020 shaped the market?
The Melbourne Metropolitan office market has experienced Melbourne Metropolitan office net face rents have Bunnings have leased circa 13,900sqm of space in a
a relatively subdued year due to the COVID-19 pandemic, remained relatively steady throughout 2020, with brand 19,500sqm building, which shows the confidence in the
with Melbourne’s Stage 4 lockdown having an impact on new A Grade and existing A Grade office buildings City Fringe office market in particular. Following the easing
both tenant and investor demand. proving to be more resilient than B Grade office buildings. of restrictions in Melbourne in October, we have seen an
However, an increase in incentives across all precincts and increase in tenant enquiry and inspections throughout the
There has been limited stock on offer with vendor’s building grades has had a more pronounced impact on net metropolitan office market.
reluctant to take their properties to the market due to effective rents over the last six months.
the uncertainty of COVID-19 and the inability to inspect There has been a lack of sales activity throughout 2020
during Melbourne’s Stage 4 lockdown from June to Leasing activity over the 3rd quarter of 2020 was severely with only $189.5 million office sales recorded to date
October. Pleasingly there are still significant levels of constrained as tenants were prevented from inspecting (above $10 million). Due to the lack of sales, yields have
capital available for ‘safe’ opportunistic and prime assets buildings as a result of Melbourne’s Stage 4 lockdown. remained steady with no significant shift witnessed
in the Melbourne Metropolitan Market, with many investors to date. However, occupancy levels, and impacts to
seeking offices located in core locations with long WALE’s However, one significant transaction during this period face rents, incentives and let up times, are likely to
to quality tenants. was the Bunnings deal at Growthpoint’s newly completed have a negative impact on secondary capital values in
building at Botannica Business Park. 2021. Beyond this, we expect good capital growth as
Metropolitan market demand conditions recover and
potentially outperform pre-COVID-19 levels.
Generally, valuation headline prices have remained
relatively steady with cap rates remaining firm across the
Transaction Overview: Metropolitan markets due to the lack of market activity.
2020 vs 2019 (30 Nov YTD) Major changes to valuations have been seen in discount
rates firming which reflects changes in office leasing
2020 (%) 2019 assumptions including decreased rental growth forecasts
Transactions 8 -73.3% 30 and increased incentive forecasts over the cash flow
period.
Sales Volume $189,490,000 -76.5% $807,888,000
Average Initial Yield 4.43% -100bps 5.43%
Total NLA 32,035 -78.0% 145,703
Capital Values $5,915 6.7% $5,545A Vendor’s perspective
Sold by Colliers International:
The first half of 2020 saw vendors focusing on rent
abatement and rent relief for tenants and this has
173 Burke Road, Glen Iris
continued throughout the second half of 2020 to a lesser
extent. Date: May 2020
Price Circa $30,000,000
Melbourne’s Stage 4 lockdown period raised uncertainty
about working culture in the future, however following Vendor: Bingen Pty Ltd
restrictions easing we have seen confidence bounce back
Purchaser: Time & Place/ Fabcot
to the market with white collar workers returning to the
office and tenant demand increasing. Yield: 2.32%
There is still a reluctance by vendors to be the ‘first’ to NLA: 3,383sqm
test the market, however we do note that we have not $/sqm: Circa $8,868/sqm
seen forced selling/receivership sales this year as initially
expected at the beginning of the global pandemic. Situated on the high-profile corner of Burke Road
and Hope Street, the Commercial 1 zoned site
A Purchaser’s perspective boasted a site area of 4,305sqm. The property was
purchased by a developer who plans to develop
There has been limited Melbourne Metropolitan office stock the site for supermarket and multi-level residential
come to market in 2020 however purchaser’s behaviour use. The strong trading results of supermarkets
have changed, with purchaser’s now very selective on the throughout the global pandemic has driven
opportunities they engage on, running the ruler over sitting developers to pay premium prices above what
tenant’s harder than ever and looking critically at every office investors and occupiers are willing to pay for
aspect of the property more so than previous years. assets such as 173 Burke Road.
What does 2021 look like? Contact the Melbourne Metro experts:
We expect sales activity to increase significantly in Q1/ New developments in City Fringe locations such as
Q2 2021 due to pent up demand and the continuing low Cremorne, South Melbourne and Collingwood are expected
interest rate environment which will appeal to both owner to be targeted by CBD tenants looking for quality office
occupiers and investors. accommodation close to where they live. Institutional
investors will be active in the City Fringe following the
decentralisation expected from CBD tenants to the City Peter Bremner Ted Dwyer
Investor confidence is expected to quickly return for National Director Director
the metropolitan office market following an increase in Fringe.
+61 412 326 942 +61 411 312 165
occupancy, rental abatements finishing up and pent up
supply and demand following a relatively quiet 2020
for office investment sales. Following the Government
stimulus packages winding down, we expect to see more
tenants and vendors to be placed under financial stress,
with receivership sales likely to occur. Rachael Clohesy
Associate Director
+61 466 918 158Queensland
Brisbane & Gold Coast
End of Year Review 2020 How has 2020 shaped the market? A Vendor’s perspective
Transactions in 2020 can be very much characterised as We are noticing a divergence in yields, with significant In the first eights months of this year most vendors
pre-and post-COVID-19; all transactions which settled in capital flight into long WALE, defensive, income-stabilised opted to withdraw their assets from sale, or those who
Q1 exchanged in late 2019. Since the onset of COVID-19 assets putting downwards pressure on yields for these were considering a sale hit pause on this process. With
there have been 2 CBD Office Middle Market transactions assets. Conversely, short WALE assets with higher a substantial lack of investment-grade assets on the
negotiated and settled post-COVID in Brisbane, and one vacancy and elevated tenant risk profiles are now being market in the first half, supply has been tight whilst capital
each on the Gold Coast, Toowoomba, Sunshine Coast and priced more conservatively by the market, and thus yields available for investment remains high. Those vendors
Townsville. and capital values are both softening for secondary assets who’ve committed to sale processes in Q3 & Q4 have
as the leasing risk is re-priced. experienced elevated levels of enquiry in their assets.
However, Colliers International have participated in, and
are aware of a number of off-market transactions which Face rents are being supported, however our leasing
are expected to settle by the end of Q4. The most active team advise that incentives have begun to increase and a
purchaser groups have again been syndicators and private number of tenants have indicated they are reviewing their
investors, driven by a desire for yield and with access footprints beyond current expiry.
to fixed three and five year debt at unprecedentedly
low levels. We are experiencing strong enquiry from In the Brisbane market the most active tenant size is sub-
syndicators, with almost all of our clients in this sector 500sqm SME’s, with the median lease deal being 360-380
indicating they are experiencing a highly liquid capital sqm. Our clients holding well presented B-grade assets
raising environment. which cater to these tenants have been able to capitalise
on this demand, and generate positive leasing momentum
against the trend in the A and premium-grade space.
Transaction Overview:
2020 vs 2019 (30 Nov YTD)
2020 (%) 2019
Transactions 14 -53.3% 30
Sales Volume $549,679,545 -19.2% $680,072,156
Average Initial Yield 6.79% 133bps 7.12%
Total NLA 80,360 -39.2% 132,217
Capital Values $6,840 33.0% $5,144A Purchaser’s perspective
Sold by Colliers International:
The overwhelming sentiment we are receiving from
purchasers is that they are growing frustrated with the
33 Herschel Street, Brisbane
lack of ‘real’ opportunities in the market – there have been
a number of assets put in front of purchasers in which the
vendors were reluctant to the sale discussion. Anecdotally Date: September 2020
we are aware of several purchasers who have expended
Price $9,250,000
time and costs pursuing opportunities that weren’t really
there, and hence the feedback we have received is that Vendor: Asty Pty Ltd (HNW Private)
most groups will now focus only on assets where the
vendor is genuine. Purchaser: Maple Development Group
Yield: 6.27%
With highly liquid capital markets and lack of investment-
grade opportunities for sale at an institutional level, we NLA: 1,749
are also seeing some of the larger fund managers pivot
$/sqm: 5,288/sqm (NLA)
towards smaller assets and both metropolitan and regional
markets.
Colliers International Asia Markets and Middle
Markets team were pleased to introduce a
What does 2021 look like? mainland-Chinese backed developer to this asset on
an off market basis. The purchaser was attracted
With Queensland state borders having opened on In the Brisbane CBD and Metropolitan Markets we expect to the infrastructure development underway in the
December 1 and the level of capital available for investment to see brought to market several assets held by value- North Quay precinct. The purchaser is considering
to remain high for the foreseeable future, our forecast for add investors who have successfully stabilised and a number of development outcomes for the site
the Queensland Middle Markets sector in 2021 is positive. repositioned these holdings into core-plus investments. including a boutique office project.
Syndicators in particular will be active as they experience Competition for core assets with credit-quality tenant
a highly liquid capital raising environment, and already covenants will remain strong and we may see some Contact the Queensland experts:
in 2020 we have witnessed a number of new groups firming of yields in this sector.
entering the Queensland market and we expect this trend
to continue. At a macro-level elevated levels of inbound migration
from interstate are expected, particularly into the
More than ever our outlook is contingent upon the leasing seachange markets such as the Gold and Sunshine Coasts,
sector and tenant space demands as we expect to see Toowoomba and North Queensland. Accordingly we Sam Biggins Hunter Higgins Tom O’Driscoll
headwinds in certain Metropolitan Markets and CBD anticipate more capital flowing into office assets in these Director Director Director
sectors, particularly assets which cater to larger corporate markets with private HNW investors and syndicators being Brisbane Brisbane Brisbane
occupiers which have adopted a semi-permanent WFH the most active. +61 410 979 075 +61 406 997 936 +61 438 510 573
policy. Assets with higher vacancy or a weaker forward
occupancy outlook will be more conservatively priced Our final anticipation is the staggered return of Asian
as incentive and let up assumptions increase, however capital, which has typically accounted for 35-40% of office
the level of opportunistic capital seeking value-add transactions annually. Those groups with local operations
investments may partially offset this softening. or investment partners will be first movers with new
capital still being heavily influenced by the ability of a Steven King James Crawford
decision-maker to enter the country. Director in Charge Director
Gold Coast Gold Coast
+61 417 789 599 +61 438 262 497Australian Capital Territory
Canberra
End of Year Review 2020 How has 2020 shaped the market?
The Canberra office market has benefited significantly Canberra’s vacancy rate has continued its measured Office values have subsequently remained somewhat
from its exposure to the Commonwealth Government who decline to 9.9%, which is worth noting as the lowest level stable in Canberra and in some instances demonstrated
occupies ~50% of all office NLA, subsequently sheltering since 2012. Landlords continue to closely monitor the uplift, with the ongoing compression in capitalisation rates
landlords from any potential volatile swings in vacancy outcome of several significant Commonwealth Government offsetting increasing allowances for incentives, tenant
rates, incentives and rents. It is arguable that Canberra’s briefs for either new premises or to renew in current downtime and lower-than-average growth rates.
reliance on the Government has effectively ‘crisis proofed’ accommodation. The outcome of these briefs will have a
the office market and minimised investor exposure, as material impact on the CBD office market in particular and
evidenced by the measured growth over the past 15-20 create a raft of potential divestment opportunities in 2021. A Vendor’s perspective
years despite global influences.
Canberra has been widely predicted as one of the few Vendors have faced the dilemma in H2 2020 of whether to
In contrast to our national counterparts, it is expected that office markets likely to see positive rental growth in 2020, hold quality assets, which often underpin their portfolios,
for the 2020 calendar year Canberra will have witnessed despite the impacts of COVID-19. or look to capitalise on the significant buy-side demand
positive - albeit minimal - rental growth and further that has emerged for Canberra assets and the likely price
compression in capitalisation rates. There have been limited transactions that confirm the premiums achievable.
acknowledged tightening in capitalisation rates, however
based on the significant off-market buyer activity, low The overwhelming response has been for vendors to
levels of available debt and record offers tabled for Middle delay campaigns and revisit in 2021; however, this is
Markets assets a further ~25-50bps in yield compression increasing the likelihood of numerous assets being offered
has occurred throughout 2020 for specific assets. to the market simultaneously in Q2 & Q3 2021. Proactive
vendors are presently considering off market approaches
Transaction Overview: or positioning assets for early 2021.
2020 vs 2019 (30 Nov YTD)
2020 (%) 2019
Transactions 6 -25.0% 8
Sales Volume $103,360,000 -73.0% $382,526,281
Average Initial Yield 6.62% -61bps 7.23%
Total NLA 17,283 -79.2% 82,995
Capital Values $5,980 29.8% $4,609A Purchaser’s perspective
Sold by Colliers International:
Purchaser behaviour has remained somewhat consistent
with the H1 activity for Canberra Middle Markets assets.
1 Thynne Street, Bruce
There continues to be unprecedented levels of enquiry Date: March 2020
from both domestic and offshore sources seeking top-
Price $39,300,000
tier, long-WALE investments that represent an effective
annuity during a volatile 2020. The ACT market, being Vendor: B&T Investments Pty Limited
underpinned by the Commonwealth, arguably presents
Australia’s most stable investment proposition, and Purchaser: KM Property Funds
has become a major focus for capital sources in 2020. Yield: 6.28%
Notwithstanding, however, we have seen increasing
appetite for ‘value-add’ opportunities again in H2, with NLA: 5,848sqm
investors taking a positive long-term outlook for the
$/sqm: $6,720
Canberra leasing market.
What does 2021 look like? 1 Thynne Street, Bruce completed in H1 remains the
standout sale for Canberra’s Middle Markets in 2020.
As at November 2020 we have witnessed six transactions
in the Middle Markets space amounting to a total sales The 5,848sqm office asset was 100% underpinned
volume of $103 million. The rolling five-year average for by the AIHW, with a 9+ year WALE with fixed annual
Canberra suggests ~9-10 major deals per annum with an growth of 3.00% p.a. Completed off-market by Colliers
approximate average volume of ~$370 million. International, the result reflects the strong demand for
Our team predicts that the Canberra Middle Markets will secure income and top-tier assets in the ACT, despite
At the start of 2020 our Canberra Middle Markets team return to the average annual transaction numbers, with the impact of COVID-19.
had predicted a potential record year for transactions the possibility of exceeding this amount based on current
based on the outcome of some impending Government vendor and purchaser activity. With a number of mooted
briefs, key tenant renewals and the attractive economic campaigns set for early 2021 we can expect strong listing
conditions underpinning the ACT market. Whilst this has activity for long-WALE and value-add opportunities and Contact the Canberra experts:
not played out due to the impact of COVID-19, Canberra are also likely to see a number of major assets (>$100m)
has remained an exceptionally popular investment offered in H2 2021.
destination as evidenced by the strong international buyer
interest and 15+ major off-market offers sourced by the Canberra is well poised to weather major challenges and
Colliers team in 2020, exceeding $1.8b. outperform National counterparts in times of uncertainty.
We expect that in 2021 Canberra will remain as one of
Due to uncertainty in other major markets, the the most highly sought-after investment destinations, Matthew Winter Paul Powderly
overwhelming trend in Canberra has been for vendors and a worthwhile consideration for all capital sources. Director State Chief Executive
to focus on stabilising their assets rather than offload, For vendors it is worth considering whether now is the +61 432 344 684 +61 413 122 877
typically due to these featuring secure Government tenant best time to capitalise on this unprecedented interest
covenants that underpin their office portfolios and provide and record low yields or risk competition with a flurry of
ongoing cashflow. potential assets in H2 2021 and beyond.South Australia
Adelaide
End of Year Review 2020 How has 2020 shaped the market?
We have witnessed $320 million transact across Face rents have remained firm in Adelaide, despite a slight Adelaide has a significant supply of new stock coming
Adelaide’s CBD and Metro office markets. A vast majority increase in tenant incentives. Adelaide’s “self proclaimed” to market with 108 Wakefield Street (13,000sqm), 83
of these transactions were legacies of pre-COVID-19 defensive office market, has classified 56% of tenants Pirie Street (30,000sqm), 62 Currie Street (9,000sqm),
negotiations, however investors have continued to seek out (largely government) as ‘defensive’ against COVID-19. Innovation Centre (35,000sqm), Festival Plaza
South Australia as a safe place to live, work and invest - (40,000sqm) and 60 King William Street (39,000sqm) all
following the state’s proactive response to the pandemic. It has become obvious that a two-tiered market exists potentially becoming available between 2020 and 2023
We have never witnessed more interest in the Adelaide in Adelaide as a result of COVID-19. Firstly, we have (total of 166,000sqm) and therefore we expect a flight to
market, particularly from East Coast and Singaporean witnessed a slight softening in yields for secondary quality for office tenants exciting second grade back fill
based investors. grade assets, evident in the sale of 75 Hindmarsh Square space.
which sold at a slight discount to its pre-COVID-19 levels.
Secondly, defensive assets (i.e. those leased to government During the height of the pandemic, there were limited
or health occupiers) continue to be highly sought after and transactions, making it difficult for valuers to determine
yields have subsequently compressed. whether yields had softened. Valuers were making pricing
adjustments ‘below the line’ on properties with vacancies.
Adelaide hasn’t witnessed the same levels of sub-lease This included increasing the period of time taken to lease
space which has occurred on the Eastern Seaboard, which these vacancies and increasing incentives.
has helped sustain face rentals despite a slight increase in
incentives. Following a number of recent transactions, we have now
gathered substantial evidence to suggest that there has
been softening in yields across the secondary office market
Transaction Overview: and a tightening in yields for A-grade assets, with high
2020 vs 2019 (30 Nov YTD) quality, defensive tenants.
2020 (%) 2019
Transactions 14 -26.3% 19
Sales Volume $320,833,333 -38.0% $518,105,000
Average Initial Yield 6.81% -27bps 7.08%
Total NLA 80,466 -38.4% 130,711
Capital Values $3,987 0.6% $3,964A Vendor’s perspective
Sold:
Across the second half of the year, we witnessed 75 Hindmarsh Square
Vendor’s consolidating their focus to retain tenants, in
an attempt to retain the value of their assets. We have
seen limited on-market activity for CBD assets, with Date: August 2020
most deals being struck off-market. Only one on-market Price $40,500,000
middle markets campaign took place, being that of 39-
41 Veitch Road, Osborne. The asset had a 10 year lease Vendor: Private Syndicate
to a Commonwealth Government tenant with pricing
Purchaser: Harmony
expectations in the range of 5.1%.
Yield: 6.31%
Vendor confidence has grown throughout the fringe, as
we expect the following assets to transact before the year NLA: 4,795sqm + 72 basement car parks
is out; 20 Greenhill Road, Wayville, 119 Greenhill Road, $/sqm: $8,446
6 Greenhill Road, 120 Greenhill Road, Wayville and 64
Greenhill Road, Wayville.
Released to the market in early 2020 via an
Expressions of Interest process.
A Purchaser’s perspective
The asset received wide ranging interest and entered
Purchasers continue to chase high quality office assets due diligence with an interstate client in the range
with security of income being paramount. Financiers have of $42,500,000. This deal subsequently fell over
become more cautious in providing funding for office and Harmony (a South Australian based syndicate)
purchases, particularly for assets with vacancy or capital acquired the building at $40.5m.
expenditure risk. Therefore, there has been a flight to
quality in the Adelaide Middle Markets space.
Contact the Adelaide experts:
What does 2021 look like?
With such a large proportion of office transactions taking Whilst to date, we haven’t witnessed any distressed sales
place over the course of the preceding five years, with taking place, banks have taken a more cautious approach
some assets trading multiple times, 2021 is set to be an since the Royal Commission and we expect to see more of Alistair Mackie Paul van-Reesema
interesting year. We are aware of two major CBD office these opportunities become available in 2021. National Director National Director
towers that may come to market in Q1 of 2021 and these +61 412 817 977 +61 412 806 994
sales will no doubt set the scene for the balance of the
year.
The recent rate cut by the RBA is likely to be reflected in
yield compression in the Adelaide market for prime grade
assets, which could fuel further transactions in 2021, Tom Isaksson Jordan Schmidt
however it is expected that transaction volumes won’t Associate Director Associate Director
reach the levels we have experienced in the preceding five +61 422 154 570 +61 403 422 762
years.Adding Value to
Commercial Assets in 2021
2020 has been a challenging year across CyberProtect Innovative Workplace Technology
Reducing Risk in Smart Buildings Elevating Tenant Experience and Engagement
the board with major shifts in how we
work and interact with our commercial Landlords and Tenants are benefiting from advances Introducing Neighborhood Curated by Colliers. Developed
buildings. in technology that turn properties into smart buildings. with the goal of using technology to make workplaces
Millions of sensors have been deployed - the “Internet as intuitive as everything else in our lives. Colliers
We’re pleased to see commercial occupancy rates of Things”. These sensors communicate with modern Neighborhood, designed by Lane Technology, is an industry
continuing to increase, with metro markets currently sitting smart building control systems to improve security defining platform that makes it easy to offer innovative
between 70-90%, and whilst the CBD has been slower to and surveillance, enable environmental controls, while workplace experiences in any building.
return, we’re now seeing occupancy sitting around 40%. improving efficiency and sustainability. Remote monitoring
and control provides further benefits, with systems Like Colliers International, Colliers Neighborhood knows
Feedback from our tenants suggests this is due to staff communicating centrally over the Internet. the value of a seamless tenant experience and aims
avoiding longer commutes on public transport with less to provide tenants with a digital passport to navigate
access to car parking, and the larger multi-national Understanding the Risks workspaces and access amenities.
corporations receiving directive from overseas head offices
that staff are to continue working from home temporarily. However, these benefits are not risk-free; building Clients benefit from integrated building systems available
There was also a significant reduction in the number systems and IoT devices can be vulnerable to attack, on a single dashboard to streamline day-to-day operations.
of tenants applying for COVID-19 rent relief during the particularly where they interface with corporate IT and Colliers Neighborhood can be white labelled and branded
October to December extension period, and are already communications systems. Security weaknesses can lead to suit the positioning strategy for each office asset within
seeing some tenants making contributions to the deferred to a range of attacks - ransomware, financial losses, brand your portfolio.
rental payments. damage, loss of data and Intellectual Property, security
breaches and denied access.
Through this unprecedented time, we’ve remained Attract and retain tenants
focused on bringing a dynamic and innovative approach Colliers International has partnered with cyber security Save time and money
to managing our clients’ portfolios to maximise revenue, expert Convergint Technologies, to create a portfolio of
Increase data-driven decision making
operational efficiencies and asset performance, offering products and services that can assist our clients to meet
innovative workplace technology to drive tenant these challenges. Our team includes property experts Create leasing differentiators
engagement, reducing risks in smart buildings and who understand technology, and technology experts who Elevate your asset
realigning our procurement strategy to help owners understand property. Together with our clients’ IT teams
secure more favourable property insurance premium and we can identify risks, recommend best practice solutions, Deliver the future of work
policy terms. monitor and protect your technology environment 24/7.
The opportunity for integration of building control systems
into Colliers Neighborhood is extensive and is dependent
on the final arrangement of services.You can also read