Stock Prices and Economic Activity in the Time of Coronavirus - Steven J. Davis , Dingqian Liu, and Xuguang Simon Sheng
←
→
Page content transcription
If your browser does not render page correctly, please read the page content below
WORKING PAPER · NO. 2020-156

Stock Prices and Economic Activity
in the Time of Coronavirus
Steven J. Davis , Dingqian Liu, and Xuguang Simon Sheng
JUNE 2021

 5757 S. University Ave.
 Chicago, IL 60637
 Main: 773.702.5599
 bfi.uchicago.edu
Stock Prices and Economic
 Activity in the Time of Coronavirus
 Steven J. Davis*, Dingqian Liu† and Xuguang Simon Sheng‡

 15 June 2021

 Abstract
Stock prices and workplace mobility trace out striking clockwise paths in daily data from mid-
February to late May 2020. Global stock prices fell 30 percent from 17 February to 12 March,
before mobility declined. Over the next 11 days, stocks fell another 10 percentage points as
mobility dropped 40 percent. From 23 March to 9 April, stocks recovered half their losses and
mobility fell further. From 9 April to late May, both stocks and mobility rose modestly. This
dynamic plays out across the 35 countries in our sample, with notable departures in China, South
Korea, and Taiwan. The size of the global stock market crash in reaction to the pandemic is
many times larger than a standard asset-pricing model implies. Looking more closely at the
world’s two largest economies, the pandemic had greater effects on stock market levels and
volatilities in the U.S. than in China even before it became evident that early U.S. containment
efforts would flounder. Newspaper-based narrative evidence confirms the dominant – and
historically unprecedented – role of pandemic-related developments in the stock market behavior
of both countries.

JEL Classifications: E32, E44, E65, G12, G18, I18

Keywords: stock prices, economic activity, coronavirus, COVID-19, lockdowns, China

Acknowledgements: We thank Emine Boz and Linda Tesar (editors), two anonymous referees,
Stefano Giglio and Li Su (discussants), Francois Gourio, Prachi Mishra, Xiao Wang, Ivan
Werning and participants at the IMF’s 21st Jacques Polak Research Conference and the Renmin
University conference on “Structural Reforms and Economic Developments in the Face of
Rising Uncertainty” for many helpful comments and suggestions. Davis thanks the U.S. National
Science Foundation (SES 20180940), the Becker Friedman Institute, and the Chicago Booth
School of Business for financial support. An earlier draft of this paper circulated as “Stock
Prices, Lockdowns, and Economic Activity in the Time of Coronavirus.”

*
 Booth School of Business, University of Chicago, USA, Steven.Davis@chicagobooth.edu
†
 Department of Economics, American University, USA, dl5165a@american.edu
‡
 Department of Economics, American University, USA, sheng@american.edu
1. Introduction
 Stock markets around the world cratered after mid-February 2020, as the coronavirus
pandemic spread beyond China. Value-weighted prices dropped 40 percent from 17 February to
23 March in the advanced economies (Figure 1). Emerging market and developing economies
(EMDEs) saw an even steeper drop. This period also exhibits historically high levels of intraday,
daily, and implied stock market volatilities against a backdrop of extreme economic uncertainty.1
Globally, the market recovered more than half its losses from 23 March to late May. The U.S.
market recovered 73 percent of its losses by the end of May 2020 and 95 percent by 22 July. 2

 Figure 1. Global Stock Prices, Percent Deviations from 17 February 2020
 10

 0

 -10

 -20

 -30

 -40

 -50

 Global Economy Advanced Economy Emerging Market and Developing Economy (EMDE)

Notes: We plot the cumulative percent deviation in average equity prices from 17 February 2020
to the indicated dates. In computing averages, we weight each country’s deviation by its market
capitalization on 31 December 2018. Before averaging, we linearly interpolate country-level
values between nearest trading dates to fill in missing values. The sample for this figure contains
20 advanced economies (89% of overall market capitalization) and 14 EMDEs according to
IMF’s classification. We omit China in this plot but show it separately below.

 Recent stock market behavior is also remarkable in other respects. Using text-based
methods to characterize the drivers of stock market jumps and volatility, Baker et al. (2020a)
find that previous pandemics, including the Spanish Flu, had modest effects on the U.S. market.

1
 See Alan et al. (2020) for equity market volatility measures based on GARCH models and intraday
prices for dozens of countries, Baker et al. (2020a) for U.S. volatility measures that stretch back to 1900,
the website at www.PolicyUncertainty.com for newspaper-based economic uncertainty measures for more
than 25 countries based on Baker, Bloom and Davis (2016), and Altig et al. (2020) for a variety of
forward-looking measures of economic uncertainty for the United States and United Kingdom.
2
 Calculated from the Wilshire 5000 Total Market Full Cap Index [WILL5000INDFC], retrieved from
FRED, Federal Reserve Bank of St. Louis on 25 July 2020. Because U.S. markets were closed on 17
February, our start date is 18 February in these calculations.
In one exercise, they examine all 1,143 daily U.S. stock market moves greater than 2.5 percent,
up or down, since 1900. Next-day newspaper accounts attribute not a single jump before 2020 to
pandemic-related developments. In glaring contrast, newspapers attribute 24 of 27 daily U.S.
jumps between 24 February and 30 April 2020 to COVID-19 and policy responses.3

 Our first goal in this paper is to document some striking patterns in the temporal
relationship of stock prices to economic activity in the early stages of the COVID-19 pandemic.
We do so by examining daily movements in national stock prices and economic activity in 35
countries around the world. Stock prices and workplace mobility (a proxy for economic activity)
trace out clockwise paths in daily data from mid-February to late May 2020. Global stock prices
fell 30 percent from 17 February to 12 March, before mobility declined. Over the next 11 days,
stocks fell another 10 percentage points as mobility dropped 40 percent. From 23 March to 9
April, stocks recovered half their losses and mobility fell further. From 9 April to late May,
mobility rose modestly and stocks recovered further. The same dynamic plays out across the vast
majority of the 35 countries in our sample, with a few notable exceptions that we highlight and
discuss.

 Common global dynamics are a pronounced feature of our data. Thus, we also ask
whether national stock prices have predictive value for own-country economic activity in the
early stages of the pandemic, conditional on global developments. They do. Another natural
question is whether stock prices responded too slowly to information that presaged a pandemic-
driven downturn. While we cannot rule out this possibility, we make several observations that
suggest it was reasonable, as of early and mid-February 2020, for investors to anticipate a
modest impact of COVID-19 on economic activity and asset prices.

 After establishing that stock prices foreshadowed the pandemic-related drop in economic
activity, we ask whether the size of the market crash is proportionate to the pandemic’s
prospective economic impact. We show that the market crash was many times larger than a
standard asset-pricing model implies. In this light, the dramatic recovery of U.S. and global stock
prices from late March onwards can be seen as correcting the market’s initial overreaction to
news about fundamentals, as gauged by the implications of a standard model.

 We also consider China’s distinctive pandemic experience in comparison to that of the
United States and in relation to countries with successful early-stage responses. Perhaps because
COVID-19 erupted first in China, the dynamic between stock prices and mobility played out
differently there. In particular, China experienced coincident drops in stock prices and mobility
during the early phase of its pandemic recession. Unlike most other countries, our mobility
measure for China returns to its pre-pandemic baseline by late April, and Chinese stock prices
surpass pre-pandemic levels by the second half of April. We also show that the COVID-19
pandemic had much smaller effects on stock prices and return volatilities in China than in the

3
 Other works that highlight stock market responses to the pandemic include Alfaro et al. (2020), who
find that changes in the anticipated trajectory of COVID-19 infections predict next-day U.S. stock returns;
Amstad et al. (2020), who find that a “COVID-19 risk attitude” index derived from internet searches
helps explain national stock market moves from mid-February to late April; and Alan et al. (2020), who
find that the number of active COVID-19 cases and the curvature of the active-case trajectory help predict
stock market volatilities in a cross section of countries.

 3
United States. The U.S. market shows greater sensitivity to pandemic-related developments well
before it became evident that its early containment efforts would flounder.

 Using next-day newspaper accounts, we also classify the (perceived) reasons for large
daily moves in Chinese stock markets from 1990 onwards. Before COVID-19, leading Chinese
newspapers attribute not a single such move (out of hundreds) to pandemic developments or
news about infectious diseases. From 2 January to 30 April 2020, Chinese newspapers attribute
all 6 daily stock market moves greater than |3%| on the Shanghai Stock Exchange and all 8 daily
moves greater than |3.8%| on the Hang Seng to the economic fallout of the pandemic or policy
responses to it.4 These results closely parallel findings in Baker et al. (2020a) for the United
States, but the incidence of large daily moves in the U.S. stock market during the coronavirus
pandemic is about four times greater.

 Our study relates closely to a growing literature on the dynamics of stock prices,
economic activity, and policy actions during the coronavirus pandemic. In addition to papers
mentioned above, notable contributions include Caballero and Simsek (2021), Cox et al. (2020),
Deb et al. (2020), Giglio et al. (2020), Gormsen and Koijen (2020), Landier and Thesmar (2020)
and Zarembra et al. (2020).5 Relative to this literature, we contribute in several ways: First, by
documenting the predictive content of national stock prices for near-future economic activity in
the early stages of the pandemic. Second, by showing that the market crash in reaction to the
pandemic is too large to be rationalized by a standard asset-pricing model. Third, by developing
several pieces of evidence on the distinctive character of the Chinese stock market reaction to the
pandemic, highlighting both contrasts and similarities to the U.S. case. Fourth, by identifying
other countries with distinctively favorable early-pandemic experiences and contrasting key
aspects of their COVID-19 policy responses to that of China.

 2. Stock Prices and Economic Activity as the Pandemic Unfolded
 A. Sources of Data for National Outcomes
 We integrate data from multiple sources. Our high-frequency proxy for national
economic activity is the percent workplace mobility deviations from baseline in Google’s
COVID-19 Community Mobility Reports. This measure reflects the frequency and duration of
visits to worksites relative to the own-country baseline. Google (2020) defines the baseline as the
median value, for the corresponding day of the week, during the 5-week period from 3 January to
6 February 2020. These data are available from 17 February onwards for 34 countries in our

4
 One might worry that newspaper accounts merely reflect the prevailing narrative of the day rather than
meaningful information about the true reasons for large daily stock market moves. Baker, Bloom, Davis
and Sammon (2020b) address this issue by validating their newspaper-derived explanations in several
ways. They also find that newspaper-based interpretations help predict future stock market volatility, even
when conditioning on a standard battery of controls for serial correlation in stock market volatility.
5
 Another rapidly growing literature explores the distinctive effects of the coronavirus pandemic on the
cross-sectional structure of firm-level equity returns. Examples include Albuquerque et al. (2020), Alfaro
et al. (2020), Davis, Hansen and Seminario (2020), Ding et al. (2020), Hassan et al. (2020), Pagano et al.
(2020), Papanikolaou and Schmidt (2020), and Ramelli and Wagner (2020).

 4
many-country sample but not for China. Appendix Figure A.1 plots the relationship between real
GDP growth and our workplace mobility deviation in a cross-section of countries.6

 We obtain national stock market index values on trading days from Global Financial Data
(GFD) at https://globalfinancialdata.com/ and other sources. For much of our analysis, we treat
each country’s value on 17 February 2020 as a baseline and measure percent deviations on date t

as , = ( , ) × 100, where ,0 is the stock market index value of country on 17
 ,0
February. When aggregating over countries, we weight by stock market capitalization values as
of 31 December 2018 from the World Bank’s World Federation of Exchanges Database.

 After merging these sources, we have daily data for 34 countries from 17 February to 21
May 2020. Ordered by stock market capitalization, there are 20 Advanced Economies (AE) in
our sample: The United States, Japan, United Kingdom, France, Canada, Switzerland, Germany,
Australia, South Korea, Netherlands, Spain, Singapore, Sweden, Belgium, Taiwan, Poland,
Ireland, New Zealand, Greece, Slovenia. There are 14 EMDEs: India, Brazil, South Africa,
Thailand, Malaysia, Mexico, Chile, Qatar, Turkey, Romania, Argentina, Kazakhstan, Hungary,
Croatia.7 We also have stock price data for China, which we merge to a different source of data
on mobility, as discussed below.

 Figure 2 displays percent workplace mobility deviations (WMD) for selected countries
and regions. We linearly interpolate WMD values between market trading days to remove the
effects of weekends and holidays. (Figure A.2 displays raw values.) Most countries experienced
tremendous drops in economic activity after early March. From 9 March to 9 April, the
weighted-average WMD value fell nearly half among the AEs and nearly 60 percent among the
EMDEs. Figure 2 also shows the WMD path for three “outlier” countries with relatively small
drops in economic activity: Japan, Sweden and South Korea.

 Figure 3 and Appendix Figure A.3 summarize the stringency of market lockdown
measures adopted by governments in reaction to the pandemic, as quantified in Hale (2020).
These figures show that the timing and severity of lockdowns differ substantially across
countries. The pandemic emerged first in China, and China also clamped down on economic
activity sooner than other countries. South Korea, Japan, and Taiwan also responded faster than
most other AEs but more lightly in Japan and Taiwan. Sweden responded later than other AEs
and with relatively light restrictions. Except for Japan, Sweden and Taiwan, all countries in our
sample eventually implemented a hard lockdown for at least one week, where we interpret
“hard” to mean a lockdown stringency index value of 70 or greater.

6
 As Egert et al. (2020) show, workplace mobility moves very similarly to other mobility measures such
as those that focus on transit stations, grocery stores and pharmacies, and retail establishments. They also
confirm that Google mobility measures correlate highly with aggregate activity in the first half of 2020, as
measured by quarterly GDP forecast revisions. Sampi and Jooste (2020) and Chen and Spence (2020) also
show that mobility-based measures proxy well for standard measures of economic activity.
7
 Our grouping follows the IMF at www.imf.org/external/pubs/ft/weo/2020/01/weodata/groups.htm.

 5
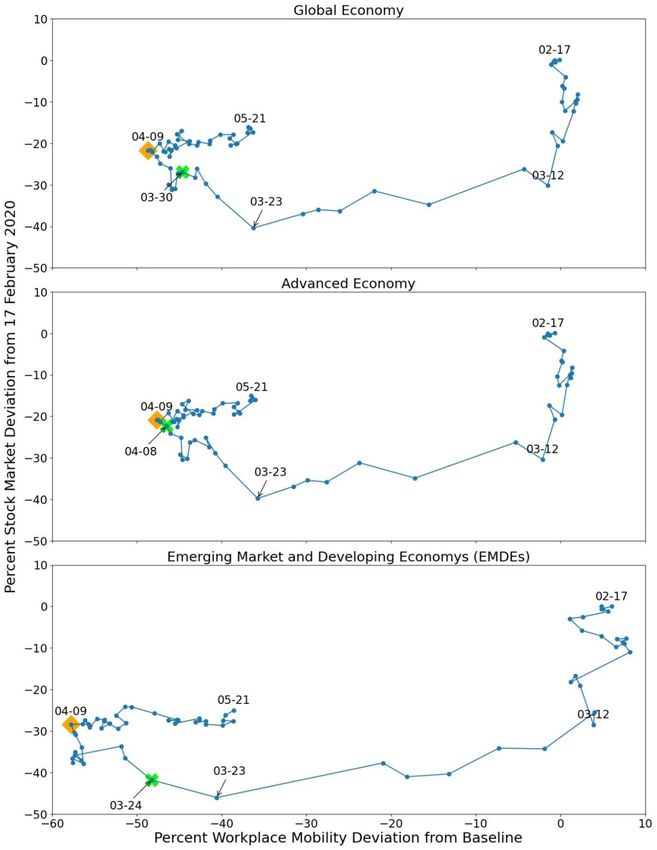
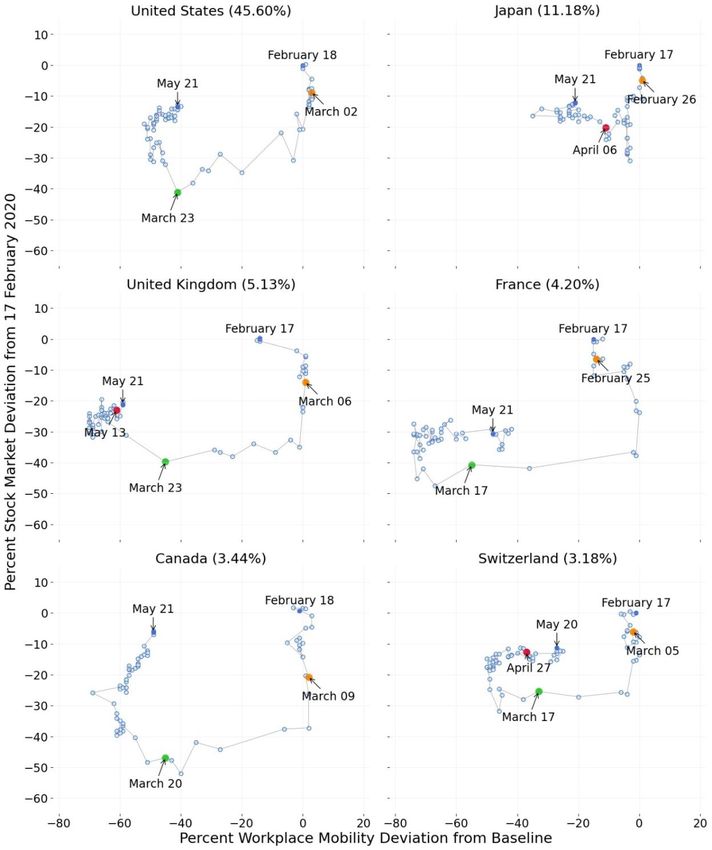
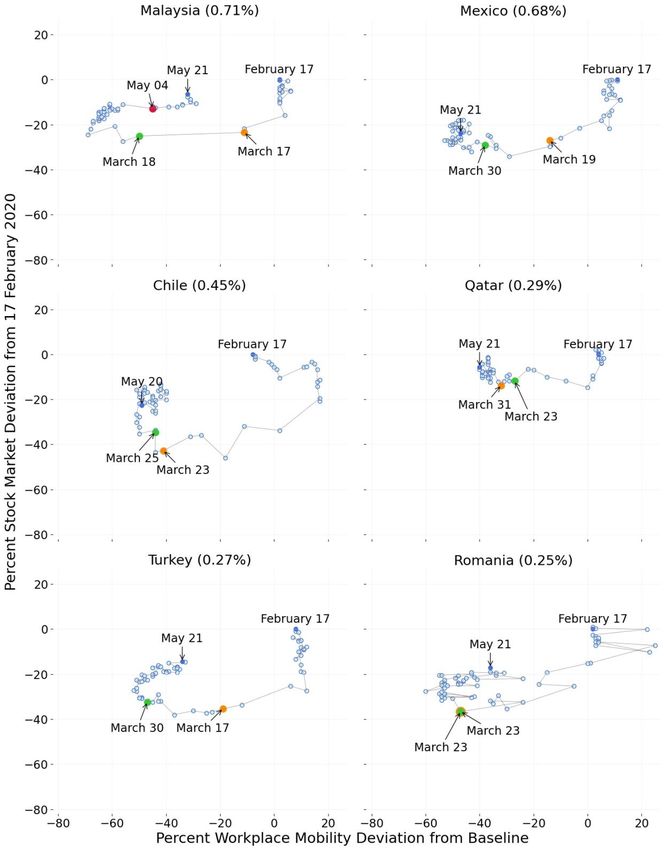
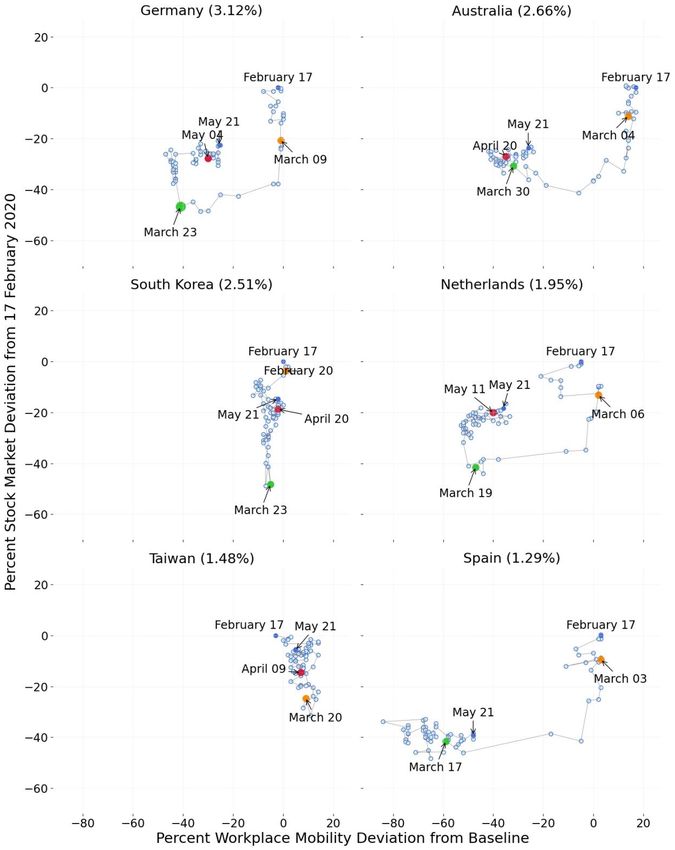
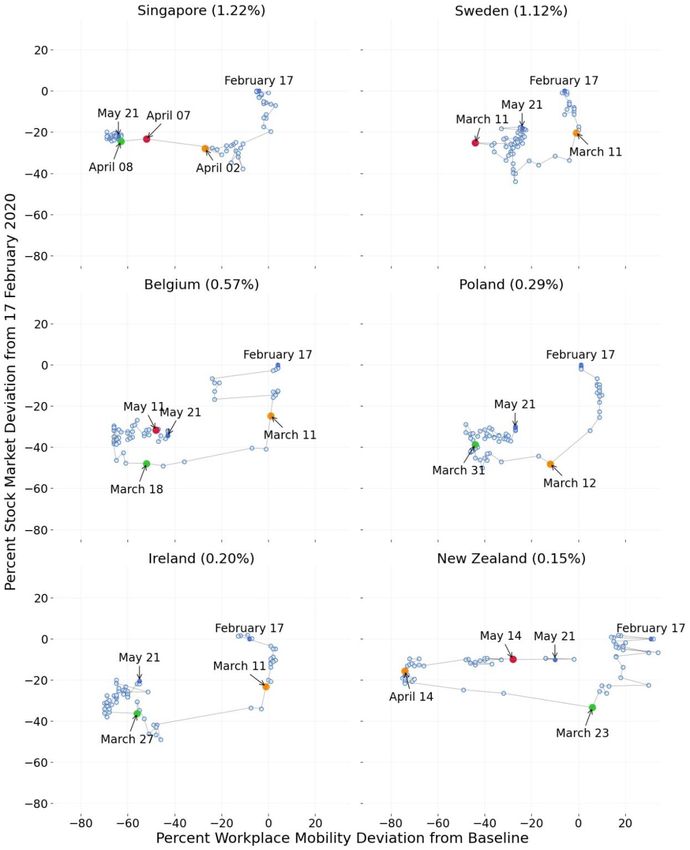
Figure 2. Workplace Mobility on Trading Days, Percent Deviation from Baseline
 20
 10
 0
 -10
 -20
 -30
 -40
 -50
 -60
 -70

 Advanced EMDE Japan
 Sweden South Korea China
Note: We obtain national data from Google (2020) for trading days, interpolate the national data
between trading days, and aggregate over countries using stock market capitalization. China’s
mobility data are from Baidu. China is not included in either Advanced economy or EMDE.

 B. The Time Paths of Stock Prices and Economic Activity
 Figure 4 shows that stock prices and workplace mobility trace out striking clockwise
paths in daily data from mid-February to late May 2020. Global stock prices fell 30 percent from
17 February to 12 March, before mobility declined. Over the next 11 days, stocks fell another 10
percentage points as mobility dropped 40 percent. From 23 March to 9 April, stocks recovered
half their losses and mobility fell further. From 9 April to late May, both stocks and mobility
rose modestly. The same dynamic plays out across the vast majority of the 35 countries in our
sample (Figure 5 and Figure A.4), with a few notable exceptions that we discuss later.

 While our evidence shows that collapsing stock prices clearly preceded the collapse in
economy activity, one could argue that a rational, forward-looking stock market would have
reacted sooner. Indeed, Shiller (2020) writes: “[T]he World Health Organization (WHO)
declared the new coronavirus ‘a public health emergency of international concern’ on January
30. Over the next 20 days, the S&P 500 rose by 3%, hitting an all-time record high on February
19. Why would investors give shares their highest valuation ever right after the announcement of
a possible global tragedy? … Why didn’t the stock market “predict” the coming recession by
declining before the downturn started?”

 We take Shiller’s question to be why didn’t stock markets react earlier to the possibility
of an impending economic disaster? And, in particular, why didn’t markets react shortly after the
WHO’s declaration on 30 January? There is a ready answer to this question: Most investors did
not see the novel coronavirus as a major risk to the economy of the sort that warranted a large

 6
devaluation in equity prices. Moreover, it is not obvious as of early February 2020, except in
hindsight, that they should have regarded the virus as a major economic risk.

 Figure 3. Economic Lockdown Stringency Index, 1 January to 21 May 2020.
 120

 100

 80

 60

 40

 20

 0

 Advanced Economy China South Korea Japan
 Sweden Taiwan New Zealand

Note: Data are from Hale (2020) and aggregated using stock market capitalization. The
stringency index exceeds 70 at some point for all countries except Japan, Sweden and Taiwan.

 In this regard, we make four sets of observations. First, the WHO declared a “public
health emergency of international concern” on five prior occasions since 2009.8 None of these
declarations triggered a market crash, nor did any of the underlying disease outbreaks unfold in a
manner that warranted a major drop in equity prices. Second, Baker et al. (2020a) show that no
infectious disease outbreak in the previous 120 years affected the U.S. stock market in a manner
that resembles its response to COVID-19. That includes the Spanish Flu of 1918-19, which
involved a U.S. excess mortality rate about three times greater than COVID-19 to date. It also
includes the influenza pandemic of 1957-58, which involved a U.S. excess mortality rate more
than one-third that of COVID-19 to date.9 Third, we provide evidence below that no previous
infectious disease outbreak (back to 1990) affected stock markets in mainland China and Hong
Kong in a manner that resembles their responses to COVID-19. That includes the SARS
outbreak in 2003. Fourth, at least in the United States, the economic contraction triggered by
COVID-19 has been much sharper than one would anticipate by extrapolating the impact of
previous pandemics over the past 120 years.10 These observations suggest it was reasonable, as
of early and even mid-February 2020, for stock market investors to anticipate a modest economic
impact of COVID-19 on economic activity and asset prices.

8
 See the Wikipedia entry for public health emergency of international concern, accessed 12 October
2020. The WHO formalized this type of emergency announcement in 2005, as discussed in WHO (2005).
9
 See Baker et al. (2020a) for our excess mortality data sources and calculations. Here, we use an updated
figure of 597,490 excess U.S. deaths from 7 March 2020 through 16 March 2021.
10
 See Baker et al. (2020a), Ferguson (2020), and Velde (2020) on this point.

 7

Figure 4. Time Path of Stock Prices and Workplace Mobility from 17 February to 21 May 2020

Note: The orange diamond marker highlights the date when the (weighted) global workplace
mobility deviation from baseline reached its lowest value. The green cross highlights the first
date when the weighted average lockdown stringency index first exceeds 70.

 8
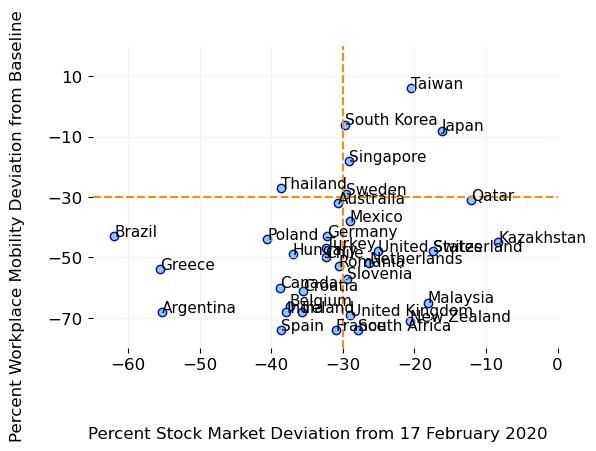
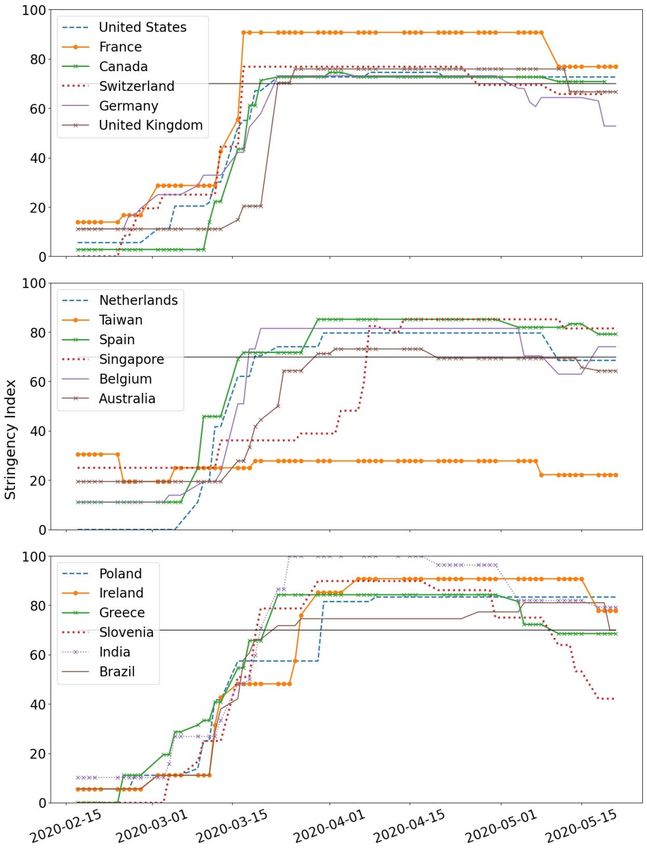
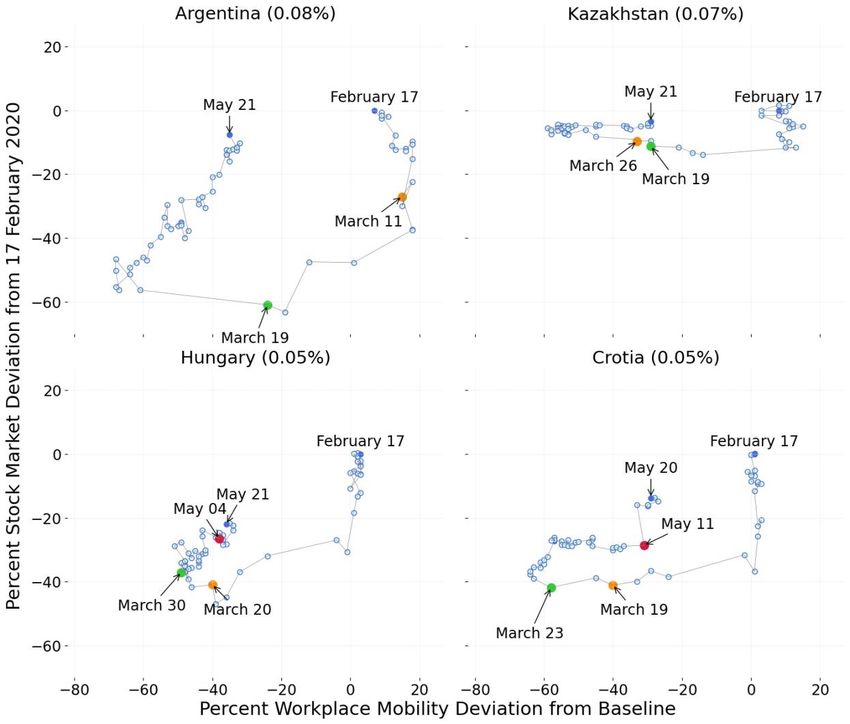
Figure 5. Time Path of Stock Prices and Workplace Mobility from 17 February to 21 May,
 Advanced Economies and EMDEs with Largest Market Capitalization (in parentheses)

 9
10
Note: An orange dot marks the first confirmed COVID-19 death in the country, a green dot
marks the first date with a stringency index value of 70 or more, and a red dot marks the date on
which the stringency index first drops below 70.

 11
C. National Stock Prices Predict Country-Specific Drops in Economic Activity
 As we have seen, common global dynamics are a pronounced feature of stock prices,
workplace mobility, and lockdown stringency measures during the period in which global-
average values collapse.11 That raises the question of whether national stock prices have
predictive value for own-country economic activity, conditional on global developments. We
take up that question now.

 To do so, we regress workplace mobility deviations on lagged stock price deviations in
our panel of 34 countries. Our sample for this analysis contains all workdays from 12 March to
23 March, where “workdays” refer to dates on which the country’s stock market traded. For
explanatory variables, we linearly interpolate between trading days to fill in weekend and
holiday values. We choose 23 March as the sample endpoint for this analysis, because that is
when stock prices in most countries began to increase even as mobility fell further. We run two
sets of regression:

 , = × , −1 + + + , (1)
 ∆ , = ∑6 =1 × ∆ , − + + , (2)

 Table 1 reports the results. The first three columns provide strong statistical evidence that
lower national stock prices yesterday foreshadow lower own-country workplace mobility
deviations today. To interpret magnitudes, consider Column (3). The coefficient on the lagged
own-country SMD variable says: If yesterday’s national stock price is 10 percentage points
below its baseline value, the model predicts that today’s mobility deviation is 3.7 percentage
points below its baseline, conditional on common global developments. This is a large effect,
especially in light of the fact that many countries in our sample experienced SMD values 30
percentage points or more below baseline as of 22 March. 12

 Columns (5)-(6) implement versions of regression (2) and confirm the predictive power
of national stock prices for own-country economic activity during the mid-March period. In
particular, the results say that changes in stock prices over the previous six days predict same
direction changes in today’s economic activity. To interpret magnitudes, consider Column (6).
The results say that a one-percentage drop in national stock prices on each of the previous six
trading days predicts a 6.4 percentage point drop in today’s economic activity, as measured by
WMD, conditional on common global developments. This is also a large effect. Appendix Table
A.1 shows that we obtain very similar results when using mobility deviations for transit stations,
or for retail and recreation outlets, as our proxy for economic activity.

11
 Regressing national stock price deviations from 17 February to 21 May on a full set of day fixed effects
yields an adjusted R-squared value of 0.85. Analogous regressions yield an adjusted R-squared value of
0.85 for workplace mobility deviations, 0.94 for the stringency of market lockdown measures, and 0.24
for COVID-19 deaths per million persons (deaths data from Johns Hopkins University, 2020).
12
 Column (4) shows a statistically insignificant coefficient on lagged SMD when controlling for country
and time effects. Since our sample entails a short panel dimension, with at most 8 observations per
country, the inclusion of country and time effects pushes the data very hard. In this regard, recall that both
SMD and WMD are already demeaned at the country level, since they are expressed relative to country-
specific baselines. So, we do not think Column (4) is particularly informative. We include it here in case
the reader has a different view.

 12
Table 1. Regressions of Workplace Mobility Deviations on Lagged Stock Price Deviations,
 Daily Country-Level Data from 12 March to 23 March for the Dependent Variable
 , = Percent Workplace Mobility Deviation in Country c on Trading Day t
 , = Percent Stock Price Deviation in Country c on Trading Day t
∆ , = , − , −1
 Dependent Variable: , Dependent Variable: ∆ ,
 Coefficient Estimates
 (1) (2) (3) (4) (5) (6)
 *** *** ***
 0.86 0.85 0.37 -0.05

 (0.09) (0.09) (0.08) (0.10)
 ∑6 =1 1.50*** 1.07***
 (0.33) (0.33)
 8.22** -0.56
 Intercept
 (3.35) (1.15)
 Country Fixed Effects NO YES NO YES NO NO
 Time Fixed Effects NO NO YES YES NO YES
 Observation Count 265 265 265 265 265 265
 Adjusted R2 0.24 0.77 0.66 0.90 0.18 0.49

Notes: The sample includes all workdays from 12 March to 23 March for 34 countries, where
“workdays” refers to dates on which the country’s stock market traded. For explanatory
variables, we linearly interpolate between trading days to fill in weekend and holiday values. We
use country-level stock price deviations prior to 12 March for lagged values of the explanatory
variables. OLS Standard errors in parentheses.
* p < .1, ** p < .05, *** p < .01

 D. Can a Standard Asset-Pricing Model Rationalize the Size of the Market Crash?
 We now consider whether a standard asset-pricing model can rationalize the size of the
stock market crash depicted in Figures 1, 4 and 5. We work with the rare-disaster model of Barro
(2006), who builds on Lucas (1978), Mehra and Prescott (1985), and Rietz (1988).13 Earlier work
using this type of model typically focuses on its implications for expected returns and the
(expected) equity premium relative to the risk-free return. In contrast, we consider the model’s
implications for realized equity returns in reaction to an actual disaster.

 Barro (2006) posits an endowment economy with a representative agent who has time-
separable, isoelastic preferences over the consumption good. Log output evolves exogenously as
a random walk with drift:

13
 Mehra and Prescott (1985) highlighted the equity return premium as a major puzzle for the standard
representative-agent asset-pricing model set forth by Lucas (1978). Rietz (1988) showed that the puzzle
could be resolved by allowing for a small probability of sufficiently big economic disasters. Barro (2006)
advanced this idea by developing evidence on the frequency and size of economic disasters, calibrating an
otherwise standard asset-pricing model to his evidence, and showing that it could rationalize the historical
equity premium. Barro’s article spurred many other investigations into the asset-pricing implications of
rare disasters. See, for example, Gabaix (2012) and Wachter (2013) and references therein.

 13
 ( +1 ) = ( ) + + +1 + +1, (3)

where the drift ≥ 0, +1 is i.i.d. normal with mean 0 and variance 2 , and +1 picks up low-
probability disaster shocks. Barro shows that the price of a one-period equity claim at t is
 2 2
 1 = − −( −1) +(1/2)( −1) × [ − + (1 − − ) × E{(1 − )1− }], (4)

where ρ is the rate of time preference, θ is relative risk aversion, σ is the standard deviation of
the output growth rate absent disasters, E denotes the expectations operator, p is the disaster
probability, and b is the size of the log output drop when disaster strikes. Disaster size is a
random variable, which Barro calibrates to the empirical distribution of national economic
disasters in the 20th century. , , p and other model parameters are known.

 In taking this model to the data, we interpret 17 February as the last date before disaster
strikes and 23 March as the date by which agents fully understand the gravity of the disaster.
Global and U.S. equity prices fell about 40 percent (51 log points) over this 33-day period. Using
(3) and (4), the model-implied realized equity return over this period is

 after after 33
 ( ) = ( ) = ( ) + u1 − |v1 |, (5)
 before before 365

where |v1 | is the realized disaster size, and u1 is the realized value of the regular shock.14 For
any reasonable values of the annual drift ( ) and the variability of regular shocks ( ), the first
two terms on the right side of (5) are tiny compared to v1 . Thus, the model implies that stock
prices fall nearly one-for-one in proportion to disaster size.

 Figure 6 helps gauge the size of the COVID-19 disaster. The dashed line shows a log
linear fit to data on U.S. real GDP per capita from 2014 Q1 through 2019 Q4 and its
extrapolation through 2020 Q3. The maximal gap between the extrapolation and the actual path
of real GDP per capita is about 12 log points. We see this maximal gap as a loose upper bound
on the perceived size of the disaster, given widespread expectations of rapid recovery once the
pandemic comes under control and the strong partial bounce back actually seen in 2020 Q3.
Evidence based on investor beliefs in Giglio et al. (2020), dividend strips in Gormsen et al.
(2020), and projected corporate earnings in Landier and Thesmar (2020) all point to a disaster
that is considerably smaller than 12 log points. In short, the evidence says the stock market crash
was at least four times the size of the worst-case output collapse occasioned by the COVID
pandemic and perhaps ten times as large. Thus, the model cannot explain the size of the stock
market crash from 17 February to 23 March as a reaction to the disaster.

 One might think that combining the realized disaster with a surprise upward jump in the

probability of a further disaster would bring the model closer to the data. In this case, ( after )
 before
contains an extra term due to the change in the value of p inside the bracketed expression on the
right side of (4). Somewhat counterintuitively, however, the bracketed term in (4) rises with p for
 > 1. Thus, postulating a rise in p cannot reconcile the model with the data. See Section IV in

14
 Given the stochastic process in (3), rates of return on one-period and full equity claims are identical.

 14
Barro (2006) for a related discussion. Gabaix (2012) shows how, with Epstein-Zin preferences, to obtain a negative stock price reaction to a surprise increase in the disaster probability. Figure 6. Assessing the Size of the COVID-19 Disaster 11 10.98 10.96 10.94 10.92 11.6 log points 10.9 10.88 10.86 10.84 Note: The solid lines show real GDP per capita (from FRED) plotted in natural log units from 2014 Q1 to 2019 Q4 (solid blue line) and 2020 Q1 to 2020 Q3 (orange line). The dashed line shows a linear fit to the pre-pandemic data and its extrapolation to the post- pandemic period. The maximal gap between the dashed and orange curves of 11.6 log points which occurs in 2020 Q2. Allowing the capital structure of firms to include bonds as well as equity claims would magnify the stock price reaction to realized disasters. We do not seek to quantify the leverage effect here, but we doubt it is large enough to bring the model in line with the size of the market crash. Another potential explanation starts with the observation that traded equities are a claim on only part of the economy. On the whole, however, listed firms were better positioned than other parts of the economy to weather the pandemic and profit from pandemic-induced shifts in the structure of the economy. Thus, we do not see this line of explanation as promising. 3. The China Experience Thus far, we have said little about stock prices and economic activity in China. There are good reasons to separately examine the Chinese experience. First, the pandemic erupted first in China, when little was known about the SARS-COV-2 virus. Second, after initially suppressing information about the viral outbreak in Hubei province (Kynge et al., 2020, and Jacob, 2020), the Chinese government imposed aggressive lockdown measures to contain the pandemic (Figure 3).15 Third, as we will show, the dynamic between stock prices and economic activity played out See He, Shi and Liu (2020) and Tian (2021) for detailed descriptions of China’s efforts to contain the 15 COVID-19 pandemic. 15
differently in China than elsewhere, including other countries with relatively successful
containment efforts.

 A. Sources of Data for China
 Our high-frequency proxy for economic activity in China relies on daily city-level data
on residential commuting intensity from Baidu (2020),

 ℎ
 , = (6)
 #

We obtain the daily city-level data from the Harvard Dataverse. To construct a national mobility
measure, we compute the weighted-average , values over 248 Chinese cities, using the
number of residents in 2019 as weights. Consistent with Google’s construction of workplace
mobility, we use the median value from 1 to 10 January 2020 as the baseline.

 Equity securities of publicly traded Chinese firms are listed on multiple exchanges and
denominated in multiple currencies, as follows: A shares are listed on mainland exchanges,
denominated in RMB, and traded by investors in mainland China. B shares are listed on
mainland exchanges but denominated in foreign currencies. H shares are listed on the Hong
Kong Stock Exchange (HKEX), denominated in HKD, and traded by investors outside mainland
China. Some Chinese companies list on multiple exchanges and in multiple currencies. Table 2
reports listing counts and market capitalization in various categories. Clearly, A shares dominate
listings and market capitalization. Moreover, among A shares, firms that list only on mainland
exchanges account for nearly four-fifths of market cap. We consider these “A-share only” firms
when relating Chinese stock prices to our mobility measure for China. In other investigations
below, we separately consider outcomes for the Shanghai Stock Exchange (SSE) and the HKEX.

 Table 2. Number and Market Cap of Listed Chinese Firms
 Number of Market Capitalization, Market Cap % of
 Firm Type
 Firms Trillions of RMB Share Type
 A Shares
 All Firms with A shares 3740 59.49 100
 Those without H shares 3621 46.70 79
 Those with H shares 119 12.79 21
 B Shares
 All Firms with B shares 92 0.63 100
 Those without A hares 16 0.07 11
 Those with A shares 76 0.56 89
 H Shares
 All Firms with H shares 258 5.09 100
 Those without A shares 139 0.83 17
 Those with A shares 119 4.26 83
Note: We select firms that trade actively from 2 January to 31 July 2020. The market capitalization value
is based on values as of 7 August 2020. Data for A and B shares are from CSMAR, accessed on 7 August
2020. Data for H shares are downloaded from Yahoo Finance. We use 1HKD = 0.9 RMB to convert
currencies. The total Hong Kong market cap is 38 trillion RMB, and H shares account for 13.5%.

 16
B. Stock Prices and Mobility in China
 Figure 7 plots the evolution of the China mobility measure as a percent deviation from
baseline. Mobility fell sharply after 20 January, bottomed out on 15 February and then recovered
gradually, returning to baseline by late April. The fall in mobility on 10 April (Friday, non-
holiday) is likely due to news about new COVID-19 cases among travelers from outside China.
Having heard this news, Chinese residents responded with caution about visiting public places.

 Figure 7. China Mobility, Percent Deviation from the Baseline
 10
 1/20
 0

 -10

 -20

 -30

 -40 4/10

 -50

 -60

 -70 2/15

Note: China mobility is defined as residents traveling at city c on date t over the number of residents at
date t. In calculating the weighted average of China mobility, we use each city’s number of residents in
2019 as the weight. The daily China mobility index for each city is recorded by Baidu, and we obtain the
data from Harvard Dataverse, accessed on 15 August. The Baidu mobility data stopped updating since 2
May. We choose the median value of the mobility from 1 to 10 January 2020 as the baseline.

 Figure 8 presents the time path of stock price and mobility deviations in China. Unlike
other countries, stock prices do not precede declining mobility in China. Instead, the figure
shows large, broadly coincident declines in stock prices and mobility from 15 January to 3
February. Mobility fell roughly 60 percent over this period, and stock prices fell nearly 20
percent. The exact timing of stock price developments is obscured by the Spring Festival closure
of mainland exchanges, which the government extended as part of its policy response to the
pandemic. After last trading on 24 January, mainland exchanges re-opened on 3 February, with
stock prices down 11 percentage points. During the market shutdown, mobility fell 34
percentage points. On 4 February, the second day after the stringency index surpassed 70, stock
prices began to climb as mobility fell another 6 points. From 6 February to 4 March, mobility
rose 36 points and stock prices rose 11 points. From 5 March to 30 April, mobility rose another
30 points and returned to baseline, while stock prices increased by 9 points.

 17
Figure 8. Time Path of China Stock Prices and Mobility from 13 January to 30 April 2020

Note: Stock prices for A shares of companies with no H-share listing and denominated in RMB. Data are
from the CSMAR dataset (China analog to WRDS). An orange diamond marks the first confirmed
COVID-19 death, a green cross marks the first date with stringency index value of 70 or more, and a red
dot marks the date on which the stringency index first drops below 70. We linearly interpolate stock
prices from 24 January to 3 February, given that mainland China stock markets were closed from 25
January to 2 February, inclusive.

 C. Comparison of Chinese and American Stock Markets
 Unlike the U.S. stock market, the Chinese stock market attracts millions of domestic
retail investors. This makes China’s stock market less tied to the global financial system, but
more sensitive to governmental influences (Yu and Ping, 2020). Figure 9 compares cumulative
log returns on Chinese and American stocks during the first four months of 2020, and Figures 10
and 11 compare realized and implied stock market volatility over the same period. All three
charts exhibit the same pattern: the coronavirus pandemic had the largest impact on the S&P 500,
a relatively modest impact on the SSE, and an intermediate effect on the Hang Seng.

 Chinese authorities closed mainland stock exchanges for an extra three working days
during the 2020 Spring Festival break. Accordingly, the SSE announced on 27 January 2020 that
it would reopen on 3 February instead of 31 January. 16 As a result, mainland markets did not
register the impact of the mounting coronavirus cases in the period from 25 January through 2
February, whereas U.S. markets quickly reflected new developments. The extended market
closure possibly contributed to the lower volatility of Chinese stocks even after the closure itself.

16
 http://www.sse.com.cn/aboutus/mediacenter/hotandd/c/c_20200202_4991648.shtml

 18
Table 3 classifies the contemporaneously perceived reasons for daily stock market jumps
based on explanations offered in next-day newspaper accounts, following the approach of Baker
et al. (2020b). They examine next-day newspaper explanations to classify and characterize each
daily move in the U.S. stock market greater than 2.5 percent, up or down, from 1900 to the
present. Specifically, they read the lead article about each jump in next-day newspapers (or the
same evening in the internet era) to classify the journalist’s explanation into one of 16 categories,
which include Macroeconomic News and Outlook, Government Spending, Monetary Policy,
Unknown or No Explanation Offered, and Other – Specify.17 Baker et al. (2020a) extend the
approach to investigate the specific role of pandemics and infectious diseases.

 Panel C in Table 3 underscores the unprecedented impact of the COVID-19 pandemic on
the U.S. stock market. In the period before 24 February 2020 – spanning 120 years and more
than 1,100 jumps – next-day journalistic accounts attributed not a single daily stock market jump
to infectious disease outbreaks or policy responses to such outbreaks. Perhaps surprisingly, even
the Spanish Flu fails to register in next-day journalistic explanations for large daily stock market
moves. There were 23 daily stock market jumps from March 1918 to June 2020, which spans the
three major waves of the Spanish Flu. Next-day accounts in the Wall Street Journal attributed
none of them to the Spanish Flu. Data from February 24 through the end of April tell a
remarkably different story. Next-day newspaper accounts attribute 23 or 24 (depending on
newspaper) of 27 U.S. stock market jumps to news about COVID-19 developments and policy
responses to the pandemic.

 We take the same approach to the Shanghai Stock Exchange and the Hang Seng from 26
December 1990 to 30 April 2020. In doing so, we tap financially-oriented mainland Chinese
newspapers for SSE jumps and the South China Morning Post for Hang Seng jumps. Before
COVID-19, newspapers attribute zero jumps (out of hundreds) to news about infectious diseases.
From 2 January to 30 April 2020, Chinese newspapers attribute all 6 daily stock market moves
greater than |3%| on the SSE and all 8 daily moves greater than |3.8%| on the Hang Seng to the
economic fallout of the pandemic or policy responses to the pandemic. 18 These results closely
parallel the U.S. results. However, the incidence of large daily stock moves during the
coronavirus period is several times greater for the U.S. market than for the Chinese stock
markets, in line with the extremely high volatility of the U.S. market during this period.

 To summarize, our comparison of Chinese and American stock markets during the
coronavirus period uncovers four findings. First, and not surprisingly, stock prices fell less
steeply in China. Second, implied and realized stock market volatility rose much more sharply in
the United States than in China, particularly mainland China. Greater equity market volatility in
the U.S. than in China from late February 2020 (and through late April) is a reversal of the usual
relationship. Third, next-day newspaper accounts confirm the dominant role of pandemic-related
news in driving market volatility in both countries after the onset of the pandemic. Finally, the
powerful effects of pandemic-related news on stock markets are without precedent since at least
1990 in China and since 1900 in the United States.

17
 The coding guide in Baker, Bloom, Davis, and Sammon (2018) describes the approach in detail.
18
 Following Baker et al. (2020b), we set higher jump thresholds for the SSE and the Hang Seng to adjust
for their greater baseline volatility levels.

 19
Figure 9. Cumulative Log Returns on American and Chinese Stocks, 2 January to 29 April 2020

 10%

 5%

 0%

 -5%

 -10%

 -15%

 -20%

 -25%

 -30%

 -35%

 -40%

 Shanghai Stock Exchange Hang Seng S&P 500

Note: The figure plots cumulative log changes from 31 December 2019 for the indicated stock market indexes, using daily closing
values from Yahoo Finance, downloaded on 4 May 2020. The break in blue line indicates the Spring Festival market closure in
Shanghai Stock Exchange, from January 24 (Friday) to February 2 (Sunday).
Figure 10. Realized Return Volatility Over Past 10 Trading Days, American and Chinese Stocks, 31 December 2019 to 29 April 2020

 0.3
 US Senate Passed $2 Trillion
 Economic Stimulus
 NY Fed announced $1.5
 3/26/2020
 Trillion into Financial
 0.25
 Markets
 3/13/2020
 WHO annouced COVID-19 WHO annouced COVID-19
 0.2
 as a PHEIC as Pandemic
 1/30/2020 Cases outside China
 3/11/2020
 surpass cases in China
 0.15 2/26/2020
 Wuhan City closed
 1/23/2020

 0.1 First death case due to
 COVID-19
 1/11/2020

 0.05

 0

 Shanghai Stock Exchange 50 Hang Seng S&P 500

Notes: We measure realized volatility as the square root of the sum of squared returns over the past 10 trading days, calculating returns
as log changes in closing-price index values. We linearly interpolate over weekends and other short market closures. The break in the
series for the Shanghai Stock Index reflects an extended market closure for the Chinese Spring Festival and the coronavirus pandemic,
which we handle as follows: (1) Let j = 0, 1, 2, …, index days, where j = 1 is the first closure day and j = the last closure day. (2)
Treat the volatility data as missing for j = 1 to + 5, and do not interpolate across these missing days. (3) For j = + k for k = 6 to
10, compute past volatility by summing the squared returns over the past k-1 days (i.e., inclusive of the change from k-1 to k) and
multiplying the sum by (10/(k-1)). This multiplication factor adjusts for the shorter volatility window. Then we take the square root. (4)
When plotting the realized volatility data for the interval from j = + k for k = 6 to 10, we use a dashed line.

 21
Figure 11. Implied Volatilities, American and Chinese Stock Markets, 31 December 2019 to 30 April 2020

 NY Fed Announced
 110 WHO annouced $1.5 Trillion into US Senate Passed
 Cases outside China COVID-19 Financial Markets $2 Trillion
 WHO annouced first surpass as Pandemic 3/13/2020 Economic Stimulus
 90 COVID-19 cases in China 3/11/2020 3/26/2020
 Wuhan City as a PHEIC 2/26/2020
 70 closed 1/30/2020
 First 1/23/2020
 COVID-19
 50 Death
 1/11/2020

 30

 10
 12/31/2019

 2/1/2020

 3/4/2020

 4/5/2020
 1/4/2020
 1/8/2020

 2/5/2020
 2/9/2020

 3/8/2020

 4/1/2020

 4/9/2020
 1/16/2020

 2/17/2020

 3/20/2020

 4/21/2020
 1/12/2020

 1/20/2020
 1/24/2020
 1/28/2020

 2/13/2020

 2/21/2020
 2/25/2020
 2/29/2020

 3/12/2020
 3/16/2020

 3/24/2020
 3/28/2020

 4/13/2020
 4/17/2020

 4/25/2020
 4/29/2020
 -10

 Shanghai Stock Exchange 50 Hang Seng S&P 500

Note: Data for the Hang Seng Volatility Index (HSI Volatility Index) and the VIX (S&P 500) are from Yahoo Finance, downloaded on
4 May 2020. We calculated an implied volatility index for the Shanghai Stock Exchange 50 as explained in Appendix B, following the
same approach as CBOE (2019) uses to calculate the VIX.
Table 3. Large Daily Moves in Chinese Stock Markets, Classifications Based on
 Next-Day Newspaper Accounts in Leading Chinese Newspapers
 A. Shanghai Stock Exchange
 Number of # Attributed to # Attributed to
 Jump
 Time Period Daily Stock Economic Fallout Policy Responses
 Size
 Market Jumps of Pandemics to Pandemics
 26 December 1990
 ≥ |4%| 384 0 0
 31 December 2019
 ≥ |4%| 1 1 0
 2 January 2020
 to 30 April 2020 ≥ |3%| and
 5 4 1
 < |4%|
 B. Hang Seng
 Number of # Attributed to # Attributed to
 Jump
 Time Period Daily Stock Economic Fallout Policy Responses
 Size
 Market Jumps of Pandemics to Pandemics
 26 December 1990
 ≥ |3.8%| 213 0 0
 31 December 2019
 ≥ |3.8%| 7 5 2
 2 January 2020
 to 30 April 2020 ≥ |3%| and
 1 1 0
 < |3.8%|
 C. S&P 500 (Reproduced from Baker et al. 2020a)
 Number of Daily U.S. Number Attributed Number Attributed to
 Stock Market Jumps to Economic Fallout Policy responses to
 Greater than |2.5%| of Pandemics Pandemics
 2 January 1900 to
 1,116 0 0
 21 February 2020
 26 December 1990
 254 0 0
 to 31 December 2019
 2 January 2020 to
 0 0 0
 23 February 2020
 24 February 2020 to
 27 13.4 10.4
 30 April 2020

Notes to Panel A: We consult next-day accounts of large daily stock market jumps in four
Chinese newspapers: Security Times (证券时报), Security Daily (证券日报), Shanghai
Security News (上海证券报), and China Security Journal (中国证券报). These four papers
are the most authoritative and influential ones about securities in China. They are the first to
report financial market information and are important sources of information for investors. We
classify the reason for the jumps based on the explanation offered in the next-day accounts,
following the approach in Baker et al. (2020b). At least one paper contains a next-day article
about each large daily jump, as defined in the table. When multiple papers contain a next-day
article about a given jump, they always agree as to the reason for the jump. On 3 February 2020,
the first trading day after the Chinese Spring Festival, the Shanghai Stock Index fell 7.72%. All
four newspapers attributed the crash to the economic fallout of COVID-19. The other five dates
 23
with jumps in the SSE greater than or equal to |3%| and less than |4%| are: 28 February 2020 (-
3.71%), 2 March 2020 (3.15%), 9 March 2020 (-3.01%), 16 March 2020 (-3.40%), and 23 March
2020 (-3.11%). Newspapers attributed the drops on 9, 19 and 23 March to the impact of the
pandemic. On 24 March, Shanghai Securities News said the pandemic reduced external demand
from Europe and the U.S, causing stock prices to fall. On 17 March, Security Times reported that
major central banks surprised the market and caused it to drop. On 10 March, Securities Daily
attributed the A-share stock price fall to reduced demand in overseas market due to panic over oil
prices and the coronavirus. On 3 March, China Securities Journal ascribed the upward jump to
the improved situation in China compared to the rest of the world. On 29 February, according to
Security Times, the A-share stock price fell along with overseas stock markets due to rising new
COVID cases around the world.
Notes to panel B: We consult next-day accounts of daily Hang Seng jumps in the South China
Morning Post. The seven dates with market jump greater than |3.8%| in 2020 are: 9 March (-
4.23%), 16 March (-4.03%), 18 March (-4.18%), 20 March (5.05%), 23 March (-4.86%), 24
March (4.46%) and 25 March (3.81%). The newspapers attributed the drops on 9, 16, 18, 20 and
23 March to the impact of the pandemic, while policy stimulation boosted the market on 24 and
25 March.
Notes to panel C: Baker et al. (2020a, 2020b) consider all daily jumps in the U.S. stock market
greater than 2.5%, up or down, since 1900. They classify the reason for each jump into 16
categories based on human readings of next-day (or same-evening) accounts in the Wall Street
Journal (and New York Times in 2020). Fractional counts arise when newspapers differ in their
jump attribution or human readers differ in their classification of the attribution.

 D. What Lessons from China’s Experience?
 After initially suppressing information about COVID-19, the Chinese government
imposed strict lockdown measures in its efforts to contain the pandemic. It sustained these strict
measures for many weeks, relaxing them somewhat in early April (Figure 3). As we have also
seen, its stock market and economic activity levels recovered more rapidly than in most other
countries, including the United States. These aspects of China’s experience might suggest that its
willingness and capacity to impose a sustained hard lockdown explains its relative success in
containing the pandemic and mitigating the economic damage. As we show next, however,
China’s experience is atypical in key respects among countries that were relatively successful in
responding to the pandemic and mitigating the associated economic damage.

 4. Other Countries with Relatively Successful Early-Pandemic Experiences
 We now consider other countries with distinctively favorable early-pandemic
experiences. To identify these countries, Figure 12 plots mobility deviations against stock price
deviations in panel (a) and against stringency index values in panel (b) as of 30 March 2020.
That is when the global stringency index first reaches 70, our threshold for a hard lockdown.
 Taiwan, Singapore, South Korea, and Japan all lie in the upper right quadrant of panel
(a), exhibiting relatively favorable stock price and mobility deviations. All but South Korea had
comparatively low stringency values as of 30 March, as seen in panel (b). But South Korea was
slow to impose a hard lockdown. It took 60 days after its first confirmed case before South Korea
reached a lockdown stringency value above 70, placing it among the bottom three countries by

 24
this measure of lockdown speed, along with Thailand and Singapore. Sweden, Japan and Taiwan
did not implement a hard lockdown within our sample period.

 Figure 12. Scatterplot of Workplace Mobility Deviations against Stock Price Deviations
 and Stringency Deviations as of 30 March 2020

 (a) (b)

 Singapore, South Korea and Taiwan had well developed laboratory testing and medical
surveillance systems in place before COVID-19 struck. Taiwan, in particular, quickly adopted
containment measures in response to COVID. According to Cheng et al. (2020), “At the early
stage of the outbreak, the strategy in Taiwan had three pillars: real-time surveillance with rapid
risk assessment, border control and quarantine, and laboratory capacity building.” Governments
in South Korea and Singapore accessed mobile phone data for contact tracing purposes and virus
containment. South Korea adopted an effective trace-test-treat policy (Moon, 2020). In all three
countries, swift government reactions, legal and technical infrastructures that supported rapid
interventions, harsh penalties for violating containment rules, and high-quality healthcare
systems were important enabling factors in responding to COVID-19 (Park et al., 2020). Japan
was also relatively successful in suppressing the early wave of COVID-19 infections and its
negative effects. According to Tashiro and Shaw (2020), sound governance, a strong health care
system, and the socially responsible, risk-aware behavior of its citizens enabled Japan to contain
infection rates while also limiting economic damage. An and Tang (2020) offer a less positive
assessment of Japan’s early efforts to contain the pandemic.

 Recent past experiences with other epidemics prompted Singapore, South Korea and
Taiwan to take steps that facilitated effective early-stage responses to COVID-19 (An and Tang,
2020). The largest outbreaks of the 2003 SARS epidemic occurred in Hong Kong and mainland
China (Hanna and Huang, 2004). Taiwan and Singapore also had large SARS outbreaks. Woo
(2020) describes how the SARS episode prompted Singapore to strengthen its testing and contact
tracing capabilities. Moon (2020) discusses how South Korea’s painful experience during the
2015 MERS epidemic led to a strengthening of its trace-test-treat infrastructure.

 Pinpointing the exact reasons for the distinctively favorable early-pandemic experiences
of Taiwan, South Korea, Singapore and Japan (and China) is beyond the scope of this paper.
 25
What we can say – based on Figure 12 and the other evidence summarized above – is that hard
lockdowns were neither necessary nor sufficient to contain the pandemic or mitigate its
economic effects. In this respect, China’s experience is an outlier among the set of countries that
were relatively successful in containing the pandemic and limiting its negative economic effects.

 5. Concluding Remarks
 The early stages of the COVID-19 pandemic drove a spectacular rout in stock markets.
Within the space of a few weeks, value-weighted share prices fell 20 to 50 percent in countries
around the world. The stock market implosions preceded short-term collapses in economic
activity by two to three weeks in all but 3 of the 35 countries in our sample: South Korea saw
only a modest activity drop in the wake of the pandemic, and Taiwan experienced none at all.
China, the first country hit by the pandemic, experienced a simultaneous collapse in stock prices
and economic activity.

 Conditional on global developments, national stock prices also foreshadowed the timing
and severity of own-country collapses in economic activity in the wake of the pandemic. Thus, it
is fair to say that stock prices exhibited strong predictive content for the collapses in economic
activity that followed on the heels of the pandemic and policy responses to it. That said, we also
show that the global and U.S. stock market crashes in reaction to the pandemic are many times
larger than implied by a standard asset-pricing model, given plausible values for the magnitude
of the COVID-19 output disaster.

 Because of its large size and status as the first country to experience a major outbreak,
China’s experience with COVID-19 has attracted enormous attention. China imposed strict
lockdown measures and sustained them for many weeks in its (relatively) successful efforts to
contain the spread of the virus. However, when we turn to other countries with distinctively
favorable early-pandemic experiences, the picture looks different. Countries that moved quickly
to contain the spread of the virus – with or without aggressive lockdown measures – enjoyed
higher stock prices and better near-term economic performance. In short, relatively successful
policy responses involved rapid implementation of virus containment efforts but not necessarily
strict lockdowns on economic and social activity.

 We have not delved very deeply into the factors that enabled some countries to rapidly
implement an effective set of containment measures. Still, our analysis and discussion point to
elements that appear to have played a positive role in this regard: costly encounters with recent
past epidemics, the technical infrastructure needed to rapidly implement an effective test-trace-
quarantine regime, a governance system that allowed for a rapid official response, a strong
health-care system, and governments that either enjoyed the trust and cooperation of their
citizens or had the means and will to compel compliance.

 26
You can also read