A1 Corridor Logistics Assessment: Bassetlaw Council - Bassetlaw District Council
←
→
Page content transcription
If your browser does not render page correctly, please read the page content below
AUGUST 2021
A1 Corridor Logistics Assessment:
Bassetlaw Council

                                                                                                              ICENI PROJECTS LIMITED
Final Report

Iceni Projects Limited

August 2021

                                                                          A1 Corridor Logistics Assessment:

Iceni Projects
                                                                                                              FINAL REPORT

London: Da Vinci House, 44 Saffron Hill, London, EC1N 8FH
Edinburgh: 11 Alva Street, Edinburgh, EH2 4PH
Glasgow: 177 West George Street, Glasgow, G2 2LB
Manchester: This is the Space, 68 Quay Street, Manchester, M3 3EJ

t: 020 3640 8508 | w: iceniprojects.com | e: mail@iceniprojects.com
linkedin: linkedin.com/company/iceni-projects | twitter: @iceniprojects
2

CONTENTS

       INTRODUCTION ......................................................................................................... 1

       LOGISTICS PROPERTY MARKET AREA ................................................................. 2

       POLICY AND LITERATURE REVIEW ........................................................................ 7

       MARKET REVIEW – DEMAND ASSESSMENT ....................................................... 14

       SUPPLY ASSESSMENT........................................................................................... 22

       ROLE IF THE A1 IN WIDER MARKET CONTEXT ................................................... 26

       CONCLUSIONS ........................................................................................................ 28

APPENDIX A ..................................................................................................................... 30

                                                                                                                                      0
INTRODUCTION

Bassetlaw District Council has commissioned Iceni Projects Ltd to produce an assessment of the
logistics market on the A1 corridor in Bassetlaw and the wider property market area.

The aims of the study are to:

      •    Meet the PPG requirements for logistics needs assessments for Local Plans;

      •    Define the Property Market Area (PMA) to consider A1 corridor role within that wider PMA;

      •    Undertake a policy & literature review on the commercial and logistics market;

      •    Undertake a market review focused on demand for units above 100,000 sqft for Bassetlaw
           and the PMA and including a summary review of the performance of the key logistics parks
           in the PMA.

      •    Consider known supply for logistics in the PMA via a literature review and limited desktop
           review – coming to a view on years of supply and overall market capacity.

      •    Engage active agents and occupiers in the PMA to provide feedback.

      •    Provide conclusions on the role of the A1 corridor in the PMA and the outlook for logistics
           needs in Bassetlaw for planning purposes, recognising the need to work collaboratively with
           partner authorities on logistics planning.

It is not the intention of this study to undertake a full logistics needs assessment for all of the
authorities covered in the PMA as defined herein, which is much of Nottinghamshire and South
Yorkshire. It is recognised that in depth studies such as those for the Leicestershire authorities
(‘Golden Triangle’) on strategic distribution utilise a range and triangulation of detailed modelling
techniques1 notably completions trends; labour demand; and forecasts in increases in goods
shipments alongside replacement stock. They also have detailed authority partner engagement. The
purpose of this current commission is to focus on the overall market positioning and outlook for
logistics in the A1 corridor within the wider PMA context to inform the Bassetlaw Local Plan.

1
    https://www.nwleics.gov.uk/pages/strategic_distribution_study

                                                                                                       1
LOGISTICS PROPERTY MARKET AREA
A number of existing documents establish the Functional Economic Market Areas (FEMAs) that are
relevant to this study. These are summarised below. However whilst FEMAs are essential for
planning policy development and a requirement under the Planning Practice Guidance, they do not
necessarily reflect Property Market Areas (PMAs). When considering PMAs for logistics, particularly
strategic sites, these tend to be larger areas than PPG defined FEMAs.
FEMA
First we consider the relevant FEMA commentary for the Bassetlaw A1 corridor.
Bassetlaw EDNA 2019 / HEDNA 2020
The Travel to Work Area definitions from ONS show that Bassetlaw falls within the Worksop and
Retford TTWA which is broadly coterminous with the district boundary. However, the self
containment of the TTWA is particularly low – at 66.8% (residents) and 69.6% (workplace) self
containment. It is of note that the ONS considers that for areas with a working population in excess
of 25,000, self containment rates as low as 66.7% are accepted as part of a limited “trade-off”
between workforce size and level of self-containment. Therefore Bassetlaw is on the threshold for
self containment.
The EDNA 2019 notes that overall Bassetlaw shows that there are strongest links with South
Yorkshire – this would suggest potentially including the district within a wider FEMA covering the
Sheffield City Region LEP area. Similarly, there are strong links with the other northern
Nottinghamshire authorities and the north east Derbyshire authorities. However, these authorities
experience stronger linkages with the larger centres of Nottingham and Chesterfield respectively.
However, the evidence does not particularly support including Bassetlaw within a wider FEMA
focussed around these centres. The data instead suggests an area with multiple diffuse influences
and linkages acting with differing strengths on different parts of the district.
Sheffield City Region Strategic Employment Land Appraisal (SELA) Report May 2020.
The SELA aims to provide a coherent understanding of current strategic-level employment land
across all nine districts in the SCR as of 2019, specifically Barnsley, Bassetlaw, Bolsover,
Chesterfield, Derbyshire Dales, Doncaster, North East Derbyshire, Rotherham and Sheffield. The
study notes that subsequent to its commissioning, the SCR LEP Geography has been modified, with
SCR LEP now covering just the four South Yorkshire districts, with the other five districts (Bassetlaw,
Bolsover, Chesterfield, Derbyshire Dales and North East Derbyshire) falling solely within the D2N2
LEP area. The study also notes that the ONS’s own TTWA analysis effectively indicates that
2Barnsley, Doncaster and Bassetlaw are broadly self-contained districts from a commuting
perspective.
PMA
The logistics market for the purposes of this study is defined as focusing on large scale units and
operations rather than final mile distribution. It is generally recognised that large scale logistics units
are 100,000 sqft (9,000 sqm) and above (ranging to 1,000,000 sqft or more). The focus is on units
and sites capable of hosting this scale of development.
Occupiers considering units of these sizes can cover wider areas of search that go beyond typical
travel to work area or general functional economic market area (FEMA) boundaries. The PPG notes
• The logistics industry plays a critical role in enabling an efficient, sustainable and effective
supply of goods, consumers and businesses, as well as contributing to local employment
opportunities, and has distinct locational requirements that need to be considered in
formulating planning policies (separately from those relating to general industrial
land). (Iceni emphasis)
In this light we go beyond the FEMA definitions set out in the planning policy evidence above. Rather
we have sought to engage with commercial agents who regularly deal with enquiries from occupiers
looking for space of this nature. We have spoken with:
• CBRE
• Savills
• M1 Agency
• FHP
• Progen Land
Whilst every occupier has different requirements in terms of the customer / supplier locations,
network access and workforce needs, there is a general consistency from agents that the A1 corridor
(and sister M1 corridor) centred around Bassetlaw stretches from Doncaster to Nottingham. The key
factors reported in defining the area are:
• The A1 is now viewed by many as a viable logistics corridor due to saturation on the M1
• South of Nottingham (Castle Donington) enters a separate Golden Triangle market, which is
also very saturated and seeing requirements move north towards Sheffield / Doncaster
3• At the north, Barnsley is more related to the Wakefield / Leeds M62 corridor
More detailed agent comments are set out in chapter 6.
Given the commentary, the area set out in the figure below is therefore indicative of the full PMA
assessment considered in this study.
It is recognised that this study needs to seek to differentiate the role of the Bassetlaw A1 element
running south of Doncaster down towards Newark. This is considered in the report by recognising
the inner study area (A1) role in the wider PMA that is defined by large scale occupier areas of search
which are rarely as small as the inner study area.
Indicative A1 Corridor Full Property Market Area / Inner Area
Source: CoStar / Iceni Projects
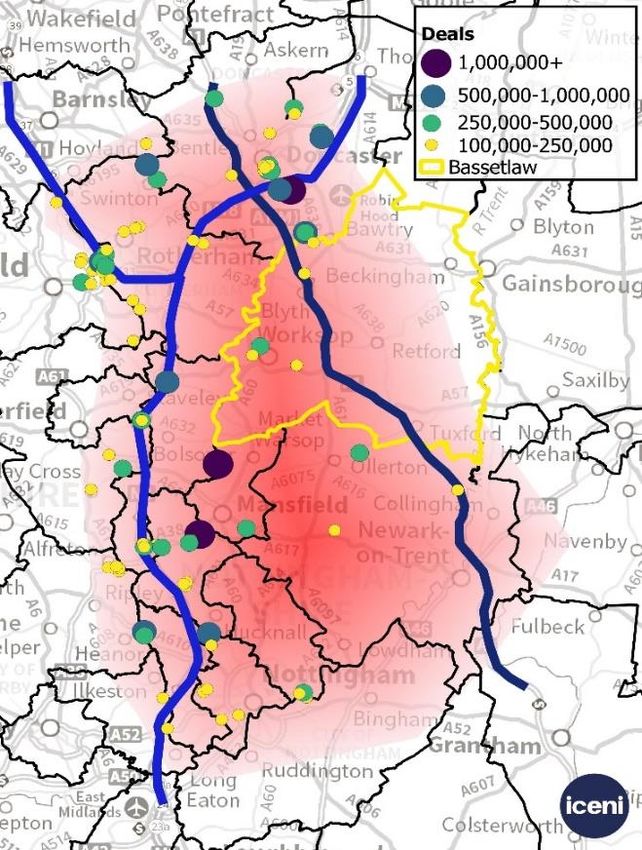
It is useful to compare this area to the CoStar default property market areas. CoStar is a recognised
national property market database that Iceni subscribes to. The CoStar industrial market defaults to
the Nottinghamshire / Derbyshire counties and combines Sheffield, Doncaster, Rotherham.
4CoStar Property Market Areas
Source: CoStar / Iceni Projects
The full PMA area as defined in the previous graphic covers:
• Much of the Sheffield City Region (SCR) Local Economic Partnership (LEP), its relevant
constituent members being Sheffield City Council; Doncaster Metropolitan Borough Council;
Rotherham Metropolitan Borough Council; but excluding Barnsley Metropolitan Borough
Council.
• The majority of the Nottingham Core and Outer Market Areas 2 including Ashfield District
Council, Broxtowe Borough Council, Gedling Borough Council, Erewash Borough Council,
Nottingham City Council, Mansfield Borough Council, Newark & Sherwood District Council
and Rushcliffe Borough Council
2
As defied in the Nottingham Core HMA and Nottingham Outer HMA Employment Land Needs Study Report May 2021
5• Part of the North Nottinghamshire and Derbyshire authorities of the D2N2 LEP being
Bassetlaw District Council; North East Derbyshire District Council; Derbyshire Dales District
Council; Bolsover District Council and Chesterfield Borough Council
It is of note that there are two principle existing employment land studies (not logistics studies) that
cover the Sheffield City Region and Nottingham HMA areas. These are the:
• Nottingham Core HMA and Nottingham Outer HMA Employment Land Needs Study (ELNS)
Report May 2021; and
• Sheffield City Region Strategic Employment Land Appraisal (SELA) Report May 2020.
Both review the employment land supply with the constituent areas and provide a base that cover
the PMA as defined (and areas beyond it).
6POLICY AND LITERATURE REVIEW
This section is concerned with two types of document relevant to logistics: selected planning policy
/ evidence; and property market literature.
Planning Policy
Planning Practice Guidance
The PPG ‘Housing and economic needs assessment’ paragraph: 031, reference ID: 2a-031-
201907221 guides local authorities in assessing the need and allocation of space for logistics. It’s
noted in paragraph 031 that:
Logistics industry needs to have a “distinct locational requirements that need to be considered in
formulating planning policies (separately from those relating to general industrial land).”
Where facilities e.g., “significant amounts of land, good strategic transport networks” etc… are
needed, it is important that “strategic policy-making authorities should collaborate with other
authorities, infrastructure providers”, and other key stakeholders that are affected by the
development, in order to “identify the scale of need across the relevant market areas.”
This can be informed by:
• engagement with logistics developers and occupiers to understand the changing nature of
requirements in terms of the type, size and location of facilities, including the impact of new
and emerging technologies;
• analysis of market signals, including trends in take up and the availability of logistics land and
floorspace across the relevant market geographies;
• analysis of economic forecasts to identify potential changes in demand and anticipated
growth in sectors likely to occupy logistics facilities, or which require support from the sector;
and;
• engagement with Local Enterprise Partnerships and review of their plans and strategies,
including economic priorities within Local Industrial Strategies.
National Policy Statement on National Networks
The ‘National Policy Statements for National Networks’3 by the Department for Transport (2014)
document sets out the Government’s policies to deliver the development of nationally significant
infrastructure projects (NSIPs) on the national road and rail networks in England.
7Key paragraphs in relation to ‘logistics’ from the document are:
• Paragraph 2.34: Rail freight has a strategic importance “as it is already playing an increasingly
significant role in logistics and, is an increasingly important driver of economic growth”
• Paragraph 2.42: The logistics industry directly employs over two million people “across more
than 190,000 companies generating over £90 billion annually, underpins the efficient
operation of most sectors of the wider national economy.”
• Paragraph 2.45: “The logistics industry provides warehousing and distribution networks for
UK manufacturers, importers and retailers”, which is mainly a road-based industry. Logistics
industry will need to develop new facilities alongside e.g., major rail routes, close to major
trunk roads and close to areas that consume the goods.
Bassetlaw EDNA 2019 / HEDNA 2020
The 2019 EDNA notes that “the district falls outside the main M1 corridor which historically has limited
the attractiveness for the larger distribution uses.” “There is not considered to be demand for super
sheds in the area [Worksop] but there is demand for sub-hub (100,000 - 200,000 sq ft). Worksop as
a central location between the M1 and the A1 is a particularly attractive location for that type of
property.” The study notes a labour demand led need of 63 ha but notes that completions trends
(excluding outliers) point to a requirement of up to 136.8 ha… Given the strength of commitments in
the district and potential of the distribution market, a positive approach to development may enable
a higher level growth [than 63 ha].
The 2020 HEDNA revisits the economic needs of the district, updating the labour demand forecasts
which have risen to 84 ha. The report more explicitly recommends the completions trend for industrial
/ distribution uses totalling 186.9 ha inc outliers. The district’s needs are met by its supply however
Apleyhead Junction would be an additional site.
Sheffield City Region Strategic Employment Land Appraisal (SELA) Report May 2020.
The SELA aims to provide a coherent understanding of current strategic-level employment land
across all nine districts in the SCR, specifically Barnsley, Bassetlaw, Bolsover, Chesterfield,
Derbyshire Dales, Doncaster, North East Derbyshire, Rotherham and Sheffield.
As above, during 2019 the SCR area was adjusted to exclude Bassetlaw, Bolsover, Chesterfield,
Derbyshire Dales and North East Derbyshire to avoid overlapping LEP authorities. However the
SELA does cover the wider definition.
It notes that a sieving exercise was then undertaken to identify all sites which had a site area of 5.0
ha or above, on the basis that these larger sites were more likely to be of strategic importance.
8It notes that overall the evidence base and emerging and recently adopted Local Plans indicate an
employment land need in the region of 1,469 hectares and a supply of 1,524 hectares, giving an
overall surplus of c.56 hectares.
The document provides a high-level appraisal of strategic employment sites with a focus on Dearne
Valley and J36; Doncaster Sheffield Airport; Markham Vale; A61 Corridor; Sheffield City Centre;
Advanced Manufacturing Innovation District; and DN7/Unity. It notes that Dearne Valley, Doncaster
Sheffield Airport and Markham Vale are currently focused on logistics activity although the vision for
the latter is on advanced manufacturing;
Doncaster Employment Land Review 2018:
The Doncaster Employment Land Review published by Colliers International in February 2018
provides a “site-by-site review of the potential future employment sites being considered for allocation
through the Local Plan process” (p.5). The potential sites that are being considered are
predominantly concentrated on the M18 corridor with little on the A1M.
The market signals shows that there’s a “continued demand for industrial (B2 and B8) uses” (p.13).
The take up of employment land during the period 2000-2017 for B8 (Strategic Warehouse) has a
total of 269.82ha (p.14).
For new development activity, there has been a “number of speculative B2/B8 developments
proposed to be started on site” (Colliers, 2018, p.19) and this includes:
• iPort – Verdion are to commence construction in March of two units of 11,984 sqm unit and
5,480 sqm respectively.
• Nimbus Park, Phase 2 – developer, Sladen Estates, is understood to be considering a start
on site with two units totalling 24,154 sqm.
• Doncaster Distribution Park – Gazeley are reportedly considering a 25,083 sqm speculative
build
Nottingham Core HMA and Nottingham Outer HMA Employment Land Needs Study Report
May 2021
This study covers the Nottingham Core Housing Market Area [HMA] and Nottingham Outer HMA, to
assess the future economic development needs of the 8 authorities up to 2038. Six different
scenarios of future employment space requirements were considered based on a range of lower and
higher growth conditions that could arise in the future, plus a sensitivity test based on past trends
jobs growth. Broxtowe, Erewash and Nottingham have the clearest undersupply of industrial whilst
outer authorities have greater balance or over supply.
9Regarding logistics, the study notes that, stakeholders commented that economic growth across
Greater Nottingham has been limited by lack of available large-scale strategic distribution sites over
the past decade and that studies forecasting need based purely on past trends will significantly
underestimate the scale of demand. Agents were confident that there is capacity in the market for a
further one, or even two, very large regional distribution centres near to these key M1 junctions and
that at current levels of demand, two such schemes, if made available, would be at capacity within a
decade.
Property Market and Logistics
UK Logistics Market 2021 Outlook, Knight Frank (Jan 2021)
Growth of the e-commerce market was a major driver of demand for warehousing space in 2020 and
this is expected to continue through 2021, as retailers and distribution firms seek to expand their
online and home delivery capacity and capture a share of the growing online retail market.
Take-up of warehousing space exceeded 50m sq ft in 2020 (compared to 34m sq ft in 2019); driven
mainly by retailers and distribution companies, who together accounted for 87% of take up (units
100,000 sq ft +).
The robust forecast for online retail and competition, particularly for well-located assets, is likely to
drive positive momentum for the logistics market. “While 2020 was the year for rapid upscaling, in
2021, demand will be driven more by long term strategic planning as retailers pivot their business
models towards higher demand for online retail”.
Supply is currently tight. Across the UK, there is around 46m sq ft of warehousing space available
(in units over 50,000 sq ft). With take-up of 52 million sq ft in 2020, that represents roughly 10.5
months of supply. However, most of that space is in second-hand units that may not be the right
specification or in the right location.
As the economy recovers and grows over the next four years, rental growth is forecast to accelerate.
The strongest rental growth is expected in London, followed by the South East and Eastern regions.
The logistics market in the East Midlands, January 2021, Savills
Savills report that 2020 has been a record year of take-up reaching 12.03m sq ft, 30% above the
previous high watermark. The region continues to cement its position as the key strategic logistics
location in the country.
The record levels of take-up have caused the supply of units over 100,000 sq ft to decrease.
Currently, there are 26 units available totalling 5.8m sq ft representing an 8% decrease from this time
last year. The strong level of activity continues to keep the regional vacancy low at 5.2% which, under
10normal circumstances, would be expected to trigger rental growth. Using the five-year annual
average take-up there is just 0.7 years worth of supply in the market.
A record 12.03m sq ft of space was transacted in 2020 across 32 transactions with demand coming
from a diverse range of occupiers. The most active sectors, however, were third party logistics
providers (3PLs) who took 46% of the figure compared to the long-term average of 17%, this was
followed by grocery retailers and online retailers which accounted for 13% and 12% of the total take-
up respectively. The remaining 29% of take-up was from a range of sectors.
East Midlands Take Up (Savills, Jan 2021)
The Increased Importance of Logistics During Covid-19 and Beyond (2020)
Tritax Symmetry and Turley prepared document highlights how Covid has changed the role of
logistics.
The report notes that the year 2020 has seen logistics operations move into the spotlight, driven by
Covid-19 and the national lockdown which necessitated a shift in the way goods are stored and
moved around the country, particularly in reaching their final destination – the consumer.
Ten years of forecast e-commerce growth occurred in the first month of the national lockdown
reflecting the pace of change in consumer spending patterns, which in turn influence warehouse
floorspace demand.
11Between February 2020 (pre-pandemic) and October 2020, on-line sales values grew from 19.6% of
retail sales value to 28.5%. The logistics sector was quick to respond, with national take up of
warehouse space over Q1 – Q3 of 2020 at a record high of 38.6 million sqft. This exceeds average
annual take-up of new space of 31.9 million sqft over the last five years.
Retail is driving take up, accounting for a third of transactions due to strong e-commerce growth, with
other occupier sectors that have experienced increased demand during the pandemic (such as 3PLs,
parcel carriers and food producers) also contributing significantly to leasing activity.
The report argues “that the planning system needs to support the continued delivery of space to
enable logistics to effectively function as demand for space continues to grow.”
CoStar Market Report: Nottinghamshire June 2021
Nottingham is one of the smaller industrial markets in the East Midlands by size of inventory, with
around 67 million sqft of stock, but it has been growing rapidly in the last couple of years, with
increased occupier demand and an uptick in construction activity.
Net absorption remains positive after rising to the highest level on record in 2020, with sizable deals
boosting volumes as the industrial sector continues to prove the most resilient of the property types.
With many occupiers requiring increased space to satisfy a surge in demand for online orders,
particularly in the food, medical and essentials sectors, vacancies have remained relatively tight
despite the amount of new space being delivered. Although some of the increase has been short-
term, the potential exists for more permanent consumer spending changes with last-mile logistics
and distribution requirements on the increase.
CoStar Market Report: Sheffield and Doncaster June 2021
Heading into the coronavirus outbreak, demand for industrial property in the Sheffield market was
robust. Driven by retailers and delivery specialists taking advantage of the market's strategic location.
The Sheffield Market is well connected by the M1 and A1 (M) motorway networks and as such is a
key warehouse and distribution hub.
Strong levels of net absorption resulted in falling vacancies in recent years, but increased supply has
softened the rate more recently, but with demand in many locations actually increasing since the
beginning of the pandemic, vacancies are not expected to rise further.
Many occupiers are requiring increased space to satisfy a surge in demand. Although some of the
increase is short-term is in response to the crisis, the potential exists for more permanent consumer
spending changes, with last mile logistics and distribution requirements on the increase. On the
12downside, manufacturing and physical store retail sectors are facing increased headwinds,
threatening increasing vacancies in certain locations and submarkets.
In the past 2 years, developers have responded to these improved fundamentals, with around 2.8
million sqft underway in the market The majority of recent developments have been build-to-suit,
which has helped to keep vacancies low. However, speculative supply is expected to hit the market
in coming quarters, around 60% of which is pre-let. Falling vacancies have supported strong rental
growth in recent years but at a slower pace than the growth peak. The strength of the Sheffield
industrial market has caused investors to take note. Sales volume has picked up considerably over
the past two years, driven by robust investor appetite and sharp yield compression.
BPF Delivering the Goods 2020
The British Property Federation (BPF) published ‘Delivering the goods in 2020’ sets out the economic
impact of UK Logistics Sector. In terms of the recent economic growth within the logistics sector, it
contributes and supports businesses, employment and causes an increase in economic productivity.
In 2019, Logistics sector directly supports a minimum of 93,000 business in the UK. In comparison
to 2014, the number of businesses within the logistics sector has grown by 66%. The logistics sector
supports a minimum of 960,000 employees in 2019 in the UK, which has increased from 748,000 in
2013, which shows a growth of 23%. Logistics employment growth was due to the large growth in
warehouses, which provided an additional of 87,000 employees (40%) in the warehouse operations,
and road freight contributed to 74,000 employees (42%) and the rest of employment contributes to
18% in the logistics sector.
From 2019-2039, the employment in the logistics sector is to experience growth of 19%, which shows
that it is “more than double the national growth rate for all sectors (7%)” (BPF, 2020, p.5). Therefore,
the logistics sector is “expected to be a driver of national employment growth” (BPF, 2020, p.5).
Moreover, in terms of ‘Technology’: “Logistics companies are increasingly hiring technical staff or up-
skilling existing staff in IT skills to adapt to this change in operational approach.” (BPF, 2020, p.6).
“New service-orientated logistics companies are entering the market…to respond to changing
requirements through application of digital technology.” (BPF, 2020, p.6).
13MARKET REVIEW – DEMAND ASSESSMENT
This section considers the performance of the logistics market in the A1 corridor PMA as defined
here by considering a series of market indicators as well as that of key logistics parks in the area
including: iPort, Doncaster International Railport, Sheffield Core, Manton Wood etc
Agents feedback on the A1 wider and inner area market position
Key message on the state of the market at present in the area:
• Demand is at an all time high due to retain market restructuring and a move to online and e-
commerce type deliveries.
• Occupiers are driving increased demand particularly for bigger units, higher units, bespoke
units both logistics and manufacturing, which has direct implications on demand sites.
• All buildings over 100,000 sqft, are under offer or pre let which is a ‘desperate’ situation for
occupiers trying to find space. Supply levels are considered an all time low for existing or
under construction.
• Large sites take years to come forward but then are leased very quickly. iPort has been half
filled in 5 years but should have taken 20 years.
• A1 corridor not seen as much activity historically but has seen a surge in demand as the M1
becomes increasingly supply constrained, congested and expensive.
• Take up is facilitated by supply as current demand is so high that all units absorbed when
completed.
• Even sites with historic deliverability challenges are beginning to come forward as prices rise,
as long as they are well connected to the strategic network.
Property market indicators
Demand drivers
As above the move to e-commerce is the single largest factor in driving demand for large scale
warehousing at an unprecedented rate. The pandemic has accelerated this trend as reported by the
ONS below. However market expectations are that it will not return to pre pandemic levels but
continue at a much higher rate the previously. Warehouse space is therefore replacing traditional
shopping space and it will take a significant period for this to achieve a new equilibrium in terms of
warehouse space demand supply.
14National internet sales as % of total sales
Source: ONS
Rents
Below we can see that market rents for larger units have increased steadily in recent years totalling
around 40% gains for the 8 years 2013-21 and set to continue, indicating the increasing demand and
tightness in supply.
Market Rent Per Sq Ft 2011-21 (100,000 sqft+) Full A1 PMA
Source: CoStar
15Vacancy Rate
The chart below sets out the vacancy rate for the Sheffield & Doncaster and Nottinghamshire
industrial markets as reported by CoStar – a custom market study area vacancy is not available.
Both show falling vacancy 2011-18 after the last recession as the market rebounded but supply failed
to keep up. Since then the vacancy rate has stabilised presumably as supply has been brought to
the market particularly in Sheffield/Doncaster. A vacancy range of 5-10% is considered healthy to
allow for market choice. In this context the market is sitting at the tighter end of the spectrum with
Nottinghamshire’s smaller market remaining significantly sub optimal in its choice.
Vacancy Rate 2011-20
10.0%
9.0%
8.0%
7.0%
6.0%
5.0%
4.0%
3.0%
2.0%
1.0%
0.0%
2011 2012 2013 2014 2015 2016 2017 2018 2019 2020
Nottinghamshire Sheffield and Doncaster
Source: CoStar
Take up
The chart below reports the annual take up (gross absorption) of large units over 100,000 sqft in the
PMA since 2011, including leases and owner occupier sales. The average since 2015 (last 5 years)
has been 3.5 million sqft per annum, even higher until 2020 which saw a slight fall to 2.7m sqft which
may have been due to lack of available space. A substantial volume of floorspace is in the 100,000-
500,000 sqft range although 2019 was dominated by even larger units (2 units of 1.1m and 1.8m
sqft).
In terms of count, they were average 12 deals 2015 to 2020 dominated by the 100,000-250,000 sqft
bands. The deal count has been steadily decreasing which may be due to combination of moves
towards larger units and a lack of supply.
Looking back to post last recession period from 2012 to 2020, longer term take up rates have been
consistently high through this period averaging 3.3 m sqft per annum, comparable to the last 5 years.
Including 2011 prior to the market rebound post recession brings this down to 2.9m sqft per annum
16due to the 2011 poor performance which we consider as anomalous representing a different trading
paradigm. Market feedback indicates that take up in recent years has been restricted due to lack of
supply and therefore under represents total need.
Take Up 2011-20 (100,000 sqft+) Full A1 PMA (inc owner occ. sales)
5000000
4500000
4000000
3500000
3000000
2500000
2000000
1500000
1000000
500000
0
2011 2012 2013 2014 2015 2016 2017 2018 2019 2020
500,000-1,000,000 100,000-250,000 250,000-500,000 1,000,000+
Source: CoStar / Iceni Analysis
The locations of the deals are shown below, concentrated on the M1/ M18.
Take Up 2011-20 (100,000 sqft+) Diagram
Source: CoStar / Iceni Analysis
17Deliveries (completions)
The chart below shows the new market deliveries (new floorspace) in the A1 PMA for larger units
over 100,000 sqft over the last 10 years. This shows that a considerable volume of floorspace has
been brought to the market particularly 2017 onwards as development seeks to keep apace with
market demand.
The average for the last 5 years is 2.4m sqft per annum. This is lower than the 3.5 m sqft in take up,
because some take up is facilitated by compressing vacancy and other deals are lease breaks
generating market headroom in existing units. Based on current levels of low vacancy and high rental
trends, this rate of delivery will (at least) need to continue for a sustained period to stabilise the
market and the current rate is insufficient to match the demand terms. The Leicestershire Strategic
Distribution Study 2020 estimates that the current high rate of delivery / completions will need to
continue at least through the remainder of this decade to match levels of demand3. If the longer term
average is used from 2012 then the delivery rate falls to 1.6m sqft per annum average. Based on the
current rate of demand and the paradigm shift in warehousing requirements driven by e-commerce,
this is considered to be insufficient to meet the property market needs. It also fails to incorporate the
lag in delivery occurring between 2012 and 2015 as the construction / planning industry responds to
demand.
Deliveries 2011-20 (100,000 sqft+) Full A1 PMA
Source: CoStar / Iceni Analysis
3 3
https://www.nwleics.gov.uk/pages/strategic_distribution_study see paragraph 10.33
18Availability
The table below reports the current (June 2021) availability in the PMA as reported by CoStar. This
is the data that will be available to agents, developers and occupiers – but it should not be confused
with pipeline supply of land that is available through the planning system, considered in chapter 5.
The data highlights the extremely low availability of units in the current market or under construction
compared to the average of 3.1m sqft of take up per annum for large units over the last 5 years or
2.4m sqft of deliveries. Units constructed pre 2000 may be less attractive to the market. Even with
all ‘proposed’ units (which will fall under a range of different states in CoStar data) there is only 2-3
years of supply on the commercial horizon. With an awareness of the strength of demand and a lack
of available or visible pipeline supply, developers will be keen to ensure more supply can be brought
into the market.
This information provides perhaps the strongest indication of the state of the current market, with a
continual requirement for new large scale units to be brought into the market to meet the demands
of industry.
It is more common in large scale units for occupiers / developers to prefer prelet design and build,
which means typically lower levels of vacancy on the open speculative market. However with only 2
units under construction, occupiers are likely to be experiencing significant constraints on their ability
to locate in the area.
Availability at June 2021 (100,000 sqft+) Full A1 PMA
Status Total sqft Class Unit Count Post Years Years• Doncaster iPort
• Doncaster Balby Carr Bank / Trax Park
• Doncaster M18 J4
• Doncaster A1M J38 Rockingham Way
• Sheffield Core - Europa Way / Europa Link / Shepote Lane
• Manton Wood Business Park, Bassetlaw
• Chesterfield Markham Vale M1 J29A
• Bolsover M1 J28 Castlewood Business Park inc Common Rd, Famwell Lane, Berristow Lane
• Ashfield Sherwood Park M1 J27
Doncaster iPort
Prominent new logistics park on M18 J3. Currently 2.6m sqf fully occupied. Potential to reach 6m
sqft of which 2.4m sqft available in proposed units ranging from 66,00 to 800,000 sqft. The 2.6m sqft
leased 2016-2020 at 0.7m sqft per annum. Projected full at 2025.
Doncaster Balby Carr Bank / Trax Park
Two zones east and west of the Rail Terminal. Around 28 units totalling 3.7m sqft of which 13 are
over 100,000 sqft totalling 3.4m sqft. No availability. 8 deals since 2011 averaging 0.2m sqft per
annum. One further sale of a manufacturing building in 2017.
Doncaster M18 J4
Large and small scale industrial offer. 47 units at 5.6m sqft of which 8 are over 100,000 sqft totalling
5.1m sqft. 1 large units available 400,000 sqft built 2020. 4 large deals since 2014 totalling 1.3m sqft
or c190,00 sqft per annum.
Doncaster A1M J38 Rockingham Way
8 properties totalling 3.4m sqft, no availability. All over 100,000 sqft. 2 large deals recorded since
2011 totalling 530,000 sqft or c50,000 sqft per annum.
Sheffield Core
44 properties of which 9 properties over 100,000 sqft. Total 5.1m sqft of which 4.3m sqft larger
properties. One unit of 100,000 sqft (1997) listed as available. Two further large units (but under
100,000 sqft) proposed at Bessemer Park of 82,000 sqft 94,000 sqft. 6 deals recorded since 2013
totalling 1.7m sqft or 200,000 sqft per annum. Two further sales in recent years 180,000 sqft. New
units expected to be taken within a year based on trend.
20Manton Wood Business Park, Bassetlaw
15 properties totalling 3.5m sqft of which 7 are over 100,000 sqft totalling 3.3m sqft. One existing
70,000 sqft unit to let built in 1997. One further 335,000 sqft building proposed which is prelet. 4
deals completed since 2013 totalling 500,000 sqft or 70,000 sqft pa. Two sales (same building) in
recent years, 140,000 sqft.
Chesterfield Markham Vale M1 J29A
32 industrial listed properties totalling 1.3m sqft of which 3 are over 100,000 sqft accounting for 0.7m
sqft. No large properties available. Two new units proposed of c200,000 sqft each, of which one
available and one prelet. 3 large deals completed since 2015 totalling 680,000 sqft or 115,000 sqft
pa. New available units have 3-4 years absorption based on trend.
Bolsover M1 J28 Castlewood Business Park
70 properties totalling 5.1m sqft of which 14 units over 100,000 sqft being 3m sqft. None available.
Six properties proposed generating 1.3m of which 3 units not prelet bringing 460,000 sqft to market
open. 8 deals completed since 2012 totalling 2.0m sqft or 220,000 sqft per annum. One sale in 2013
of a 50,000 sqft manufacturing unit. New units have a 2 year projected take up based on trend.
Ashfield Sherwood Park M1 J27
28 units providing 1.8m sqft of which 7 over 100,000 sqft being 1.0 sqft. One warehouse available
built 1998 80,000 sqft. None proposed. 3 large deals since 2017 accounting for 500,000 sqft or
125,000 sqft per annum. One further sale in 2020 of an 80,000 sqft warehouse.
21SUPPLY ASSESSMENT
As noted above the units available or under construction in the current market have less than 1 year
of supply based on past take up. The proposed supply in the commercial assessment tends not to
be uniform in its status but typically has full planning permission and is near market ready. However
there will be a substantial further pipeline of permissions not captured, as well as additional allocated
supply not yet brought forward, which is relevant to consider in the total supply planning terms.
A desktop exercise has been undertaken to assess the level of future supply. This has not involved
the authorities in the wider PMA. This relies primarily on two key documents which record the overall
employment supply, being:
• Nottingham Core HMA and Nottingham Outer HMA Employment Land Needs Study (ELNS)
Report May 2021; and
• Sheffield City Region Strategic Employment Land Appraisal (SELA) Report May 2020.
Sites identified in these documents have been considered as suitable supply using the following
criteria:
• Within PMA as defined herein
• Minimum 2.4 ha net area, assuming 100,000 sqft (9,000 sqm) unit requires 40% plot ratio
• Proximity and connection to the strategic road network
• High level assessment based on allocation, current use, ownership (where known),
application status or other publicly available promotional material ie masterplan
The full assessment is provided in appendix A and findings summarised below. Where known the
plot or floorspace has been used to fill out further details, estimates in appendix A are italicised. Here
where an application is not permitted or allocation without application exists judgment has been used
on site potential. Inevitably this exercise is subjective due to data limitations and the need to rely on
professional judgement. This is considered acceptable given the study is not a joint logistics
assessment to determine need and supply for all authorities, but rather an effort to consider the role
of the Bassetlaw A1 element in the wider PMA.
The summarised assessment indicates that Doncaster has the largest supply of future strategic sites
including iPort, and J6 M18 Thorne North.
22Thereafter Bassetlaw has the greatest supply although the draft allocation at Apleyhead Junction
makes up much of this and would be the single largest logistics development in the PMA.
Indicative supply of future strategic distribution, full PMA
Authority Area for Sqft known Comment
large units or est.
(Ha) est.
Apleyhead Junction, Worksop
Bassetlaw 220.1 7.5m
contributes 119 ha / 4.4m sqft alone
PMA area only (Hoyland / Deane
Barnsley 41.9 1.3m
valley)
Focus at Coalite Strategic
Bolsover 63.3 1.1m
Regeneration Site
Focus at Staveley, assumes large unit
Chesterfield 24.7 1.1m
brought forward
Doncaster 174 8.2m iPort and Thorne North large capacity
NE Derbyshire 18.8 500,000 Focus at Coalite
Rotherham 50.8 1.7m
Sheffield 10.3 400,000 Bessemer Park
Positive assumptions about future of
Erewash 28 1.2m Stanton Regeneration, currently no
planning status
Permissions at a number of allocated
Nottingham 23.1 600,000
sites
Ashfield 16.8 700,000 Primarily at Harrier Park
NSDC23 Land south of Newark
masterplan indicates large units;
Newark 53.1 2.4m
NSDC3 Land off Beacon Hill Road
marketed for large units
Total 725 27.1m
Source: CoStar / Iceni
The table below puts the supply in context of the historic take up and net deliveries.
This demonstrates that there is around 8 years worth of future supply based on take up, or 11 years
of historic deliveries. The take up model is inaccurate as may include some over estimated needs as
take up can be accounted for by leases into space vacated by lease breaks, but at the same time
has seen recent constraint by lack of supply which (combined with rising rents) points to repressed
market activity. As note previously, using a long term take up trend makes little difference to the
outcomes. Again deliveries are likely to significantly under represent future needs given that the
23market is currently too constrained (represented by low vacancy and rising rents alongside market
feedback) and clearly lacking a very low immediate availability, suggesting the recent past has not
kept up with actual market / business need. A long term take
It is of note that the Apleyhead Junction site accounts for 4.4m sqft of pipeline or around 1.5 years
(1.4 yrs of take up, 1.8 yrs of deliveries) of historic requirements alone, which is already factored into
the below table.
Supply and balance at June 2021 (100,000 sqft+) Full A1 PMA
Status Total sqft Av 5 yr Av 5yr Years supply Years supply
Take Up Deliveries (5yr annual (5yr annual
(sqft) (sqft) av. take up) av. delivery)
Existing units (Chpt 4) 0.9m 0.3 0.4
Planning Pipeline (App. A) 27.1m 7.7 11.3
3.5m 2.4m
All 28.0m 8.0 11.7
All (exc unallocated / exc PP)* 26.8m 7.7 11.2
Source: CoStar / Iceni Analysis
* Stanton Regeneration 1.2m sqft
When considering this level of supply it is useful to emphasise:
• Use of judgement in the assessment process
• A positive approach to assessment, notably including a limited number of undecided or
proposed developments, if the most significant (Stanton Regeneration 1.2m sqft) is deducted
then the total pipeline falls to 7.7-11.2 years of take up / delivery (or 6.4-9.3 exc Apleyhead
Junction)
• That Local Plans should ideally plan for 15 years of future needs
• That the market for strategic distribution is presently very acute and historic take up and
deliveries may underestimate requirements in the next economic cycle
Taking the above points in the round, and considering the PMA assessed here, based on historic
take up / delivery, the total levels of supply are likely to be inadequate for the future 15 year period
of local planning. Bassetlaw’s Apleyhead Junction site appears to make an important contribution to
the overall need.
The 15 year period is considered appropriate given that the NPPF Para 22 says strategic policies
should look ahead a minimum of 15 years, with Footnote 15 saying except for retail. By implication
there is an expectation that plans will look at supply 15+ years into the future and Government’s
24intension in setting this out is that plans seek to meet development needs over this length of period.
In Iceni’s view this should be read with NPPF Para 82 which says planning policies should set out a
clear economic vision and strategy, plus set criteria for or identify strategic sites for local and inward
investment and to meet anticipated needs over the plan period, and to allow for flexibility to
accommodate needs not identified in the plan and enable a rapid response to changes in economic
circumstances. This para does relate specifically to employment. Given the property needs of
businesses vary, it is important to maintain a choice of sites within the market/ sub-region.
Furthermore given the dynamic nature of the current market and the trend of growth in e-retailing (as
above), a 15 year period is entirely justified.
The Nottingham ELNS, which does not attempt to quantify the logistics position, reflects that based
on stakeholder comment there is capacity in the market for a further one, or even two, very large
regional distribution centres near to these key M1 junctions and that at current levels of demand, two
such schemes, if made available, would be at capacity within a decade.
In the present study we aggregate the south / east SCR area with the Nottinghamshire position, but
find that even with the significant supply in Doncaster, the wider M1 / A1 corridor supply levels are
around 8 years’ worth of past take up / 11 years of delivery. Whilst this is significant, it indicates that
when planning for 15 years or more in the Local Plan process, there is likely to be insufficient supply
overall.
25ROLE OF THE A1 IN WIDER MARKET CONTEXT
The demand and supply assessment considers the full PMA as defined herein, accounting for
occupiers seeking strategic space across Nottinghamshire and South Yorkshire. In the context of
providing advice to the Bassetlaw Local Plan making progress, it is necessary to focus on the role of
the A1 corridor - Doncaster to Newark - in the wider PMA.
Specific property market agent engagement was undertaken on the role of the A1. Comments need
to be considered in the light of the key requirements for strategic operators being:
• labour availability;
• access to customer base via strategic road network; and
• large scale land plots.
The key messages, supplementing those in chapter 4, are that the A1 has become significantly more
attractive in the last 2 years as:
• Very significant changes in macro trends – ecommerce requirements – leading to demand
for bigger units, higher units, bespoke units both logistics and manufacturing, with a significant
lack of availability on the M1 corridor north of Castle Donnington to Sheffield.
• M1 is very constrained in terms of greenbelt designation, A1 area has greater availability of
land and in the current market it is simply a case of available land in the area of search.
• People looking further afield than previously from core markets due to labour market
availability.
• Land on the M1 tends to be controlled by major institutions, whereas the A1 tends to be more
flexible and provides new opportunities including for owner occupiers.
• The A1 is not as traffic congested whilst the M1 is increasingly problematic for movements.
• The A1 is overall a cheaper location for land and rents.
• Occupiers willing to look at broader areas, increasing typical search from 25 mile to up to 50
mile – 100 mile radius.
• Good connectivity to the M1 via A57.
26• Rate of take up at iPort has been phenomenal - half of the scheme has gone in 5 years that
should have taken 20 years – this is driving the developer / occupier market to search for
more land in the sub region.
• The market has shifted from 100-150k sqft buildings to over 500,000 sqft, with additional land
implications and a very significant undersupply of suitable quality sites.
• Bassetlaw already has a number of significant warehouses – Wilkos, B&Q, DHL – and is
already an established location.
• Doncaster is considered to have a reasonable level of supply however Nottinghamshire’s M1
supply is very tight and this has generated demand pressure into the A1 and M18.
• A1 corridor authorities tend to be more pro growth having not had the historic investment from
logistics occupiers.
The above messages are useful and develop a clear picture of the enhanced role of the A1 in the
logistics market. In a period of fast rising demand responding to structural economic change, the lack
of supply and policy constraints on the M1 has shifted focus onto the A1 which is able to provide
levels of connectivity and labour sufficient to attract strategic occupiers. This is not to negate the role
of the M18 and the benefits of forthcoming supply, but rather a manifestation of a supply demand
imbalance in the wider area.
27CONCLUSIONS
The key findings of this report are:
• That as a FEMA, Bassetlaw is broadly self contained but has strong links to Sheffield City
Region and further links to Nottinghamshire authorities to the south.
• In terms of the property market areas for large logistics, engagement with industry indicates
that the A1 (Doncaster to Newark with Bassetlaw at the core) is contained within a larger
demand area paralleling the M1 corridor running from Nottingham to the near side of
Barnsley.
• The wider literature reports that the effects of the Covid-19 pandemic have drastically
increased demand for large scale logistics facilities and that current supply levels in many
areas are inadequate to meet business needs. The Sheffield / Doncaster market is
considered to have greater responsiveness to this demand although the majority of market
ready pipeline supply remains prelet.
• In the study area rents have continued to rise, whilst vacancy for larger units remains below
the market optimum. Leases on units have averaged 3.5m sqft per annum on average of the
last 5 years and completed floorspace 2.4m sqft per annum. At the time of writing only 3
existing large units are reported as available. Of existing logistics parks reviewed in the study
area only iPort has significant expansion plans.
• A desktop based supply assessment of the South Yorkshire / Nottinghamshire authorities
within the PMA for sites able and likely to accommodate large scale units suggests up to 30m
sqft of future supply or in the region of 8 years based on past take up / 11 years of deliveries
but this falls to 6.4 / 9.4 years without Bassetlaw’s Apleyhead site. Doncaster makes the
greatest contribution to the pipeline.
• The A1 area encompassing Bassetlaw and surrounds has seen a dramatic rise in logistics
interest as the M1 becomes increasingly congested with constraints on available land and
pipeline supply for logistics. It has connectivity, available labour and land to meet logistics
needs that the wider PMA is currently not sufficiently providing.
The conclusions and recommendations arising are:
• That the role of the A1 and notably the Bassetlaw section that is connected to the M1 (via
A57) and M18 has changed rapidly in recent years. Whilst Manton Wood Business Park has
historically hosted a number of distribution businesses, the dramatic rise in demand for large
scale logistics at a national level, combined with a series of supply side constraints on the
28M1, has led to the better connected and labour served areas of the A1 becoming an attractive
prospect to developers and occupiers alike. The role is therefore now as a secondary or sister
logistics market to the M1 corridor.
• One of the challenges arising from this study is the separation or integration of FEMA and
PMA geographies. Bassetlaw’s A1 is influenced by both the M1 running south to Nottingham
and north to Hoyland and the M18 corridor to Thorne. This crosses the SCR, which Bassetlaw
was formerly a part, D2N2 LEP and the Nottingham Inner / Outer HMA. Considering the
supply data, SCR is far better served whilst supply is limited in Nottinghamshire. The ELNS
recognised the logistics market undersupply and it is possibly that a greater volume brought
forward would deflate the A1 corridor. It could be inferred that significant supply in Bassetlaw
is meeting some of the Nottingham Inner / Outer HMA logistics needs however it is not the
role or intention of this study to ascertain the Nottingham HMA logistics requirements, rather
to provide a perspective on the role of the A1 in the overall PMA.
• Notwithstanding the above point, based on the research undertaken herein, it seems
reasonable that Bassetlaw does bring forward large sites such as Apleyhead Junction, that
these are desired by the market and will not lead to an oversupply in the medium term across
the South Yorkshire / Nottinghamshire / Derbyshire authorities as assessed in the PMA. The
assessment suggests around 8 years of supply, based on past take up, is in the pipeline, and
this is substantial, particularly in Doncaster. However with Local Plans expected to provided
for 15 years or more; and indicators suggesting the recent past rate of take up / delivery under
represents future need; on balance the sites in Bassetlaw (most notably Apleyhead Junction)
and most likely further sites in the southern part of the PMA will be required. This aligns with
the ELNS conclusions.
29APPENDIX A
Table A0.1 2001-19 and 2011-19 employment change
Site Name Gross Net Authority Remaining Sqft known Status Comment
Area (ha) Area for large or est.
(ha) units (Ha)
est.
Bassetlaw – Derived from HEDNA 2020 / Draft Local Plan 2020
Total site expansion is approximately 93,000 sqm
Manton Wood Extension 24.6 10.7 Bassetlaw 7.8 335,000 for large scale units. One built out, one further unit
remaining of 335,000 sqft
18/00413/OUT indicative masterplan shows no units
Shireoaks Common 26 7.5 Bassetlaw PP
over 100,000 sqft
Remaining area according to website particulars, two
Symmetry Park 22 2.8 Bassetlaw 12.7 541,500
large units
Draft Draft Local Plan allocation indicates 3ha employment
Welbeck Colliery 26.9 3 Bassetlaw
allocation area, EDNA refers to Rural Enterprise Hub
Draft Draft Local Plan allocation indicates 5ha employment
Carlton Forest 0.6 5 Bassetlaw
allocation area. Not well connected to strategic network.
Draft Local Plan allocation indicates 38.4ha
High Marnham Energy Draft employment area. The site offers a unique
60.0 38.4 Bassetlaw
Hub allocation opportunity to support specific employment uses
within the renewable energy and low carbon
0technology sectors. Not well connected to strategic
network.
Draft Mixed use development, not well connected to
Trinity Farm 8.0 5.0 Bassetlaw -
allocation strategic network.
Draft This site is labelled for manufacturing and
Explore Steetley 47 16 Bassetlaw
allocation assembly for modern methods of construction.
Apleyhead Junction, Draft HEDNA estimates 413,000 sqm, planning application
189 118.7 Bassetlaw 118.7 4,420,000
Worksop allocation forthcoming. Caddick website refers to ‘over 4m sqft’.
Snape Lane, Harworth 80.9 80.9 Bassetlaw 80.9 2,150,000 PP Planning permission for c200,000 sqm,
HEDNA 2020: higher value sector investment
Bassetlaw’s Garden Draft opportunities at the garden village will be supported
15.0 10.0 Bassetlaw
Village allocation by traditional units and flexible modern workspaces
and offices. Focus away from strategic B8.
Sub Total Bassetlaw estimated area 220 ha 7,446,500 sqft
SELA area (exc Bassetlaw) *Barnsley sites outside of Primary PMA
Hoyland West Masterplan shows Plot 1 (18.35 ha),
Land West of Sheffield
Plot 2 (9.02 ha), Plot 3 (5.09 ha), Plot 4 (2.03 ha), Plot
Road, Hoyland (Equines 49 39 37 04 Barnsley 9.02 386,056 UC
5 (1.70 ha). Plots 1 and 2 earmarked for large scale
Park, Barnsley)
employment.
Shortwood Extension, Planning permission granted for Phases 2 and 3 of
Hoyland (Allocation ES15) Gateway 36 in Oct 2020. ES15 allocation layed out
11 81 5 79 Barnsley 5.79 247,812 UC
(Gateway 36 Phase 2) with 2 units - Unit 9 (27,500 sq.ft) and Unit 10
(275,000 sq.ft)
Rockingham (allocation Owned Barnsley Council. No planning application but
4 43 4 43 Barnsley 3.45 147,660 Allocation
ES14), Hoyland access to site is from roundabout in place. Iceni
1You can also read