Deep Dive on Costco's unit expansion opportunity - an underappreciated long-term driver - EQUITY RESEARCH | August 20, 2020 For required conflicts ...
←
→
Page content transcription
If your browser does not render page correctly, please read the page content below

Deep Dive on Costco’s unit expansion
opportunity – an underappreciated
long-term driver

                                                                       EQUITY RESEARCH | August 20, 2020
                                                      For required conflicts disclosures, please see page 19.

  Disseminated: Aug 20, 2020 00:45ET; Produced: Aug 19, 2020 23:32ET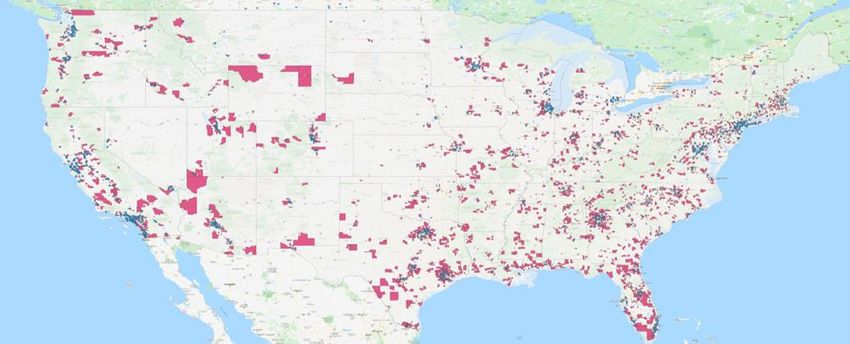
RBC Capital Markets, LLC
EQUITY RESEARCH
                                                                                                    Scot Ciccarelli, CFA     (Analyst) Beth Reed (Analyst)
                                                                                                    (212) 428-6402                     (212) 428-6966
                                                                                                    scot.ciccarelli@rbccm.com          beth.reed@rbccm.com

                  August 20, 2020

                  Deep Dive on Costco’s unit expansion opportunity –
                  an underappreciated long-term driver
                  Our work with RBC’s data science team, RBC Elements, indicates that Costco should be able to increase
                  its US store base by more than 400 warehouses or ~75% over time which, at current expansion rates,
                  enables nearly 20 years of incremental unit growth – Our RBC Elements team filtered the ~74,000 US
                  census tracts for those with similar demographic characteristics to existing Costco locations, trying to
                  quantify the company’s expansion potential. Using 5 key filters (4 by state), back testing of our criteria
                  predicted 21 locations out of the 28 warehouses that Costco opened in 2019 (75% hit rate), within a 15
                  mile radius. Interestingly, of the 7 warehouses that our models did not forecast, most were in markets
                  with smaller population densities than where we had set our filters. In our view, this likely indicates
                  management’s confidence in their ability to generate strong returns in even smaller markets than
                  what they have historically targeted, which could effectively increase their white space opportunity
                  even further.

                  Unit expansion is an underappreciated, long-term growth driver for Costco – Costco rarely comes up
                  in investor conversations as a “unit growth story” and, to be fair, it is not an Ollie’s Bargain Outlet or
                  Five Below situation, where they are growing units by 15%-20% annually. However, while Costco’s new
                  store opening cadence does bounce around a bit (ranging from ~2.5%-4.5%), its new store CAGR in the
                  US has averaged ~3% over the last 10 years. Based on our projection that the company should be able
                  to add another 400+ warehouses in the US, we estimate the company should be able to maintain a
                  ~3% warehouse expansion rate for the next ~20 years.

                  New warehouse expansion augments the company’s top-tier comp growth – Costco’s core US comps
                  (excluding FX and fuel) have averaged ~5.5% for the last decade, including ~7% comps over the last
                  3 years. We believe it is this strong, consistent traffic and comp growth that drives COST shares.
                  While comps will likely remain the key focus for most investors, we view Costco’s unit growth as an
                  incremental driver for the company, helping it further expand its total wallet share and buying scale
                  in the US.

                  Costco is the ultimate “rinse and repeat” model – With one of the lowest markups in all of retail, the
                  company constantly invests in “value” for its members. These “values”/low prices resonate strongly
                  with consumers, driving high levels of sales/store and membership renewal rates. The company’s sales
                  growth enables it to constantly increase its buying scale (which it concentrates on ~3,800 SKUs at any
                  one time), further lowering prices for its members. Rinse and repeat.

                  Net/net – We believe that Costco’s extreme consumer value proposition, driven by its immense buying
                  scale and razor thin markup process, makes it the ultimate rinse and repeat model. Despite its size, our
                  proprietary research, led by our data science team RBC Elements, suggests that the company should
                  be able to add another 400-500+ locations in the US over time, or 75%-90% above current levels. In
                  addition, given the company’s relatively small international base (~240 locations, including ~100 just in
                  Canada) we think its overseas growth opportunity may even exceed that of the US. We believe these
                  factors, coupled with additional productivity enhancements (including e-commerce, vertical integration
                  and private label), provide Costco with one of the highest barriers to entry in all of retail and support
                  the company’s premium valuation.

                                                                            Priced as of prior trading day's market close, EST (unless otherwise noted).
                                                                                                              All values in USD unless otherwise noted.
                  See RBC Elements page at the end of this note.                            For Required Conflicts Disclosures, see Page 19.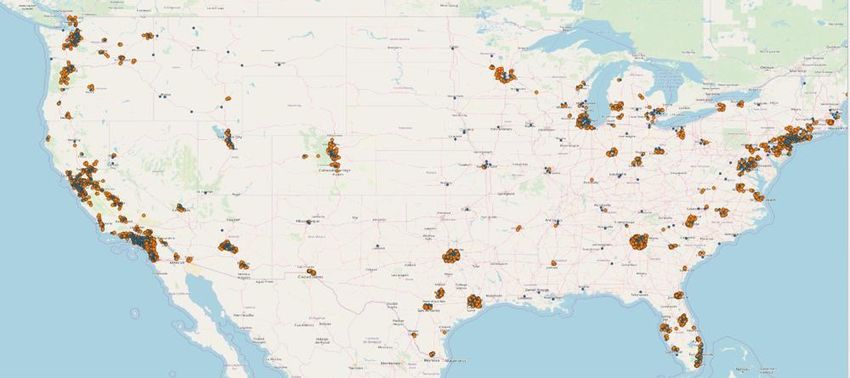
Deep Dive on Costco’s unit expansion opportunity – an underappreciated long-term driver
Filtering for key real estate characteristics
Methodology – Our data science team, RBC Elements, utilized US Census Tract data along
with their proprietary RBC Elements Location Intelligence Package to analyze the
demographics and characteristics of areas where Costco has previously opened warehouses.
The team then applied a filtering algorithm utilizing 5 different elements based on
demographics/characteristics that we found for most existing warehouses. E1
Filter 1 – Total population in an area – We first isolated census tracts with a total
population of at least 5,500 people. This enabled us to eliminate population bases that
we deemed too small to support a full Costco warehouse, since Costco warehouses likely
generate the highest sales per location (~$217mm in TTM revenue and ~70,000 member
households) in retail. For context, Costco’s sales per store are ~4x that of an average
Home Depot and even ~2.5x a Walmart Superstore (despite Walmart’s size advantage
of ~178,000 square feet vs. ~146,000 for an average Costco). Thus, the stores obviously
need to draw from a large enough population base to generate acceptable returns.
Exhibit 1: Census tracts with a population of at least 5,500 (~18,400 out of ~74,100 total)
Source: RBC Capital Markets, RBC Elements
Filter 2 – Population Density – For our remaining Filters (2-5), we applied our process by
state, given the massive differentiation in size, population densities and median incomes
across the US. For Filter 2, we identified the existing Costco with the lowest population
density within a 10 mile radius of its location and assumed that was the minimum
threshold for that particular state. For example, in the densely populated state of
Massachusetts, the lowest population density within a 10 mile radius of an existing
Costco is 583 people per square kilometer. As a result, for store location possibilities in
MA, we used 583 as the minimum for our additional Massachusetts locations. However,
in Idaho, we found that the lowest population density within a 10 mile radius of an
existing Costco was 94. Therefore, we used 94 as our minimum threshold for additional
warehouses in Idaho. Finally, for states where Costco currently doesn’t have a physical
presence, our team identified geographic locations where the population density was
greater than, or equal to, the 10th percentile of all existing Costco locations (i.e., Costco
already has at least 10% of its warehouses in locations with lower population densities
than the ones that we identified).
E Learn more about RBC Elements on page 17.
August 20, 2020 2
Deep Dive on Costco’s unit expansion opportunity – an underappreciated long-term driver
Exhibit 2: Minimum population density by state
District of Columbia 2,208 South Dakota 245
Massachusetts 583 South Carolina 245
Oklahoma 582 Maryland 229
Delaware 576 Vermont 165
New Mexico 537 Iowa 155
New Hampshire 477 Utah 143
Kansas 453 Wisconsin 130
Kentucky 390 New York 128
Indiana 378 Arizona 120
Missouri 365 Virginia 120
Ohio 352 New Jersey 114
Nebraska 349 California 106
Texas 329 Idaho 94
Georgia 326 Michigan 88
Florida 316 Nevada 88
Illinois 313 Montana 68
Tennessee 293 Hawaii 51
Louisiana 287 Minnesota 46
North Carolina 275 Washington 37
Connecticut 266 Oregon 33
Pennsylvania 255 Alaska 26
North Dakota 248 Colorado 12
Alabama 247
Source: RBC Capital Markets, RBC Elements
Filter 3 – Median Income – We then repeated the above by-state process using Median
Income within a 10 mile radius as our filter parameter. For example, in California, the
lowest median income within a 10 mile radius is $43,980, so we used $43,980 as the
minimum threshold for additional California sites. We then copied this process to the
rest of the states in the US.
Exhibit 3: Minimum median household income by state
District of Columbia $90,409 Virginia $53,195
Alaska $81,817 North Carolina $52,822
New Hampshire $81,513 Nevada $52,022
New Jersey $72,477 Illinois $52,015
Hawaii $71,126 Missouri $51,969
Delaware $68,150 New Mexico $51,862
Tennessee $67,525 Kansas $51,693
Vermont $66,522 Indiana $51,166
Connecticut $64,761 Ohio $50,332
South Dakota $63,731 Louisiana $50,271
Maryland $63,656 Montana $50,214
Colorado $62,793 Idaho $50,058
Oklahoma $62,627 Michigan $49,789
Iowa $60,094 Georgia $48,428
Nebraska $59,002 Washington $48,006
North Dakota $58,263 South Carolina $47,838
Utah $57,582 Florida $45,751
Wisconsin $56,571 Oregon $45,599
Massachusetts $55,845 Alabama $45,404
New York $55,285 California $43,980
Minnesota $54,779 Texas $42,719
Kentucky $54,453 Arizona $42,375
Pennsylvania $54,408
Source: RBC Capital Markets, RBC Elements
August 20, 2020 3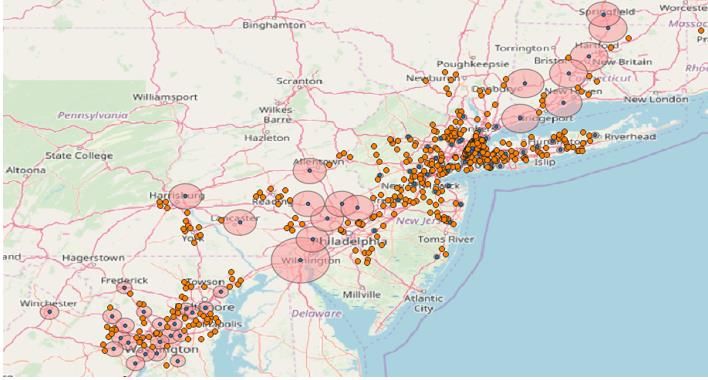
Deep Dive on Costco’s unit expansion opportunity – an underappreciated long-term driver
Exhibit 4: Census tracts with comparable Population Densities and Median Incomes (blue dots) to existing Costco locations
(orange dots)
Source: RBC Capital Markets, RBC Elements
Filter 4 – Cannibalization – Our 4th filter tried to account for excess cannibalization.
Specifically, we looked at the minimum distance between the closest 2 existing Costco’s
in each state and classified that distance as the “buffer zone” for each potential new
store location. For example, in Florida, the closest 2 Costco locations are located ~6
miles apart from one another. Our models would then eliminate any potential locations
in Florida that was within 6 miles of an existing Costco. The close-up of the Northeast in
Exhibit 5 below shows existing Costco locations as orange dots, while the blue dots are
potential locations that passed through the first 3 filters. Then the blue dots with red
radiuses also passed our “cannibalization test”.
August 20, 2020 4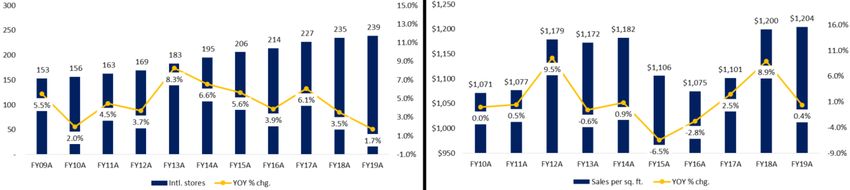
Deep Dive on Costco’s unit expansion opportunity – an underappreciated long-term driver
Exhibit 5: Locations with no existing Costco stores with a relevant distance (blue dots with red radiuses)
Source: RBC Capital Markets, RBC Elements
Filter 5 – Competition – While we strongly suspect that Costco is very comfortable in its
ability to “compete” with other warehouse operators (discussed more below), we still
wanted to account for the proximity of key competitors (Sam's Club and BJ’s). Similar to
the by-state exercises highlighted above, we filtered for the minimum distance between
Costco and the closest Sam’s or BJ’s in each state and eliminated any location that fell
within that competition corridor. For example, in Illinois, the closest competitor to a
Costco is Sam’s Club, which is located ~2 miles away. Our models would then eliminate
any potential location in Illinois that was within 2 miles of an existing Sam’s Club or BJ’s
location. Obviously this is another example where we have a very wide divergence in
competitive density by state, whereby the minimum distance between Costco and Sam’s
in Idaho is ~46 miles, but in NJ, Costco practically shares a parking lot with a BJ’s, which
is located just 0.6 miles away.
August 20, 2020 5
Deep Dive on Costco’s unit expansion opportunity – an underappreciated long-term driver

                  Exhibit 6: Minimum distance to competitor by state
                                        Costco to Sam’s Club                                                 Costco to BJ’s
                  State               Min Distance State                 Min Distance   State          Min Distance State             Min Distance
                  Alaska                 1,225.69 Minnesota                     1.10    Hawaii            4,437.41 Illinois                229.90
                  Washington               282.14 Tennessee                     1.04    Alaska            2,478.10 Kentucky                215.99
                  Oregon                   233.52 New Jersey                    0.78    Oregon            1,918.35 Louisiana               182.01
                  Idaho                     45.59 Pennsylvania                  0.78    California        1,716.70 Indiana                 124.09
                  Delaware                  32.08 Missouri                      0.73    Washington        1,693.75 Tennessee               116.95
                  Massachusetts             24.42 Michigan                      0.67    Nevada            1,681.66 Vermont                  74.55
                  Vermont                   20.03 Indiana                       0.52    Idaho             1,491.33 Alabama                  56.04
                  District of Columbia      14.91 Alabama                       0.42    Utah              1,489.16 South Carolina           17.65
                  Iowa                       5.39 South Carolina                0.40    Arizona           1,438.23 District of Columbia      6.55
                  New York                   4.69 Maryland                      0.40    Montana           1,285.88 North Carolina            4.40
                  Connecticut                4.35 Arizona                       0.39    New Mexico        1,190.04 Delaware                  2.70
                  Oklahoma                   3.29 Georgia                       0.39    Colorado          1,140.41 Georgia                   1.94
                  Louisiana                  2.81 North Carolina                0.36    Puerto Rico       1,075.28 Ohio                      1.88
                  Nebraska                   2.61 Texas                         0.35    North Dakota        744.30 New Hampshire             1.80
                  Hawaii                     2.42 Ohio                          0.32    South Dakota        694.12 Maryland                  1.25
                  Montana                    2.04 Florida                       0.27    Nebraska            671.15 Pennsylvania              0.98
                  Kentucky                   2.01 Colorado                      0.24    Kansas              646.62 Michigan                  0.96
                  Illinois                   1.88 Puerto Rico                   0.24    Oklahoma            635.75 New York                  0.83
                  Nevada                     1.82 California                    0.22    Texas               498.01 Massachusetts             0.69
                  New Hampshire              1.80 Virginia                      0.22    Minnesota           488.34 Connecticut               0.62
                  South Dakota               1.68 New Mexico                    0.19    Missouri            447.48 New Jersey                0.56
                  North Dakota               1.67 Kansas                        0.18    Iowa                434.95 Florida                   0.19
                  Wisconsin                  1.43 Utah                          0.18    Wisconsin           241.88 Virginia                  0.02
                  Note: Distance in miles.
                  Source: RBC Capital Markets, RBC Elements, US Census

                  Our filtering methodology yielded strong predictive capabilities;
                  75% hit rate on recent openings
                  In conjunction with RBC Elements, we back tested the above filters/methodology on the
                  warehouses that Costco opened in the US in 2019. Of the 28 stores that Costco opened, 21
                  of the warehouses were within 15 miles of the locations identified by our filtering
                  algorithm – a 75% hit rate. We believe these results suggest that the criteria that Costco
                  typically uses for its warehouse site selection is relatively similar to the methodologies that
                  we have utilized. Namely, total population, population density, median incomes and
                  proximity of both other Costco locations and that of direct competitors. We suspect that
                  other factors such as co-location partners and highway access may also play a modest role.
                  Nevertheless, we believe that our 75% hit is statistically significant and a strong enough
                  indicator that we can then extrapolate our findings to assess the company’s future
                  expansion potential.

August 20, 2020                                                                                                                                  6
Deep Dive on Costco’s unit expansion opportunity – an underappreciated long-term driver

Exhibit 7: Opened warehouses in 2019 – predicted (red dots) vs. missed (purple dots) locations – 75% hit rate

Source: RBC Capital Markets, RBC Elements

                                            Costco has a new warehouse opportunity in 400+ locations in the
                                            US – 75% higher than today’s levels
                                            Using the filters we established above and analyzing the ~18,400+ census tracks with over
                                            5,500 people, we have identified 403 additional locations for potential Costco warehouses
                                            or ~75% more than today’s base of 547. Further, based on the company’s ~3% new
                                            warehouse CAGR in the US, we estimate the company could continue to expand at a
                                            similar rate for the next ~20 years.

Exhibit 8: RBC Elements has identified a ~400+ new warehouse expansion opportunity for Costco

Source: RBC Capital Markets, RBC Elements

August 20, 2020                                                                                                                            7
Deep Dive on Costco’s unit expansion opportunity – an underappreciated long-term driver
Could 400 new warehouses be conservative? We think so
Our 75% hit rate still means that we had “filtered out” 25% of the warehouses that they
actually opened in FY19 – While we believe that the thresholds we established for new
stores were reasonably conservative, we used them because they were within the
parameters already established by Costco in each state that it currently operates. However,
while our predictive work had a ~75% hit rate on new warehouses that the company opened
in FY19, it also means that 25% (7 of the 28) of the warehouses that they actually opened
had been filtered out from the thresholds we had established. Specifically, 6 of the 7 locations
that we had “filtered out” were in markets with lower population densities than where we
had set our “minimum density” limits. In our view, this suggests that management likely
expects to generate strong sales growth and returns in even smaller/less dense markets than
what it has traditionally targeted.
Confident in competitive positioning – In addition, 3 of those same 6 stores also had
another warehouse competitor in closer proximity than the barriers that we had previously
set. In our view, this further indicates the company’s confidence in its ability to compete and
gain share against its direct competitors. In other words, 3 of the 7 locations that the
company opened in FY19 that didn’t make it through our filter algorithms were BOTH in
smaller/less dense markets than the ones we had identified AND had a direct competitor
closer than what it previously had in that particular state.
500+ doesn’t seem unreasonable – As highlighted above, using the filters and parameters
we established – all of which were key characteristics of existing Costco locations in each
state – we still identified over 400 additional potential Costco sites. Nevertheless, since the
company opened 30%+ more stores than what our models would have predicted (7 in
markets that we ruled out vs. the 21 that we were able to identify), then it would suggest
that new store openings could potentially increase our identified base by 120-130 units (30%
more than the 400 we have identified), potentially representing 500+ warehouses over time
or nearly double today’s base.
Exhibit 9: Warehouses missed by our filtering criteria
State Reason not hit
Alaska Median income not larger than state min
California Population density not larger than state min
Connecticut Population density not larger than state min
Population density not larger than state min
Indiana
Sam's Club within established radius
Population density not larger than state min
North Carolina
Sam's Club and BJ's within established radius
Median income not larger than state min
Oklahoma Population density not larger than state min
Existing Costco and Sam's Club and within established radius
Median income not larger than state min
South Carolina Population density not larger than state min
Existing Costco within established radius
Source: RBC Capital Markets, RBC Elements
August 20, 2020 8Deep Dive on Costco’s unit expansion opportunity – an underappreciated long-term driver
Invest in “value”; drive customer loyalty/total sales growth;
rinse and repeat
Strong comp growth and membership model remain the key drivers to Costco’s growth
algorithm – As we have previously highlighted, we view Costco as the ultimate “rinse and
repeat” model. As one of the biggest retailers in the US (~$116 billion in the US and ~$165
billion at the enterprise level, thus behind only Walmart, Amazon and Kroger), Costco has
greater buying scale than the vast majority of its competitors. Further, since the company
concentrates its buying power on only ~3,800 SKUs at one time (with a treasure hunt
exercise in some categories), we would argue that it likely has the strongest buying power in
all of retail for many products.
Exhibit 10: Total 2019 US sales for select major retailers
400,000
341,004
350,000
300,000
250,000
200,000 170,773
150,000 122,286 115,917
95,455
100,000 78,112
50,000
0
Walmart US Amazon NA Kroger Costco US* Home Depot Target
Retail Sales US**
*Calendarized
**Estimated
Source: Company reports and RBC Capital Markets estimates
Unmatched buying scale magnified by extremely low mark-up structure – We think that
Costco’s extremely low markup structure may just be the most under-appreciated aspect
of the company’s model. In addition to being able to “buy better” than most, if not all of
their competitors, Costco also operates on one of the lowest GM structures in retail.
Excluding their membership fees, the company operates on ~11%-12% GMs, which implies it
only marks-up its goods by ~12%-13%! This is in sharp contrast to even low-margin grocers and
Walmart, which typically target GMs of 25%-27% and thus need to mark up their inventory by
35%-40% to achieve this level of GM. This mark-up gap enables Costco to have a 20%+ price
advantage on a same SKU basis even before factoring in relative buying power/scale.
Exhibit 11: Annual grocery industry gross margins vs. Costco
Costco Avg. Grocer
Invoice $100 $100
Mark-up 12% 37%
Resale $112 $137
Profit $12 $37
GM% 11% 27%
Source: Company reports and RBC Capital Markets estimates
August 20, 2020 9Deep Dive on Costco’s unit expansion opportunity – an underappreciated long-term driver
Rinse and repeat – As a result, we believe the combination of the company’s nearly
unmatched buying power and one of the lowest mark-up structures in all of retail enables
Costco to continually invest in very strong “value”/price for its members. This value
proposition keeps existing members coming back (90%+ renewal rate) and further expands
its membership base (+~4%-4.5% annual growth over the last 3 years). This productivity cycle
has led to continual increases in sales per square foot, total consumer wallet share and
further increases to its buying power which enables even better pricing…rinse and repeat.
Exhibit 12: Costco US store and sales/sq. ft. growth – FY09A-FY19A
Source: Company Reports and RBC Capital Markets
Membership model is the tool used to keep mark-ups to a minimum – We estimate
membership fees generate nearly 70% of EBIT, and this high-margin revenue stream provides
the profit subsidy that enables Costco to offer its extreme value proposition to its members.
The company’s “membership fees” are fairly minimal, at $60 for a basic membership or $120
for an “Executive” membership (Executive members get 2% cash back at the end of the year,
implying that members are better off signing up for an Executive membership at just $3,000
in annual purchase volume). Interestingly, even at this fairly low membership fee level, MFI
(Membership Fee Income) typically generates ~70% of EBIT, implying that the company is
operating this very large $160b sales operation at just a 1% operating margin, excluding MFI.
Exhibit 13: Profit subsidy; membership EBIT contribution
Membership EBIT Contribution
2013A 2014A 2015A 2016A 2017A 2018A 2019A
Net Sales Ex-Membership $102,870.0 $110,212.0 $113,666.0 $116,073.0 $126,172.0 $138,434.0 $149,351.0
Operating Income $3,053.0 $3,220.0 $3,624.0 $3,672.0 $4,060.5 $4,480.0 $4,903.0
Membership Fees $2,286.0 $2,428.0 $2,533.0 $2,646.0 $2,853.0 $3,142.0 $3,352.0
Membership % of EBIT 74.9% 75.4% 69.9% 72.1% 70.3% 70.1% 68.4%
EBIT $ Ex-Membership $767.0 $792.0 $1,091.0 $1,026.0 $1,207.5 $1,338.0 $1,551.0
EBIT % Ex-Membership 0.7% 0.7% 1.0% 0.9% 1.0% 1.0% 1.0%
Source: Company reports and RBC Capital Markets estimates
Buying scale + extremely thin markups (subsidized by MFI) = elite comp growth – Outside
of a modest slowdown in FY16 and FY17 due to membership disruptions when the company
shifted its credit card portfolio to Visa from American Express, Costco has posted very
strong/consistent comp growth for the last decade – despite its growing size (Costco will
likely exceed $160b in enterprise revenue in FY20). In addition, comps have further
accelerated over the last 3 years as its credit card disruptions ebbed, the company’s value
proposition continued to improve (an ongoing theme) and as an expanding economy (pre
Covid-19) fueled higher sales activity.
August 20, 2020 10Deep Dive on Costco’s unit expansion opportunity – an underappreciated long-term driver
Exhibit 14: Annual comps and revenue, FY11-FY20E
Annual Comps Ex-Fuel and FX
FY11 FY12 FY13 FY14 FY15 FY16 FY17 FY18 FY19 FY20E
US 5.0% 6.0% 6.0% 5.0% 6.0% 3.0% 3.7% 7.4% 6.4% 9.1%
International 10.0% 8.0% 6.0% 7.0% 7.0% 6.0% 4.2% 5.5% 5.4% 9.5%
Total 6.0% 6.0% 6.0% 6.0% 7.0% 4.0% 3.8% 6.8% 6.1% 9.3%
Total Revenue
$180,000
$160,000
$140,000
$120,000
$100,000
$80,000
$60,000
$40,000
$20,000
$-
FY11 FY12 FY13 FY14 FY15 FY16 FY17 FY18 FY19 FY20E
US International Total
Source: Company reports and RBC Capital Markets estimates
Incremental growth opportunities
Rapidly growing e-commerce business isn’t the margin drag that it is for most other
retailers – Today, the vast majority of retailers essentially have the same offering on-line as
they do in their stores (albeit the offering tends to be larger on-line than what most
companies can carry in their stores). However, because of legacy issues with pricing/shipping
and Amazon’s continual share growth, many large retailers have essentially moved to a
uniform pricing structure (same price for a SKU in-store or on-line) even as shipping fees, to
help subsidize shipping costs, have largely been competed away in most sectors. This means
that most retailers are selling the exact same product on-line as they are in the stores, but at
a much higher cost, since the retailers are generally eating the incremental shipping costs
and, for ship-from-store operations, the additional labor required to pick and pack the
widget.
Marches to its own drummer – Costco tends to have a different strategic focus for its e-
commerce business than most other retailers. Costco isn’t afraid to march to their own
drummer. After years of essentially eschewing (bonus points for SAT word!) e-commerce
given the potentially damaging effects to warehouse traffic (i.e., almost all other initiatives
by Costco were designed to enhance traffic, from the food court, to ear/eyeglass service to
gas stations), Costco really only started to embrace e-commerce as a legitimate sales channel
a few years ago. To help avoid the earnings dilutive effects of e-commerce growth that
hampers so many other retailers (and due to the late infrastructure build out that most other
retailers have already embarked on), most of the company’s earlier e-commerce efforts were
effectively drop-shipped from their vendor partners. Ironically, management estimates that
their margins were actually higher through this channel than through their boxes, as lower
labor costs (didn’t really have to touch or move the product within their network) more than
offset lower GMs on the drop-shipped goods.
August 20, 2020 11Deep Dive on Costco’s unit expansion opportunity – an underappreciated long-term driver
Product differentiation through different selling channels – In addition, even today, most of
Costco’s on-line offering is differentiated from its warehouse offering. This greatly reduces
the conundrum most other retailers have faced by trying to sell the exact same SKU on-line
and in the store, but not be able to charge for shipping due to competitive pressures.
However, there has been more overlap over the last 1-2 years as the company’s e-commerce
platform/offering has matured.
Working with Instacart/recent acquisition of Innovel – Due to its late start and need to keep
costs tight, the company does not have the delivery infrastructure of companies like Amazon
or Walmart. So it has partnered with companies like Instacart to help it provide same day
grocery delivery. Further, the company purchased Innovel in March 2020 for $1bn, to help
bolster its fast growing e-commerce business, particularly for last mile delivery of bulkier,
big-ticket items. Innovel has coverage capabilities of 100% of continental US zip codes and
offers 24- to 48-hour delivery capabilities for ~85% of households. Given Costco’s forte in
offering customers “bulk” product, we believe that Innovel can further augment its growth
rate in e-commerce. Innovel can also help Costco capture a greater portion of “white goods”
sales (e.g., refrigerators, washers, dryers) that customers may have previously passed up due
to the difficulty in taking such products out of a warehouse.
Vertical integration enables lower costs and, potentially, higher quality – Costco opened its
first, relatively small beef plant several years ago and has since continued to build out various
vertical capabilities/infrastructure. At this point, the company has several large plants
processing beef, hot dogs, cookie dough and croissants among other items. One of the
company’s biggest vertical investments (and current expense drags) is the large chicken plant
that it has built and is still ramping. The goal is to reach the ability to raise/process ~2.2mm
chickens/week (its rotisserie chicken offering arguably has a cult-like following amongst its
members). The company is also in the process of creating a produce offering. Importantly, in
our view, the more the company builds out these kinds of vertical integration capabilities,
the more efficient it becomes and the more it can control the process and quality.
A different approach to Private Label – For most retailers, private label means “entry level
product”. If a consumer can’t afford the branded product that they really want, say Tide
detergent, they may need to step down to the store brand, which will typically be lower
priced than the branded goods for most items. Even in auto parts, it’s usually the “good”
with the good, better, best offering. However, this is where Costco once again veers away
from the crowd. The company doesn’t have dozens of different private label brands (one for
women’s clothing, one for kids, one for consumables, etc.) like many other retailers. Rather,
it consolidates the vast majority of its private label offerings under the Kirkland name brand
(roughly 30% of total sales). Further, it doesn’t position Kirkland as the entry level brand in its
offerings. Rather, Costco targets developing the highest quality product that it can and then
driving the price as low as possible (the order of these two goals matters). For example,
trusted battery manufacturer Duracell makes Kirkland batteries (which sell for ~33% less per
battery than the national brand), and many people rave over its wines and vodka. The point
is that, while Kirkland is Costco’s “private label” brand, Kirkland product tends to be very
high quality and then the company targets the price point to maximum “value” to its
members. There is a reason why there are literally thousands of Kirkland products on
Amazon’s Marketplace, being hocked by other resellers.
August 20, 2020 12Deep Dive on Costco’s unit expansion opportunity – an underappreciated long-term driver
“Value” resonates across most countries/cultures; future margin
opportunity
Slightly faster unit growth rate today outside of the US – Costco has been opening
international stores at a modestly quicker pace in international markets (~4.5% CAGR) than it
has in the US (~3%) over the last decade. As we have detailed above, we believe that Costco
could potentially increase its US warehouse base by 400-500 locations or ~75%-90% from
current levels. However, today Costco only has ~240 locations outside of the US, including
~100 in less densely populated Canada. While getting enough real estate for a Costco
location can be a challenge in certain geographies, we believe that the company’s
international expansion opportunity may ultimately be even larger than what it has in the
US.
Strong sales volumes; China could be particularly lucrative – While the average warehouse
in the US generates ~$217mm in annual sales on a TTM basis, Costco’s international
locations generate ~83% of the same sales volume (~$180mm) despite smaller population
densities in many countries, including Canada. Further, Costco has talked about how some of
its biggest volume venues are overseas. In addition, we think that China could be a
particularly lucrative opportunity for the company. Costco entered China in late August 2019
with a single warehouse, but initial demand was so strong, the company had to close the
store 4 hours early on its first day for safety purposes. For context, a typical warehouse will
have ~70,000 member households, with some high volume locations getting to 100,000-
120,000 over time. However, in the initial 4 months of opening, Costco’s Shanghai location
had signed up over 200,000 members – literally double many high volume US venues. We
believe these results further support our view that “value” resonates well across the globe.
Exhibit 15: Costco International store and sales/sq. ft. growth – FY09A-FY19A
Source: Company Reports and RBC Capital Markets
Higher margins outside of the US - While unusual, Costco generates higher margins from its
International operations than it does in the US. For example, Costco’s International
operations generate EBIT margins of ~4%, while its US margins tend to be in the 2.7%-2.8%
range, whereas Walmart’s International margins were ~100bps lower than its US business
even before the dilutive impact of Flipkart. While the margin gap admittedly isn’t massive for
Costco, this is a low margin business where basis points matter, implying a notable potential
impact to profitability if the channel mix shifts towards the International operations over
time.
August 20, 2020 13Deep Dive on Costco’s unit expansion opportunity – an underappreciated long-term driver
Exhibit 16: COST and WMT – US vs. International margins
FY16 FY17 FY18 FY19 FY20
Costco US 2.7% 2.8% 2.7% 2.7% 2.8%
Costco International 4.2% 4.2% 4.3% 4.1% 4.2%
Margin gap (bps) (150) (140) (160) (140) (140)
Walmart US 6.6% 5.8% 5.4% 5.2% 5.2%
Walmart International 4.4% 4.5% 4.4% 4.0% 3.1%
Margin gap (bps) 220 130 100 120 210
Note: FY20 is actual for Walmart, estimated for Costco. Source: Company reports and RBC Capital Markets estimates
ESG efforts
The company has maintained a commitment to environmental, social and governance issues
since it first opened in 1983. From historically paying employees more than the industry
standard (and helping set them up for retirement through annual 401(k) enrollment and
company contributions) to actively trying to minimize its carbon footprint and reduce food
waste, ESG efforts appear to be a central focus of Costco’s management team. Data
compiled by RBC Capital Markets, LLC’s Sara Mahaffy, US Equity Strategist & ESG Specialist,
shows that 14% of actively managed ESG funds own COST in their portfolio, ranking it #8
among all S&P 500 Consumer Staples companies and in the 2 nd decile within the entire S&P
500 universe (and in the company of names like GIS and KO). Further, 27% of passive/quant
managed ESG funds own COST, which ranks it as #19 among Consumer Staples names in the
S&P 500 and within the 6th decile of the entire S&P 500.
August 20, 2020 14Deep Dive on Costco’s unit expansion opportunity – an underappreciated long-term driver
Exhibit 17: ESG fund ownership of S&P 500 Consumer Staples names
Top 20 S&P 500 Consumer Staples Ranked By Fundamental / Active ESG Fund Ownership as of 1Q20
Popularity in Fundamental /
Active ESG Funds: % Funds Decile Ranking Within Entire
Ticker Company Name sector Industry Own S&P 500 Universe
PG PROCTER & GAMBLE CO Consumer Staples Household Products 29% 1
PEP PEPSICO INC Consumer Staples Beverages 24% 1
CL COLGATE-PALMOLIVE CO Consumer Staples Household Products 17% 2
EL LAUDER (ESTEE) COS INC -CL A Consumer Staples Personal Products 15% 2
MDLZ MONDELEZ INTERNATIONAL INC Consumer Staples Food Products 15% 2
KMB KIMBERLY-CLARK CORP Consumer Staples Household Products 14% 2
MKC MCCORMICK & CO INC Consumer Staples Food Products 14% 2
COST COSTCO WHOLESALE CORP Consumer Staples Food & Staples Retailing 14% 2
GIS GENERAL MILLS INC Consumer Staples Food Products 13% 2
KO COCA-COLA CO Consumer Staples Beverages 13% 2
CLX CLOROX CO/DE Consumer Staples Household Products 11% 3
K KELLOGG CO Consumer Staples Food Products 10% 3
SYY SYSCO CORP Consumer Staples Food & Staples Retailing 9% 4
CPB CAMPBELL SOUP CO Consumer Staples Food Products 8% 4
KR KROGER CO Consumer Staples Food & Staples Retailing 8% 4
HSY HERSHEY CO Consumer Staples Food Products 7% 5
CHD CHURCH & DWIGHT INC Consumer Staples Household Products 7% 5
WMT WALMART INC Consumer Staples Food & Staples Retailing 6% 6
WBA WALGREENS BOOTS ALLIANCE INC Consumer Staples Food & Staples Retailing 5% 6
SJM SMUCKER (JM) CO Consumer Staples Food Products 5% 7
Top 20 S&P 500 Consumer Staples Ranked By Passive / Quant / ETF ESG Fund Ownership as of 1Q20
Popularity in Passive / Quant
/ ETF ESG Funds: % Funds Decile Ranking Within Entire
Ticker Company Name sector Industry Own S&P 500 Universe
GIS GENERAL MILLS INC Consumer Staples Food Products 55% 1
PG PROCTER & GAMBLE CO Consumer Staples Household Products 53% 1
CL COLGATE-PALMOLIVE CO Consumer Staples Household Products 53% 1
CLX CLOROX CO/DE Consumer Staples Household Products 52% 1
PEP PEPSICO INC Consumer Staples Beverages 50% 1
KMB KIMBERLY-CLARK CORP Consumer Staples Household Products 49% 1
K KELLOGG CO Consumer Staples Food Products 49% 1
MKC MCCORMICK & CO INC Consumer Staples Food Products 48% 1
KO COCA-COLA CO Consumer Staples Beverages 47% 2
CPB CAMPBELL SOUP CO Consumer Staples Food Products 41% 3
EL LAUDER (ESTEE) COS INC -CL A Consumer Staples Personal Products 40% 3
MDLZ MONDELEZ INTERNATIONAL INC Consumer Staples Food Products 38% 3
SYY SYSCO CORP Consumer Staples Food & Staples Retailing 35% 4
HSY HERSHEY CO Consumer Staples Food Products 35% 4
SJM SMUCKER (JM) CO Consumer Staples Food Products 33% 5
HRL HORMEL FOODS CORP Consumer Staples Food Products 31% 5
KR KROGER CO Consumer Staples Food & Staples Retailing 29% 6
WBA WALGREENS BOOTS ALLIANCE INC Consumer Staples Food & Staples Retailing 29% 6
COST COSTCO WHOLESALE CORP Consumer Staples Food & Staples Retailing 27% 6
CHD CHURCH & DWIGHT INC Consumer Staples Household Products 27% 6
Source: RBC US Equity Strategy
Net/net
We believe that Costco’s extreme consumer value proposition, driven by its immense buying
scale and razor thin markup process, makes Costco the ultimate rinse and repeat model.
Despite its size, our proprietary research, led by our data science team RBC Elements,
suggests that the company should be able to add another 400-500+ locations in the US over
time or 75%-90% above current levels. In addition, given the company’s relatively low base
(~240 locations, including ~100 just in Canada) we think the company’s international growth
August 20, 2020 15Deep Dive on Costco’s unit expansion opportunity – an underappreciated long-term driver
opportunity may even exceed that of the US. We believe these factors, coupled with
additional productivity enhancements (including e-commerce, vertical integration and
private label), provide Costco with one of the highest barriers to entry in all of retail and
support the company’s premium valuation.
Exhibit 18: Valuation snapshot for Costco Wholesale Corp.
Current Price $341.55 ***estimates have been calendarized for COST
COST
Assigned P/E 42.0
2020 Valuation 2021 Valuation
Historical 1-year forward P/E for S&P 500 (3 year median) 18.2 Historical 2-year forward P/E for S&P 500 (3 year median) 16.5
Historical 1-year forward P/E for COST (3 year median) 31.4 Historical 2-year forward P/E for COST (3 year median) 29.0
Historical Premium vs. Market 72% Historical Premium vs. Market 76%
Current P/E Ratio of S&P 500 on 2020 EPS Estimates 26.1 Current P/E Ratio of S&P 500 on 2021 EPS Estimates 20.6
Premium of Assigned P/E to Current Market Multiple 61% Premium of Assigned P/E to Current Market Multiple 104%
2019 EPS $8.41 RBC's 2020 EPS Estimate $8.85
2020 Estimated EPS Growth Rate (RBC Base Case) 5.3% 2021 Estimated EPS Growth Rate (RBC Base Case) 10.4%
Current P/E Based on RBC's 2020 EPS Estimate 38.6 Current P/E Based on RBC's 2021 EPS Estimate 34.9
Current PEG Ratio NA Current PEG Ratio NA
PEG Ratio using Assigned P/E NA PEG Ratio using Assigned P/E NA
Price Target: 2020 Scenario Analysis Price Target: 2021 Scenario Analysis
Base Case Upside Downside Base Case Upside Downside
2019 Sales $158,350.0 Estimated 2020 Sales $172,928.8
New Store/Other Sales Growth 0.2% 1% -1% New Store/Other Sales Growth 3.1% 5% 2%
Comp Growth 9.0% 11% 7% Comp Growth 4.3% 6% 2%
Estimated 2020 Sales $172,928.8 $177,352.0 $167,851.0 Estimated 2021 Sales $185,712.2 $191,086.3 $179,846.0
2019 Operating Margin 3.2% 2020 Operating Margin 3.2%
2020 Operating Margin 3.2% 3.4% 3.0% 2021 Operating Margin 3.2% 3.4% 3.0%
Estimated 2020 Operating Profit 5,453.1 6,030.0 5,035.5 Estimated 2021 Operating Profit 5,948.4 6,496.9 5,395.4
Interest expense/income (69.0) (69.0) (69.0) Interest expense/income (34.0) (34.0) (34.0)
Tax rate 26.9% 26.9% 26.9% Tax rate 27.0% 27.0% 27.0%
Estimated 2020 net income 3,933.4 4,354.8 3,628.3 Estimated 2021 net income 4,317.5 4,717.9 3,913.8
2019 year-end share count 443.1 2020 year-end share count 442.8
2020 Share Buyback 0.1% 1% -1% 2021 Share Buyback 0.5% 1% 0%
Estimated 2020 Share Count 442.8 440.9 447.5 Estimated 2021 Share Count 440.5 438.4 442.8
Implied 2020 EPS $8.85 $9.88 $8.11 Implied 2021 EPS $9.77 $10.76 $8.84
Assigned P/E 42.0 45.0 37.0 Assigned P/E 42.0 45.0 37.0
Implied PT from Scenario $371.80 $444.47 $299.97 Implied PT from Scenario $410.47 $484.30 $327.03
Range of Valuations 9% 30% -12% Range of Valuations 20% 42% -4%
12 Month Forward Price Target (75% 2020 & 25% 2021 Base Case Scenarios): $381
Implied Upside from Current Price 12%
12 Month Forward Upside (75% 2020 & 25% 2021 Upside Scenarios): $454
Implied Upside from Current Price: 33%
12 Month Forward Downside (75% 2020 & 25% 2021 Downside Scenarios): $307
Implied Downside from Current Price: -10%
Source: RBC Capital Markets estimates, FactSet, and Company reports. Priced as of 10:45am EST on 08/19/2020
August 20, 2020 16Deep Dive on Costco’s unit expansion opportunity – an underappreciated long-term driver
RBC Elements
Description
RBC Elements is a primary research and data science team embedded within RBC’s Global Research division. The main focus of
RBC Elements is to use scientific methods, algorithms and systems to analyze vast amounts of structured and unstructured
data, to obtain insights that are inputs into RBC’s Fundamental Global Research teams.
Objective
The team is involved in creating various machine learning and predictive modeling tools and processes, helping RBC Research
discover the information hidden in big data, and allowing the Research division to make smarter decisions and deliver
differentiated products to our clients. RBC Elements strives to augment the already available industry data with different
alternative data sources, and enhance data collection procedures to include information that is relevant.
Methods
The team is implementing different machine learning and data mining algorithms using state-of-the-art methods. Examples
include:
Machine learning techniques and algorithms, such as k-NN, Naive Bayes, SVM, Decision Forests, Clustering, Artificial Neural
Networks, and Natural Language Processing to find patterns in the past, and to predict the future.
Feature selection techniques to find what matters most in the data.
Statistical modeling and analysis, and statistical tests such as distributions, and regression/GLM.
Developing hypotheses and making inferences using large amounts of data.
August 20, 2020 17Deep Dive on Costco’s unit expansion opportunity – an underappreciated long-term driver
Costco Wholesale Corp. Scot Ciccarelli: (212) 428-6402
Quarterly Income Statement (Fiscal Year Ends August 31) RBC Capital Markets
2019A 2020E 2021E 2022E
2018A 1Q19A 2Q19A 3Q19A 4Q19A 2019A 1Q20A 2Q20A 3Q20A 4Q20E 2020E 1Q21E 2Q21E 3Q21E 4Q21E 2021E 1Q22E 2Q22E 3Q22E 4Q22E 2022E
Net Sales $ 138,434.0 $ 34,311.0 $ 34,628.0 $ 33,964.0 $ 46,448.0 $ 149,351.0 $ 36,236.0 $ 38,256.0 $ 36,451.0 $ 52,463.4 $ 163,406.4 $ 39,559.2 $ 40,822.8 $ 40,297.6 $ 55,435.3 $ 176,114.9 $ 42,378.3 $ 43,753.3 $ 43,136.3 $ 59,313.1 $ 188,581.0
Membership Fees 3,142.0 758.0 768.0 776.0 1,050.0 3,352.0 804.0 816.0 815.0 1,106.9 3,541.9 847.4 863.1 866.5 1,171.9 3,748.9 896.6 912.6 915.6 1,237.6 3,962.3
Total Revenue 141,576.0 35,069.0 35,396.0 34,740.0 47,498.0 152,703.0 37,040.0 39,072.0 37,266.0 53,570.3 166,948.3 40,406.6 41,685.9 41,164.1 56,607.2 179,863.8 43,275.0 44,665.9 44,051.8 60,550.7 192,543.4
Merchandise Costs 123,152.0 30,580.0 30,720.0 30,233.0 41,310.0 132,843.0 32,233.0 34,056.0 32,249.0 46,516.2 145,054.2 35,170.8 36,338.5 35,684.1 49,153.2 156,346.5 37,667.5 38,936.2 38,187.4 52,577.4 167,368.4
Gross Profit 18,424.0 4,489.0 4,676.0 4,507.0 6,188.0 19,860.0 4,807.0 5,016.0 5,017.0 7,054.1 21,894.1 5,235.8 5,347.4 5,480.0 7,454.0 23,517.3 5,607.5 5,729.7 5,864.5 7,973.3 25,174.9
SG&A 13,876.0 3,475.0 3,464.0 3,371.0 4,561.0 14,871.0 3,732.0 3,743.0 3,830.0 5,251.2 16,556.2 4,051.0 3,993.0 4,103.0 5,538.2 17,685.2 4,325.6 4,265.0 4,377.6 5,905.8 18,874.1
Pre-opening Expense 68.0 22.0 9.0 14.0 41.0 86.0 14.0 7.0 8.0 35.0 64.0 20.0 13.0 13.0 42.0 88.0 21.0 15.0 14.0 45.0 95.0
Operating Income 4,480.0 992.0 1,203.0 1,122.0 1,586.0 4,903.0 1,061.0 1,266.0 1,179.0 1,767.9 5,273.9 1,164.8 1,341.4 1,364.0 1,873.8 5,744.1 1,260.9 1,449.6 1,472.8 2,022.4 6,205.8
Interest Exp, net (159.0) (36.0) (34.0) (35.0) (45.0) (150.0) (38.0) (34.0) (37.0) (50.0) (159.0) (40.0) (41.0) (41.0) (52.0) (174.0) (39.0) (41.0) (42.0) (51.0) (173.0)
Interest Income and other, net 121.0 22.0 46.0 36.0 74.0 178.0 35.0 45.0 21.0 45.0 146.0 37.0 46.0 43.0 56.0 182.0 39.0 47.0 48.0 62.0 196.0
Pretax Income 4,442.0 978.0 1,215.0 1,123.0 1,615.0 4,931.0 1,058.0 1,277.0 1,163.0 1,762.9 5,260.9 1,161.8 1,346.4 1,366.0 1,877.8 5,752.1 1,260.9 1,455.6 1,478.8 2,033.4 6,228.8
Taxes $ 1,378.00 $ 254.8 $ 314.0 $ 278.6 $ 410.0 $ 1,257.35 $ 279.0 $ 330.0 $ 311.0 $ 476.0 $ 1,395.97 $ 313.7 $ 363.5 $ 368.8 $ 507.0 $ 1,553.06 $ 340.4 $ 393.0 $ 399.3 $ 549.0 $ 1,681.79
Net Income to Costco 3,019.0 713.3 889.0 834.4 1,192.0 3,628.7 767.0 931.0 838.0 1,277.9 3,813.9 836.1 967.9 987.2 1,361.8 4,153.0 908.5 1,047.6 1,070.6 1,474.4 4,501.1
EPS $ 6.84 $ 1.61 $ 2.01 $ 1.89 $ 2.69 $ 8.20 $ 1.73 $ 2.10 $ 1.89 $ 2.88 $ 8.60 $ 1.89 $ 2.19 $ 2.24 $ 3.09 $ 9.40 $ 2.06 $ 2.38 $ 2.44 $ 3.36 $ 10.25
Diluted Shares 441.6 442.7 442.3 442.6 442.4 442.5 443.7 443.7 443.9 443.0 443.6 442.5 442.0 441.5 441.0 441.7 440.1 439.6 439.1 438.6 439.3
U.S. Comp (incl. Fuel) 9.4% 11.0% 7.4% 7.0% 6.2% 7.8% 4.7% 9.1% 5.9% 10.9% 8.0% 7.9% 5.3% 8.7% 4.7% 6.5% 5.5% 5.5% 5.5% 5.5% 5.5%
Int'l (incl. FX) 9.8% 3.2% 0.2% 1.5% 2.3% 1.8% 3.0% 3.1% 1.7% 13.7% 6.2% 5.3% 1.5% 8.0% 1.7% 3.9% 5.0% 5.3% 4.8% 5.0% 5.0%
Overall Comp 9.5% 8.8% 5.4% 5.5% 5.1% 6.1% 4.3% 8.9% 4.8% 11.6% 7.8% 7.2% 8.5% 8.5% 3.9% 5.8% 5.4% 5.5% 5.3% 5.4% 5.4%
Quarterly 2018A 1Q19A 2Q19A 3Q19A 4Q19A 2019A 1Q20A 2Q20A 3Q20A 4Q20E 2020E 1Q21E 2Q21E 3Q21E 4Q21E 2021E 1Q22E 2Q22E 3Q22E 4Q22E 2022E
Total Sales 100.0% 100.0% 100.0% 100.0% 100.0% 100.0% 100.0% 100.0% 100.0% 100.0% 100.0% 100.0% 100.0% 100.0% 100.0% 100.0% 100.0% 100.0% 100.0% 100.0% 100.0%
Merchandise Costs 87.0% 87.2% 86.8% 87.0% 87.0% 87.0% 87.0% 87.2% 86.5% 86.8% 86.9% 87.0% 87.2% 86.7% 86.8% 86.9% 87.0% 87.2% 86.7% 86.8% 86.9%
GM (incl. membership fees) 13.0% 12.8% 13.2% 13.0% 13.0% 13.0% 13.0% 12.8% 13.5% 13.2% 13.1% 13.0% 12.8% 13.3% 13.2% 13.1% 13.0% 12.8% 13.3% 13.2% 13.1%
SG&A 9.8% 9.9% 9.8% 9.7% 9.6% 9.7% 10.1% 9.6% 10.3% 9.8% 9.9% 10.0% 9.6% 10.0% 9.8% 9.8% 10.0% 9.5% 9.9% 9.8% 9.8%
Pre-opening Expense 0.0% 0.1% 0.0% 0.0% 0.1% 0.1% 0.0% 0.0% 0.0% 0.1% 0.0% 0.0% 0.0% 0.0% 0.1% 0.0% 0.0% 0.0% 0.0% 0.1% 0.0%
Operating Margin 3.2% 2.8% 3.4% 3.2% 3.3% 3.2% 2.9% 3.2% 3.2% 3.3% 3.2% 2.9% 3.2% 3.3% 3.3% 3.2% 2.9% 3.2% 3.3% 3.3% 3.2%
Interest Exp, net 0.0% 0.0% 0.0% 0.0% 0.1% 0.0% 0.0% 0.0% 0.0% 0.0% 0.0% 0.0% 0.0% 0.0% 0.0% 0.0% 0.0% 0.0% 0.0% 0.0% 0.0%
Pretax Margin 3.1% 2.8% 3.4% 3.2% 3.4% 3.2% 2.9% 3.3% 3.1% 3.3% 3.2% 2.9% 3.2% 3.3% 3.3% 3.2% 2.9% 3.3% 3.4% 3.4% 3.2%
Tax Rate 31.0% 26.0% 25.8% 24.8% 25.4% 25.5% 26.4% 25.8% 26.7% 27.0% 26.5% 27.0% 27.0% 27.0% 27.0% 27.0% 27.0% 27.0% 27.0% 27.0% 27.0%
Net Margin 2.1% 2.0% 2.5% 2.4% 2.5% 2.4% 2.1% 2.4% 2.2% 2.4% 2.3% 2.1% 2.3% 2.4% 2.4% 2.3% 2.1% 2.3% 2.4% 2.4% 2.3%
Growth by Category
Total Sales 9.7% 10.2% 7.3% 7.4% 7.0% 7.9% 5.6% 10.4% 7.3% 12.8% 9.3% 9.1% 6.7% 10.5% 5.7% 7.7% 7.1% 7.1% 7.0% 7.0% 7.0%
Gross Profit 7.8% 7.1% 9.7% 6.5% 7.8% 7.8% 7.1% 7.3% 11.3% 14.0% 10.2% 8.9% 6.6% 9.2% 5.7% 7.4% 7.1% 7.1% 7.0% 7.0% 7.0%
SG&A 7.2% 7.8% 7.1% 6.8% 7.0% 7.2% 7.4% 8.1% 13.6% 15.1% 11.3% 8.5% 6.7% 7.1% 5.5% 6.8% 6.8% 6.8% 6.7% 6.6% 6.7%
Operating Profit 10.3% 4.3% 18.4% 5.2% 9.7% 9.4% 7.0% 5.2% 5.1% 11.5% 7.6% 9.8% 6.0% 15.7% 6.0% 8.9% 8.2% 8.1% 8.0% 7.9% 8.0%
Net Income 17.7% 19.1% 41.8% 11.3% 14.3% 20.2% 7.5% 4.7% 0.4% 7.2% 5.1% 9.0% 4.0% 17.8% 6.6% 8.9% 8.7% 8.2% 8.4% 8.3% 8.4%
EPS 17.4% 18.6% 41.5% 11.0% 14.3% 20.0% 7.3% 4.4% 0.2% 7.1% 4.9% 9.3% 4.4% 18.4% 7.1% 9.3% 9.2% 8.8% 9.0% 8.9% 9.0%
(All numbers in millions, except per share data)
Source: RBC Capital Markets estimates and Company reports
August 20, 2020 18Deep Dive on Costco’s unit expansion opportunity – an underappreciated long-term driver Companies mentioned Costco Wholesale Corporation (NASDAQ: COST US; $340.90; Outperform) Required disclosures Conflicts disclosures The analyst(s) responsible for preparing this research report received compensation that is based upon various factors, including total revenues of the member companies of RBC Capital Markets and its affiliates, a portion of which are or have been generated by investment banking activities of the member companies of RBC Capital Markets and its affiliates. Please note that current conflicts disclosures may differ from those as of the publication date on, and as set forth in, this report. To access current conflicts disclosures, clients should refer to https://www.rbccm.com/GLDisclosure/PublicWeb/ DisclosureLookup.aspx?entityId=1 or send a request to RBC CM Research Publishing, P.O. Box 50, 200 Bay Street, Royal Bank Plaza, 29th Floor, South Tower, Toronto, Ontario M5J 2W7. RBC Capital Markets, LLC makes a market in the securities of Costco Wholesale Corporation. A member company of RBC Capital Markets or one of its affiliates received compensation for products or services other than investment banking services from Costco Wholesale Corporation during the past 12 months. During this time, a member company of RBC Capital Markets or one of its affiliates provided non-securities services to Costco Wholesale Corporation. RBC Capital Markets is currently providing Costco Wholesale Corporation with non-securities services. Explanation of RBC Capital Markets Equity rating system An analyst's 'sector' is the universe of companies for which the analyst provides research coverage. Accordingly, the rating assigned to a particular stock represents solely the analyst's view of how that stock will perform over the next 12 months relative to the analyst's sector average. Ratings Outperform (O): Expected to materially outperform sector average over 12 months. Sector Perform (SP): Returns expected to be in line with sector average over 12 months. Underperform (U): Returns expected to be materially below sector average over 12 months. Restricted (R): RBC policy precludes certain types of communications, including an investment recommendation, when RBC is acting as an advisor in certain merger or other strategic transactions and in certain other circumstances. Not Rated (NR): The rating, price targets and estimates have been removed due to applicable legal, regulatory or policy constraints which may include when RBC Capital Markets is acting in an advisory capacity involving the company. As of March 31, 2020, RBC Capital Markets discontinued its Top Pick rating. Top Pick rated securities represented an analysts best idea in the sector; expected to provide significant absolute returns over 12 months with a favorable risk-reward ratio. Top Pick rated securities have been reassigned to our Outperform rated securities category, which are securities expected to materially outperform sector average over 12 months. Risk Rating The Speculative risk rating reflects a security's lower level of financial or operating predictability, illiquid share trading volumes, high balance sheet leverage, or limited operating history that result in a higher expectation of financial and/or stock price volatility. August 20, 2020 19
Deep Dive on Costco’s unit expansion opportunity – an underappreciated long-term driver

Distribution of ratings
For the purpose of ratings distributions, regulatory rules require member firms to assign ratings to one of three rating categories -
Buy, Hold/Neutral, or Sell - regardless of a firm's own rating categories. Although RBC Capital Markets' ratings of Outperform (O),
Sector Perform (SP), and Underperform (U) most closely correspond to Buy, Hold/Neutral and Sell, respectively, the meanings are
not the same because our ratings are determined on a relative basis.
                                                                                        Distribution of ratings
                                                                                 RBC Capital Markets, Equity Research
                                                                                                As of 30-Jun-2020
                                                                                                                                                          Investment Banking
                                                                                                                                                           Serv./Past 12 Mos.
                    Rating                                                                   Count                       Percent                                    Count                      Percent
                    BUY [Outperform]                                                          776                           51.63                                      238                      30.67
                    HOLD [Sector Perform]                                                     635                           42.25                                      130                      20.47
                    SELL [Underperform]                                                        92                            6.12                                       12                      13.04

                          Rating and price target history for: Costco Wholesale Corporation, COST US as of 18-Aug-2020 (in USD)
    03-Aug-2017       06-Oct-2017       30-Nov-2017        15-Dec-2017       05-Jan-2018        08-Mar-2018      29-May-2018        01-Jun-2018        09-Aug-2018        04-Sep-2018       07-Sep-2018        05-Oct-2018
       Rtg:O             Rtg:O             Rtg:O              Rtg:O             Rtg:O              Rtg:O             Rtg:O             Rtg:O              Rtg:O              Rtg:O             Rtg:O              Rtg:O
   Target: 184.00    Target: 190.00    Target: 191.00     Target: 202.00    Target: 209.00     Target: 205.00    Target: 213.00    Target: 216.00     Target: 246.00     Target: 253.00    Target: 255.00     Target: 253.00

                                                                                                                                                                                                                          350

                                                                                                                                                                                                                          300

                                                                                                                                                                                                                          250

                                                                                                                                                                                                                          200

                                                                                                                                                                                                                          150

                                                                                                                                                                                                                         100
  Q2            Q3             2018              Q1               Q2               Q3             2019              Q1               Q2              Q3                2020               Q1             Q2             Q3
    06-Dec-2018       14-Dec-2018       09-Jan-2019        08-Mar-2019       05-Apr-2019        08-Aug-2019       05-Sep-2019       04-Oct-2019        13-Dec-2019        24-Feb-2020       06-Mar-2020        18-Mar-2020
       Rtg:O             Rtg:O             Rtg:O              Rtg:O             Rtg:O              Rtg:O             Rtg:O             Rtg:O              Rtg:O              Rtg:O             Rtg:O              Rtg:O
   Target: 254.00    Target: 247.00    Target: 235.00     Target: 250.00    Target: 274.00     Target: 299.00    Target: 321.00    Target: 329.00     Target: 334.00     Target: 343.00    Target: 350.00     Target: 337.00
    07-May-2020       29-May-2020       05-Aug-2020
       Rtg:O             Rtg:O             Rtg:O
   Target: 332.00    Target: 348.00    Target: 381.00

    Legend:
    TP: Top Pick; O: Outperform; SP: Sector Perform; U: Underperform; R: Restricted; I: Initiation of Research Coverage; D: Discontinuation of Research Coverage;
    NR: Not Rated; NA: Not Available; RL: Recommended List - RL: On: Refers to date a security was placed on a recommended list, while RL Off: Refers to date
    a security was removed from a recommended list; Rtg: Rating.
                                                                                                                                                                                                     Created by: BlueMatrix

References to a Recommended List in the recommendation history chart may include one or more recommended lists or model
portfolios maintained by RBC Wealth Management or one of its affiliates. RBC Wealth Management recommended lists include
the Guided Portfolio: Prime Income (RL 6), the Guided Portfolio: Dividend Growth (RL 8), the Guided Portfolio: ADR (RL 10),
and the Guided Portfolio: All Cap Growth (RL 12). RBC Capital Markets recommended lists include the Strategy Focus List and
the Fundamental Equity Weightings (FEW) portfolios. The abbreviation 'RL On' means the date a security was placed on a
Recommended List. The abbreviation 'RL Off' means the date a security was removed from a Recommended List.
Equity valuation and risks
For valuation methods used to determine, and risks that may impede achievement of, price targets for covered companies, please
see the most recent company-specific research report at https://www.rbcinsightresearch.com or send a request to RBC Capital
Markets Research Publishing, P.O. Box 50, 200 Bay Street, Royal Bank Plaza, 29th Floor, South Tower, Toronto, Ontario M5J 2W7.
Costco Wholesale Corporation
Valuation
August 20, 2020                                                                                                                                                                                                                 20
Deep Dive on Costco’s unit expansion opportunity – an underappreciated long-term driver Our 12-month forward price target of $381 is derived by applying a 42x P/E to a blend of our calendarized 2020/2021 EPS estimates of $8.85/$9.77. Our target multiple is based on our proprietary CVM (Ciccarelli’s Valuation Matrix) blended valuation methodology, which uses the stock’s relative valuation to both the market and its own historical valuation range. All of our valuation work is tied to our CVM model. This multiple is slightly below the stock’s historical relative valuation (premium of 65% vs. historical 71%). Our price target and implied return support our Outperform rating. Risks to rating and price target • Regional/geographic concentration – Costco’s performance is highly dependent on the health of its US and Canadian operations, which together accounted for ~90% of net sales in FY19. Furthermore, within the US, sales are highly dependent on the California market, which alone accounted for ~30% of US net sales in FY19. As such, declines in US (specifically California) or Canadian performance (i.e., declines in comparable sales, negative operating expense trends, labor disruptions, etc.) could materially affect the company’s overall business health and financial results. • E-commerce cannibalization threats – Costco operates in a highly competitive industry, directly competing with other supercenters, department and specialty stores, gasoline stations, and internet retailers for customers’ wallet share. Specifically, intensifying competition from e-retailers such as Amazon, Jet.com, Boxed.com, etc. poses a risk to the traditional brick-and- mortar retail model and may increasingly impact retail traffic flow to Costco’s clubs over time. • Commodity price deflation and FX risks – Historically, the company has opted to absorb short-term changes in commodity costs instead of passing them on to customers (as seen with its rotisserie chicken), thereby exposing the company’s profitability to commodity price changes. Additionally, because the company operates globally, it is exposed to foreign exchange rate volatility. • Economic deterioration – The general health of the economy and the consumer could pressure Costco’s results. While more than half of the company’s sales stem from grocery items, it offers a wide assortment of more discretionary/big-ticket items as well. As such, we suspect that changes in consumer sentiment, particularly for those of higher-earning households (where Costco skews toward $92,000+/year), could affect the company’s performance. • Low-margin structure is sensitive to modest changes in costs – The goal of the model is to grow sales and leverage SG&A given a very low GM structure. That said, even modest changes to things that it cannot control, such as healthcare and utilities costs, could have a large impact on margins. Conflicts policy RBC Capital Markets Policy for Managing Conflicts of Interest in Relation to Investment Research is available from us on request. To access our current policy, clients should refer to https://www.rbccm.com/global/file-414164.pdf or send a request to RBC Capital Markets Research Publishing, P.O. Box 50, 200 Bay Street, Royal Bank Plaza, 29th Floor, South Tower, Toronto, Ontario M5J 2W7. We reserve the right to amend or supplement this policy at any time. Dissemination of research and short-term trade ideas RBC Capital Markets endeavors to make all reasonable efforts to provide research simultaneously to all eligible clients, having regard to local time zones in overseas jurisdictions. RBC Capital Markets' equity research is posted to our proprietary website to ensure eligible clients receive coverage initiations and changes in ratings, targets and opinions in a timely manner. Additional distribution may be done by the sales personnel via email, fax, or other electronic means, or regular mail. Clients may also receive our research via third party vendors. RBC Capital Markets also provides eligible clients with access to SPARC on the Firms proprietary INSIGHT website, via email and via third-party vendors. SPARC contains market color and commentary regarding subject companies on which the Firm currently provides equity research coverage. Research Analysts may, from time to time, include short-term trade ideas in research reports and / or in SPARC. A short-term trade idea offers a short-term view on how a security may trade, based on market and trading events, and the resulting trading opportunity that may be available. A short-term trade idea may differ from the price targets and recommendations in our published research reports reflecting the research analyst's views of the longer-term (one year) prospects of the subject company, as a result of the differing time horizons, methodologies and/or other factors. Thus, it is possible that a subject company's common equity that is considered a long-term 'Sector Perform' or even an 'Underperform' might present a short-term buying opportunity as a result of temporary selling pressure in the market; conversely, a subject company's common equity rated a long-term 'Outperform' could be considered susceptible to a short-term downward price correction. Short-term trade ideas are not ratings, nor are they part of any ratings system, and the firm generally does not intend, nor undertakes any obligation, to maintain or update short-term trade ideas. Short-term trade ideas may not be suitable for all investors and have not been tailored to individual investor circumstances and objectives, and August 20, 2020 21
You can also read